Embed Size (px)
Citation preview

Geotechnical Engineering for Infrastructure and Development
92
Russo, G., Viggiani, C. & Viggiani, G.M.B. 2012. Geotechnical design and construction issues for Lines 1 and 6 of Naples under-ground. Geomechanik und Tunnelbau 5(3), 300-311. Sanger, F.J. & Sayles, F.H. 1979. Thermal and rheological compu-tations for artificially frozen ground construction. Engineering Geology 13, 311-337. Sayles, F.H. 1968. Creep of Frozen Sands. U.S. Army Cold Re-gions Research and Engineering Laboratory Technical Report 190. Schulson, E.M. & Duval, P. 2009. Creep and fracture of ice. Cambridge University Press, UK Sres, A. 2009. Theoretische und experimentelle Untersuchungen zur kunstlichen Bodenvereisung im stromenden Grundwasser. PhD thesis, ETH, Zurich, Switzerland, Dissertation No. 18378 Stefan, J. 1891. Ann. Phys. Chemie (Wiedemannsche Annalen) 42, 269–286 Tatsuoka, F., Santucci de Magistris, F., Hayano, K., Momoya, Y. & Koseki, J. 2000. Some new aspect of time effects on the stress-strain behavior of stiff geomaterials. Proc. 2nd IS on Hard Soil Soft Rock, Napoli, Evangelista and Picarelli Eds., Balkema, Rotterdam, The Netherlands, Vol. II, 1285-1371 van Genuchten, M.T. 1980. A closed-form equation for predicting the hydraulic conductivity of unsaturated soils. Soil Sci. Soc. Am. J. 44, 892–898. Viggiani, G.M.B. & de Sanctis, L. 2009. Geotechnical aspects of underground railway construction in the urban environment: the
examples of Roma and Napoli. Engineering Geology Special Publication 22(1), 215-240 Viggiani, C. 2000. Aspetti geotecnici e scelte di progetto. La Metropolitana di Napoli – nuovi spazi per la mobilità e per la cultura. Electa, Napoli, 145-153 Von Moos, M. 2001. Untersuchungen über das visko-elastiche Verhalten von Schnee auf der Grundlage von triaxialen Kriechversuchen. Ph.D. Dissertation, Institute for Geotechnical Engineering, Swiss Federal Institute of Technology, Zürich, Swit-zerland. Von Moos, M., Bartelt, P., Zweidler, A. & Bleiker, E. 2003. Triax-ial tests on snow at low strain rate. Part I. Experimental device. Journal of Glaciology 49(164), 81-90. Yamamoto, Y. & Springman, S.M. 2014. Axial compression stress path tests on artificial frozen soil samples in a triaxial device at temperatures just below 0° C. Canadian Geotechnical Journal 51(10), 1178-1195. Yu, Z., Huang, H., Wang, R., Xu, L. & Li, W. 2005. Application of the Artificially Ground Freezing Method to Shanghai Metro Engineering. Journal of Glaciology and Geocryology 27(4), 550-556. Zhou, M.M. & Meschke, G. 2013. A three-phase thermo-hydro-mechanical finite element model for freezing soils. Int. J. Numer. Anal. Meth. Geomech. 37, 3173–3193 Zienkiewicz, O.C. & Taylor, R.L. 2000. The finite element method. Butterworth-Heinemann.
Invited Lecture Papers

95
Proceedings of the XVI ECSMGEGeotechnical Engineering for Infrastructure and DevelopmentISBN 978-0-7277-6067-8
© The authors and ICE Publishing: All rights reserved, 2015doi:10.1680/ecsmge.60678
Ground improvement versus hybrid foundation and deep foundation: three case histories of European
significance Amélioration du sol contre fondation hybride et fondation profonde:
trois cas d’importance européenne D. Adam*1
1 Institute of Geotechnics, Vienna University of Technology, Vienna, Austria * Corresponding Author
ABSTRACT The focus of this invited paper is on the comparison of different foundation concepts for three case histories of European sig-nificance. The stadium in the Austrian city of Klagenfurt was designed and built for EURO 2008 (Austria and Switzerland) in slightly con-solidated soft lacustrine clays. The shallow foundation rests on floating stone columns installed using the vibro replacement technique al-lowing controlled, large, time-dependent settlements. For the Combined Cycle Power Plant Malženice near Bohunice (Slovakia) a hybrid foundation concept was executed in collapsible aeolian silt deposits (loess). The ground was initially improved by the vibro replacement technique and the final cementation of the stone columns produced deep foundation elements. The new spectacular cable-stayed bridge over the Sava River is the new landmark of Belgrade (Serbia). The 200 m tall pylon of the 965 m long bridge rests on a closed box founda-tion made of a clasping diaphragm wall with large-diameter bored piles inside. Thus, the highly concentrated loads are transferred into the over-consolidated marls at depth. The different foundation concepts are compared and discussed. It is illustrated that all the concepts are justified considering the ground conditions, structural and serviceability requirements of the buildings, and economical factors (time and cost).
RÉSUMÉ L’objectif de cet article est de comparer trois concepts de fondations pour d’importants projets européens. Le stade de la ville autrichienne de Klagenfurt a été conçu et construit sur des argiles molles légèrement consolidées pour l'EURO 2008 (Autriche et Suisse). La fondation superficielle repose sur des colonnes ballastées flottantes installées avec la technique de vibro remplacement permettant le contrôle des tassements avec le temps. Pour la centrale à cycle combiné de Malženice près de Bohunice (Slovaquie) un concept de fonda-tion hybride a été exécuté dans des dépôts de limon éoliens sensibles (loess). Le sol a été initialement amélioré par la technique de vibro remplacement et la cimentation finale des colonnes ballastées a produit des éléments de fondation profonde. Le nouveau spectaculaire pont à haubans sur la rivière Sava est le nouveau point de repère de Belgrade (Serbie). Le pylône de 200 m de haut du long pont de 965 m de longueur repose sur une “boîte” fermée composée de voiles blindés et des pieux forés de grand diamètre. Ainsi, les charges fortement con-centrées sont transférées directement dans les profondes marnes sur- consolidées. Les différents concepts de base sont comparés et discutés. Il est illustré que tous les concepts sont justifiés compte tenu des conditions du sol, exigences structurelles et de fonctionnement des bâti-ments, et les facteurs économiques (temps et coût).
1 EURO 2008 STADIUM KLAGENFURT (AUSTRIA) GROUND IMPROVEMENT CONCEPT
1.1 Introduction
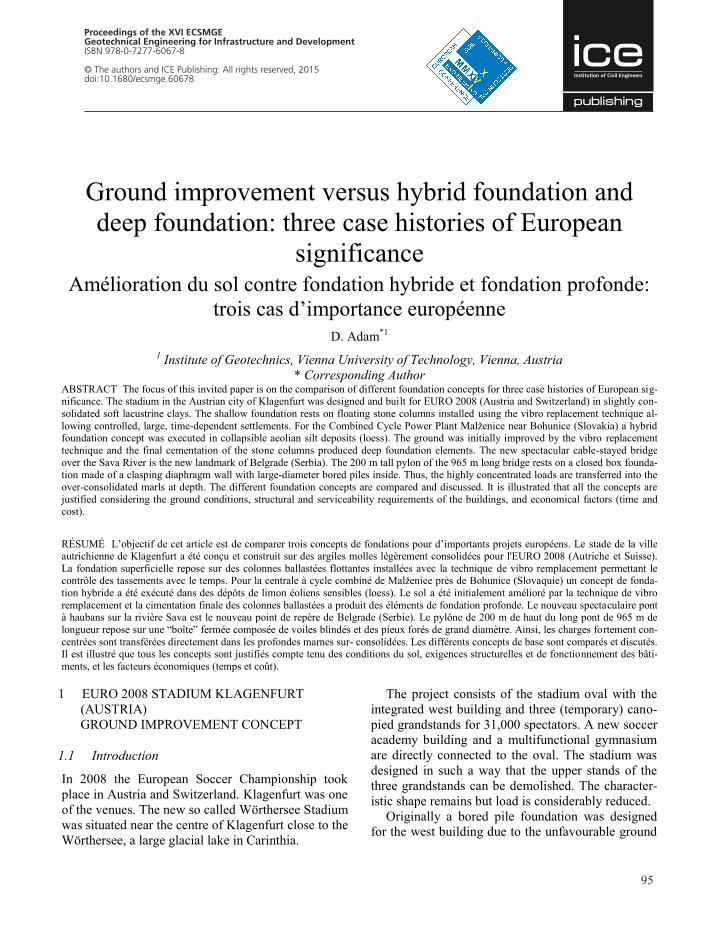
In 2008 the European Soccer Championship took place in Austria and Switzerland. Klagenfurt was one of the venues. The new so called Wörthersee Stadium was situated near the centre of Klagenfurt close to the Wörthersee, a large glacial lake in Carinthia.
The project consists of the stadium oval with the integrated west building and three (temporary) cano-pied grandstands for 31,000 spectators. A new soccer academy building and a multifunctional gymnasium are directly connected to the oval. The stadium was designed in such a way that the upper stands of the three grandstands can be demolished. The character-istic shape remains but load is considerably reduced.
Originally a bored pile foundation was designed for the west building due to the unfavourable ground
95
Proceedings of the XVI ECSMGEGeotechnical Engineering for Infrastructure and DevelopmentISBN 978-0-7277-6067-8
© The authors and ICE Publishing: All rights reserved, 2015doi:10.1680/ecsmge.60678
Ground improvement versus hybrid foundation and deep foundation: three case histories of European
significance Amélioration du sol contre fondation hybride et fondation profonde:
trois cas d’importance européenne D. Adam*1
1 Institute of Geotechnics, Vienna University of Technology, Vienna, Austria * Corresponding Author
ABSTRACT The focus of this invited paper is on the comparison of different foundation concepts for three case histories of European sig-nificance. The stadium in the Austrian city of Klagenfurt was designed and built for EURO 2008 (Austria and Switzerland) in slightly con-solidated soft lacustrine clays. The shallow foundation rests on floating stone columns installed using the vibro replacement technique al-lowing controlled, large, time-dependent settlements. For the Combined Cycle Power Plant Malženice near Bohunice (Slovakia) a hybrid foundation concept was executed in collapsible aeolian silt deposits (loess). The ground was initially improved by the vibro replacement technique and the final cementation of the stone columns produced deep foundation elements. The new spectacular cable-stayed bridge over the Sava River is the new landmark of Belgrade (Serbia). The 200 m tall pylon of the 965 m long bridge rests on a closed box founda-tion made of a clasping diaphragm wall with large-diameter bored piles inside. Thus, the highly concentrated loads are transferred into the over-consolidated marls at depth. The different foundation concepts are compared and discussed. It is illustrated that all the concepts are justified considering the ground conditions, structural and serviceability requirements of the buildings, and economical factors (time and cost).
RÉSUMÉ L’objectif de cet article est de comparer trois concepts de fondations pour d’importants projets européens. Le stade de la ville autrichienne de Klagenfurt a été conçu et construit sur des argiles molles légèrement consolidées pour l'EURO 2008 (Autriche et Suisse). La fondation superficielle repose sur des colonnes ballastées flottantes installées avec la technique de vibro remplacement permettant le contrôle des tassements avec le temps. Pour la centrale à cycle combiné de Malženice près de Bohunice (Slovaquie) un concept de fonda-tion hybride a été exécuté dans des dépôts de limon éoliens sensibles (loess). Le sol a été initialement amélioré par la technique de vibro remplacement et la cimentation finale des colonnes ballastées a produit des éléments de fondation profonde. Le nouveau spectaculaire pont à haubans sur la rivière Sava est le nouveau point de repère de Belgrade (Serbie). Le pylône de 200 m de haut du long pont de 965 m de longueur repose sur une “boîte” fermée composée de voiles blindés et des pieux forés de grand diamètre. Ainsi, les charges fortement con-centrées sont transférées directement dans les profondes marnes sur- consolidées. Les différents concepts de base sont comparés et discutés. Il est illustré que tous les concepts sont justifiés compte tenu des conditions du sol, exigences structurelles et de fonctionnement des bâti-ments, et les facteurs économiques (temps et coût).
1 EURO 2008 STADIUM KLAGENFURT (AUSTRIA) GROUND IMPROVEMENT CONCEPT
1.1 Introduction
In 2008 the European Soccer Championship took place in Austria and Switzerland. Klagenfurt was one of the venues. The new so called Wörthersee Stadium was situated near the centre of Klagenfurt close to the Wörthersee, a large glacial lake in Carinthia.
The project consists of the stadium oval with the integrated west building and three (temporary) cano-pied grandstands for 31,000 spectators. A new soccer academy building and a multifunctional gymnasium are directly connected to the oval. The stadium was designed in such a way that the upper stands of the three grandstands can be demolished. The character-istic shape remains but load is considerably reduced.
Originally a bored pile foundation was designed for the west building due to the unfavourable ground
Geotechnical Engineering for Infrastructure and Development
96
conditions. An alternative shallow floating raft foun-dation on stone columns using the vibro replacement technique was actually installed. For the foundation of the girder and column structures of the three grandstands, the soccer academy building and the multifunctional gymnasium, as well as the ground beneath the highly loaded sections of the access ramp on the south west side of the stadium the ground was improved by stone columns. Due to the unfavourable ground conditions settlements of the order of a max-imum of 20 cm were predicted so that the defor-mation compatibility of the particular structures had to be carefully taken into consideration.
Figure 1. EURO 2008 Stadium Klagenfurt.
1.2 Ground conditions
Prior to construction ground exploration and soil in-vestigation was performed in two phases. Rotational core drillings and heavy dynamic probing (DPH) and moreover, seismic investigations to determine the in-terface between soft soil and bed rock revealed the following soil structure on the site of the stadium
(Ingenieurgemeinschaft Garber & Dalmatiner Zi-vilingenieure 2005a,b and Bautechnische Versuchs- und Forschungsanstalt Salzburg 2006):
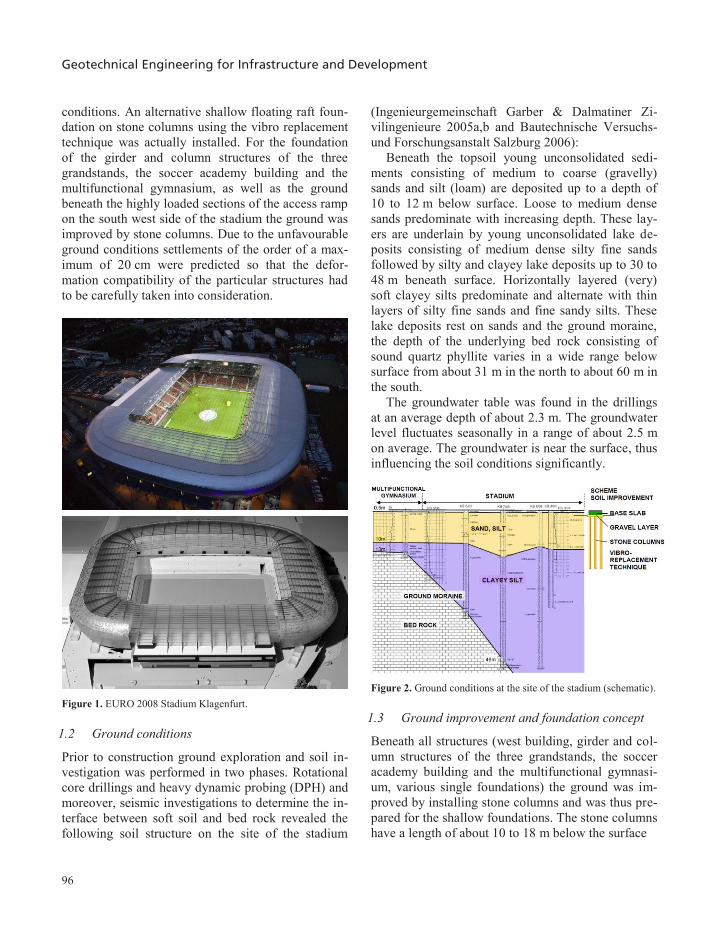
Beneath the topsoil young unconsolidated sedi-ments consisting of medium to coarse (gravelly) sands and silt (loam) are deposited up to a depth of 10 to 12 m below surface. Loose to medium dense sands predominate with increasing depth. These lay-ers are underlain by young unconsolidated lake de-posits consisting of medium dense silty fine sands followed by silty and clayey lake deposits up to 30 to 48 m beneath surface. Horizontally layered (very) soft clayey silts predominate and alternate with thin layers of silty fine sands and fine sandy silts. These lake deposits rest on sands and the ground moraine, the depth of the underlying bed rock consisting of sound quartz phyllite varies in a wide range below surface from about 31 m in the north to about 60 m in the south.
The groundwater table was found in the drillings at an average depth of about 2.3 m. The groundwater level fluctuates seasonally in a range of about 2.5 m on average. The groundwater is near the surface, thus influencing the soil conditions significantly.
Figure 2. Ground conditions at the site of the stadium (schematic).
1.3 Ground improvement and foundation concept
Beneath all structures (west building, girder and col-umn structures of the three grandstands, the soccer academy building and the multifunctional gymnasi-um, various single foundations) the ground was im-proved by installing stone columns and was thus pre-pared for the shallow foundations. The stone columns have a length of about 10 to 18 m below the surface
SOCCER ACADEMY BUILDING
GRANDSTAND NORTH
GRANDSTAND SOUTH
ACCESS RAMP
TRANSFORMER ROOM
EX1
EX2
+ MULTIFUNCTIONAL GYMNASIUM
EXTENSOMETER MEASUREMENTS
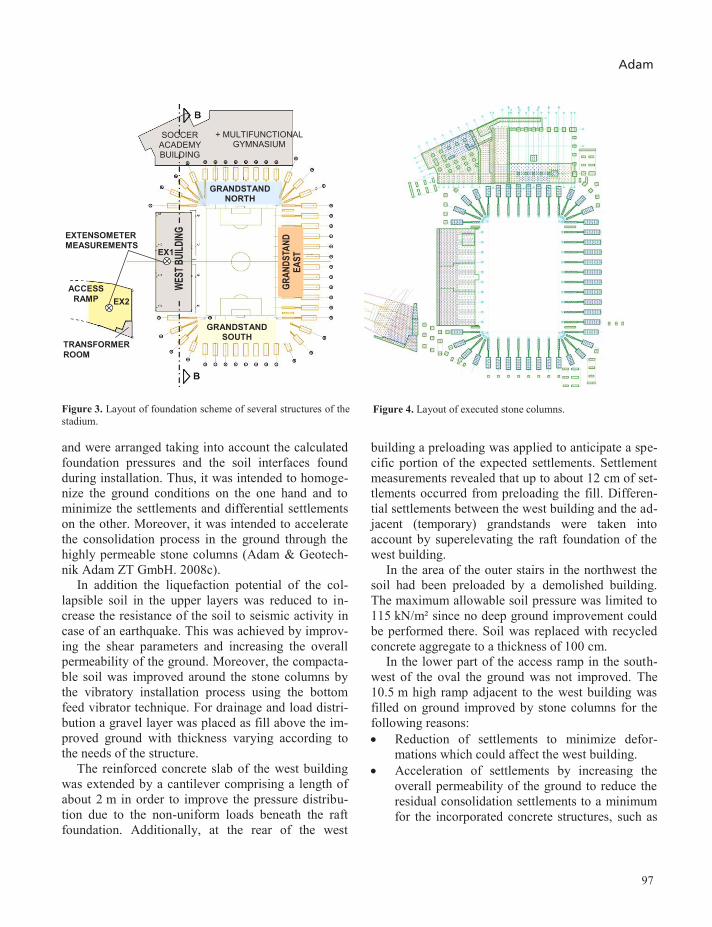
Figure 3. Layout of foundation scheme of several structures of the stadium.
Figure 4. Layout of executed stone columns.
and were arranged taking into account the calculated foundation pressures and the soil interfaces found during installation. Thus, it was intended to homoge-nize the ground conditions on the one hand and to minimize the settlements and differential settlements on the other. Moreover, it was intended to accelerate the consolidation process in the ground through the highly permeable stone columns (Adam & Geotech-nik Adam ZT GmbH. 2008c).
In addition the liquefaction potential of the col-lapsible soil in the upper layers was reduced to in-crease the resistance of the soil to seismic activity in case of an earthquake. This was achieved by improv-ing the shear parameters and increasing the overall permeability of the ground. Moreover, the compacta-ble soil was improved around the stone columns by the vibratory installation process using the bottom feed vibrator technique. For drainage and load distri-bution a gravel layer was placed as fill above the im-proved ground with thickness varying according to the needs of the structure.
The reinforced concrete slab of the west building was extended by a cantilever comprising a length of about 2 m in order to improve the pressure distribu-tion due to the non-uniform loads beneath the raft foundation. Additionally, at the rear of the west
building a preloading was applied to anticipate a spe-cific portion of the expected settlements. Settlement measurements revealed that up to about 12 cm of set-tlements occurred from preloading the fill. Differen-tial settlements between the west building and the ad-jacent (temporary) grandstands were taken into account by superelevating the raft foundation of the west building.
In the area of the outer stairs in the northwest the soil had been preloaded by a demolished building. The maximum allowable soil pressure was limited to 115 kN/m² since no deep ground improvement could be performed there. Soil was replaced with recycled concrete aggregate to a thickness of 100 cm.
In the lower part of the access ramp in the south-west of the oval the ground was not improved. The 10.5 m high ramp adjacent to the west building was filled on ground improved by stone columns for the following reasons: Reduction of settlements to minimize defor-
mations which could affect the west building. Acceleration of settlements by increasing the
overall permeability of the ground to reduce the residual consolidation settlements to a minimum for the incorporated concrete structures, such as
Adam
97
conditions. An alternative shallow floating raft foun-dation on stone columns using the vibro replacement technique was actually installed. For the foundation of the girder and column structures of the three grandstands, the soccer academy building and the multifunctional gymnasium, as well as the ground beneath the highly loaded sections of the access ramp on the south west side of the stadium the ground was improved by stone columns. Due to the unfavourable ground conditions settlements of the order of a max-imum of 20 cm were predicted so that the defor-mation compatibility of the particular structures had to be carefully taken into consideration.
Figure 1. EURO 2008 Stadium Klagenfurt.
1.2 Ground conditions
Prior to construction ground exploration and soil in-vestigation was performed in two phases. Rotational core drillings and heavy dynamic probing (DPH) and moreover, seismic investigations to determine the in-terface between soft soil and bed rock revealed the following soil structure on the site of the stadium
(Ingenieurgemeinschaft Garber & Dalmatiner Zi-vilingenieure 2005a,b and Bautechnische Versuchs- und Forschungsanstalt Salzburg 2006):
Beneath the topsoil young unconsolidated sedi-ments consisting of medium to coarse (gravelly) sands and silt (loam) are deposited up to a depth of 10 to 12 m below surface. Loose to medium dense sands predominate with increasing depth. These lay-ers are underlain by young unconsolidated lake de-posits consisting of medium dense silty fine sands followed by silty and clayey lake deposits up to 30 to 48 m beneath surface. Horizontally layered (very) soft clayey silts predominate and alternate with thin layers of silty fine sands and fine sandy silts. These lake deposits rest on sands and the ground moraine, the depth of the underlying bed rock consisting of sound quartz phyllite varies in a wide range below surface from about 31 m in the north to about 60 m in the south.
The groundwater table was found in the drillings at an average depth of about 2.3 m. The groundwater level fluctuates seasonally in a range of about 2.5 m on average. The groundwater is near the surface, thus influencing the soil conditions significantly.
Figure 2. Ground conditions at the site of the stadium (schematic).
1.3 Ground improvement and foundation concept
Beneath all structures (west building, girder and col-umn structures of the three grandstands, the soccer academy building and the multifunctional gymnasi-um, various single foundations) the ground was im-proved by installing stone columns and was thus pre-pared for the shallow foundations. The stone columns have a length of about 10 to 18 m below the surface
SOCCER ACADEMY BUILDING
GRANDSTAND NORTH
GRANDSTAND SOUTH
ACCESS RAMP
TRANSFORMER ROOM
EX1
EX2
+ MULTIFUNCTIONAL GYMNASIUM
EXTENSOMETER MEASUREMENTS
Figure 3. Layout of foundation scheme of several structures of the stadium.
Figure 4. Layout of executed stone columns.
and were arranged taking into account the calculated foundation pressures and the soil interfaces found during installation. Thus, it was intended to homoge-nize the ground conditions on the one hand and to minimize the settlements and differential settlements on the other. Moreover, it was intended to accelerate the consolidation process in the ground through the highly permeable stone columns (Adam & Geotech-nik Adam ZT GmbH. 2008c).
In addition the liquefaction potential of the col-lapsible soil in the upper layers was reduced to in-crease the resistance of the soil to seismic activity in case of an earthquake. This was achieved by improv-ing the shear parameters and increasing the overall permeability of the ground. Moreover, the compacta-ble soil was improved around the stone columns by the vibratory installation process using the bottom feed vibrator technique. For drainage and load distri-bution a gravel layer was placed as fill above the im-proved ground with thickness varying according to the needs of the structure.
The reinforced concrete slab of the west building was extended by a cantilever comprising a length of about 2 m in order to improve the pressure distribu-tion due to the non-uniform loads beneath the raft foundation. Additionally, at the rear of the west
building a preloading was applied to anticipate a spe-cific portion of the expected settlements. Settlement measurements revealed that up to about 12 cm of set-tlements occurred from preloading the fill. Differen-tial settlements between the west building and the ad-jacent (temporary) grandstands were taken into account by superelevating the raft foundation of the west building.
In the area of the outer stairs in the northwest the soil had been preloaded by a demolished building. The maximum allowable soil pressure was limited to 115 kN/m² since no deep ground improvement could be performed there. Soil was replaced with recycled concrete aggregate to a thickness of 100 cm.
In the lower part of the access ramp in the south-west of the oval the ground was not improved. The 10.5 m high ramp adjacent to the west building was filled on ground improved by stone columns for the following reasons: Reduction of settlements to minimize defor-
mations which could affect the west building. Acceleration of settlements by increasing the
overall permeability of the ground to reduce the residual consolidation settlements to a minimum for the incorporated concrete structures, such as
Geotechnical Engineering for Infrastructure and Development
96
conditions. An alternative shallow floating raft foun-dation on stone columns using the vibro replacement technique was actually installed. For the foundation of the girder and column structures of the three grandstands, the soccer academy building and the multifunctional gymnasium, as well as the ground beneath the highly loaded sections of the access ramp on the south west side of the stadium the ground was improved by stone columns. Due to the unfavourable ground conditions settlements of the order of a max-imum of 20 cm were predicted so that the defor-mation compatibility of the particular structures had to be carefully taken into consideration.
Figure 1. EURO 2008 Stadium Klagenfurt.
1.2 Ground conditions
Prior to construction ground exploration and soil in-vestigation was performed in two phases. Rotational core drillings and heavy dynamic probing (DPH) and moreover, seismic investigations to determine the in-terface between soft soil and bed rock revealed the following soil structure on the site of the stadium
(Ingenieurgemeinschaft Garber & Dalmatiner Zi-vilingenieure 2005a,b and Bautechnische Versuchs- und Forschungsanstalt Salzburg 2006):
Beneath the topsoil young unconsolidated sedi-ments consisting of medium to coarse (gravelly) sands and silt (loam) are deposited up to a depth of 10 to 12 m below surface. Loose to medium dense sands predominate with increasing depth. These lay-ers are underlain by young unconsolidated lake de-posits consisting of medium dense silty fine sands followed by silty and clayey lake deposits up to 30 to 48 m beneath surface. Horizontally layered (very) soft clayey silts predominate and alternate with thin layers of silty fine sands and fine sandy silts. These lake deposits rest on sands and the ground moraine, the depth of the underlying bed rock consisting of sound quartz phyllite varies in a wide range below surface from about 31 m in the north to about 60 m in the south.
The groundwater table was found in the drillings at an average depth of about 2.3 m. The groundwater level fluctuates seasonally in a range of about 2.5 m on average. The groundwater is near the surface, thus influencing the soil conditions significantly.
Figure 2. Ground conditions at the site of the stadium (schematic).
1.3 Ground improvement and foundation concept
Beneath all structures (west building, girder and col-umn structures of the three grandstands, the soccer academy building and the multifunctional gymnasi-um, various single foundations) the ground was im-proved by installing stone columns and was thus pre-pared for the shallow foundations. The stone columns have a length of about 10 to 18 m below the surface
SOCCER ACADEMY BUILDING
GRANDSTAND NORTH
GRANDSTAND SOUTH
ACCESS RAMP
TRANSFORMER ROOM
EX1
EX2
+ MULTIFUNCTIONAL GYMNASIUM
EXTENSOMETER MEASUREMENTS
Figure 3. Layout of foundation scheme of several structures of the stadium.
Figure 4. Layout of executed stone columns.
and were arranged taking into account the calculated foundation pressures and the soil interfaces found during installation. Thus, it was intended to homoge-nize the ground conditions on the one hand and to minimize the settlements and differential settlements on the other. Moreover, it was intended to accelerate the consolidation process in the ground through the highly permeable stone columns (Adam & Geotech-nik Adam ZT GmbH. 2008c).
In addition the liquefaction potential of the col-lapsible soil in the upper layers was reduced to in-crease the resistance of the soil to seismic activity in case of an earthquake. This was achieved by improv-ing the shear parameters and increasing the overall permeability of the ground. Moreover, the compacta-ble soil was improved around the stone columns by the vibratory installation process using the bottom feed vibrator technique. For drainage and load distri-bution a gravel layer was placed as fill above the im-proved ground with thickness varying according to the needs of the structure.
The reinforced concrete slab of the west building was extended by a cantilever comprising a length of about 2 m in order to improve the pressure distribu-tion due to the non-uniform loads beneath the raft foundation. Additionally, at the rear of the west
building a preloading was applied to anticipate a spe-cific portion of the expected settlements. Settlement measurements revealed that up to about 12 cm of set-tlements occurred from preloading the fill. Differen-tial settlements between the west building and the ad-jacent (temporary) grandstands were taken into account by superelevating the raft foundation of the west building.
In the area of the outer stairs in the northwest the soil had been preloaded by a demolished building. The maximum allowable soil pressure was limited to 115 kN/m² since no deep ground improvement could be performed there. Soil was replaced with recycled concrete aggregate to a thickness of 100 cm.
In the lower part of the access ramp in the south-west of the oval the ground was not improved. The 10.5 m high ramp adjacent to the west building was filled on ground improved by stone columns for the following reasons: Reduction of settlements to minimize defor-
mations which could affect the west building. Acceleration of settlements by increasing the
overall permeability of the ground to reduce the residual consolidation settlements to a minimum for the incorporated concrete structures, such as
Adam
97
conditions. An alternative shallow floating raft foun-dation on stone columns using the vibro replacement technique was actually installed. For the foundation of the girder and column structures of the three grandstands, the soccer academy building and the multifunctional gymnasium, as well as the ground beneath the highly loaded sections of the access ramp on the south west side of the stadium the ground was improved by stone columns. Due to the unfavourable ground conditions settlements of the order of a max-imum of 20 cm were predicted so that the defor-mation compatibility of the particular structures had to be carefully taken into consideration.
Figure 1. EURO 2008 Stadium Klagenfurt.
1.2 Ground conditions
Prior to construction ground exploration and soil in-vestigation was performed in two phases. Rotational core drillings and heavy dynamic probing (DPH) and moreover, seismic investigations to determine the in-terface between soft soil and bed rock revealed the following soil structure on the site of the stadium
(Ingenieurgemeinschaft Garber & Dalmatiner Zi-vilingenieure 2005a,b and Bautechnische Versuchs- und Forschungsanstalt Salzburg 2006):
Beneath the topsoil young unconsolidated sedi-ments consisting of medium to coarse (gravelly) sands and silt (loam) are deposited up to a depth of 10 to 12 m below surface. Loose to medium dense sands predominate with increasing depth. These lay-ers are underlain by young unconsolidated lake de-posits consisting of medium dense silty fine sands followed by silty and clayey lake deposits up to 30 to 48 m beneath surface. Horizontally layered (very) soft clayey silts predominate and alternate with thin layers of silty fine sands and fine sandy silts. These lake deposits rest on sands and the ground moraine, the depth of the underlying bed rock consisting of sound quartz phyllite varies in a wide range below surface from about 31 m in the north to about 60 m in the south.
The groundwater table was found in the drillings at an average depth of about 2.3 m. The groundwater level fluctuates seasonally in a range of about 2.5 m on average. The groundwater is near the surface, thus influencing the soil conditions significantly.
Figure 2. Ground conditions at the site of the stadium (schematic).
1.3 Ground improvement and foundation concept
Beneath all structures (west building, girder and col-umn structures of the three grandstands, the soccer academy building and the multifunctional gymnasi-um, various single foundations) the ground was im-proved by installing stone columns and was thus pre-pared for the shallow foundations. The stone columns have a length of about 10 to 18 m below the surface
SOCCER ACADEMY BUILDING
GRANDSTAND NORTH
GRANDSTAND SOUTH
ACCESS RAMP
TRANSFORMER ROOM
EX1
EX2
+ MULTIFUNCTIONAL GYMNASIUM
EXTENSOMETER MEASUREMENTS
Figure 3. Layout of foundation scheme of several structures of the stadium.
Figure 4. Layout of executed stone columns.
and were arranged taking into account the calculated foundation pressures and the soil interfaces found during installation. Thus, it was intended to homoge-nize the ground conditions on the one hand and to minimize the settlements and differential settlements on the other. Moreover, it was intended to accelerate the consolidation process in the ground through the highly permeable stone columns (Adam & Geotech-nik Adam ZT GmbH. 2008c).
In addition the liquefaction potential of the col-lapsible soil in the upper layers was reduced to in-crease the resistance of the soil to seismic activity in case of an earthquake. This was achieved by improv-ing the shear parameters and increasing the overall permeability of the ground. Moreover, the compacta-ble soil was improved around the stone columns by the vibratory installation process using the bottom feed vibrator technique. For drainage and load distri-bution a gravel layer was placed as fill above the im-proved ground with thickness varying according to the needs of the structure.
The reinforced concrete slab of the west building was extended by a cantilever comprising a length of about 2 m in order to improve the pressure distribu-tion due to the non-uniform loads beneath the raft foundation. Additionally, at the rear of the west
building a preloading was applied to anticipate a spe-cific portion of the expected settlements. Settlement measurements revealed that up to about 12 cm of set-tlements occurred from preloading the fill. Differen-tial settlements between the west building and the ad-jacent (temporary) grandstands were taken into account by superelevating the raft foundation of the west building.
In the area of the outer stairs in the northwest the soil had been preloaded by a demolished building. The maximum allowable soil pressure was limited to 115 kN/m² since no deep ground improvement could be performed there. Soil was replaced with recycled concrete aggregate to a thickness of 100 cm.
In the lower part of the access ramp in the south-west of the oval the ground was not improved. The 10.5 m high ramp adjacent to the west building was filled on ground improved by stone columns for the following reasons: Reduction of settlements to minimize defor-
mations which could affect the west building. Acceleration of settlements by increasing the
overall permeability of the ground to reduce the residual consolidation settlements to a minimum for the incorporated concrete structures, such as
Geotechnical Engineering for Infrastructure and Development
98
the transformer room, retaining walls and the bridge structure.
Increase of shear strength of the soil to avoid lo-cal ground failure due to quick filling procedure.
Providing sufficient safety against mechanical ground failure of structures which are incorpo-rated into the ramp (especially the transformer room and the retaining structures).
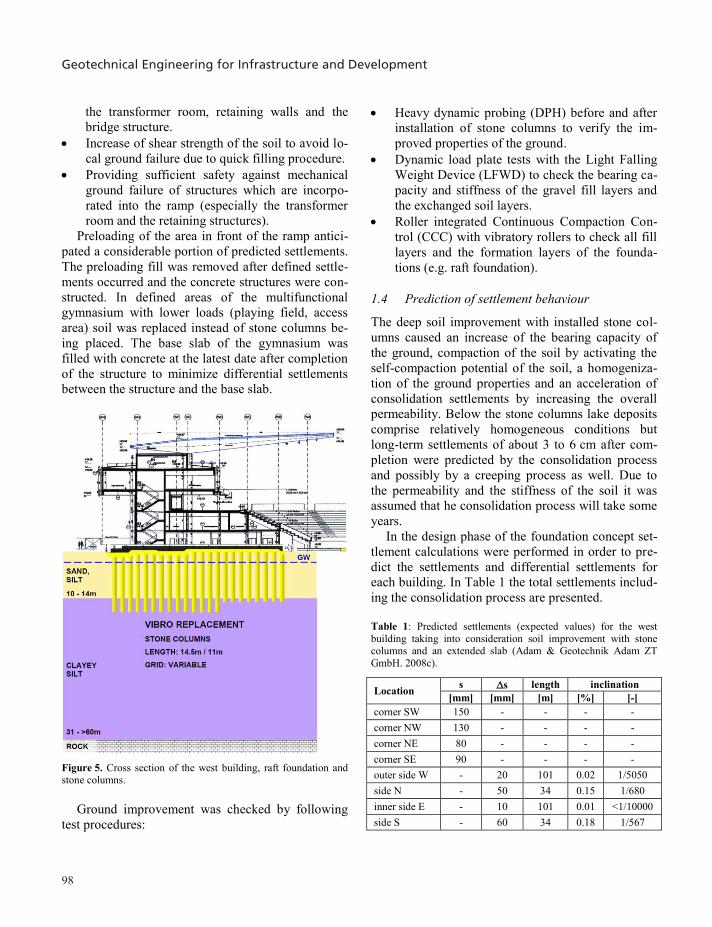
Preloading of the area in front of the ramp antici-pated a considerable portion of predicted settlements. The preloading fill was removed after defined settle-ments occurred and the concrete structures were con-structed. In defined areas of the multifunctional gymnasium with lower loads (playing field, access area) soil was replaced instead of stone columns be-ing placed. The base slab of the gymnasium was filled with concrete at the latest date after completion of the structure to minimize differential settlements between the structure and the base slab.
Figure 5. Cross section of the west building, raft foundation and stone columns.
Ground improvement was checked by following
test procedures:
Heavy dynamic probing (DPH) before and after installation of stone columns to verify the im-proved properties of the ground.
Dynamic load plate tests with the Light Falling Weight Device (LFWD) to check the bearing ca-pacity and stiffness of the gravel fill layers and the exchanged soil layers.
Roller integrated Continuous Compaction Con-trol (CCC) with vibratory rollers to check all fill layers and the formation layers of the founda-tions (e.g. raft foundation).
1.4 Prediction of settlement behaviour
The deep soil improvement with installed stone col-umns caused an increase of the bearing capacity of the ground, compaction of the soil by activating the self-compaction potential of the soil, a homogeniza-tion of the ground properties and an acceleration of consolidation settlements by increasing the overall permeability. Below the stone columns lake deposits comprise relatively homogeneous conditions but long-term settlements of about 3 to 6 cm after com-pletion were predicted by the consolidation process and possibly by a creeping process as well. Due to the permeability and the stiffness of the soil it was assumed that he consolidation process will take some years.
In the design phase of the foundation concept set-tlement calculations were performed in order to pre-dict the settlements and differential settlements for each building. In Table 1 the total settlements includ-ing the consolidation process are presented.
Table 1: Predicted settlements (expected values) for the west building taking into consideration soil improvement with stone columns and an extended slab (Adam & Geotechnik Adam ZT GmbH. 2008c).
Location s s length inclination [mm] [mm] [m] [%] [-]
corner SW 150 - - - - corner NW 130 - - - - corner NE 80 - - - - corner SE 90 - - - - outer side W - 20 101 0.02 1/5050 side N - 50 34 0.15 1/680 inner side E - 10 101 0.01 <1/10000 side S - 60 34 0.18 1/567
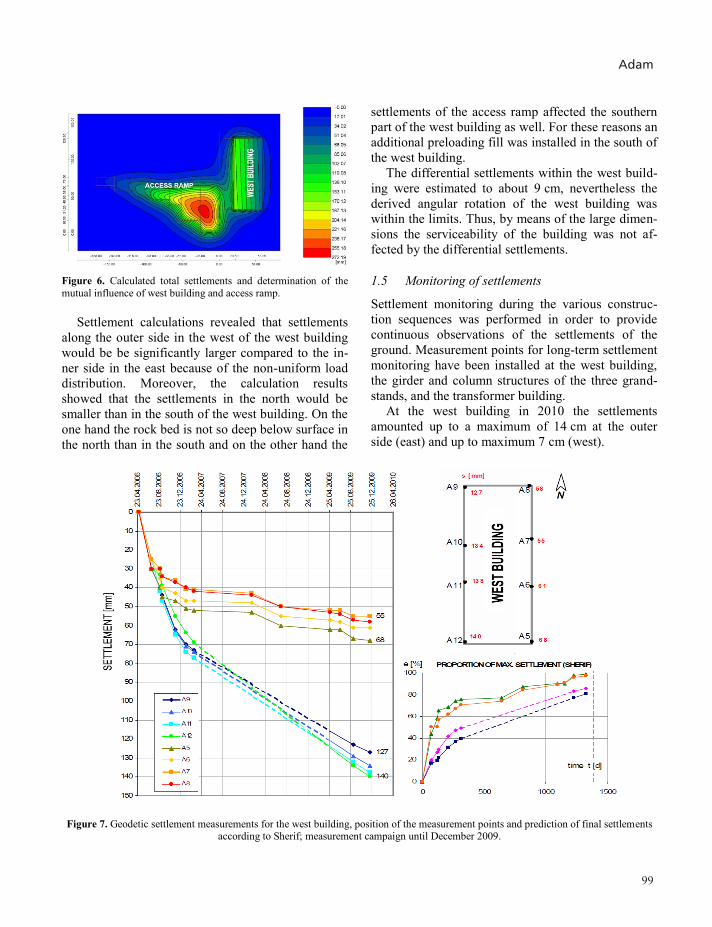
Figure 6. Calculated total settlements and determination of the mutual influence of west building and access ramp.
Settlement calculations revealed that settlements
along the outer side in the west of the west building would be be significantly larger compared to the in-ner side in the east because of the non-uniform load distribution. Moreover, the calculation results showed that the settlements in the north would be smaller than in the south of the west building. On the one hand the rock bed is not so deep below surface in the north than in the south and on the other hand the
settlements of the access ramp affected the southern part of the west building as well. For these reasons an additional preloading fill was installed in the south of the west building.
The differential settlements within the west build-ing were estimated to about 9 cm, nevertheless the derived angular rotation of the west building was within the limits. Thus, by means of the large dimen-sions the serviceability of the building was not af-fected by the differential settlements.
1.5 Monitoring of settlements
Settlement monitoring during the various construc-tion sequences was performed in order to provide continuous observations of the settlements of the ground. Measurement points for long-term settlement monitoring have been installed at the west building, the girder and column structures of the three grand-stands, and the transformer building.
At the west building in 2010 the settlements amounted up to a maximum of 14 cm at the outer side (east) and up to maximum 7 cm (west).
Figure 7. Geodetic settlement measurements for the west building, position of the measurement points and prediction of final settlements according to Sherif; measurement campaign until December 2009.
Adam
99
the transformer room, retaining walls and the bridge structure.
Increase of shear strength of the soil to avoid lo-cal ground failure due to quick filling procedure.
Providing sufficient safety against mechanical ground failure of structures which are incorpo-rated into the ramp (especially the transformer room and the retaining structures).
Preloading of the area in front of the ramp antici-pated a considerable portion of predicted settlements. The preloading fill was removed after defined settle-ments occurred and the concrete structures were con-structed. In defined areas of the multifunctional gymnasium with lower loads (playing field, access area) soil was replaced instead of stone columns be-ing placed. The base slab of the gymnasium was filled with concrete at the latest date after completion of the structure to minimize differential settlements between the structure and the base slab.
Figure 5. Cross section of the west building, raft foundation and stone columns.
Ground improvement was checked by following
test procedures:
Heavy dynamic probing (DPH) before and after installation of stone columns to verify the im-proved properties of the ground.
Dynamic load plate tests with the Light Falling Weight Device (LFWD) to check the bearing ca-pacity and stiffness of the gravel fill layers and the exchanged soil layers.
Roller integrated Continuous Compaction Con-trol (CCC) with vibratory rollers to check all fill layers and the formation layers of the founda-tions (e.g. raft foundation).
1.4 Prediction of settlement behaviour
The deep soil improvement with installed stone col-umns caused an increase of the bearing capacity of the ground, compaction of the soil by activating the self-compaction potential of the soil, a homogeniza-tion of the ground properties and an acceleration of consolidation settlements by increasing the overall permeability. Below the stone columns lake deposits comprise relatively homogeneous conditions but long-term settlements of about 3 to 6 cm after com-pletion were predicted by the consolidation process and possibly by a creeping process as well. Due to the permeability and the stiffness of the soil it was assumed that he consolidation process will take some years.
In the design phase of the foundation concept set-tlement calculations were performed in order to pre-dict the settlements and differential settlements for each building. In Table 1 the total settlements includ-ing the consolidation process are presented.
Table 1: Predicted settlements (expected values) for the west building taking into consideration soil improvement with stone columns and an extended slab (Adam & Geotechnik Adam ZT GmbH. 2008c).
Location s s length inclination [mm] [mm] [m] [%] [-]
corner SW 150 - - - - corner NW 130 - - - - corner NE 80 - - - - corner SE 90 - - - - outer side W - 20 101 0.02 1/5050 side N - 50 34 0.15 1/680 inner side E - 10 101 0.01 <1/10000 side S - 60 34 0.18 1/567
Figure 6. Calculated total settlements and determination of the mutual influence of west building and access ramp.
Settlement calculations revealed that settlements
along the outer side in the west of the west building would be be significantly larger compared to the in-ner side in the east because of the non-uniform load distribution. Moreover, the calculation results showed that the settlements in the north would be smaller than in the south of the west building. On the one hand the rock bed is not so deep below surface in the north than in the south and on the other hand the
settlements of the access ramp affected the southern part of the west building as well. For these reasons an additional preloading fill was installed in the south of the west building.
The differential settlements within the west build-ing were estimated to about 9 cm, nevertheless the derived angular rotation of the west building was within the limits. Thus, by means of the large dimen-sions the serviceability of the building was not af-fected by the differential settlements.
1.5 Monitoring of settlements
Settlement monitoring during the various construc-tion sequences was performed in order to provide continuous observations of the settlements of the ground. Measurement points for long-term settlement monitoring have been installed at the west building, the girder and column structures of the three grand-stands, and the transformer building.
At the west building in 2010 the settlements amounted up to a maximum of 14 cm at the outer side (east) and up to maximum 7 cm (west).
Figure 7. Geodetic settlement measurements for the west building, position of the measurement points and prediction of final settlements according to Sherif; measurement campaign until December 2009.
Geotechnical Engineering for Infrastructure and Development
98
the transformer room, retaining walls and the bridge structure.
Increase of shear strength of the soil to avoid lo-cal ground failure due to quick filling procedure.
Providing sufficient safety against mechanical ground failure of structures which are incorpo-rated into the ramp (especially the transformer room and the retaining structures).
Preloading of the area in front of the ramp antici-pated a considerable portion of predicted settlements. The preloading fill was removed after defined settle-ments occurred and the concrete structures were con-structed. In defined areas of the multifunctional gymnasium with lower loads (playing field, access area) soil was replaced instead of stone columns be-ing placed. The base slab of the gymnasium was filled with concrete at the latest date after completion of the structure to minimize differential settlements between the structure and the base slab.
Figure 5. Cross section of the west building, raft foundation and stone columns.
Ground improvement was checked by following
test procedures:
Heavy dynamic probing (DPH) before and after installation of stone columns to verify the im-proved properties of the ground.
Dynamic load plate tests with the Light Falling Weight Device (LFWD) to check the bearing ca-pacity and stiffness of the gravel fill layers and the exchanged soil layers.
Roller integrated Continuous Compaction Con-trol (CCC) with vibratory rollers to check all fill layers and the formation layers of the founda-tions (e.g. raft foundation).
1.4 Prediction of settlement behaviour
The deep soil improvement with installed stone col-umns caused an increase of the bearing capacity of the ground, compaction of the soil by activating the self-compaction potential of the soil, a homogeniza-tion of the ground properties and an acceleration of consolidation settlements by increasing the overall permeability. Below the stone columns lake deposits comprise relatively homogeneous conditions but long-term settlements of about 3 to 6 cm after com-pletion were predicted by the consolidation process and possibly by a creeping process as well. Due to the permeability and the stiffness of the soil it was assumed that he consolidation process will take some years.
In the design phase of the foundation concept set-tlement calculations were performed in order to pre-dict the settlements and differential settlements for each building. In Table 1 the total settlements includ-ing the consolidation process are presented.
Table 1: Predicted settlements (expected values) for the west building taking into consideration soil improvement with stone columns and an extended slab (Adam & Geotechnik Adam ZT GmbH. 2008c).
Location s s length inclination [mm] [mm] [m] [%] [-]
corner SW 150 - - - - corner NW 130 - - - - corner NE 80 - - - - corner SE 90 - - - - outer side W - 20 101 0.02 1/5050 side N - 50 34 0.15 1/680 inner side E - 10 101 0.01 <1/10000 side S - 60 34 0.18 1/567
Figure 6. Calculated total settlements and determination of the mutual influence of west building and access ramp.
Settlement calculations revealed that settlements
along the outer side in the west of the west building would be be significantly larger compared to the in-ner side in the east because of the non-uniform load distribution. Moreover, the calculation results showed that the settlements in the north would be smaller than in the south of the west building. On the one hand the rock bed is not so deep below surface in the north than in the south and on the other hand the
settlements of the access ramp affected the southern part of the west building as well. For these reasons an additional preloading fill was installed in the south of the west building.
The differential settlements within the west build-ing were estimated to about 9 cm, nevertheless the derived angular rotation of the west building was within the limits. Thus, by means of the large dimen-sions the serviceability of the building was not af-fected by the differential settlements.
1.5 Monitoring of settlements
Settlement monitoring during the various construc-tion sequences was performed in order to provide continuous observations of the settlements of the ground. Measurement points for long-term settlement monitoring have been installed at the west building, the girder and column structures of the three grand-stands, and the transformer building.
At the west building in 2010 the settlements amounted up to a maximum of 14 cm at the outer side (east) and up to maximum 7 cm (west).
Figure 7. Geodetic settlement measurements for the west building, position of the measurement points and prediction of final settlements according to Sherif; measurement campaign until December 2009.
Adam
99
the transformer room, retaining walls and the bridge structure.
Increase of shear strength of the soil to avoid lo-cal ground failure due to quick filling procedure.
Providing sufficient safety against mechanical ground failure of structures which are incorpo-rated into the ramp (especially the transformer room and the retaining structures).
Preloading of the area in front of the ramp antici-pated a considerable portion of predicted settlements. The preloading fill was removed after defined settle-ments occurred and the concrete structures were con-structed. In defined areas of the multifunctional gymnasium with lower loads (playing field, access area) soil was replaced instead of stone columns be-ing placed. The base slab of the gymnasium was filled with concrete at the latest date after completion of the structure to minimize differential settlements between the structure and the base slab.
Figure 5. Cross section of the west building, raft foundation and stone columns.
Ground improvement was checked by following
test procedures:
Heavy dynamic probing (DPH) before and after installation of stone columns to verify the im-proved properties of the ground.
Dynamic load plate tests with the Light Falling Weight Device (LFWD) to check the bearing ca-pacity and stiffness of the gravel fill layers and the exchanged soil layers.
Roller integrated Continuous Compaction Con-trol (CCC) with vibratory rollers to check all fill layers and the formation layers of the founda-tions (e.g. raft foundation).
1.4 Prediction of settlement behaviour
The deep soil improvement with installed stone col-umns caused an increase of the bearing capacity of the ground, compaction of the soil by activating the self-compaction potential of the soil, a homogeniza-tion of the ground properties and an acceleration of consolidation settlements by increasing the overall permeability. Below the stone columns lake deposits comprise relatively homogeneous conditions but long-term settlements of about 3 to 6 cm after com-pletion were predicted by the consolidation process and possibly by a creeping process as well. Due to the permeability and the stiffness of the soil it was assumed that he consolidation process will take some years.
In the design phase of the foundation concept set-tlement calculations were performed in order to pre-dict the settlements and differential settlements for each building. In Table 1 the total settlements includ-ing the consolidation process are presented.
Table 1: Predicted settlements (expected values) for the west building taking into consideration soil improvement with stone columns and an extended slab (Adam & Geotechnik Adam ZT GmbH. 2008c).
Location s s length inclination [mm] [mm] [m] [%] [-]
corner SW 150 - - - - corner NW 130 - - - - corner NE 80 - - - - corner SE 90 - - - - outer side W - 20 101 0.02 1/5050 side N - 50 34 0.15 1/680 inner side E - 10 101 0.01 <1/10000 side S - 60 34 0.18 1/567
Figure 6. Calculated total settlements and determination of the mutual influence of west building and access ramp.
Settlement calculations revealed that settlements
along the outer side in the west of the west building would be be significantly larger compared to the in-ner side in the east because of the non-uniform load distribution. Moreover, the calculation results showed that the settlements in the north would be smaller than in the south of the west building. On the one hand the rock bed is not so deep below surface in the north than in the south and on the other hand the
settlements of the access ramp affected the southern part of the west building as well. For these reasons an additional preloading fill was installed in the south of the west building.
The differential settlements within the west build-ing were estimated to about 9 cm, nevertheless the derived angular rotation of the west building was within the limits. Thus, by means of the large dimen-sions the serviceability of the building was not af-fected by the differential settlements.
1.5 Monitoring of settlements
Settlement monitoring during the various construc-tion sequences was performed in order to provide continuous observations of the settlements of the ground. Measurement points for long-term settlement monitoring have been installed at the west building, the girder and column structures of the three grand-stands, and the transformer building.
At the west building in 2010 the settlements amounted up to a maximum of 14 cm at the outer side (east) and up to maximum 7 cm (west).
Figure 7. Geodetic settlement measurements for the west building, position of the measurement points and prediction of final settlements according to Sherif; measurement campaign until December 2009.
Geotechnical Engineering for Infrastructure and Development
100
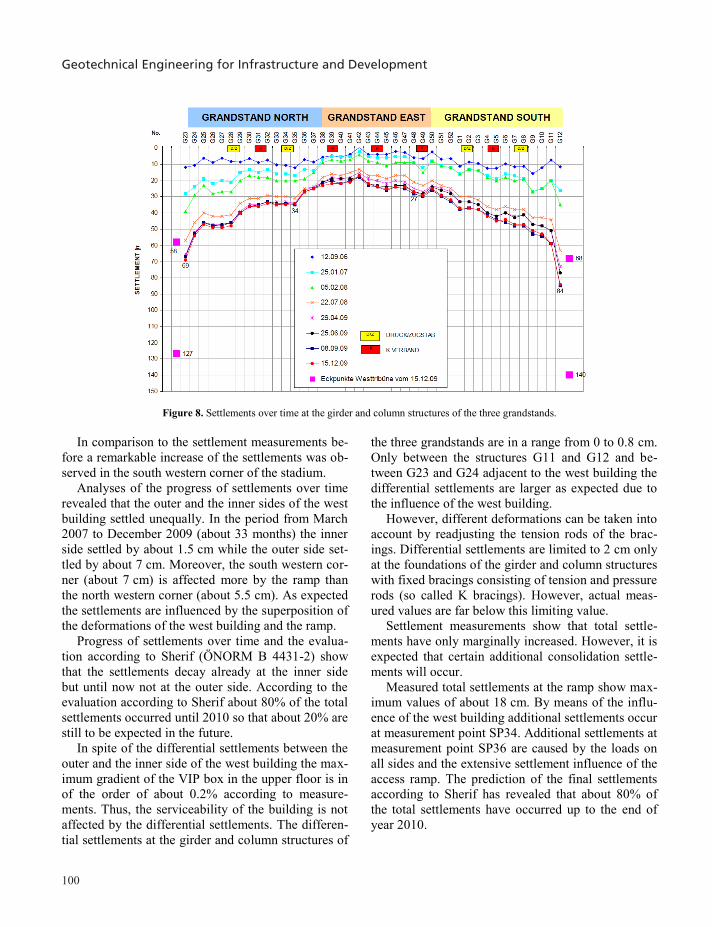
Figure 8. Settlements over time at the girder and column structures of the three grandstands.
In comparison to the settlement measurements be-
fore a remarkable increase of the settlements was ob-served in the south western corner of the stadium.
Analyses of the progress of settlements over time revealed that the outer and the inner sides of the west building settled unequally. In the period from March 2007 to December 2009 (about 33 months) the inner side settled by about 1.5 cm while the outer side set-tled by about 7 cm. Moreover, the south western cor-ner (about 7 cm) is affected more by the ramp than the north western corner (about 5.5 cm). As expected the settlements are influenced by the superposition of the deformations of the west building and the ramp.
Progress of settlements over time and the evalua-tion according to Sherif (ÖNORM B 4431-2) show that the settlements decay already at the inner side but until now not at the outer side. According to the evaluation according to Sherif about 80% of the total settlements occurred until 2010 so that about 20% are still to be expected in the future.
In spite of the differential settlements between the outer and the inner side of the west building the max-imum gradient of the VIP box in the upper floor is in of the order of about 0.2% according to measure-ments. Thus, the serviceability of the building is not affected by the differential settlements. The differen-tial settlements at the girder and column structures of
the three grandstands are in a range from 0 to 0.8 cm. Only between the structures G11 and G12 and be-tween G23 and G24 adjacent to the west building the differential settlements are larger as expected due to the influence of the west building.
However, different deformations can be taken into account by readjusting the tension rods of the brac-ings. Differential settlements are limited to 2 cm only at the foundations of the girder and column structures with fixed bracings consisting of tension and pressure rods (so called K bracings). However, actual meas-ured values are far below this limiting value.
Settlement measurements show that total settle-ments have only marginally increased. However, it is expected that certain additional consolidation settle-ments will occur.
Measured total settlements at the ramp show max-imum values of about 18 cm. By means of the influ-ence of the west building additional settlements occur at measurement point SP34. Additional settlements at measurement point SP36 are caused by the loads on all sides and the extensive settlement influence of the access ramp. The prediction of the final settlements according to Sherif has revealed that about 80% of the total settlements have occurred up to the end of year 2010.
In a large scale well instrumented field trial consist-ing of multilevel-piezometers, multilevel-extensometers and earth pressure cells as well as a horizontal inclinometer the performance of the float-ing stone column foundation was investigated. The measurements give valuable insight into the installa-tion process of stone columns and the evolution of pore water pressures and settlements over time be-neath the 10.5 m high access ramp (Gäb et al. 2007).
In Figure 11 results of extensometer and multi-level-piezometer measurements are presented reveal-ing the effect of increasing the over-all permeability in the zone of the stone columns. Pore water pres-sures decrease rapidly after completion of stone col-umn installation thus accelerating consolidation set-tlements in the ground. Below the stone columns the permeability of the ground is low so that the decrease of pore water pressure and consolidation settlements take a long time, presumably some years.
1.6 Back analysis of settlements of the west building
A series of finite element analyses have been per-formed for this project and comparison of field measurements with 2D analyses employing different constitutive models has been presented in (Gäb et al. 2008) for the heavily instrumented trial field set up in the area of the ramp. Thus, these results will not be repeated here but results from back analysis of the
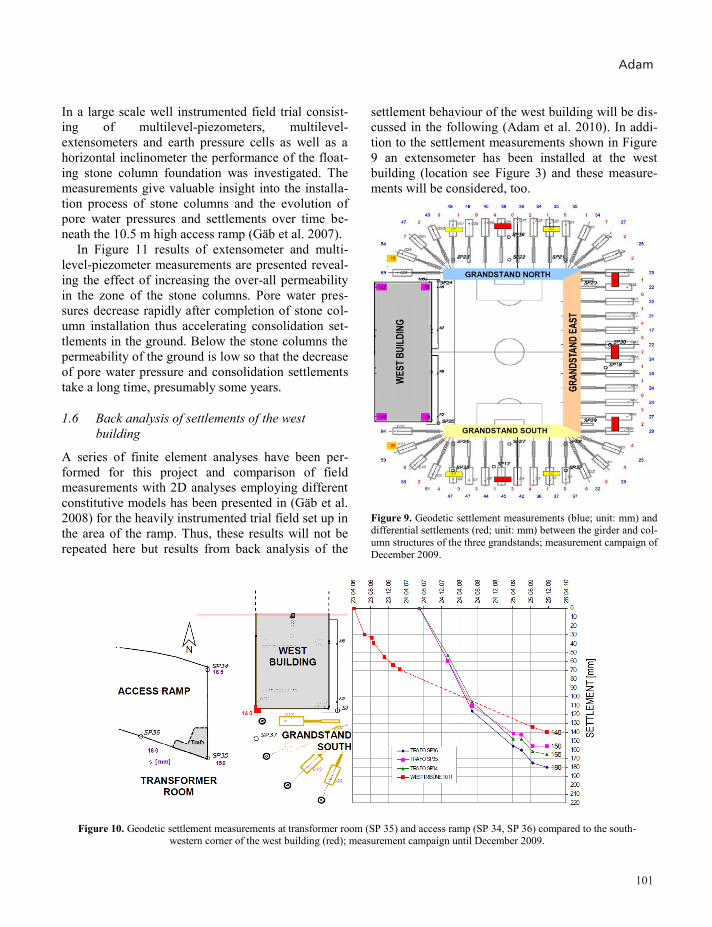
settlement behaviour of the west building will be dis-cussed in the following (Adam et al. 2010). In addi-tion to the settlement measurements shown in Figure 9 an extensometer has been installed at the west building (location see Figure 3) and these measure-ments will be considered, too.
Figure 9. Geodetic settlement measurements (blue; unit: mm) and differential settlements (red; unit: mm) between the girder and col-umn structures of the three grandstands; measurement campaign of December 2009.
Figure 10. Geodetic settlement measurements at transformer room (SP 35) and access ramp (SP 34, SP 36) compared to the south-western corner of the west building (red); measurement campaign until December 2009.
Adam
101
Figure 8. Settlements over time at the girder and column structures of the three grandstands.
In comparison to the settlement measurements be-
fore a remarkable increase of the settlements was ob-served in the south western corner of the stadium.
Analyses of the progress of settlements over time revealed that the outer and the inner sides of the west building settled unequally. In the period from March 2007 to December 2009 (about 33 months) the inner side settled by about 1.5 cm while the outer side set-tled by about 7 cm. Moreover, the south western cor-ner (about 7 cm) is affected more by the ramp than the north western corner (about 5.5 cm). As expected the settlements are influenced by the superposition of the deformations of the west building and the ramp.
Progress of settlements over time and the evalua-tion according to Sherif (ÖNORM B 4431-2) show that the settlements decay already at the inner side but until now not at the outer side. According to the evaluation according to Sherif about 80% of the total settlements occurred until 2010 so that about 20% are still to be expected in the future.
In spite of the differential settlements between the outer and the inner side of the west building the max-imum gradient of the VIP box in the upper floor is in of the order of about 0.2% according to measure-ments. Thus, the serviceability of the building is not affected by the differential settlements. The differen-tial settlements at the girder and column structures of
the three grandstands are in a range from 0 to 0.8 cm. Only between the structures G11 and G12 and be-tween G23 and G24 adjacent to the west building the differential settlements are larger as expected due to the influence of the west building.
However, different deformations can be taken into account by readjusting the tension rods of the brac-ings. Differential settlements are limited to 2 cm only at the foundations of the girder and column structures with fixed bracings consisting of tension and pressure rods (so called K bracings). However, actual meas-ured values are far below this limiting value.
Settlement measurements show that total settle-ments have only marginally increased. However, it is expected that certain additional consolidation settle-ments will occur.
Measured total settlements at the ramp show max-imum values of about 18 cm. By means of the influ-ence of the west building additional settlements occur at measurement point SP34. Additional settlements at measurement point SP36 are caused by the loads on all sides and the extensive settlement influence of the access ramp. The prediction of the final settlements according to Sherif has revealed that about 80% of the total settlements have occurred up to the end of year 2010.
In a large scale well instrumented field trial consist-ing of multilevel-piezometers, multilevel-extensometers and earth pressure cells as well as a horizontal inclinometer the performance of the float-ing stone column foundation was investigated. The measurements give valuable insight into the installa-tion process of stone columns and the evolution of pore water pressures and settlements over time be-neath the 10.5 m high access ramp (Gäb et al. 2007).
In Figure 11 results of extensometer and multi-level-piezometer measurements are presented reveal-ing the effect of increasing the over-all permeability in the zone of the stone columns. Pore water pres-sures decrease rapidly after completion of stone col-umn installation thus accelerating consolidation set-tlements in the ground. Below the stone columns the permeability of the ground is low so that the decrease of pore water pressure and consolidation settlements take a long time, presumably some years.
1.6 Back analysis of settlements of the west building
A series of finite element analyses have been per-formed for this project and comparison of field measurements with 2D analyses employing different constitutive models has been presented in (Gäb et al. 2008) for the heavily instrumented trial field set up in the area of the ramp. Thus, these results will not be repeated here but results from back analysis of the
settlement behaviour of the west building will be dis-cussed in the following (Adam et al. 2010). In addi-tion to the settlement measurements shown in Figure 9 an extensometer has been installed at the west building (location see Figure 3) and these measure-ments will be considered, too.
Figure 9. Geodetic settlement measurements (blue; unit: mm) and differential settlements (red; unit: mm) between the girder and col-umn structures of the three grandstands; measurement campaign of December 2009.
Figure 10. Geodetic settlement measurements at transformer room (SP 35) and access ramp (SP 34, SP 36) compared to the south-western corner of the west building (red); measurement campaign until December 2009.
Geotechnical Engineering for Infrastructure and Development
100
Figure 8. Settlements over time at the girder and column structures of the three grandstands.
In comparison to the settlement measurements be-
fore a remarkable increase of the settlements was ob-served in the south western corner of the stadium.
Analyses of the progress of settlements over time revealed that the outer and the inner sides of the west building settled unequally. In the period from March 2007 to December 2009 (about 33 months) the inner side settled by about 1.5 cm while the outer side set-tled by about 7 cm. Moreover, the south western cor-ner (about 7 cm) is affected more by the ramp than the north western corner (about 5.5 cm). As expected the settlements are influenced by the superposition of the deformations of the west building and the ramp.
Progress of settlements over time and the evalua-tion according to Sherif (ÖNORM B 4431-2) show that the settlements decay already at the inner side but until now not at the outer side. According to the evaluation according to Sherif about 80% of the total settlements occurred until 2010 so that about 20% are still to be expected in the future.
In spite of the differential settlements between the outer and the inner side of the west building the max-imum gradient of the VIP box in the upper floor is in of the order of about 0.2% according to measure-ments. Thus, the serviceability of the building is not affected by the differential settlements. The differen-tial settlements at the girder and column structures of
the three grandstands are in a range from 0 to 0.8 cm. Only between the structures G11 and G12 and be-tween G23 and G24 adjacent to the west building the differential settlements are larger as expected due to the influence of the west building.
However, different deformations can be taken into account by readjusting the tension rods of the brac-ings. Differential settlements are limited to 2 cm only at the foundations of the girder and column structures with fixed bracings consisting of tension and pressure rods (so called K bracings). However, actual meas-ured values are far below this limiting value.
Settlement measurements show that total settle-ments have only marginally increased. However, it is expected that certain additional consolidation settle-ments will occur.
Measured total settlements at the ramp show max-imum values of about 18 cm. By means of the influ-ence of the west building additional settlements occur at measurement point SP34. Additional settlements at measurement point SP36 are caused by the loads on all sides and the extensive settlement influence of the access ramp. The prediction of the final settlements according to Sherif has revealed that about 80% of the total settlements have occurred up to the end of year 2010.
In a large scale well instrumented field trial consist-ing of multilevel-piezometers, multilevel-extensometers and earth pressure cells as well as a horizontal inclinometer the performance of the float-ing stone column foundation was investigated. The measurements give valuable insight into the installa-tion process of stone columns and the evolution of pore water pressures and settlements over time be-neath the 10.5 m high access ramp (Gäb et al. 2007).
In Figure 11 results of extensometer and multi-level-piezometer measurements are presented reveal-ing the effect of increasing the over-all permeability in the zone of the stone columns. Pore water pres-sures decrease rapidly after completion of stone col-umn installation thus accelerating consolidation set-tlements in the ground. Below the stone columns the permeability of the ground is low so that the decrease of pore water pressure and consolidation settlements take a long time, presumably some years.
1.6 Back analysis of settlements of the west building
A series of finite element analyses have been per-formed for this project and comparison of field measurements with 2D analyses employing different constitutive models has been presented in (Gäb et al. 2008) for the heavily instrumented trial field set up in the area of the ramp. Thus, these results will not be repeated here but results from back analysis of the
settlement behaviour of the west building will be dis-cussed in the following (Adam et al. 2010). In addi-tion to the settlement measurements shown in Figure 9 an extensometer has been installed at the west building (location see Figure 3) and these measure-ments will be considered, too.
Figure 9. Geodetic settlement measurements (blue; unit: mm) and differential settlements (red; unit: mm) between the girder and col-umn structures of the three grandstands; measurement campaign of December 2009.
Figure 10. Geodetic settlement measurements at transformer room (SP 35) and access ramp (SP 34, SP 36) compared to the south-western corner of the west building (red); measurement campaign until December 2009.
Adam
101
Figure 8. Settlements over time at the girder and column structures of the three grandstands.
In comparison to the settlement measurements be-
fore a remarkable increase of the settlements was ob-served in the south western corner of the stadium.
Analyses of the progress of settlements over time revealed that the outer and the inner sides of the west building settled unequally. In the period from March 2007 to December 2009 (about 33 months) the inner side settled by about 1.5 cm while the outer side set-tled by about 7 cm. Moreover, the south western cor-ner (about 7 cm) is affected more by the ramp than the north western corner (about 5.5 cm). As expected the settlements are influenced by the superposition of the deformations of the west building and the ramp.
Progress of settlements over time and the evalua-tion according to Sherif (ÖNORM B 4431-2) show that the settlements decay already at the inner side but until now not at the outer side. According to the evaluation according to Sherif about 80% of the total settlements occurred until 2010 so that about 20% are still to be expected in the future.
In spite of the differential settlements between the outer and the inner side of the west building the max-imum gradient of the VIP box in the upper floor is in of the order of about 0.2% according to measure-ments. Thus, the serviceability of the building is not affected by the differential settlements. The differen-tial settlements at the girder and column structures of
the three grandstands are in a range from 0 to 0.8 cm. Only between the structures G11 and G12 and be-tween G23 and G24 adjacent to the west building the differential settlements are larger as expected due to the influence of the west building.
However, different deformations can be taken into account by readjusting the tension rods of the brac-ings. Differential settlements are limited to 2 cm only at the foundations of the girder and column structures with fixed bracings consisting of tension and pressure rods (so called K bracings). However, actual meas-ured values are far below this limiting value.
Settlement measurements show that total settle-ments have only marginally increased. However, it is expected that certain additional consolidation settle-ments will occur.
Measured total settlements at the ramp show max-imum values of about 18 cm. By means of the influ-ence of the west building additional settlements occur at measurement point SP34. Additional settlements at measurement point SP36 are caused by the loads on all sides and the extensive settlement influence of the access ramp. The prediction of the final settlements according to Sherif has revealed that about 80% of the total settlements have occurred up to the end of year 2010.
In a large scale well instrumented field trial consist-ing of multilevel-piezometers, multilevel-extensometers and earth pressure cells as well as a horizontal inclinometer the performance of the float-ing stone column foundation was investigated. The measurements give valuable insight into the installa-tion process of stone columns and the evolution of pore water pressures and settlements over time be-neath the 10.5 m high access ramp (Gäb et al. 2007).
In Figure 11 results of extensometer and multi-level-piezometer measurements are presented reveal-ing the effect of increasing the over-all permeability in the zone of the stone columns. Pore water pres-sures decrease rapidly after completion of stone col-umn installation thus accelerating consolidation set-tlements in the ground. Below the stone columns the permeability of the ground is low so that the decrease of pore water pressure and consolidation settlements take a long time, presumably some years.
1.6 Back analysis of settlements of the west building
A series of finite element analyses have been per-formed for this project and comparison of field measurements with 2D analyses employing different constitutive models has been presented in (Gäb et al. 2008) for the heavily instrumented trial field set up in the area of the ramp. Thus, these results will not be repeated here but results from back analysis of the
settlement behaviour of the west building will be dis-cussed in the following (Adam et al. 2010). In addi-tion to the settlement measurements shown in Figure 9 an extensometer has been installed at the west building (location see Figure 3) and these measure-ments will be considered, too.
Figure 9. Geodetic settlement measurements (blue; unit: mm) and differential settlements (red; unit: mm) between the girder and col-umn structures of the three grandstands; measurement campaign of December 2009.
Figure 10. Geodetic settlement measurements at transformer room (SP 35) and access ramp (SP 34, SP 36) compared to the south-western corner of the west building (red); measurement campaign until December 2009.
Geotechnical Engineering for Infrastructure and Development
102
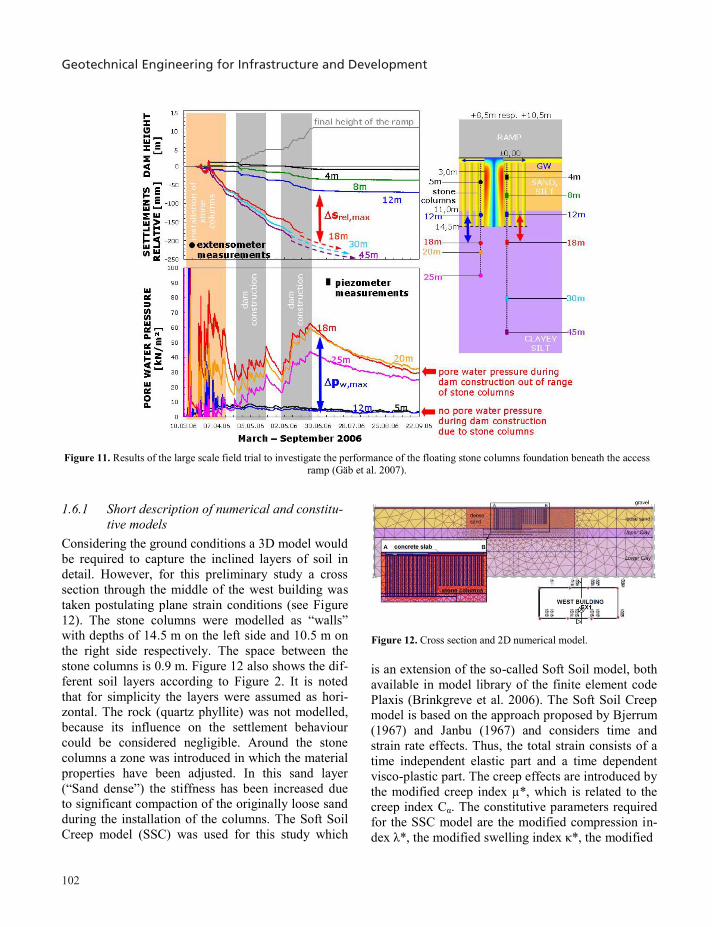
Figure 11. Results of the large scale field trial to investigate the performance of the floating stone columns foundation beneath the access
ramp (Gäb et al. 2007).
1.6.1 Short description of numerical and constitu-tive models
Considering the ground conditions a 3D model would be required to capture the inclined layers of soil in detail. However, for this preliminary study a cross section through the middle of the west building was taken postulating plane strain conditions (see Figure 12). The stone columns were modelled as “walls” with depths of 14.5 m on the left side and 10.5 m on the right side respectively. The space between the stone columns is 0.9 m. Figure 12 also shows the dif-ferent soil layers according to Figure 2. It is noted that for simplicity the layers were assumed as hori-zontal. The rock (quartz phyllite) was not modelled, because its influence on the settlement behaviour could be considered negligible. Around the stone columns a zone was introduced in which the material properties have been adjusted. In this sand layer (“Sand dense”) the stiffness has been increased due to significant compaction of the originally loose sand during the installation of the columns. The Soft Soil Creep model (SSC) was used for this study which
Figure 12. Cross section and 2D numerical model. is an extension of the so-called Soft Soil model, both available in model library of the finite element code Plaxis (Brinkgreve et al. 2006). The Soft Soil Creep model is based on the approach proposed by Bjerrum (1967) and Janbu (1967) and considers time and strain rate effects. Thus, the total strain consists of a time independent elastic part and a time dependent visco-plastic part. The creep effects are introduced by the modified creep index µ*, which is related to the creep index Cα. The constitutive parameters required for the SSC model are the modified compression in-dex λ*, the modified swelling index κ*, the modified
Table 2: Material parameters for soil layers.
kx ky γ γ c φ Ψ ν κ* λ* µ* OCR K0,nc [m/s] [m/s] [kN/m²] [kN/m²] [kN/m2] [°] [°] [-] [-] [-] [-] [-] [-]
Upper Clay 2.6E-9 7.9E-9 16 19 10 22.5 0 0.2 0.0053 0.028 0.0009 1.3 0.617 Lower Clay 2.4E-8 2.3E-7 16 19 10 22.5 0 0.2 0.005 0.026 0.00085 1.3 0.617 kx ky γ γ c φ Ψ ν E50
ref Eoedref Eur
ref m OCR K0,nc [m/s] [m/s] [kN/m²] [kN/m²] [kN/m2] [°] [°] [-] [MN/m²] [MN/m²] [MN/m²] [-] [-] [-]
Loose sand 1E-5 1E-5 18 21 0.1 27.5 2 0.2 16 16 80 0.55 1 0.538 Dense sand 1E-5 1E-5 18 21 0.1 27.5 2 0.2 40 40 120 0.65 1 0.538 Stone columns 1E-5 1E-5 20 23.5 0.1 35 5 0.2 250 25 75 0.3 1 0.426 Gravel 1E-5 1E-5 20 20 0.1 35 0 35 35 105 0.5 1 0.426 Concrete slab - - 25 - - - - 0.2 3E7 - - - 1 -
creep index µ*, the friction angle φ', cohesion c', di-latancy angle ψ, Possions's ratio ν and coefficient of earth pressure at rest K0,nc. These parameters can be determined by standard triaxial and oedometer tests. A detailed description of the model can be found in (Vermeer and Neher 2000). The Soft Soil Creep model was used for the clayey silt layers, for all other soil layers and the stone columns the Plaxis Harden-ing Soil model (Brinkgreve et al. 2006) was used. The parameters are summarized in Table 2.
1.6.2 Results of numerical back-analysis Results from the numerical back-analysis are com-pared to the measurements of points (1007/1008 (A10) - 1009/1010 (A11) and 1014/1015 (A6) - 1016/1017 (A7)) according to Figure 13. These data correspond to the simulated vertical displacement of points A and B (Figure 12). Furthermore, available extensometer measurements (EX1) are taken into consideration. The results for vertical displacements versus time are illustrated in Figure 13.
Figure 13. Results of back-calculation using SSC model: vertical displacements.
Adam
103
Figure 11. Results of the large scale field trial to investigate the performance of the floating stone columns foundation beneath the access
ramp (Gäb et al. 2007).
1.6.1 Short description of numerical and constitu-tive models
Considering the ground conditions a 3D model would be required to capture the inclined layers of soil in detail. However, for this preliminary study a cross section through the middle of the west building was taken postulating plane strain conditions (see Figure 12). The stone columns were modelled as “walls” with depths of 14.5 m on the left side and 10.5 m on the right side respectively. The space between the stone columns is 0.9 m. Figure 12 also shows the dif-ferent soil layers according to Figure 2. It is noted that for simplicity the layers were assumed as hori-zontal. The rock (quartz phyllite) was not modelled, because its influence on the settlement behaviour could be considered negligible. Around the stone columns a zone was introduced in which the material properties have been adjusted. In this sand layer (“Sand dense”) the stiffness has been increased due to significant compaction of the originally loose sand during the installation of the columns. The Soft Soil Creep model (SSC) was used for this study which
Figure 12. Cross section and 2D numerical model. is an extension of the so-called Soft Soil model, both available in model library of the finite element code Plaxis (Brinkgreve et al. 2006). The Soft Soil Creep model is based on the approach proposed by Bjerrum (1967) and Janbu (1967) and considers time and strain rate effects. Thus, the total strain consists of a time independent elastic part and a time dependent visco-plastic part. The creep effects are introduced by the modified creep index µ*, which is related to the creep index Cα. The constitutive parameters required for the SSC model are the modified compression in-dex λ*, the modified swelling index κ*, the modified
Table 2: Material parameters for soil layers.
kx ky γ γ c φ Ψ ν κ* λ* µ* OCR K0,nc [m/s] [m/s] [kN/m²] [kN/m²] [kN/m2] [°] [°] [-] [-] [-] [-] [-] [-]
Upper Clay 2.6E-9 7.9E-9 16 19 10 22.5 0 0.2 0.0053 0.028 0.0009 1.3 0.617 Lower Clay 2.4E-8 2.3E-7 16 19 10 22.5 0 0.2 0.005 0.026 0.00085 1.3 0.617 kx ky γ γ c φ Ψ ν E50
ref Eoedref Eur
ref m OCR K0,nc [m/s] [m/s] [kN/m²] [kN/m²] [kN/m2] [°] [°] [-] [MN/m²] [MN/m²] [MN/m²] [-] [-] [-]
Loose sand 1E-5 1E-5 18 21 0.1 27.5 2 0.2 16 16 80 0.55 1 0.538 Dense sand 1E-5 1E-5 18 21 0.1 27.5 2 0.2 40 40 120 0.65 1 0.538 Stone columns 1E-5 1E-5 20 23.5 0.1 35 5 0.2 250 25 75 0.3 1 0.426 Gravel 1E-5 1E-5 20 20 0.1 35 0 35 35 105 0.5 1 0.426 Concrete slab - - 25 - - - - 0.2 3E7 - - - 1 -
creep index µ*, the friction angle φ', cohesion c', di-latancy angle ψ, Possions's ratio ν and coefficient of earth pressure at rest K0,nc. These parameters can be determined by standard triaxial and oedometer tests. A detailed description of the model can be found in (Vermeer and Neher 2000). The Soft Soil Creep model was used for the clayey silt layers, for all other soil layers and the stone columns the Plaxis Harden-ing Soil model (Brinkgreve et al. 2006) was used. The parameters are summarized in Table 2.
1.6.2 Results of numerical back-analysis Results from the numerical back-analysis are com-pared to the measurements of points (1007/1008 (A10) - 1009/1010 (A11) and 1014/1015 (A6) - 1016/1017 (A7)) according to Figure 13. These data correspond to the simulated vertical displacement of points A and B (Figure 12). Furthermore, available extensometer measurements (EX1) are taken into consideration. The results for vertical displacements versus time are illustrated in Figure 13.
Figure 13. Results of back-calculation using SSC model: vertical displacements.
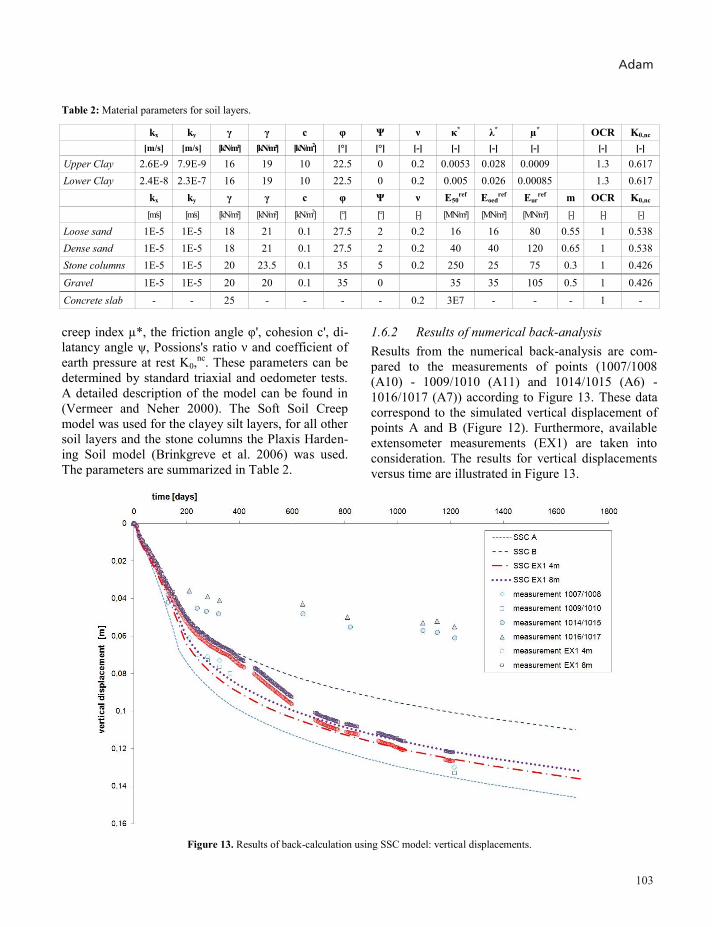
Geotechnical Engineering for Infrastructure and Development
102
Figure 11. Results of the large scale field trial to investigate the performance of the floating stone columns foundation beneath the access
ramp (Gäb et al. 2007).
1.6.1 Short description of numerical and constitu-tive models
Considering the ground conditions a 3D model would be required to capture the inclined layers of soil in detail. However, for this preliminary study a cross section through the middle of the west building was taken postulating plane strain conditions (see Figure 12). The stone columns were modelled as “walls” with depths of 14.5 m on the left side and 10.5 m on the right side respectively. The space between the stone columns is 0.9 m. Figure 12 also shows the dif-ferent soil layers according to Figure 2. It is noted that for simplicity the layers were assumed as hori-zontal. The rock (quartz phyllite) was not modelled, because its influence on the settlement behaviour could be considered negligible. Around the stone columns a zone was introduced in which the material properties have been adjusted. In this sand layer (“Sand dense”) the stiffness has been increased due to significant compaction of the originally loose sand during the installation of the columns. The Soft Soil Creep model (SSC) was used for this study which
Figure 12. Cross section and 2D numerical model. is an extension of the so-called Soft Soil model, both available in model library of the finite element code Plaxis (Brinkgreve et al. 2006). The Soft Soil Creep model is based on the approach proposed by Bjerrum (1967) and Janbu (1967) and considers time and strain rate effects. Thus, the total strain consists of a time independent elastic part and a time dependent visco-plastic part. The creep effects are introduced by the modified creep index µ*, which is related to the creep index Cα. The constitutive parameters required for the SSC model are the modified compression in-dex λ*, the modified swelling index κ*, the modified
Table 2: Material parameters for soil layers.
kx ky γ γ c φ Ψ ν κ* λ* µ* OCR K0,nc [m/s] [m/s] [kN/m²] [kN/m²] [kN/m2] [°] [°] [-] [-] [-] [-] [-] [-]
Upper Clay 2.6E-9 7.9E-9 16 19 10 22.5 0 0.2 0.0053 0.028 0.0009 1.3 0.617 Lower Clay 2.4E-8 2.3E-7 16 19 10 22.5 0 0.2 0.005 0.026 0.00085 1.3 0.617 kx ky γ γ c φ Ψ ν E50
ref Eoedref Eur
ref m OCR K0,nc [m/s] [m/s] [kN/m²] [kN/m²] [kN/m2] [°] [°] [-] [MN/m²] [MN/m²] [MN/m²] [-] [-] [-]
Loose sand 1E-5 1E-5 18 21 0.1 27.5 2 0.2 16 16 80 0.55 1 0.538 Dense sand 1E-5 1E-5 18 21 0.1 27.5 2 0.2 40 40 120 0.65 1 0.538 Stone columns 1E-5 1E-5 20 23.5 0.1 35 5 0.2 250 25 75 0.3 1 0.426 Gravel 1E-5 1E-5 20 20 0.1 35 0 35 35 105 0.5 1 0.426 Concrete slab - - 25 - - - - 0.2 3E7 - - - 1 -
creep index µ*, the friction angle φ', cohesion c', di-latancy angle ψ, Possions's ratio ν and coefficient of earth pressure at rest K0,nc. These parameters can be determined by standard triaxial and oedometer tests. A detailed description of the model can be found in (Vermeer and Neher 2000). The Soft Soil Creep model was used for the clayey silt layers, for all other soil layers and the stone columns the Plaxis Harden-ing Soil model (Brinkgreve et al. 2006) was used. The parameters are summarized in Table 2.
1.6.2 Results of numerical back-analysis Results from the numerical back-analysis are com-pared to the measurements of points (1007/1008 (A10) - 1009/1010 (A11) and 1014/1015 (A6) - 1016/1017 (A7)) according to Figure 13. These data correspond to the simulated vertical displacement of points A and B (Figure 12). Furthermore, available extensometer measurements (EX1) are taken into consideration. The results for vertical displacements versus time are illustrated in Figure 13.
Figure 13. Results of back-calculation using SSC model: vertical displacements.
Adam
103
Figure 11. Results of the large scale field trial to investigate the performance of the floating stone columns foundation beneath the access
ramp (Gäb et al. 2007).
1.6.1 Short description of numerical and constitu-tive models
Considering the ground conditions a 3D model would be required to capture the inclined layers of soil in detail. However, for this preliminary study a cross section through the middle of the west building was taken postulating plane strain conditions (see Figure 12). The stone columns were modelled as “walls” with depths of 14.5 m on the left side and 10.5 m on the right side respectively. The space between the stone columns is 0.9 m. Figure 12 also shows the dif-ferent soil layers according to Figure 2. It is noted that for simplicity the layers were assumed as hori-zontal. The rock (quartz phyllite) was not modelled, because its influence on the settlement behaviour could be considered negligible. Around the stone columns a zone was introduced in which the material properties have been adjusted. In this sand layer (“Sand dense”) the stiffness has been increased due to significant compaction of the originally loose sand during the installation of the columns. The Soft Soil Creep model (SSC) was used for this study which
Figure 12. Cross section and 2D numerical model. is an extension of the so-called Soft Soil model, both available in model library of the finite element code Plaxis (Brinkgreve et al. 2006). The Soft Soil Creep model is based on the approach proposed by Bjerrum (1967) and Janbu (1967) and considers time and strain rate effects. Thus, the total strain consists of a time independent elastic part and a time dependent visco-plastic part. The creep effects are introduced by the modified creep index µ*, which is related to the creep index Cα. The constitutive parameters required for the SSC model are the modified compression in-dex λ*, the modified swelling index κ*, the modified
Table 2: Material parameters for soil layers.
kx ky γ γ c φ Ψ ν κ* λ* µ* OCR K0,nc [m/s] [m/s] [kN/m²] [kN/m²] [kN/m2] [°] [°] [-] [-] [-] [-] [-] [-]
Upper Clay 2.6E-9 7.9E-9 16 19 10 22.5 0 0.2 0.0053 0.028 0.0009 1.3 0.617 Lower Clay 2.4E-8 2.3E-7 16 19 10 22.5 0 0.2 0.005 0.026 0.00085 1.3 0.617 kx ky γ γ c φ Ψ ν E50
ref Eoedref Eur
ref m OCR K0,nc [m/s] [m/s] [kN/m²] [kN/m²] [kN/m2] [°] [°] [-] [MN/m²] [MN/m²] [MN/m²] [-] [-] [-]
Loose sand 1E-5 1E-5 18 21 0.1 27.5 2 0.2 16 16 80 0.55 1 0.538 Dense sand 1E-5 1E-5 18 21 0.1 27.5 2 0.2 40 40 120 0.65 1 0.538 Stone columns 1E-5 1E-5 20 23.5 0.1 35 5 0.2 250 25 75 0.3 1 0.426 Gravel 1E-5 1E-5 20 20 0.1 35 0 35 35 105 0.5 1 0.426 Concrete slab - - 25 - - - - 0.2 3E7 - - - 1 -
creep index µ*, the friction angle φ', cohesion c', di-latancy angle ψ, Possions's ratio ν and coefficient of earth pressure at rest K0,nc. These parameters can be determined by standard triaxial and oedometer tests. A detailed description of the model can be found in (Vermeer and Neher 2000). The Soft Soil Creep model was used for the clayey silt layers, for all other soil layers and the stone columns the Plaxis Harden-ing Soil model (Brinkgreve et al. 2006) was used. The parameters are summarized in Table 2.
1.6.2 Results of numerical back-analysis Results from the numerical back-analysis are com-pared to the measurements of points (1007/1008 (A10) - 1009/1010 (A11) and 1014/1015 (A6) - 1016/1017 (A7)) according to Figure 13. These data correspond to the simulated vertical displacement of points A and B (Figure 12). Furthermore, available extensometer measurements (EX1) are taken into consideration. The results for vertical displacements versus time are illustrated in Figure 13.
Figure 13. Results of back-calculation using SSC model: vertical displacements.
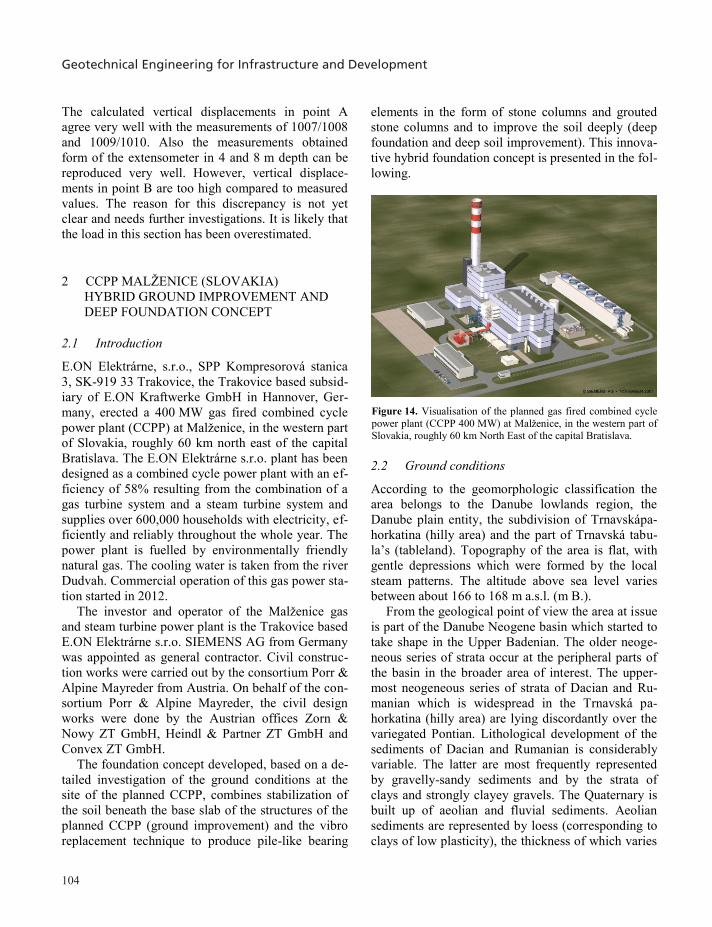
Geotechnical Engineering for Infrastructure and Development
104
The calculated vertical displacements in point A agree very well with the measurements of 1007/1008 and 1009/1010. Also the measurements obtained form of the extensometer in 4 and 8 m depth can be reproduced very well. However, vertical displace-ments in point B are too high compared to measured values. The reason for this discrepancy is not yet clear and needs further investigations. It is likely that the load in this section has been overestimated.
2 CCPP MALŽENICE (SLOVAKIA) HYBRID GROUND IMPROVEMENT AND DEEP FOUNDATION CONCEPT
2.1 Introduction
E.ON Elektrárne, s.r.o., SPP Kompresorová stanica 3, SK-919 33 Trakovice, the Trakovice based subsid-iary of E.ON Kraftwerke GmbH in Hannover, Ger-many, erected a 400 MW gas fired combined cycle power plant (CCPP) at Malženice, in the western part of Slovakia, roughly 60 km north east of the capital Bratislava. The E.ON Elektrárne s.r.o. plant has been designed as a combined cycle power plant with an ef-ficiency of 58% resulting from the combination of a gas turbine system and a steam turbine system and supplies over 600,000 households with electricity, ef-ficiently and reliably throughout the whole year. The power plant is fuelled by environmentally friendly natural gas. The cooling water is taken from the river Dudvah. Commercial operation of this gas power sta-tion started in 2012.
The investor and operator of the Malženice gas and steam turbine power plant is the Trakovice based E.ON Elektrárne s.r.o. SIEMENS AG from Germany was appointed as general contractor. Civil construc-tion works were carried out by the consortium Porr & Alpine Mayreder from Austria. On behalf of the con-sortium Porr & Alpine Mayreder, the civil design works were done by the Austrian offices Zorn & Nowy ZT GmbH, Heindl & Partner ZT GmbH and Convex ZT GmbH.
The foundation concept developed, based on a de-tailed investigation of the ground conditions at the site of the planned CCPP, combines stabilization of the soil beneath the base slab of the structures of the planned CCPP (ground improvement) and the vibro replacement technique to produce pile-like bearing
elements in the form of stone columns and grouted stone columns and to improve the soil deeply (deep foundation and deep soil improvement). This innova-tive hybrid foundation concept is presented in the fol-lowing.
2.2 Ground conditions
According to the geomorphologic classification the area belongs to the Danube lowlands region, the Danube plain entity, the subdivision of Trnavskápa-horkatina (hilly area) and the part of Trnavská tabu-la’s (tableland). Topography of the area is flat, with gentle depressions which were formed by the local steam patterns. The altitude above sea level varies between about 166 to 168 m a.s.l. (m B.).
From the geological point of view the area at issue is part of the Danube Neogene basin which started to take shape in the Upper Badenian. The older neoge-neous series of strata occur at the peripheral parts of the basin in the broader area of interest. The upper-most neogeneous series of strata of Dacian and Ru-manian which is widespread in the Trnavská pa-horkatina (hilly area) are lying discordantly over the variegated Pontian. Lithological development of the sediments of Dacian and Rumanian is considerably variable. The latter are most frequently represented by gravelly-sandy sediments and by the strata of clays and strongly clayey gravels. The Quaternary is built up of aeolian and fluvial sediments. Aeolian sediments are represented by loess (corresponding to clays of low plasticity), the thickness of which varies
Figure 14. Visualisation of the planned gas fired combined cycle power plant (CCPP 400 MW) at Malženice, in the western part of Slovakia, roughly 60 km North East of the capital Bratislava.
depending on the morphology of the sub-base. The loess was blown in the Pleistocene on the pre-existing hilly surface. They are of light-yellow to light-brown colour, considerably monotonous, with sporadic content of fine sand. They often include the calcareous concretions of size mainly 1-2 cm, spo-radically however even larger. Calcium carbonate imparts stability to the loess, which has a characteris-tic vertical jointing. Among the characteristics of lo-ess is collapsibility. In the deeper horizons the amount of the clayey fraction increases.
Almost the entire area is covered on the surface by the loess which, from the point of view of groundwa-ter occurrence, is significant. Under the loess occurs the gravelly-sandy complex of strata of the Upper Pliocene and Quaternary, probably alluvium of river Váh, which is well water-saturated. It is represented by gravels and sands which frequently alternate, par-ticularly in the horizontal direction. The thickness of the water-saturated complex of strata is several me-ters.
The gravelly-sandy series of strata forms the vast groundwater reservoir with unconfined as well as confined water level. Groundwater resources of the gravelly-sandy aquifer are recharged by the infiltra-tion of precipitation from the region of Malé Karpaty (Little Carpathian Mts.) and by infiltration from the water sources which are locally cut down into the gravelly-sandy sediments.
The detailed ground conditions at the site of the planned power plant were explored in summer 2008. The results and conclusions of geological investiga-tions carried out in the past in the vicinity of the area of interest were also taken into account. The soil in-vestigations comprised field investigations in the form of exploration pits, core drillings, standard pen-etration tests in the boreholes (SPT), heavy dynamic probing (DPH), penetration tests (CPT) and cross-hole seismic measurements, and soil mechanics and chemical laboratory tests. The main findings regard-ing the stratigraphy and soil conditions are concluded in the following.
Agriculture soil, anthropogenic backfills and fills (layer complex A) have been found up to a depth of
about 1 m below the ground level of the nearly hori-zontal site (top between about 167 m and 168 m B.).
Below the anthropogenic backfills and fills are ae-olian sediments in the form of loess and loess loams (layer complex B) up to about 14 m to 16 m b.g.l. (Note: m b.g.l. = meter below ground level). Sandy-clayey silt with medium plasticity and lime concre-tions up to 40 mm prevail in the lower horizon. In the transition zone to the alluvial sediments beneath sandy, stiff to very stiff clay with lime concretions up to 80 mm are found. The loess soil complex can be subdivided on the basis of macroscopic evaluations, laboratory tests and penetration tests into several ho-rizons.
The first loess horizon of aeolian sediments tends to be collapsible and was found across the entire in-vestigation area up to a maximum depth of about 6 m b.g.l. They consist of clay of low plasticity and hard to stiff consistency, and occasionally of loam of low plasticity and hard to stiff consistency.
The second loess horizon was also found across the entire investigation area at depths 3 to 6 m b.g.l. to 9 to 11 m b.g.l. They consist of aeolian sediments represented by clay of low plasticity and hard to stiff consistency, and by loam of low plasticity and hard to, sporadically, stiff consistency.
It is necessary to point out that the aeolian sedi-ments of the first and second loess horizons are col-lapsible. This property was confirmed by the results of laboratory tests carried out on undisturbed soil samples and indirectly by the low bulk density and high porosity of the loess(loam)s. The loess texture was even disturbed by higher load, i.e. they have col-lapsed without additional wetting.
Under the loess sediments, but above the gravel layer complex, at depths of about 9 to 10 m b.g.l. through 13 to 18 m b.g.l. were found degraded lo-esses consisting mainly of clay of low and intermedi-ate plasticity and hard to stiff consistency, and, spo-radically, of loam of low plasticity and hard to stiff consistency. Typical for this horizon is the occur-rence of CaCO3 nodules and strongly calcareous in-tercalations, the amount of which increases with depth.
Adam
105
The calculated vertical displacements in point A agree very well with the measurements of 1007/1008 and 1009/1010. Also the measurements obtained form of the extensometer in 4 and 8 m depth can be reproduced very well. However, vertical displace-ments in point B are too high compared to measured values. The reason for this discrepancy is not yet clear and needs further investigations. It is likely that the load in this section has been overestimated.
2 CCPP MALŽENICE (SLOVAKIA) HYBRID GROUND IMPROVEMENT AND DEEP FOUNDATION CONCEPT
2.1 Introduction
E.ON Elektrárne, s.r.o., SPP Kompresorová stanica 3, SK-919 33 Trakovice, the Trakovice based subsid-iary of E.ON Kraftwerke GmbH in Hannover, Ger-many, erected a 400 MW gas fired combined cycle power plant (CCPP) at Malženice, in the western part of Slovakia, roughly 60 km north east of the capital Bratislava. The E.ON Elektrárne s.r.o. plant has been designed as a combined cycle power plant with an ef-ficiency of 58% resulting from the combination of a gas turbine system and a steam turbine system and supplies over 600,000 households with electricity, ef-ficiently and reliably throughout the whole year. The power plant is fuelled by environmentally friendly natural gas. The cooling water is taken from the river Dudvah. Commercial operation of this gas power sta-tion started in 2012.
The investor and operator of the Malženice gas and steam turbine power plant is the Trakovice based E.ON Elektrárne s.r.o. SIEMENS AG from Germany was appointed as general contractor. Civil construc-tion works were carried out by the consortium Porr & Alpine Mayreder from Austria. On behalf of the con-sortium Porr & Alpine Mayreder, the civil design works were done by the Austrian offices Zorn & Nowy ZT GmbH, Heindl & Partner ZT GmbH and Convex ZT GmbH.
The foundation concept developed, based on a de-tailed investigation of the ground conditions at the site of the planned CCPP, combines stabilization of the soil beneath the base slab of the structures of the planned CCPP (ground improvement) and the vibro replacement technique to produce pile-like bearing
elements in the form of stone columns and grouted stone columns and to improve the soil deeply (deep foundation and deep soil improvement). This innova-tive hybrid foundation concept is presented in the fol-lowing.
2.2 Ground conditions
According to the geomorphologic classification the area belongs to the Danube lowlands region, the Danube plain entity, the subdivision of Trnavskápa-horkatina (hilly area) and the part of Trnavská tabu-la’s (tableland). Topography of the area is flat, with gentle depressions which were formed by the local steam patterns. The altitude above sea level varies between about 166 to 168 m a.s.l. (m B.).
From the geological point of view the area at issue is part of the Danube Neogene basin which started to take shape in the Upper Badenian. The older neoge-neous series of strata occur at the peripheral parts of the basin in the broader area of interest. The upper-most neogeneous series of strata of Dacian and Ru-manian which is widespread in the Trnavská pa-horkatina (hilly area) are lying discordantly over the variegated Pontian. Lithological development of the sediments of Dacian and Rumanian is considerably variable. The latter are most frequently represented by gravelly-sandy sediments and by the strata of clays and strongly clayey gravels. The Quaternary is built up of aeolian and fluvial sediments. Aeolian sediments are represented by loess (corresponding to clays of low plasticity), the thickness of which varies
Figure 14. Visualisation of the planned gas fired combined cycle power plant (CCPP 400 MW) at Malženice, in the western part of Slovakia, roughly 60 km North East of the capital Bratislava.
depending on the morphology of the sub-base. The loess was blown in the Pleistocene on the pre-existing hilly surface. They are of light-yellow to light-brown colour, considerably monotonous, with sporadic content of fine sand. They often include the calcareous concretions of size mainly 1-2 cm, spo-radically however even larger. Calcium carbonate imparts stability to the loess, which has a characteris-tic vertical jointing. Among the characteristics of lo-ess is collapsibility. In the deeper horizons the amount of the clayey fraction increases.
Almost the entire area is covered on the surface by the loess which, from the point of view of groundwa-ter occurrence, is significant. Under the loess occurs the gravelly-sandy complex of strata of the Upper Pliocene and Quaternary, probably alluvium of river Váh, which is well water-saturated. It is represented by gravels and sands which frequently alternate, par-ticularly in the horizontal direction. The thickness of the water-saturated complex of strata is several me-ters.
The gravelly-sandy series of strata forms the vast groundwater reservoir with unconfined as well as confined water level. Groundwater resources of the gravelly-sandy aquifer are recharged by the infiltra-tion of precipitation from the region of Malé Karpaty (Little Carpathian Mts.) and by infiltration from the water sources which are locally cut down into the gravelly-sandy sediments.
The detailed ground conditions at the site of the planned power plant were explored in summer 2008. The results and conclusions of geological investiga-tions carried out in the past in the vicinity of the area of interest were also taken into account. The soil in-vestigations comprised field investigations in the form of exploration pits, core drillings, standard pen-etration tests in the boreholes (SPT), heavy dynamic probing (DPH), penetration tests (CPT) and cross-hole seismic measurements, and soil mechanics and chemical laboratory tests. The main findings regard-ing the stratigraphy and soil conditions are concluded in the following.
Agriculture soil, anthropogenic backfills and fills (layer complex A) have been found up to a depth of
about 1 m below the ground level of the nearly hori-zontal site (top between about 167 m and 168 m B.).
Below the anthropogenic backfills and fills are ae-olian sediments in the form of loess and loess loams (layer complex B) up to about 14 m to 16 m b.g.l. (Note: m b.g.l. = meter below ground level). Sandy-clayey silt with medium plasticity and lime concre-tions up to 40 mm prevail in the lower horizon. In the transition zone to the alluvial sediments beneath sandy, stiff to very stiff clay with lime concretions up to 80 mm are found. The loess soil complex can be subdivided on the basis of macroscopic evaluations, laboratory tests and penetration tests into several ho-rizons.
The first loess horizon of aeolian sediments tends to be collapsible and was found across the entire in-vestigation area up to a maximum depth of about 6 m b.g.l. They consist of clay of low plasticity and hard to stiff consistency, and occasionally of loam of low plasticity and hard to stiff consistency.
The second loess horizon was also found across the entire investigation area at depths 3 to 6 m b.g.l. to 9 to 11 m b.g.l. They consist of aeolian sediments represented by clay of low plasticity and hard to stiff consistency, and by loam of low plasticity and hard to, sporadically, stiff consistency.
It is necessary to point out that the aeolian sedi-ments of the first and second loess horizons are col-lapsible. This property was confirmed by the results of laboratory tests carried out on undisturbed soil samples and indirectly by the low bulk density and high porosity of the loess(loam)s. The loess texture was even disturbed by higher load, i.e. they have col-lapsed without additional wetting.
Under the loess sediments, but above the gravel layer complex, at depths of about 9 to 10 m b.g.l. through 13 to 18 m b.g.l. were found degraded lo-esses consisting mainly of clay of low and intermedi-ate plasticity and hard to stiff consistency, and, spo-radically, of loam of low plasticity and hard to stiff consistency. Typical for this horizon is the occur-rence of CaCO3 nodules and strongly calcareous in-tercalations, the amount of which increases with depth.
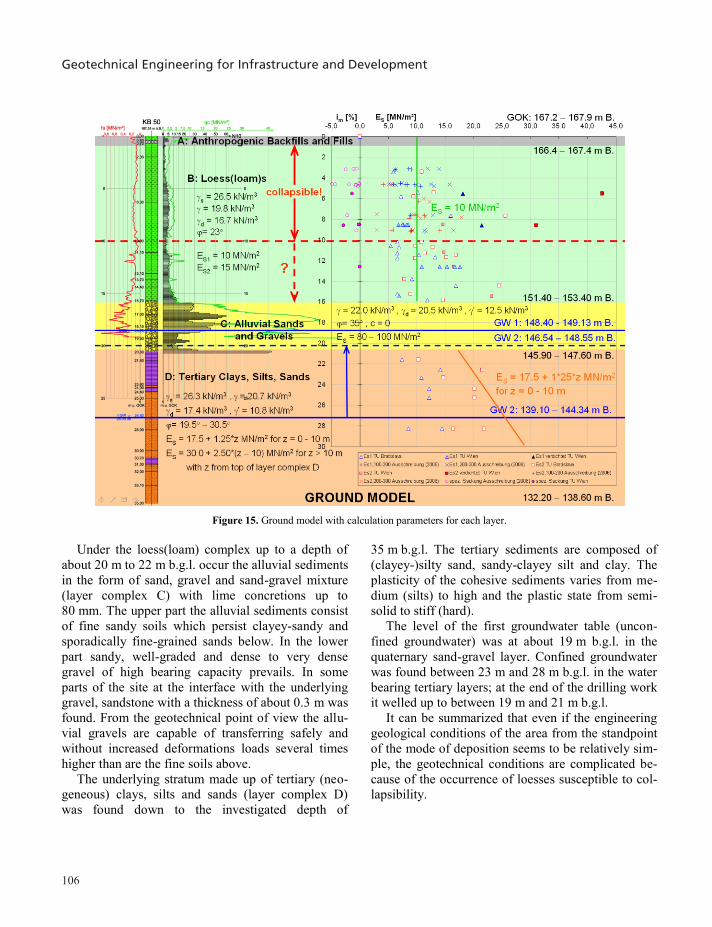
Geotechnical Engineering for Infrastructure and Development
106
Figure 15. Ground model with calculation parameters for each layer.
Under the loess(loam) complex up to a depth of
about 20 m to 22 m b.g.l. occur the alluvial sediments in the form of sand, gravel and sand-gravel mixture (layer complex C) with lime concretions up to 80 mm. The upper part the alluvial sediments consist of fine sandy soils which persist clayey-sandy and sporadically fine-grained sands below. In the lower part sandy, well-graded and dense to very dense gravel of high bearing capacity prevails. In some parts of the site at the interface with the underlying gravel, sandstone with a thickness of about 0.3 m was found. From the geotechnical point of view the allu-vial gravels are capable of transferring safely and without increased deformations loads several times higher than are the fine soils above.
The underlying stratum made up of tertiary (neo-geneous) clays, silts and sands (layer complex D) was found down to the investigated depth of
35 m b.g.l. The tertiary sediments are composed of (clayey-)silty sand, sandy-clayey silt and clay. The plasticity of the cohesive sediments varies from me-dium (silts) to high and the plastic state from semi-solid to stiff (hard).
The level of the first groundwater table (uncon-fined groundwater) was at about 19 m b.g.l. in the quaternary sand-gravel layer. Confined groundwater was found between 23 m and 28 m b.g.l. in the water bearing tertiary layers; at the end of the drilling work it welled up to between 19 m and 21 m b.g.l.
It can be summarized that even if the engineering geological conditions of the area from the standpoint of the mode of deposition seems to be relatively sim-ple, the geotechnical conditions are complicated be-cause of the occurrence of loesses susceptible to col-lapsibility.
2.3 Original foundation concept
The original foundation concept developed for the heavyweight structures on schematic layouts of the planned power plant comprised the following two foundation methods: Original foundation concept A – shallow
(spread) foundations on foundation plates (rafts) and, in the case of lightweight structures, on strip footing or on individual columns (pad);
Original foundation concept B – deep foundation by transferring the entire, mainly dynamic load (action) into the bearing (load resistant) gravelly soils of the layer complex C. It was recommend-ed to transfer the operable load of individual structures by means of wide-section piles em-bedded on dense or medium dense gravelly soils as the underlying neogeneous clays are charac-terized by a severalfold lower bearing capacity. Additional investigations revealed that piles had to be embedded deeply within the tertiary sedi-ments, thus pile lengths of about 35 m were nec-essary due to negative skin friction in the col-lapsible loess(loam) layer complex.
2.4 Innovative hybrid ground improvement and deep foundation concept
The foundation measures for the structures of the CCPP 400 MW included deep dynamic compaction in the form of deep dynamic replacement compaction of the subsoil beneath the foundations by the deep vibro replacement technique (VRT) to produce pile-like bearing elements and to improve the soil at depth during the vibration process and stabilization of the soil above the grouted stone columns and stone col-umns with a lime cement binder (hybrid foundation).
In respect of the static soil pressures, grouted stone columns (foundation concept I) and stone col-umns (foundation concept II) were produced.
Foundation concept I, which combined the deep vibro replacement technique (VRT) to produce pile-similar bearing elements (grouted stone columns, VSS) with soil stabilization beneath the foundations, was carried out for the heavyweight structures. The area improved by the VSS elements exceeded the slabs by about 2 m on each side. The area of the grid was defined in by the static soil pressure within the following range:
min. 1.4 m x 1.4 m = 1.96 m² max. 2.2 m x 2.2 m = 4.84 m²
The calculated diameter of the grouted stone col-umns (minimum diameter) was defined as 0.60 m. The thickness of the stabilized soil package varied between about 2 and 3 m.
Foundation concept II, which combined the deep vibro replacement technique (VRT) to produce stone columns (SS) with soil stabilization beneath the foundation slabs, was carried out for lightweight structures. The area improved by the SS elements ex-ceeded the slabs by about 2 m on each side. The area of the grid was defined by the static soil pressure within the following range:
min. 1.4 m x 1.4 m = 1.96 m² max. 2.5 m x 2.5 m = 6.25 m²
The calculated diameter of the stone columns (minimum diameter) was defined with 0.60 m. The thickness of the stabilized soil package was about 2 m.
Figure 16. Foundation concept with piles (left) vs. hybrid founda-tion concept based on grouted stone columns (VSS) (right).
Deep vibro replacement was carried out from a
working platform that was situated between 2 and 3 m below the bottom of the base slab of the single structures. After the excavation of the soil to the re-quired depth, the excavation level was stabilized with a lime-cement binder to a depth of about 0.5 m. Af-terwards the points for the deep vibro replacement process were pre-drilled down to the surface of the quaternary gravel using a continuous flight auger. In the pre-drilled replacement points the grouted stone columns (VSS) or stone columns (SS) were produced
Adam
107
Figure 15. Ground model with calculation parameters for each layer.
Under the loess(loam) complex up to a depth of
about 20 m to 22 m b.g.l. occur the alluvial sediments in the form of sand, gravel and sand-gravel mixture (layer complex C) with lime concretions up to 80 mm. The upper part the alluvial sediments consist of fine sandy soils which persist clayey-sandy and sporadically fine-grained sands below. In the lower part sandy, well-graded and dense to very dense gravel of high bearing capacity prevails. In some parts of the site at the interface with the underlying gravel, sandstone with a thickness of about 0.3 m was found. From the geotechnical point of view the allu-vial gravels are capable of transferring safely and without increased deformations loads several times higher than are the fine soils above.
The underlying stratum made up of tertiary (neo-geneous) clays, silts and sands (layer complex D) was found down to the investigated depth of
35 m b.g.l. The tertiary sediments are composed of (clayey-)silty sand, sandy-clayey silt and clay. The plasticity of the cohesive sediments varies from me-dium (silts) to high and the plastic state from semi-solid to stiff (hard).
The level of the first groundwater table (uncon-fined groundwater) was at about 19 m b.g.l. in the quaternary sand-gravel layer. Confined groundwater was found between 23 m and 28 m b.g.l. in the water bearing tertiary layers; at the end of the drilling work it welled up to between 19 m and 21 m b.g.l.
It can be summarized that even if the engineering geological conditions of the area from the standpoint of the mode of deposition seems to be relatively sim-ple, the geotechnical conditions are complicated be-cause of the occurrence of loesses susceptible to col-lapsibility.
2.3 Original foundation concept
The original foundation concept developed for the heavyweight structures on schematic layouts of the planned power plant comprised the following two foundation methods: Original foundation concept A – shallow
(spread) foundations on foundation plates (rafts) and, in the case of lightweight structures, on strip footing or on individual columns (pad);
Original foundation concept B – deep foundation by transferring the entire, mainly dynamic load (action) into the bearing (load resistant) gravelly soils of the layer complex C. It was recommend-ed to transfer the operable load of individual structures by means of wide-section piles em-bedded on dense or medium dense gravelly soils as the underlying neogeneous clays are charac-terized by a severalfold lower bearing capacity. Additional investigations revealed that piles had to be embedded deeply within the tertiary sedi-ments, thus pile lengths of about 35 m were nec-essary due to negative skin friction in the col-lapsible loess(loam) layer complex.
2.4 Innovative hybrid ground improvement and deep foundation concept
The foundation measures for the structures of the CCPP 400 MW included deep dynamic compaction in the form of deep dynamic replacement compaction of the subsoil beneath the foundations by the deep vibro replacement technique (VRT) to produce pile-like bearing elements and to improve the soil at depth during the vibration process and stabilization of the soil above the grouted stone columns and stone col-umns with a lime cement binder (hybrid foundation).
In respect of the static soil pressures, grouted stone columns (foundation concept I) and stone col-umns (foundation concept II) were produced.
Foundation concept I, which combined the deep vibro replacement technique (VRT) to produce pile-similar bearing elements (grouted stone columns, VSS) with soil stabilization beneath the foundations, was carried out for the heavyweight structures. The area improved by the VSS elements exceeded the slabs by about 2 m on each side. The area of the grid was defined in by the static soil pressure within the following range:
min. 1.4 m x 1.4 m = 1.96 m² max. 2.2 m x 2.2 m = 4.84 m²
The calculated diameter of the grouted stone col-umns (minimum diameter) was defined as 0.60 m. The thickness of the stabilized soil package varied between about 2 and 3 m.
Foundation concept II, which combined the deep vibro replacement technique (VRT) to produce stone columns (SS) with soil stabilization beneath the foundation slabs, was carried out for lightweight structures. The area improved by the SS elements ex-ceeded the slabs by about 2 m on each side. The area of the grid was defined by the static soil pressure within the following range:
min. 1.4 m x 1.4 m = 1.96 m² max. 2.5 m x 2.5 m = 6.25 m²
The calculated diameter of the stone columns (minimum diameter) was defined with 0.60 m. The thickness of the stabilized soil package was about 2 m.
Figure 16. Foundation concept with piles (left) vs. hybrid founda-tion concept based on grouted stone columns (VSS) (right).
Deep vibro replacement was carried out from a
working platform that was situated between 2 and 3 m below the bottom of the base slab of the single structures. After the excavation of the soil to the re-quired depth, the excavation level was stabilized with a lime-cement binder to a depth of about 0.5 m. Af-terwards the points for the deep vibro replacement process were pre-drilled down to the surface of the quaternary gravel using a continuous flight auger. In the pre-drilled replacement points the grouted stone columns (VSS) or stone columns (SS) were produced
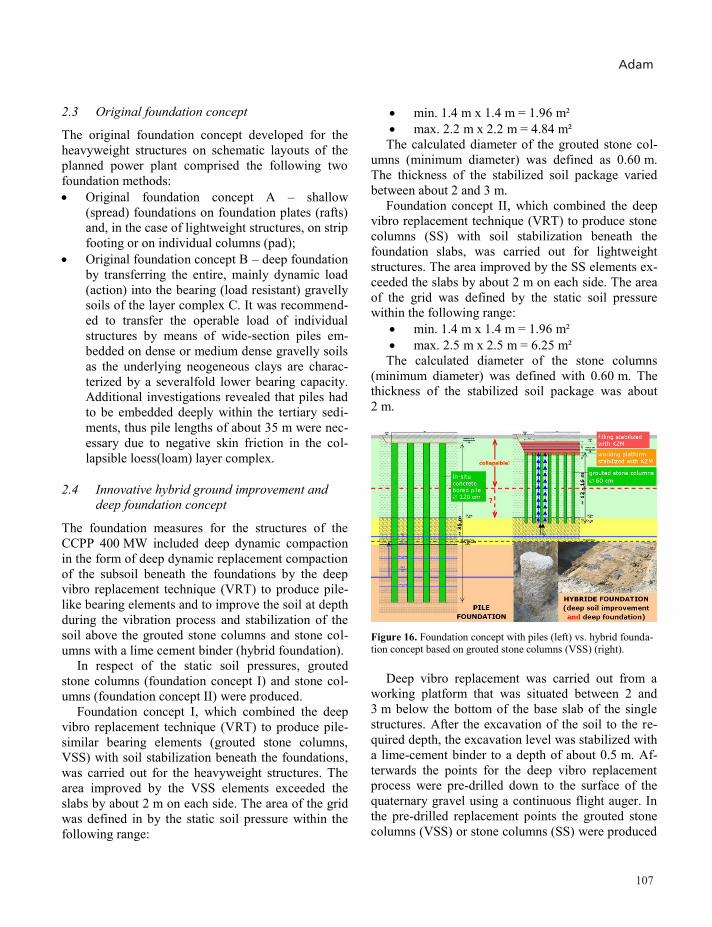
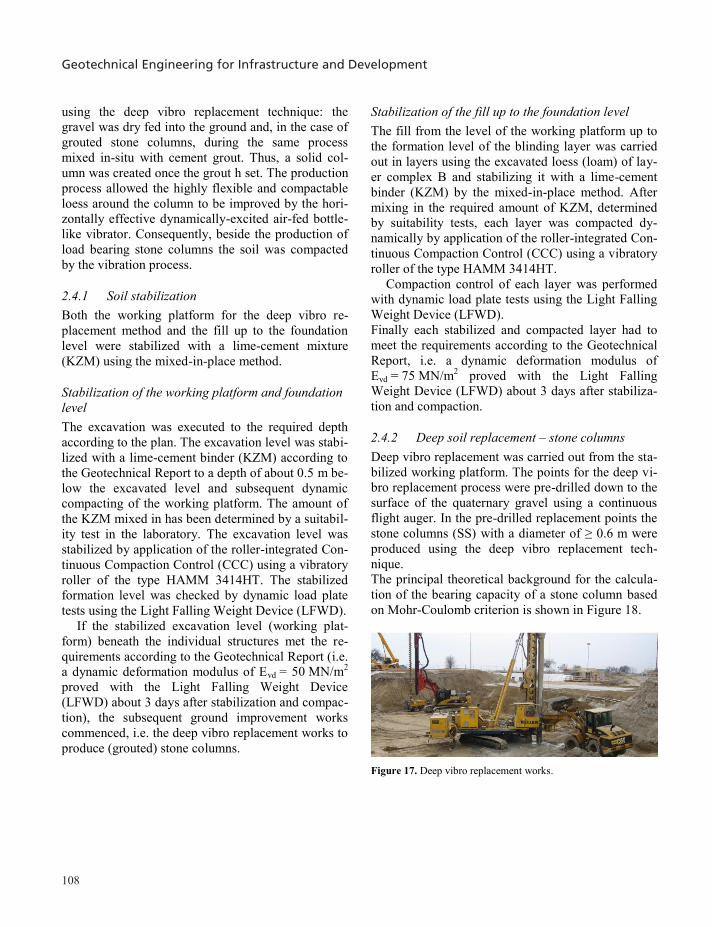
Geotechnical Engineering for Infrastructure and Development
108
using the deep vibro replacement technique: the gravel was dry fed into the ground and, in the case of grouted stone columns, during the same process mixed in-situ with cement grout. Thus, a solid col-umn was created once the grout h set. The production process allowed the highly flexible and compactable loess around the column to be improved by the hori-zontally effective dynamically-excited air-fed bottle-like vibrator. Consequently, beside the production of load bearing stone columns the soil was compacted by the vibration process.
2.4.1 Soil stabilization Both the working platform for the deep vibro re-placement method and the fill up to the foundation level were stabilized with a lime-cement mixture (KZM) using the mixed-in-place method.
Stabilization of the working platform and foundation level The excavation was executed to the required depth according to the plan. The excavation level was stabi-lized with a lime-cement binder (KZM) according to the Geotechnical Report to a depth of about 0.5 m be-low the excavated level and subsequent dynamic compacting of the working platform. The amount of the KZM mixed in has been determined by a suitabil-ity test in the laboratory. The excavation level was stabilized by application of the roller-integrated Con-tinuous Compaction Control (CCC) using a vibratory roller of the type HAMM 3414HT. The stabilized formation level was checked by dynamic load plate tests using the Light Falling Weight Device (LFWD).
If the stabilized excavation level (working plat-form) beneath the individual structures met the re-quirements according to the Geotechnical Report (i.e. a dynamic deformation modulus of Evd = 50 MN/m2 proved with the Light Falling Weight Device (LFWD) about 3 days after stabilization and compac-tion), the subsequent ground improvement works commenced, i.e. the deep vibro replacement works to produce (grouted) stone columns.
Stabilization of the fill up to the foundation level The fill from the level of the working platform up to the formation level of the blinding layer was carried out in layers using the excavated loess (loam) of lay-er complex B and stabilizing it with a lime-cement binder (KZM) by the mixed-in-place method. After mixing in the required amount of KZM, determined by suitability tests, each layer was compacted dy-namically by application of the roller-integrated Con-tinuous Compaction Control (CCC) using a vibratory roller of the type HAMM 3414HT.
Compaction control of each layer was performed with dynamic load plate tests using the Light Falling Weight Device (LFWD). Finally each stabilized and compacted layer had to meet the requirements according to the Geotechnical Report, i.e. a dynamic deformation modulus of Evd = 75 MN/m2 proved with the Light Falling Weight Device (LFWD) about 3 days after stabiliza-tion and compaction.
2.4.2 Deep soil replacement – stone columns Deep vibro replacement was carried out from the sta-bilized working platform. The points for the deep vi-bro replacement process were pre-drilled down to the surface of the quaternary gravel using a continuous flight auger. In the pre-drilled replacement points the stone columns (SS) with a diameter of ≥ 0.6 m were produced using the deep vibro replacement tech-nique. The principal theoretical background for the calcula-tion of the bearing capacity of a stone column based on Mohr-Coulomb criterion is shown in Figure 18.
Figure 17. Deep vibro replacement works.
Figure 18. Bearing capacity of stone columns.
2.4.3 Deep soil replacement – grouted stone col-
umns Deep vibro replacement was carried out from the sta-bilized working platform. The points for the deep vi-bro replacement process were pre-drilled down to the surface of the quaternary gravel using a continuous flight auger. In the pre-drilled replacement points (see Figure 19) the grouted stone columns (VSS) were produced using the deep vibro replacement technique. The gravel was dry fed into the ground and during the same process mixed in-situ with ce-ment grout creating solid columns once the grout had set.
The grouted stone columns (VSS) produced with the deep vibro replacement technique (VRT) are sim-ilar to unreinforced concrete pile bearing elements. Thus, the analysis of the internal load-bearing capaci-ty of the VSS-element (ultimate limit state design, ULS) has to be done for vertical loads only (without bending moments).
At present a method for the ultimate limit state (ULS) design of grouted stone columns (VSS) is not standardized. Therefore the Austrian standard ÖNORM B 4701 „Concrete structures – EURO-CODE-orientated analysis, design and execution“ with partial safety factors (load and resistance factor design, LRFD) has been applied, in which the ULS analysis for unreinforced concrete is regulated ac-cording to the Eurocode design concept.
The improvement of the soil around the columns due to the vibration process (anticipation of collapse
in the soil structure and compaction) combined with the grouted column material (deep foundation ele-ments) characterizes the hybrid foundation concept resulting in significantly shorter deep foundation el-ements.
Figure 19. Pre-drilled replacement point of the (grouted) stone columns (left) and excavated test column (right).
2.5 Foundation works and quality assurance
Foundation works (deep soil improvement and deep foundation) took place from December 2008 to April 2009 and had to be performed in a period of heavy snowfall and low temperatures. Nevertheless the deep foundation works were finished within the de-fined time schedule. Especially for layer-wise stabili-zation the content of the lime-cement binder deter-mined by a suitability test had to be adapted to the actual weather conditions according to the results of the site control measures. The working platform sta-bilized with lime-cement by the mixed-in-place
Adam
109
using the deep vibro replacement technique: the gravel was dry fed into the ground and, in the case of grouted stone columns, during the same process mixed in-situ with cement grout. Thus, a solid col-umn was created once the grout h set. The production process allowed the highly flexible and compactable loess around the column to be improved by the hori-zontally effective dynamically-excited air-fed bottle-like vibrator. Consequently, beside the production of load bearing stone columns the soil was compacted by the vibration process.
2.4.1 Soil stabilization Both the working platform for the deep vibro re-placement method and the fill up to the foundation level were stabilized with a lime-cement mixture (KZM) using the mixed-in-place method.
Stabilization of the working platform and foundation level The excavation was executed to the required depth according to the plan. The excavation level was stabi-lized with a lime-cement binder (KZM) according to the Geotechnical Report to a depth of about 0.5 m be-low the excavated level and subsequent dynamic compacting of the working platform. The amount of the KZM mixed in has been determined by a suitabil-ity test in the laboratory. The excavation level was stabilized by application of the roller-integrated Con-tinuous Compaction Control (CCC) using a vibratory roller of the type HAMM 3414HT. The stabilized formation level was checked by dynamic load plate tests using the Light Falling Weight Device (LFWD).
If the stabilized excavation level (working plat-form) beneath the individual structures met the re-quirements according to the Geotechnical Report (i.e. a dynamic deformation modulus of Evd = 50 MN/m2 proved with the Light Falling Weight Device (LFWD) about 3 days after stabilization and compac-tion), the subsequent ground improvement works commenced, i.e. the deep vibro replacement works to produce (grouted) stone columns.
Stabilization of the fill up to the foundation level The fill from the level of the working platform up to the formation level of the blinding layer was carried out in layers using the excavated loess (loam) of lay-er complex B and stabilizing it with a lime-cement binder (KZM) by the mixed-in-place method. After mixing in the required amount of KZM, determined by suitability tests, each layer was compacted dy-namically by application of the roller-integrated Con-tinuous Compaction Control (CCC) using a vibratory roller of the type HAMM 3414HT.
Compaction control of each layer was performed with dynamic load plate tests using the Light Falling Weight Device (LFWD). Finally each stabilized and compacted layer had to meet the requirements according to the Geotechnical Report, i.e. a dynamic deformation modulus of Evd = 75 MN/m2 proved with the Light Falling Weight Device (LFWD) about 3 days after stabiliza-tion and compaction.
2.4.2 Deep soil replacement – stone columns Deep vibro replacement was carried out from the sta-bilized working platform. The points for the deep vi-bro replacement process were pre-drilled down to the surface of the quaternary gravel using a continuous flight auger. In the pre-drilled replacement points the stone columns (SS) with a diameter of ≥ 0.6 m were produced using the deep vibro replacement tech-nique. The principal theoretical background for the calcula-tion of the bearing capacity of a stone column based on Mohr-Coulomb criterion is shown in Figure 18.
Figure 17. Deep vibro replacement works.
Figure 18. Bearing capacity of stone columns.
2.4.3 Deep soil replacement – grouted stone col-
umns Deep vibro replacement was carried out from the sta-bilized working platform. The points for the deep vi-bro replacement process were pre-drilled down to the surface of the quaternary gravel using a continuous flight auger. In the pre-drilled replacement points (see Figure 19) the grouted stone columns (VSS) were produced using the deep vibro replacement technique. The gravel was dry fed into the ground and during the same process mixed in-situ with ce-ment grout creating solid columns once the grout had set.
The grouted stone columns (VSS) produced with the deep vibro replacement technique (VRT) are sim-ilar to unreinforced concrete pile bearing elements. Thus, the analysis of the internal load-bearing capaci-ty of the VSS-element (ultimate limit state design, ULS) has to be done for vertical loads only (without bending moments).
At present a method for the ultimate limit state (ULS) design of grouted stone columns (VSS) is not standardized. Therefore the Austrian standard ÖNORM B 4701 „Concrete structures – EURO-CODE-orientated analysis, design and execution“ with partial safety factors (load and resistance factor design, LRFD) has been applied, in which the ULS analysis for unreinforced concrete is regulated ac-cording to the Eurocode design concept.
The improvement of the soil around the columns due to the vibration process (anticipation of collapse
in the soil structure and compaction) combined with the grouted column material (deep foundation ele-ments) characterizes the hybrid foundation concept resulting in significantly shorter deep foundation el-ements.
Figure 19. Pre-drilled replacement point of the (grouted) stone columns (left) and excavated test column (right).
2.5 Foundation works and quality assurance
Foundation works (deep soil improvement and deep foundation) took place from December 2008 to April 2009 and had to be performed in a period of heavy snowfall and low temperatures. Nevertheless the deep foundation works were finished within the de-fined time schedule. Especially for layer-wise stabili-zation the content of the lime-cement binder deter-mined by a suitability test had to be adapted to the actual weather conditions according to the results of the site control measures. The working platform sta-bilized with lime-cement by the mixed-in-place
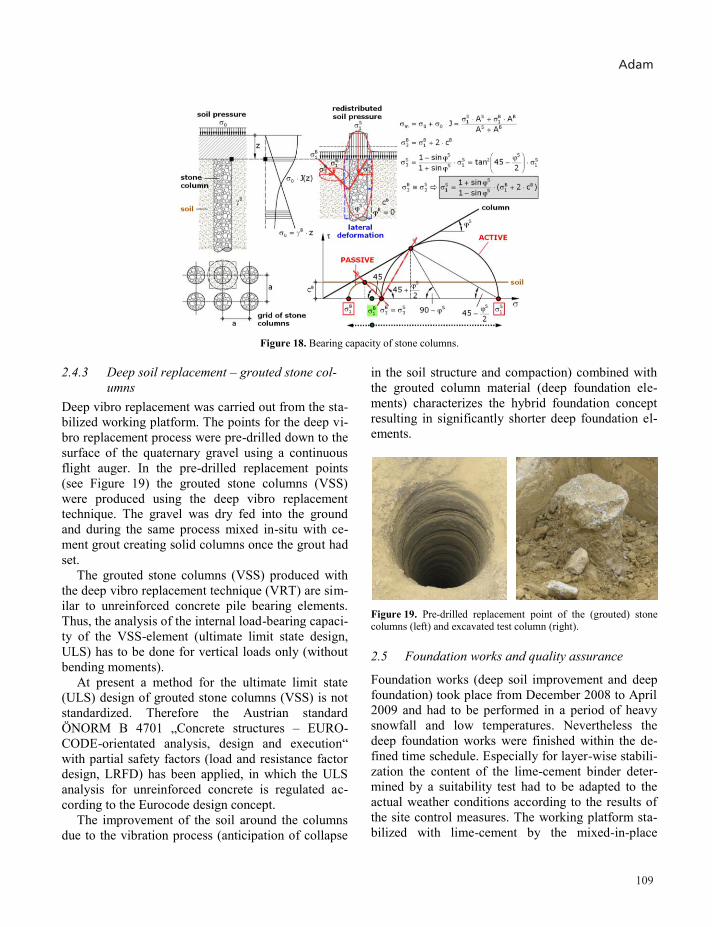
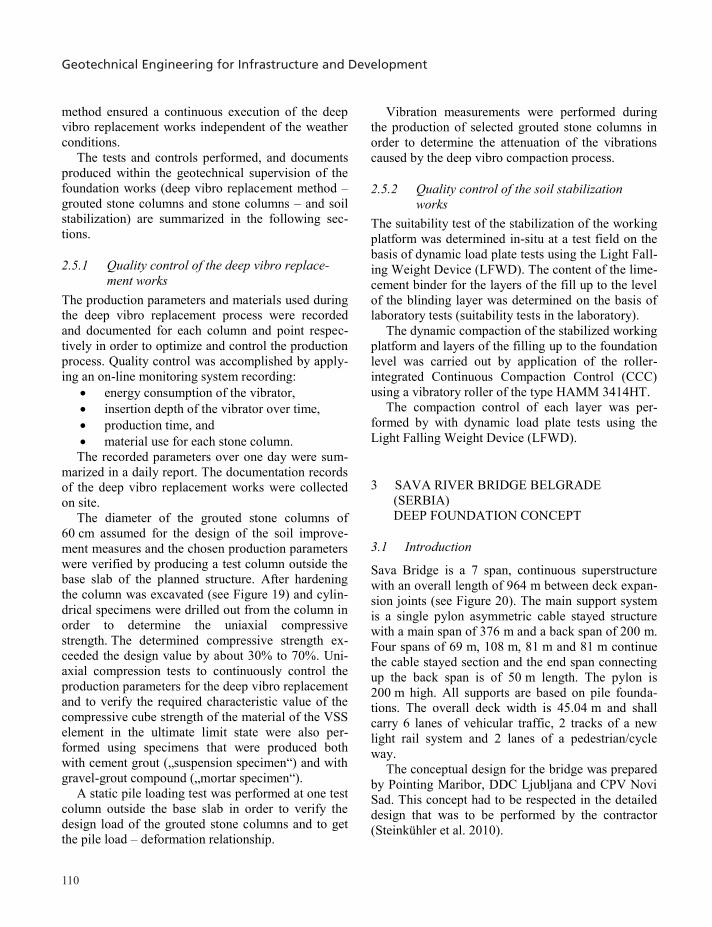
Geotechnical Engineering for Infrastructure and Development
110
method ensured a continuous execution of the deep vibro replacement works independent of the weather conditions.
The tests and controls performed, and documents produced within the geotechnical supervision of the foundation works (deep vibro replacement method – grouted stone columns and stone columns – and soil stabilization) are summarized in the following sec-tions.
2.5.1 Quality control of the deep vibro replace-ment works
The production parameters and materials used during the deep vibro replacement process were recorded and documented for each column and point respec-tively in order to optimize and control the production process. Quality control was accomplished by apply-ing an on-line monitoring system recording:
energy consumption of the vibrator, insertion depth of the vibrator over time, production time, and material use for each stone column.
The recorded parameters over one day were sum-marized in a daily report. The documentation records of the deep vibro replacement works were collected on site.
The diameter of the grouted stone columns of 60 cm assumed for the design of the soil improve-ment measures and the chosen production parameters were verified by producing a test column outside the base slab of the planned structure. After hardening the column was excavated (see Figure 19) and cylin-drical specimens were drilled out from the column in order to determine the uniaxial compressive strength. The determined compressive strength ex-ceeded the design value by about 30% to 70%. Uni-axial compression tests to continuously control the production parameters for the deep vibro replacement and to verify the required characteristic value of the compressive cube strength of the material of the VSS element in the ultimate limit state were also per-formed using specimens that were produced both with cement grout („suspension specimen“) and with gravel-grout compound („mortar specimen“).
A static pile loading test was performed at one test column outside the base slab in order to verify the design load of the grouted stone columns and to get the pile load – deformation relationship.
Vibration measurements were performed during the production of selected grouted stone columns in order to determine the attenuation of the vibrations caused by the deep vibro compaction process.
2.5.2 Quality control of the soil stabilization works
The suitability test of the stabilization of the working platform was determined in-situ at a test field on the basis of dynamic load plate tests using the Light Fall-ing Weight Device (LFWD). The content of the lime-cement binder for the layers of the fill up to the level of the blinding layer was determined on the basis of laboratory tests (suitability tests in the laboratory).
The dynamic compaction of the stabilized working platform and layers of the filling up to the foundation level was carried out by application of the roller-integrated Continuous Compaction Control (CCC) using a vibratory roller of the type HAMM 3414HT.
The compaction control of each layer was per-formed by with dynamic load plate tests using the Light Falling Weight Device (LFWD).
3 SAVA RIVER BRIDGE BELGRADE (SERBIA) DEEP FOUNDATION CONCEPT
3.1 Introduction
Sava Bridge is a 7 span, continuous superstructure with an overall length of 964 m between deck expan-sion joints (see Figure 20). The main support system is a single pylon asymmetric cable stayed structure with a main span of 376 m and a back span of 200 m. Four spans of 69 m, 108 m, 81 m and 81 m continue the cable stayed section and the end span connecting up the back span is of 50 m length. The pylon is 200 m high. All supports are based on pile founda-tions. The overall deck width is 45.04 m and shall carry 6 lanes of vehicular traffic, 2 tracks of a new light rail system and 2 lanes of a pedestrian/cycle way.
The conceptual design for the bridge was prepared by Pointing Maribor, DDC Ljubljana and CPV Novi Sad. This concept had to be respected in the detailed design that was to be performed by the contractor (Steinkühler et al. 2010).
Figure 20. Layout of the new bridge over the Sava River in Bel-grade and cross section of the bridge deck.
In 2007 the company Porr Technobau und Umwelt
AG, Austria, was assigned for the construction of the bridge over the Sava River and entrusted both the ge-otechnical and the structural foundation design to the Foundation Design Consortium, consisting of three Austrian consulting engineers Geotechnik Adam ZT GmbH, Stella and Stengl & Partner, and IBBS Schweighofer. Geotechnical investigation works were done by the Faculty of Mining and Geology of Belgrade University, Serbia, additional soil laborato-ry tests were performed at the Institute of Geotech-nics at Vienna University of Technology, Austria.
3.2 Ground conditions
Referring to reports on interpretation of soil investi-gations the following geological profile of the ground was derived from 7 boreholes in the conceptual de-sign phase and 13 additional boreholes for detailed design (see Figure 21) (Hinterplattner et al. 2011): Layer n : Embankment as artificial surface cover Quaternary sediments:
Layer G-al: Silty sandy clays with mud inter-beds and lenses – facies of flood plain
layer P-al: Medium-grained to fine-grained sands – river bed facies
Layer S-al: Gravels – river (fluvial) lacustrine sediments
Tertiary sediments: Layer M: Weathered marly clays and marls
and below grey unaltered marls (not registered in boreholes around Piers No. 7 and 8)
Layer R: Limestone, sandstones Basic geological substratum:
Cretaceous sediments
Figure 21. Geological longitudinal section (not to scale) and situa-tion of additional exploration borings (red).
Ground water is strongly influenced by the water level of the Sava River: e.g. at Pier 6 ground water level is 1.48 m above the surface when the river is at high navigation level (HNL) and the subsoil is satu-rated. When the river is at low navigation level (LNL) the ground water level is at a depth of 2.18 m. In the ground 4 hydro-geological complexes were de-fined.
Piles for all pier foundations were embedded into the stiff tertiary sediments in order to reduce settle-ments significantly. Grey unaltered marls have exact-ly the same textural characteristics as the elevated (roof) weathered marly clays and marls. Their thick-ness is from 20 to over 30 m. They are characterized by extremely massive texture. Lithological banding is manifested by colour. The increased carbonate con-tent gives the rock a greyish white colour in contrast to the parts with lesser carbonate contents, which are grey. Inclination of lithological banding (bedding) surface amounts to around 3° to 5°. The lithological banding surfaces, especially when they are encoun-tered in the form of thin “film” of sandy mass, repre-sent latent mechanical discontinuities. They are over-consolidated and hard with conchoidal rupture. The marls are poorly compressible and are practically im-permeable. In relation to physical-mechanical proper-ties, at the scale of mm to cm observations, they rep-resent a poorly heterogeneous and anisotropic environment, whereas in the larger metre scale ob-servation area they are practically homogenous and isotropic. These tertiary sediments were generally explored except in boreholes in the area of Piers 7 and 8 (see Piers 6 and 7 in Figure 22).
Adam
111
method ensured a continuous execution of the deep vibro replacement works independent of the weather conditions.
The tests and controls performed, and documents produced within the geotechnical supervision of the foundation works (deep vibro replacement method – grouted stone columns and stone columns – and soil stabilization) are summarized in the following sec-tions.
2.5.1 Quality control of the deep vibro replace-ment works
The production parameters and materials used during the deep vibro replacement process were recorded and documented for each column and point respec-tively in order to optimize and control the production process. Quality control was accomplished by apply-ing an on-line monitoring system recording:
energy consumption of the vibrator, insertion depth of the vibrator over time, production time, and material use for each stone column.
The recorded parameters over one day were sum-marized in a daily report. The documentation records of the deep vibro replacement works were collected on site.
The diameter of the grouted stone columns of 60 cm assumed for the design of the soil improve-ment measures and the chosen production parameters were verified by producing a test column outside the base slab of the planned structure. After hardening the column was excavated (see Figure 19) and cylin-drical specimens were drilled out from the column in order to determine the uniaxial compressive strength. The determined compressive strength ex-ceeded the design value by about 30% to 70%. Uni-axial compression tests to continuously control the production parameters for the deep vibro replacement and to verify the required characteristic value of the compressive cube strength of the material of the VSS element in the ultimate limit state were also per-formed using specimens that were produced both with cement grout („suspension specimen“) and with gravel-grout compound („mortar specimen“).
A static pile loading test was performed at one test column outside the base slab in order to verify the design load of the grouted stone columns and to get the pile load – deformation relationship.
Vibration measurements were performed during the production of selected grouted stone columns in order to determine the attenuation of the vibrations caused by the deep vibro compaction process.
2.5.2 Quality control of the soil stabilization works
The suitability test of the stabilization of the working platform was determined in-situ at a test field on the basis of dynamic load plate tests using the Light Fall-ing Weight Device (LFWD). The content of the lime-cement binder for the layers of the fill up to the level of the blinding layer was determined on the basis of laboratory tests (suitability tests in the laboratory).
The dynamic compaction of the stabilized working platform and layers of the filling up to the foundation level was carried out by application of the roller-integrated Continuous Compaction Control (CCC) using a vibratory roller of the type HAMM 3414HT.
The compaction control of each layer was per-formed by with dynamic load plate tests using the Light Falling Weight Device (LFWD).
3 SAVA RIVER BRIDGE BELGRADE (SERBIA) DEEP FOUNDATION CONCEPT
3.1 Introduction
Sava Bridge is a 7 span, continuous superstructure with an overall length of 964 m between deck expan-sion joints (see Figure 20). The main support system is a single pylon asymmetric cable stayed structure with a main span of 376 m and a back span of 200 m. Four spans of 69 m, 108 m, 81 m and 81 m continue the cable stayed section and the end span connecting up the back span is of 50 m length. The pylon is 200 m high. All supports are based on pile founda-tions. The overall deck width is 45.04 m and shall carry 6 lanes of vehicular traffic, 2 tracks of a new light rail system and 2 lanes of a pedestrian/cycle way.
The conceptual design for the bridge was prepared by Pointing Maribor, DDC Ljubljana and CPV Novi Sad. This concept had to be respected in the detailed design that was to be performed by the contractor (Steinkühler et al. 2010).
Figure 20. Layout of the new bridge over the Sava River in Bel-grade and cross section of the bridge deck.
In 2007 the company Porr Technobau und Umwelt
AG, Austria, was assigned for the construction of the bridge over the Sava River and entrusted both the ge-otechnical and the structural foundation design to the Foundation Design Consortium, consisting of three Austrian consulting engineers Geotechnik Adam ZT GmbH, Stella and Stengl & Partner, and IBBS Schweighofer. Geotechnical investigation works were done by the Faculty of Mining and Geology of Belgrade University, Serbia, additional soil laborato-ry tests were performed at the Institute of Geotech-nics at Vienna University of Technology, Austria.
3.2 Ground conditions
Referring to reports on interpretation of soil investi-gations the following geological profile of the ground was derived from 7 boreholes in the conceptual de-sign phase and 13 additional boreholes for detailed design (see Figure 21) (Hinterplattner et al. 2011): Layer n : Embankment as artificial surface cover Quaternary sediments:
Layer G-al: Silty sandy clays with mud inter-beds and lenses – facies of flood plain
layer P-al: Medium-grained to fine-grained sands – river bed facies
Layer S-al: Gravels – river (fluvial) lacustrine sediments
Tertiary sediments: Layer M: Weathered marly clays and marls
and below grey unaltered marls (not registered in boreholes around Piers No. 7 and 8)
Layer R: Limestone, sandstones Basic geological substratum:
Cretaceous sediments
Figure 21. Geological longitudinal section (not to scale) and situa-tion of additional exploration borings (red).
Ground water is strongly influenced by the water level of the Sava River: e.g. at Pier 6 ground water level is 1.48 m above the surface when the river is at high navigation level (HNL) and the subsoil is satu-rated. When the river is at low navigation level (LNL) the ground water level is at a depth of 2.18 m. In the ground 4 hydro-geological complexes were de-fined.
Piles for all pier foundations were embedded into the stiff tertiary sediments in order to reduce settle-ments significantly. Grey unaltered marls have exact-ly the same textural characteristics as the elevated (roof) weathered marly clays and marls. Their thick-ness is from 20 to over 30 m. They are characterized by extremely massive texture. Lithological banding is manifested by colour. The increased carbonate con-tent gives the rock a greyish white colour in contrast to the parts with lesser carbonate contents, which are grey. Inclination of lithological banding (bedding) surface amounts to around 3° to 5°. The lithological banding surfaces, especially when they are encoun-tered in the form of thin “film” of sandy mass, repre-sent latent mechanical discontinuities. They are over-consolidated and hard with conchoidal rupture. The marls are poorly compressible and are practically im-permeable. In relation to physical-mechanical proper-ties, at the scale of mm to cm observations, they rep-resent a poorly heterogeneous and anisotropic environment, whereas in the larger metre scale ob-servation area they are practically homogenous and isotropic. These tertiary sediments were generally explored except in boreholes in the area of Piers 7 and 8 (see Piers 6 and 7 in Figure 22).
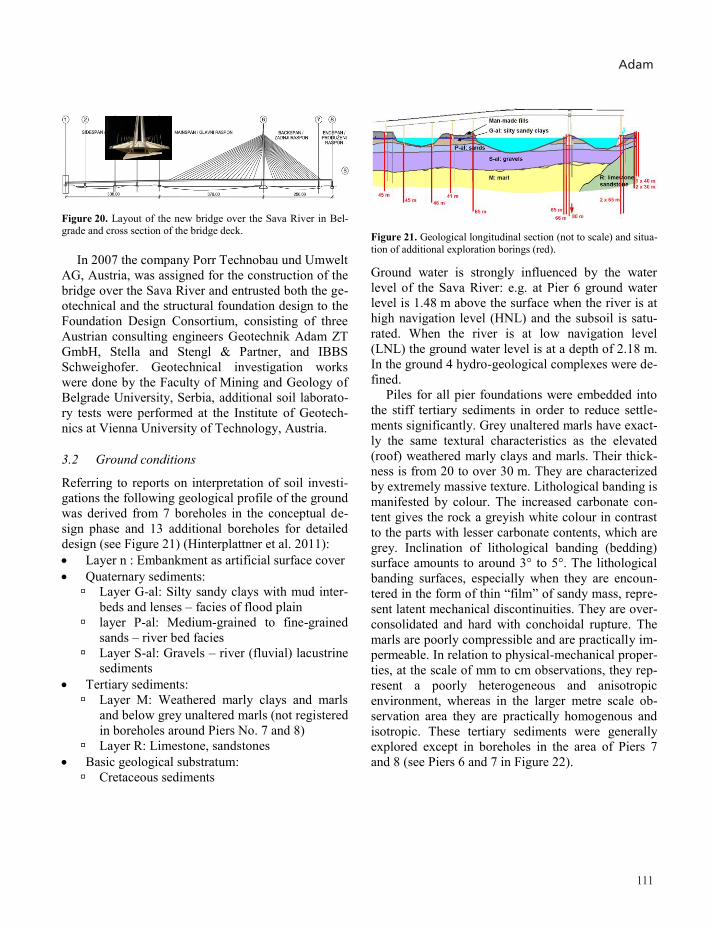
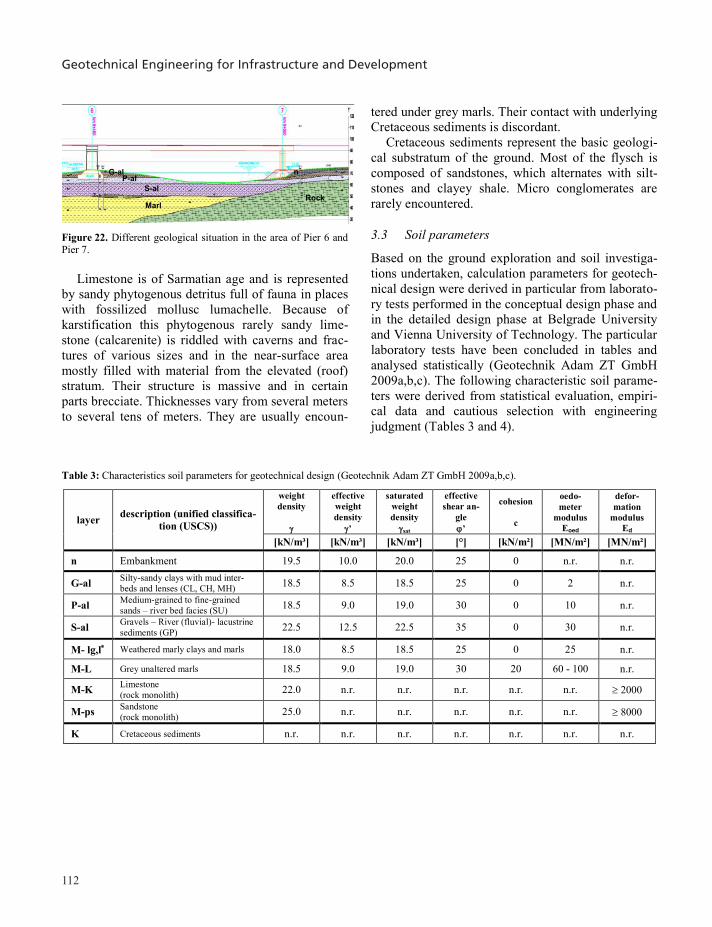
Geotechnical Engineering for Infrastructure and Development
112
G-al n P-al
S-al
Marl Rock
Figure 22. Different geological situation in the area of Pier 6 and Pier 7.
Limestone is of Sarmatian age and is represented
by sandy phytogenous detritus full of fauna in places with fossilized mollusc lumachelle. Because of karstification this phytogenous rarely sandy lime-stone (calcarenite) is riddled with caverns and frac-tures of various sizes and in the near-surface area mostly filled with material from the elevated (roof) stratum. Their structure is massive and in certain parts brecciate. Thicknesses vary from several meters to several tens of meters. They are usually encoun-
tered under grey marls. Their contact with underlying Cretaceous sediments is discordant.
Cretaceous sediments represent the basic geologi-cal substratum of the ground. Most of the flysch is composed of sandstones, which alternates with silt-stones and clayey shale. Micro conglomerates are rarely encountered.
3.3 Soil parameters
Based on the ground exploration and soil investiga-tions undertaken, calculation parameters for geotech-nical design were derived in particular from laborato-ry tests performed in the conceptual design phase and in the detailed design phase at Belgrade University and Vienna University of Technology. The particular laboratory tests have been concluded in tables and analysed statistically (Geotechnik Adam ZT GmbH 2009a,b,c). The following characteristic soil parame-ters were derived from statistical evaluation, empiri-cal data and cautious selection with engineering judgment (Tables 3 and 4).
Table 3: Characteristics soil parameters for geotechnical design (Geotechnik Adam ZT GmbH 2009a,b,c).
layer description (unified classifica-tion (USCS))
weight density
effective weight density
’
saturated weight density sat
effective shear an-
gle ’
cohesion c
oedo-meter
modulus Eoed
defor-mation
modulus Ed
[kN/m³] [kN/m³] [kN/m³] [°] [kN/m²] [MN/m²] [MN/m²]
n Embankment 19.5 10.0 20.0 25 0 n.r. n.r.
G-al Silty-sandy clays with mud inter-beds and lenses (CL, CH, MH) 18.5 8.5 18.5 25 0 2 n.r.
P-al Medium-grained to fine-grained sands – river bed facies (SU) 18.5 9.0 19.0 30 0 10 n.r.
S-al Gravels – River (fluvial)- lacustrine sediments (GP) 22.5 12.5 22.5 35 0 30 n.r.
M- lg,l Weathered marly clays and marls 18.0 8.5 18.5 25 0 25 n.r.
M-L Grey unaltered marls 18.5 9.0 19.0 30 20 60 - 100 n.r.
M-K Limestone (rock monolith) 22.0 n.r. n.r. n.r. n.r. n.r. 2000
M-ps Sandstone (rock monolith) 25.0 n.r. n.r. n.r. n.r. n.r. 8000
K Cretaceous sediments n.r. n.r. n.r. n.r. n.r. n.r. n.r.
Table 4: Characteristic soil parameters for derivation of shaft friction and base resistance pressure according to technical provisions (Ge-otechnik Adam ZT GmbH 2009a,b,c).
layer Description undrained shear
strength cu
cone penetration resistance (CPT)
qc
uniaxial com-pression strength
qu
number of blows (SPT)
N [kN/m²] [MN/m²] [kN/m²] [-]
n Embankment - 1 - 3
G-al Silty-sandy clays with mud inter-beds and lenses - 1 - 3
P-al Medium-grained to fine-grained sands - river bed facies - 5 - 15
S-al Gravels – River (fluvial)- lacus-trine sediments - 15 - 45
M- lg,l Weathered marly clays and marls 200 3 400 -
M-L Grey unaltered marls 900 11 1800 -
M-K Limestone (rock monolith) - - 1000 -
M-ps Sandstone (rock monolith) - - 5000 -
K Cretaceous sediments - - - -
3.4 Deep foundation design concept
3.4.1 Design concept for pile group foundations of Piers 1 to 5 and Piers 7 and 8
Pile group foundations at Piers 1 to 5 as well as Piers 7 and 8 are composed of single piles with a defined spacing between the piles forming pile groups. The bearing capacity of a single pile consists of the total shaft resistance (derived from shaft friction) and the activated base resistance force (derived from base re-sistance). Overall bearing capacity of a pile group foundation depends on the pile spacing as well and therefore has to be taken into account. Pile spacing had to be e ≥ 2.5 D otherwise a reduction of shear pa-rameters was necessary.
Verification of vertical bearing capacity was per-formed according to EN 1997-1 (EC7 2006). The partial safety factors were assessed according to the national specifications concerning ÖNORM EN 1997-1 (2006) and national supplements. Table 5a and 5b contain the partial safety factors and correla-tion factors to evaluate the results of static pile load tests according to ÖNORM B 1997-1-1 (2007) for the design of the pile foundations.
Table 5a: Partial safety factors and correlation factors to evaluate the results of static pile load tests according to ÖNORM B 1997-1-1 (2007) (this code with national specifications and national sup-plements is not available in English language; translated by the au-thor).
Table 5: Partial safety factors on the effects of actions (E)
action symbol value
duration condition BS 1 BS 2 BS 3
permanent unfavourable G 1.35 1.20 1.00
favourable G 1.00 1.00 1.00
variable unfavourable Q 1.50 1.30 1.00
Table 6: Partial safety factors for soil parameters (M)
soil parameter symbol value
angle of shearing resistance a ’ 1.00
effective cohesion C’ 1.00
undrained shear strength cu 1.00
unconfined strength qu 1.00
weight density 1.00 a) this factor is applied to tan ’
Adam
113
G-al n P-al
S-al
Marl Rock
Figure 22. Different geological situation in the area of Pier 6 and Pier 7.
Limestone is of Sarmatian age and is represented
by sandy phytogenous detritus full of fauna in places with fossilized mollusc lumachelle. Because of karstification this phytogenous rarely sandy lime-stone (calcarenite) is riddled with caverns and frac-tures of various sizes and in the near-surface area mostly filled with material from the elevated (roof) stratum. Their structure is massive and in certain parts brecciate. Thicknesses vary from several meters to several tens of meters. They are usually encoun-
tered under grey marls. Their contact with underlying Cretaceous sediments is discordant.
Cretaceous sediments represent the basic geologi-cal substratum of the ground. Most of the flysch is composed of sandstones, which alternates with silt-stones and clayey shale. Micro conglomerates are rarely encountered.
3.3 Soil parameters
Based on the ground exploration and soil investiga-tions undertaken, calculation parameters for geotech-nical design were derived in particular from laborato-ry tests performed in the conceptual design phase and in the detailed design phase at Belgrade University and Vienna University of Technology. The particular laboratory tests have been concluded in tables and analysed statistically (Geotechnik Adam ZT GmbH 2009a,b,c). The following characteristic soil parame-ters were derived from statistical evaluation, empiri-cal data and cautious selection with engineering judgment (Tables 3 and 4).
Table 3: Characteristics soil parameters for geotechnical design (Geotechnik Adam ZT GmbH 2009a,b,c).
layer description (unified classifica-tion (USCS))
weight density
effective weight density
’
saturated weight density sat
effective shear an-
gle ’
cohesion c
oedo-meter
modulus Eoed
defor-mation
modulus Ed
[kN/m³] [kN/m³] [kN/m³] [°] [kN/m²] [MN/m²] [MN/m²]
n Embankment 19.5 10.0 20.0 25 0 n.r. n.r.
G-al Silty-sandy clays with mud inter-beds and lenses (CL, CH, MH) 18.5 8.5 18.5 25 0 2 n.r.
P-al Medium-grained to fine-grained sands – river bed facies (SU) 18.5 9.0 19.0 30 0 10 n.r.
S-al Gravels – River (fluvial)- lacustrine sediments (GP) 22.5 12.5 22.5 35 0 30 n.r.
M- lg,l Weathered marly clays and marls 18.0 8.5 18.5 25 0 25 n.r.
M-L Grey unaltered marls 18.5 9.0 19.0 30 20 60 - 100 n.r.
M-K Limestone (rock monolith) 22.0 n.r. n.r. n.r. n.r. n.r. 2000
M-ps Sandstone (rock monolith) 25.0 n.r. n.r. n.r. n.r. n.r. 8000
K Cretaceous sediments n.r. n.r. n.r. n.r. n.r. n.r. n.r.
Table 4: Characteristic soil parameters for derivation of shaft friction and base resistance pressure according to technical provisions (Ge-otechnik Adam ZT GmbH 2009a,b,c).
layer Description undrained shear
strength cu
cone penetration resistance (CPT)
qc
uniaxial com-pression strength
qu
number of blows (SPT)
N [kN/m²] [MN/m²] [kN/m²] [-]
n Embankment - 1 - 3
G-al Silty-sandy clays with mud inter-beds and lenses - 1 - 3
P-al Medium-grained to fine-grained sands - river bed facies - 5 - 15
S-al Gravels – River (fluvial)- lacus-trine sediments - 15 - 45
M- lg,l Weathered marly clays and marls 200 3 400 -
M-L Grey unaltered marls 900 11 1800 -
M-K Limestone (rock monolith) - - 1000 -
M-ps Sandstone (rock monolith) - - 5000 -
K Cretaceous sediments - - - -
3.4 Deep foundation design concept
3.4.1 Design concept for pile group foundations of Piers 1 to 5 and Piers 7 and 8
Pile group foundations at Piers 1 to 5 as well as Piers 7 and 8 are composed of single piles with a defined spacing between the piles forming pile groups. The bearing capacity of a single pile consists of the total shaft resistance (derived from shaft friction) and the activated base resistance force (derived from base re-sistance). Overall bearing capacity of a pile group foundation depends on the pile spacing as well and therefore has to be taken into account. Pile spacing had to be e ≥ 2.5 D otherwise a reduction of shear pa-rameters was necessary.
Verification of vertical bearing capacity was per-formed according to EN 1997-1 (EC7 2006). The partial safety factors were assessed according to the national specifications concerning ÖNORM EN 1997-1 (2006) and national supplements. Table 5a and 5b contain the partial safety factors and correla-tion factors to evaluate the results of static pile load tests according to ÖNORM B 1997-1-1 (2007) for the design of the pile foundations.
Table 5a: Partial safety factors and correlation factors to evaluate the results of static pile load tests according to ÖNORM B 1997-1-1 (2007) (this code with national specifications and national sup-plements is not available in English language; translated by the au-thor).
Table 5: Partial safety factors on the effects of actions (E)
action symbol value
duration condition BS 1 BS 2 BS 3
permanent unfavourable G 1.35 1.20 1.00
favourable G 1.00 1.00 1.00
variable unfavourable Q 1.50 1.30 1.00
Table 6: Partial safety factors for soil parameters (M)
soil parameter symbol value
angle of shearing resistance a ’ 1.00
effective cohesion C’ 1.00
undrained shear strength cu 1.00
unconfined strength qu 1.00
weight density 1.00 a) this factor is applied to tan ’
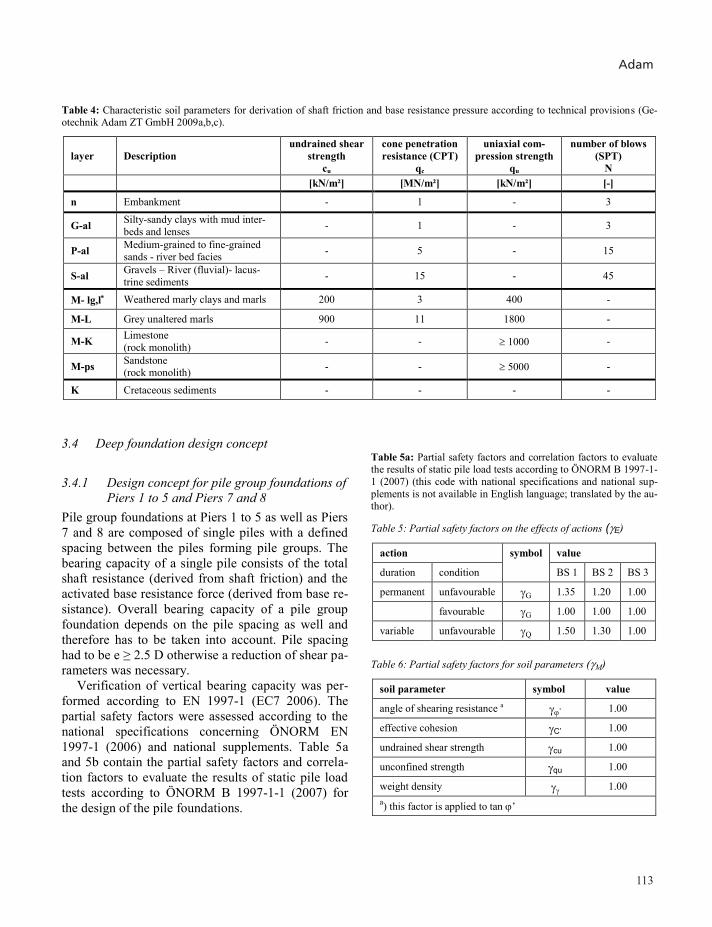
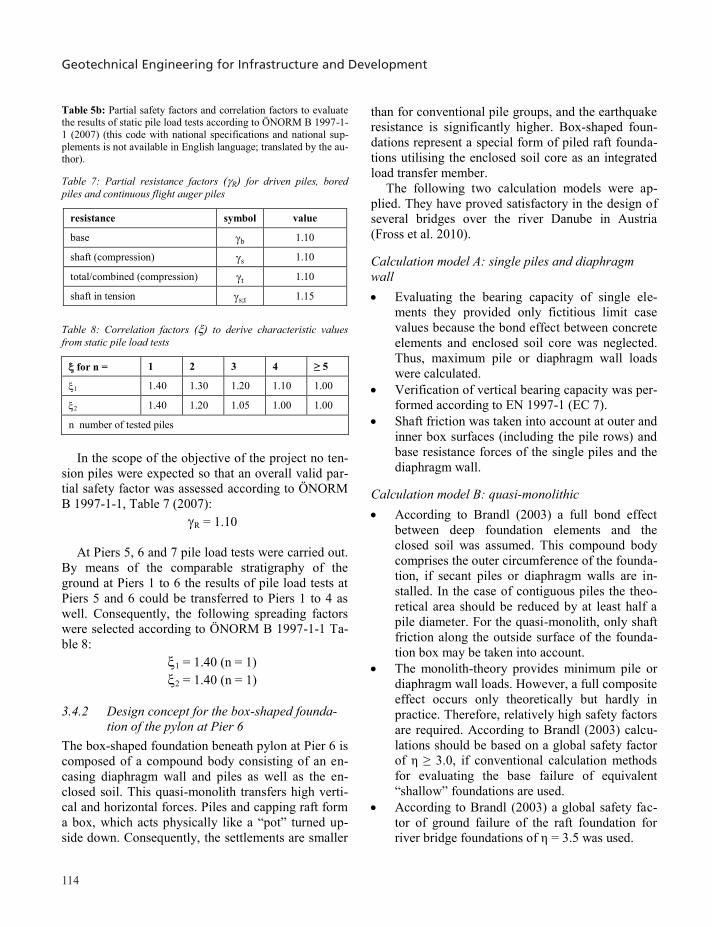
Geotechnical Engineering for Infrastructure and Development
114
Table 5b: Partial safety factors and correlation factors to evaluate the results of static pile load tests according to ÖNORM B 1997-1-1 (2007) (this code with national specifications and national sup-plements is not available in English language; translated by the au-thor).
Table 7: Partial resistance factors (R) for driven piles, bored piles and continuous flight auger piles
resistance symbol value
base b 1.10
shaft (compression) s 1.10
total/combined (compression) t 1.10
shaft in tension s;t 1.15
Table 8: Correlation factors () to derive characteristic values from static pile load tests
for n = 1 2 3 4 ≥ 5
1 1.40 1.30 1.20 1.10 1.00
2 1.40 1.20 1.05 1.00 1.00
n number of tested piles
In the scope of the objective of the project no ten-
sion piles were expected so that an overall valid par-tial safety factor was assessed according to ÖNORM B 1997-1-1, Table 7 (2007):
R = 1.10
At Piers 5, 6 and 7 pile load tests were carried out. By means of the comparable stratigraphy of the ground at Piers 1 to 6 the results of pile load tests at Piers 5 and 6 could be transferred to Piers 1 to 4 as well. Consequently, the following spreading factors were selected according to ÖNORM B 1997-1-1 Ta-ble 8:
1 = 1.40 (n = 1) 2 = 1.40 (n = 1)
3.4.2 Design concept for the box-shaped founda-tion of the pylon at Pier 6
The box-shaped foundation beneath pylon at Pier 6 is composed of a compound body consisting of an en-casing diaphragm wall and piles as well as the en-closed soil. This quasi-monolith transfers high verti-cal and horizontal forces. Piles and capping raft form a box, which acts physically like a “pot” turned up-side down. Consequently, the settlements are smaller
than for conventional pile groups, and the earthquake resistance is significantly higher. Box-shaped foun-dations represent a special form of piled raft founda-tions utilising the enclosed soil core as an integrated load transfer member.
The following two calculation models were ap-plied. They have proved satisfactory in the design of several bridges over the river Danube in Austria (Fross et al. 2010).
Calculation model A: single piles and diaphragm wall Evaluating the bearing capacity of single ele-
ments they provided only fictitious limit case values because the bond effect between concrete elements and enclosed soil core was neglected. Thus, maximum pile or diaphragm wall loads were calculated.
Verification of vertical bearing capacity was per-formed according to EN 1997-1 (EC 7).
Shaft friction was taken into account at outer and inner box surfaces (including the pile rows) and base resistance forces of the single piles and the diaphragm wall.
Calculation model B: quasi-monolithic According to Brandl (2003) a full bond effect
between deep foundation elements and the closed soil was assumed. This compound body comprises the outer circumference of the founda-tion, if secant piles or diaphragm walls are in-stalled. In the case of contiguous piles the theo-retical area should be reduced by at least half a pile diameter. For the quasi-monolith, only shaft friction along the outside surface of the founda-tion box may be taken into account.
The monolith-theory provides minimum pile or diaphragm wall loads. However, a full composite effect occurs only theoretically but hardly in practice. Therefore, relatively high safety factors are required. According to Brandl (2003) calcu-lations should be based on a global safety factor of η ≥ 3.0, if conventional calculation methods for evaluating the base failure of equivalent “shallow” foundations are used.
According to Brandl (2003) a global safety fac-tor of ground failure of the raft foundation for river bridge foundations of η = 3.5 was used.
Shaft friction is effective only around the outer perimeter of the box-shaped foundation.
The base pressure was assumed to be effective over the entire base area of the monolith. The base pressure should not exceed the actual over-burden stress multiplied by the over consolida-tion ratio (OCR) of the marl in order to minimize foundation settlements and differential settle-ments. OCR was determined with particular tests in the scope of laboratory investigations. Taking into account an average weight of soil of 20 kN/m² OCR ranges from 950 to 1,940 kN/m² at the bridge site.
Seismic foundation design For seismic design two approaches were considered:
On the one hand dynamic soil parameters can be determined from geophysical field tests (e.g. cross-hole and down-hole tests) and/or dynamic laboratory tests (e.g. resonant columns test). Field tests deliver elastic data (dynamic shear modulus and dynamic elastic modulus) at small shear strains. However, in-creasing shear strains produce a reduction of the dy-namic stiffness parameters. Depending on the seismic load and the corresponding shear strain the dynamic parameters can be identified. The stiffness and damp-ing matrices can be determined by using a suitable model, whereby radiation damping is represented by the damping matrix. However, radiation damping is always beneficial for the structure, thus neglecting this effect gives a solution on the safe side.
On the other hand seismic calculations can be per-formed by variation of the static stiffness, if radiation damping can be neglected. In general, the quasi-static stiffness increases when dynamic loads are applied.
In the scope of the seismic design of the founda-tions of the Sava Bridge parametric studies were per-formed taking into account both approaches. Dynam-ic soil parameters were derived from geophysical tests and data given by the Serbian Seismic Institute in Belgrade. A comparison of dynamic and quasi-static solutions suggested that the dynamic approach overestimated the spring stiffness by means of the as-sumed rigid foundation behaviour during seismic load because the overall stiffness of the system was limited by the inherent rigidity of the foundation it-self. Thus, the following parameters were chosen from the parametric studies:
Lower limit: static value of horizontal and verti-cal modulus of subgrade reaction
Upper limit: 10 times the static value of horizon-tal and vertical modulus of subgrade reaction
Characteristic values for shaft resistance and base resistance pressure did not need to be modified from static values. Consequently, the ground is stiffer at lower strains during an earthquake, thus causing higher reaction forces but lower deformations. A sof-tening of the ground can be excluded since the ex-pected shear strains in the soil are small taking into account the magnitude of a presumed earthquake and the liquefaction potential of the layered ground is negligible (Geotechnik Adam ZT GmbH 2009a,b,c).
3.4.3 Geotechnical design parameters For calculation and both static and seismic design of bored piles and diaphragm walls the following ge-otechnical soil parameters were specified for each pier: Shaft friction. Base resistance pressure. Horizontal subgrade reaction. Vertical subgrade reaction.
Shaft friction and base resistance pressure ÖNORM EN 1997-1 (EC 7 2006) includes no speci-fications related to the definition of shaft friction and base resistance pressure. For that reason other tech-nical provisions need to be stressed. Hitherto in Aus-tria ÖNORM B 4440 (2001) has been used for the determination of design axial pile loads according to the global safety concept including the design base resistance pressure and the design shaft friction. In contrary the ÖNORM EN 1997-1 (EC 7 2006) is based on the partial safety concept so that design val-ues defined in ÖNORM B 4440 (2001) cannot be di-rectly adopted for applications according to the par-tial safety concept.
ÖNORM B 1997-1-3 (draft, 2007) is currently es-tablished by the Austrian Standard Institute. The new standard will replace ÖNORM B 4440 (2001) and will cover all pile types. Amongst others procedures for determination of characteristic values for ultimate limit state (ULS) and serviceability limit state (SLS) will be defined in tables including the base resistance pressure and shaft resistance (see Tables 4, 5 and 6).
Adam
115
Table 5b: Partial safety factors and correlation factors to evaluate the results of static pile load tests according to ÖNORM B 1997-1-1 (2007) (this code with national specifications and national sup-plements is not available in English language; translated by the au-thor).
Table 7: Partial resistance factors (R) for driven piles, bored piles and continuous flight auger piles
resistance symbol value
base b 1.10
shaft (compression) s 1.10
total/combined (compression) t 1.10
shaft in tension s;t 1.15
Table 8: Correlation factors () to derive characteristic values from static pile load tests
for n = 1 2 3 4 ≥ 5
1 1.40 1.30 1.20 1.10 1.00
2 1.40 1.20 1.05 1.00 1.00
n number of tested piles
In the scope of the objective of the project no ten-
sion piles were expected so that an overall valid par-tial safety factor was assessed according to ÖNORM B 1997-1-1, Table 7 (2007):
R = 1.10
At Piers 5, 6 and 7 pile load tests were carried out. By means of the comparable stratigraphy of the ground at Piers 1 to 6 the results of pile load tests at Piers 5 and 6 could be transferred to Piers 1 to 4 as well. Consequently, the following spreading factors were selected according to ÖNORM B 1997-1-1 Ta-ble 8:
1 = 1.40 (n = 1) 2 = 1.40 (n = 1)
3.4.2 Design concept for the box-shaped founda-tion of the pylon at Pier 6
The box-shaped foundation beneath pylon at Pier 6 is composed of a compound body consisting of an en-casing diaphragm wall and piles as well as the en-closed soil. This quasi-monolith transfers high verti-cal and horizontal forces. Piles and capping raft form a box, which acts physically like a “pot” turned up-side down. Consequently, the settlements are smaller
than for conventional pile groups, and the earthquake resistance is significantly higher. Box-shaped foun-dations represent a special form of piled raft founda-tions utilising the enclosed soil core as an integrated load transfer member.
The following two calculation models were ap-plied. They have proved satisfactory in the design of several bridges over the river Danube in Austria (Fross et al. 2010).
Calculation model A: single piles and diaphragm wall Evaluating the bearing capacity of single ele-
ments they provided only fictitious limit case values because the bond effect between concrete elements and enclosed soil core was neglected. Thus, maximum pile or diaphragm wall loads were calculated.
Verification of vertical bearing capacity was per-formed according to EN 1997-1 (EC 7).
Shaft friction was taken into account at outer and inner box surfaces (including the pile rows) and base resistance forces of the single piles and the diaphragm wall.
Calculation model B: quasi-monolithic According to Brandl (2003) a full bond effect
between deep foundation elements and the closed soil was assumed. This compound body comprises the outer circumference of the founda-tion, if secant piles or diaphragm walls are in-stalled. In the case of contiguous piles the theo-retical area should be reduced by at least half a pile diameter. For the quasi-monolith, only shaft friction along the outside surface of the founda-tion box may be taken into account.
The monolith-theory provides minimum pile or diaphragm wall loads. However, a full composite effect occurs only theoretically but hardly in practice. Therefore, relatively high safety factors are required. According to Brandl (2003) calcu-lations should be based on a global safety factor of η ≥ 3.0, if conventional calculation methods for evaluating the base failure of equivalent “shallow” foundations are used.
According to Brandl (2003) a global safety fac-tor of ground failure of the raft foundation for river bridge foundations of η = 3.5 was used.
Shaft friction is effective only around the outer perimeter of the box-shaped foundation.
The base pressure was assumed to be effective over the entire base area of the monolith. The base pressure should not exceed the actual over-burden stress multiplied by the over consolida-tion ratio (OCR) of the marl in order to minimize foundation settlements and differential settle-ments. OCR was determined with particular tests in the scope of laboratory investigations. Taking into account an average weight of soil of 20 kN/m² OCR ranges from 950 to 1,940 kN/m² at the bridge site.
Seismic foundation design For seismic design two approaches were considered:
On the one hand dynamic soil parameters can be determined from geophysical field tests (e.g. cross-hole and down-hole tests) and/or dynamic laboratory tests (e.g. resonant columns test). Field tests deliver elastic data (dynamic shear modulus and dynamic elastic modulus) at small shear strains. However, in-creasing shear strains produce a reduction of the dy-namic stiffness parameters. Depending on the seismic load and the corresponding shear strain the dynamic parameters can be identified. The stiffness and damp-ing matrices can be determined by using a suitable model, whereby radiation damping is represented by the damping matrix. However, radiation damping is always beneficial for the structure, thus neglecting this effect gives a solution on the safe side.
On the other hand seismic calculations can be per-formed by variation of the static stiffness, if radiation damping can be neglected. In general, the quasi-static stiffness increases when dynamic loads are applied.
In the scope of the seismic design of the founda-tions of the Sava Bridge parametric studies were per-formed taking into account both approaches. Dynam-ic soil parameters were derived from geophysical tests and data given by the Serbian Seismic Institute in Belgrade. A comparison of dynamic and quasi-static solutions suggested that the dynamic approach overestimated the spring stiffness by means of the as-sumed rigid foundation behaviour during seismic load because the overall stiffness of the system was limited by the inherent rigidity of the foundation it-self. Thus, the following parameters were chosen from the parametric studies:
Lower limit: static value of horizontal and verti-cal modulus of subgrade reaction
Upper limit: 10 times the static value of horizon-tal and vertical modulus of subgrade reaction
Characteristic values for shaft resistance and base resistance pressure did not need to be modified from static values. Consequently, the ground is stiffer at lower strains during an earthquake, thus causing higher reaction forces but lower deformations. A sof-tening of the ground can be excluded since the ex-pected shear strains in the soil are small taking into account the magnitude of a presumed earthquake and the liquefaction potential of the layered ground is negligible (Geotechnik Adam ZT GmbH 2009a,b,c).
3.4.3 Geotechnical design parameters For calculation and both static and seismic design of bored piles and diaphragm walls the following ge-otechnical soil parameters were specified for each pier: Shaft friction. Base resistance pressure. Horizontal subgrade reaction. Vertical subgrade reaction.
Shaft friction and base resistance pressure ÖNORM EN 1997-1 (EC 7 2006) includes no speci-fications related to the definition of shaft friction and base resistance pressure. For that reason other tech-nical provisions need to be stressed. Hitherto in Aus-tria ÖNORM B 4440 (2001) has been used for the determination of design axial pile loads according to the global safety concept including the design base resistance pressure and the design shaft friction. In contrary the ÖNORM EN 1997-1 (EC 7 2006) is based on the partial safety concept so that design val-ues defined in ÖNORM B 4440 (2001) cannot be di-rectly adopted for applications according to the par-tial safety concept.
ÖNORM B 1997-1-3 (draft, 2007) is currently es-tablished by the Austrian Standard Institute. The new standard will replace ÖNORM B 4440 (2001) and will cover all pile types. Amongst others procedures for determination of characteristic values for ultimate limit state (ULS) and serviceability limit state (SLS) will be defined in tables including the base resistance pressure and shaft resistance (see Tables 4, 5 and 6).
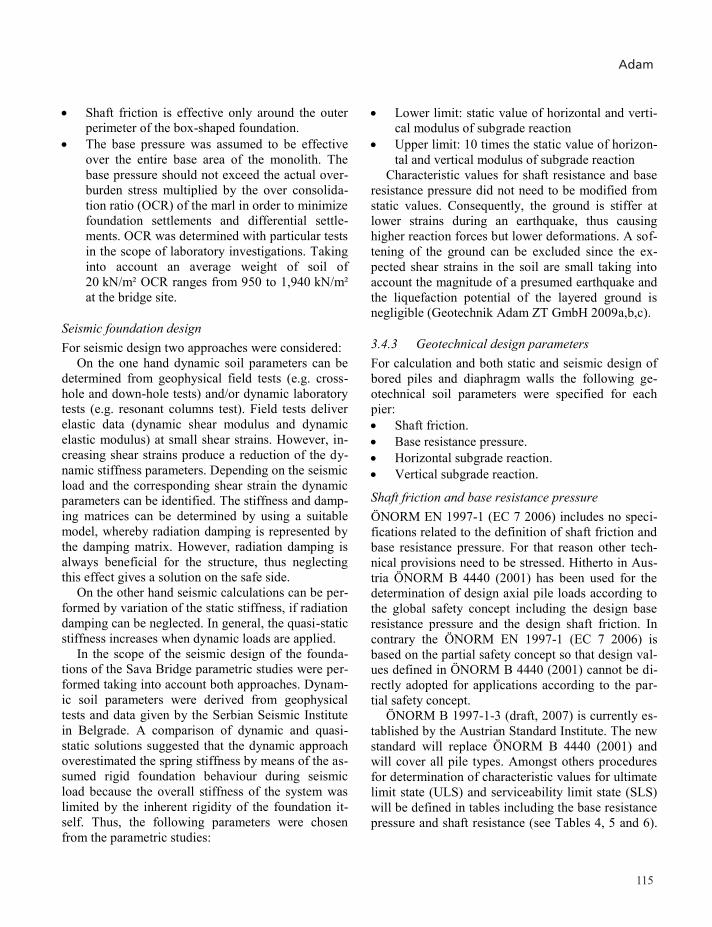
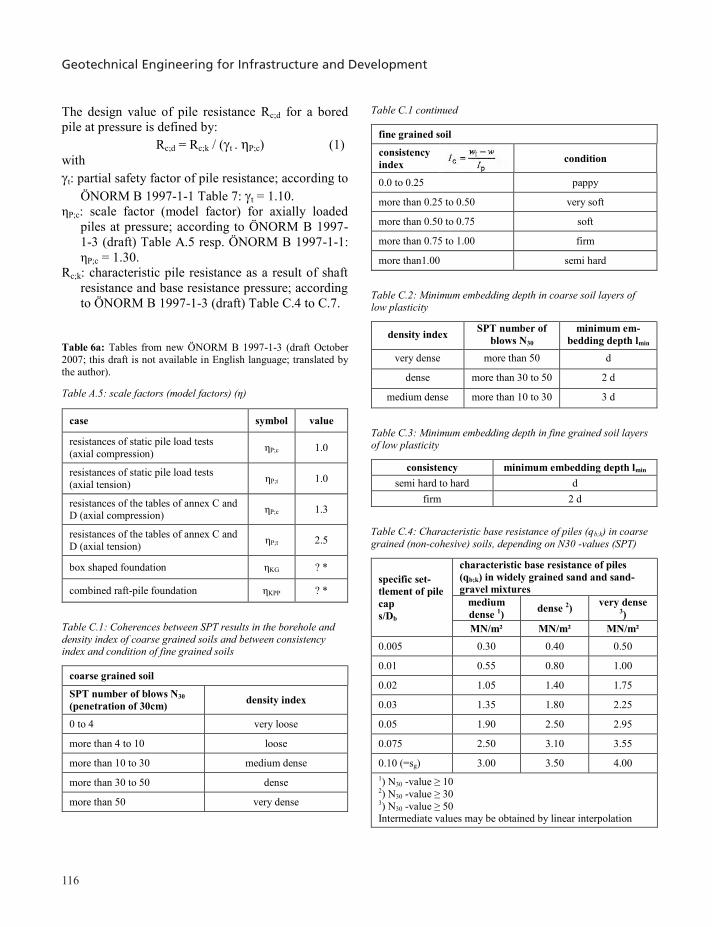
Geotechnical Engineering for Infrastructure and Development
116
The design value of pile resistance Rc;d for a bored pile at pressure is defined by:
Rc;d = Rc;k / (t . ηP;c) (1) with t: partial safety factor of pile resistance; according to
ÖNORM B 1997-1-1 Table 7: t = 1.10. ηP;c: scale factor (model factor) for axially loaded
piles at pressure; according to ÖNORM B 1997-1-3 (draft) Table A.5 resp. ÖNORM B 1997-1-1: ηP;c = 1.30.
Rc;k: characteristic pile resistance as a result of shaft resistance and base resistance pressure; according to ÖNORM B 1997-1-3 (draft) Table C.4 to C.7.
Table 6a: Tables from new ÖNORM B 1997-1-3 (draft October 2007; this draft is not available in English language; translated by the author).
Table A.5: scale factors (model factors) (η)
case symbol value
resistances of static pile load tests (axial compression) ηP;c 1.0
resistances of static pile load tests (axial tension) ηP;t 1.0
resistances of the tables of annex C and D (axial compression) ηP;c 1.3
resistances of the tables of annex C and D (axial tension) ηP;t 2.5
box shaped foundation ηKG ? *
combined raft-pile foundation ηKPP ? *
Table C.1: Coherences between SPT results in the borehole and density index of coarse grained soils and between consistency index and condition of fine grained soils
coarse grained soil
SPT number of blows N30 (penetration of 30cm) density index
0 to 4 very loose
more than 4 to 10 loose
more than 10 to 30 medium dense
more than 30 to 50 dense
more than 50 very dense
Table C.1 continued
fine grained soil
consistency index
condition
0.0 to 0.25 pappy
more than 0.25 to 0.50 very soft
more than 0.50 to 0.75 soft
more than 0.75 to 1.00 firm
more than1.00 semi hard
Table C.2: Minimum embedding depth in coarse soil layers of low plasticity
density index SPT number of blows N30
minimum em-bedding depth lmin
very dense more than 50 d
dense more than 30 to 50 2 d
medium dense more than 10 to 30 3 d
Table C.3: Minimum embedding depth in fine grained soil layers of low plasticity
consistency minimum embedding depth lmin semi hard to hard d
firm 2 d
Table C.4: Characteristic base resistance of piles (qb;k) in coarse grained (non-cohesive) soils, depending on N30 -values (SPT)
specific set-tlement of pile cap s/Db
characteristic base resistance of piles (qb;k) in widely grained sand and sand-gravel mixtures
medium dense 1) dense 2) very dense
3) MN/m² MN/m² MN/m²
0.005 0.30 0.40 0.50
0.01 0.55 0.80 1.00
0.02 1.05 1.40 1.75
0.03 1.35 1.80 2.25
0.05 1.90 2.50 2.95
0.075 2.50 3.10 3.55
0.10 (=sg) 3.00 3.50 4.00 1) N30 -value ≥ 10 2) N30 -value ≥ 30 3) N30 -value ≥ 50 Intermediate values may be obtained by linear interpolation
Table 6b: Tables from new ÖNORM B 1997-1-3 (draft October 2007; this draft is not available in English language; translated by the author).
Table C.5: Characteristic base resistance of piles (qb;k) in fine grained (cohesive) soils, depending on consistency index Ic
specific set-tlement of pile cap s/Db
Characteristic base resistance of piles (qb;k) in silt, clayey silt and clay
stiff 1) very stiff 2) semi solid 3)
MN/m² MN/m² MN/m²
0.005 0.10 0.15 0.25
0.01 0.15 0.30 0.45
0.02 0.35 0.60 0.90
0.03 0.45 0.80 1.15
0.05 0.60 1.10 1.60
0.075 0.70 1.40 2.00
0.10 (s = sg) 0.80 1.50 2.20
1) Ic ≥ 0.75 2) Ic ≥ 0.90 3) Ic > 1.00 Intermediate values may be obtained by linear interpolation
Table C.7: Characteristic shaft resistance of piles (qs;k) in fine grained (cohesive) soils, depending on consistency index Ic respec-tively on unconfined compressive strength qu
specific set-tlement of pile cap s/Db
Characteristic base resistance of piles (qb;k) in silt, clayey silt and clay
stiff 1) very stiff 2) semi solid 3)
MN/m² MN/m² MN/m²
0.005 0.10 0.15 0.25
0.01 0.15 0.30 0.45
0.02 0.35 0.60 0.90
0.03 0.45 0.80 1.15
0.05 0.60 1.10 1.60
0.075 0.70 1.40 2.00
0.10 (s = sg) 0.80 1.50 2.20
1) Ic ≥ 0.75 2) Ic ≥ 0.90 3) Ic > 1.00 Intermediate values may be obtained by linear interpolation
Table C.6: Characteristic shaft resistance of piles (qs;k) in coarse grained (non-cohesive) soils, depending on N30-values (SPT)
coarse grained soils
characteristic shaft resistance (qs;k)
for servicea-ble limit state
SLS
for ultimate limit state
ULS
density index N30-value (SPT) MN/m² MN/m²
loose 4 0.030 0.045
medium dense 10 0.050 0.075
20 0.060 0.090
dense 30 0.070 0.105
40 0.095 0.142
very dense ≥ 50 0.120 0.180
Intermediate values may be obtained by linear interpolation
The characteristic values for shaft resistance and
base resistance pressure of piles in soil given in the following were specified based on the results of ground investigations and empirical values, which have already been adopted in the draft version of ÖNORM B 1997-1-3 (draft, 2007). The characteristic values for shaft resistance and base resistance pres-sure of piles in rock (limestone and sandstone at Pier 7) were specified according to DIN 1045 – Appendix B, Table B.5 (2005) (failure values).
For geotechnical design of the pile group founda-tions at Piers 1 to 5 and the box-shaped foundation at Pier 6 characteristic values for shaft friction and base resistance pressure given in Table 7 were derived (Geotechnik Adam ZT GmbH 2009a,b,c).
Table 7: Characteristic values of shaft friction and base resistance pressure of single piles.
layer description
shaft friction
qs,k [kN/m²]
base resistance pressure qb,k [kN/m²]
s/D= 0.02
s/D= 0.03
s/D= 0.05
P-al Medium-grained to fine-grained sands - river bed facies
40 - - -
S-al Gravels – River (fluvial)- lacus-trine sediments
140 -
M-lg,l
Weathered marly clays and marls 60 - - -
M Grey unaltered marls 80 900 1,150 1,600
M-K Limestone 126 1,880
Adam
117
The design value of pile resistance Rc;d for a bored pile at pressure is defined by:
Rc;d = Rc;k / (t . ηP;c) (1) with t: partial safety factor of pile resistance; according to
ÖNORM B 1997-1-1 Table 7: t = 1.10. ηP;c: scale factor (model factor) for axially loaded
piles at pressure; according to ÖNORM B 1997-1-3 (draft) Table A.5 resp. ÖNORM B 1997-1-1: ηP;c = 1.30.
Rc;k: characteristic pile resistance as a result of shaft resistance and base resistance pressure; according to ÖNORM B 1997-1-3 (draft) Table C.4 to C.7.
Table 6a: Tables from new ÖNORM B 1997-1-3 (draft October 2007; this draft is not available in English language; translated by the author).
Table A.5: scale factors (model factors) (η)
case symbol value
resistances of static pile load tests (axial compression) ηP;c 1.0
resistances of static pile load tests (axial tension) ηP;t 1.0
resistances of the tables of annex C and D (axial compression) ηP;c 1.3
resistances of the tables of annex C and D (axial tension) ηP;t 2.5
box shaped foundation ηKG ? *
combined raft-pile foundation ηKPP ? *
Table C.1: Coherences between SPT results in the borehole and density index of coarse grained soils and between consistency index and condition of fine grained soils
coarse grained soil
SPT number of blows N30 (penetration of 30cm) density index
0 to 4 very loose
more than 4 to 10 loose
more than 10 to 30 medium dense
more than 30 to 50 dense
more than 50 very dense
Table C.1 continued
fine grained soil
consistency index
condition
0.0 to 0.25 pappy
more than 0.25 to 0.50 very soft
more than 0.50 to 0.75 soft
more than 0.75 to 1.00 firm
more than1.00 semi hard
Table C.2: Minimum embedding depth in coarse soil layers of low plasticity
density index SPT number of blows N30
minimum em-bedding depth lmin
very dense more than 50 d
dense more than 30 to 50 2 d
medium dense more than 10 to 30 3 d
Table C.3: Minimum embedding depth in fine grained soil layers of low plasticity
consistency minimum embedding depth lmin semi hard to hard d
firm 2 d
Table C.4: Characteristic base resistance of piles (qb;k) in coarse grained (non-cohesive) soils, depending on N30 -values (SPT)
specific set-tlement of pile cap s/Db
characteristic base resistance of piles (qb;k) in widely grained sand and sand-gravel mixtures
medium dense 1) dense 2) very dense
3) MN/m² MN/m² MN/m²
0.005 0.30 0.40 0.50
0.01 0.55 0.80 1.00
0.02 1.05 1.40 1.75
0.03 1.35 1.80 2.25
0.05 1.90 2.50 2.95
0.075 2.50 3.10 3.55
0.10 (=sg) 3.00 3.50 4.00 1) N30 -value ≥ 10 2) N30 -value ≥ 30 3) N30 -value ≥ 50 Intermediate values may be obtained by linear interpolation
Table 6b: Tables from new ÖNORM B 1997-1-3 (draft October 2007; this draft is not available in English language; translated by the author).
Table C.5: Characteristic base resistance of piles (qb;k) in fine grained (cohesive) soils, depending on consistency index Ic
specific set-tlement of pile cap s/Db
Characteristic base resistance of piles (qb;k) in silt, clayey silt and clay
stiff 1) very stiff 2) semi solid 3)
MN/m² MN/m² MN/m²
0.005 0.10 0.15 0.25
0.01 0.15 0.30 0.45
0.02 0.35 0.60 0.90
0.03 0.45 0.80 1.15
0.05 0.60 1.10 1.60
0.075 0.70 1.40 2.00
0.10 (s = sg) 0.80 1.50 2.20
1) Ic ≥ 0.75 2) Ic ≥ 0.90 3) Ic > 1.00 Intermediate values may be obtained by linear interpolation
Table C.7: Characteristic shaft resistance of piles (qs;k) in fine grained (cohesive) soils, depending on consistency index Ic respec-tively on unconfined compressive strength qu
specific set-tlement of pile cap s/Db
Characteristic base resistance of piles (qb;k) in silt, clayey silt and clay
stiff 1) very stiff 2) semi solid 3)
MN/m² MN/m² MN/m²
0.005 0.10 0.15 0.25
0.01 0.15 0.30 0.45
0.02 0.35 0.60 0.90
0.03 0.45 0.80 1.15
0.05 0.60 1.10 1.60
0.075 0.70 1.40 2.00
0.10 (s = sg) 0.80 1.50 2.20
1) Ic ≥ 0.75 2) Ic ≥ 0.90 3) Ic > 1.00 Intermediate values may be obtained by linear interpolation
Table C.6: Characteristic shaft resistance of piles (qs;k) in coarse grained (non-cohesive) soils, depending on N30-values (SPT)
coarse grained soils
characteristic shaft resistance (qs;k)
for servicea-ble limit state
SLS
for ultimate limit state
ULS
density index N30-value (SPT) MN/m² MN/m²
loose 4 0.030 0.045
medium dense 10 0.050 0.075
20 0.060 0.090
dense 30 0.070 0.105
40 0.095 0.142
very dense ≥ 50 0.120 0.180
Intermediate values may be obtained by linear interpolation
The characteristic values for shaft resistance and
base resistance pressure of piles in soil given in the following were specified based on the results of ground investigations and empirical values, which have already been adopted in the draft version of ÖNORM B 1997-1-3 (draft, 2007). The characteristic values for shaft resistance and base resistance pres-sure of piles in rock (limestone and sandstone at Pier 7) were specified according to DIN 1045 – Appendix B, Table B.5 (2005) (failure values).
For geotechnical design of the pile group founda-tions at Piers 1 to 5 and the box-shaped foundation at Pier 6 characteristic values for shaft friction and base resistance pressure given in Table 7 were derived (Geotechnik Adam ZT GmbH 2009a,b,c).
Table 7: Characteristic values of shaft friction and base resistance pressure of single piles.
layer description
shaft friction
qs,k [kN/m²]
base resistance pressure qb,k [kN/m²]
s/D= 0.02
s/D= 0.03
s/D= 0.05
P-al Medium-grained to fine-grained sands - river bed facies
40 - - -
S-al Gravels – River (fluvial)- lacus-trine sediments
140 -
M-lg,l
Weathered marly clays and marls 60 - - -
M Grey unaltered marls 80 900 1,150 1,600
M-K Limestone 126 1,880
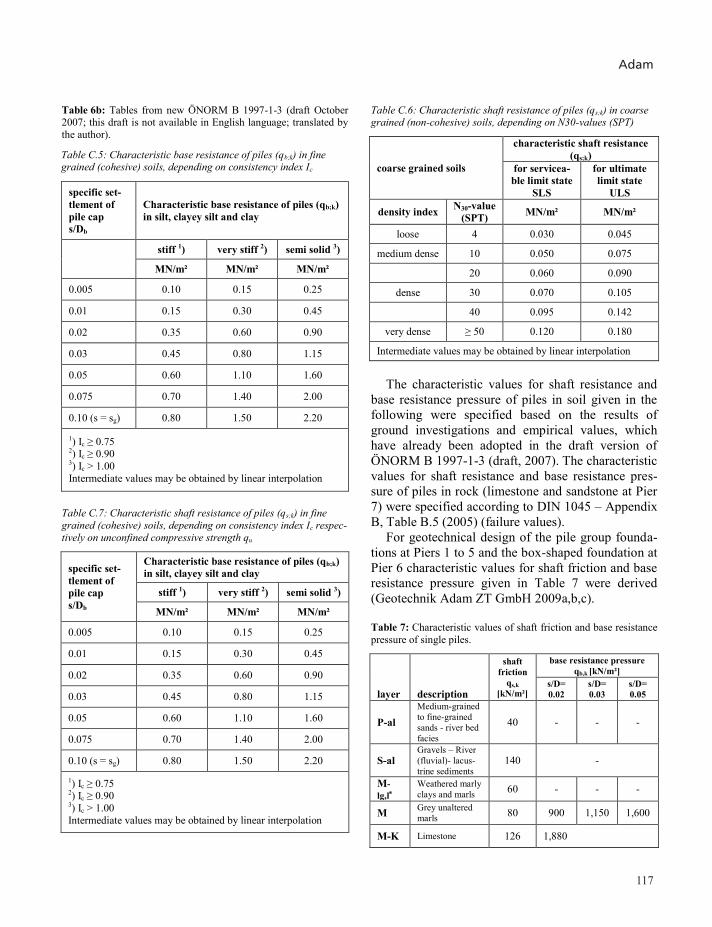
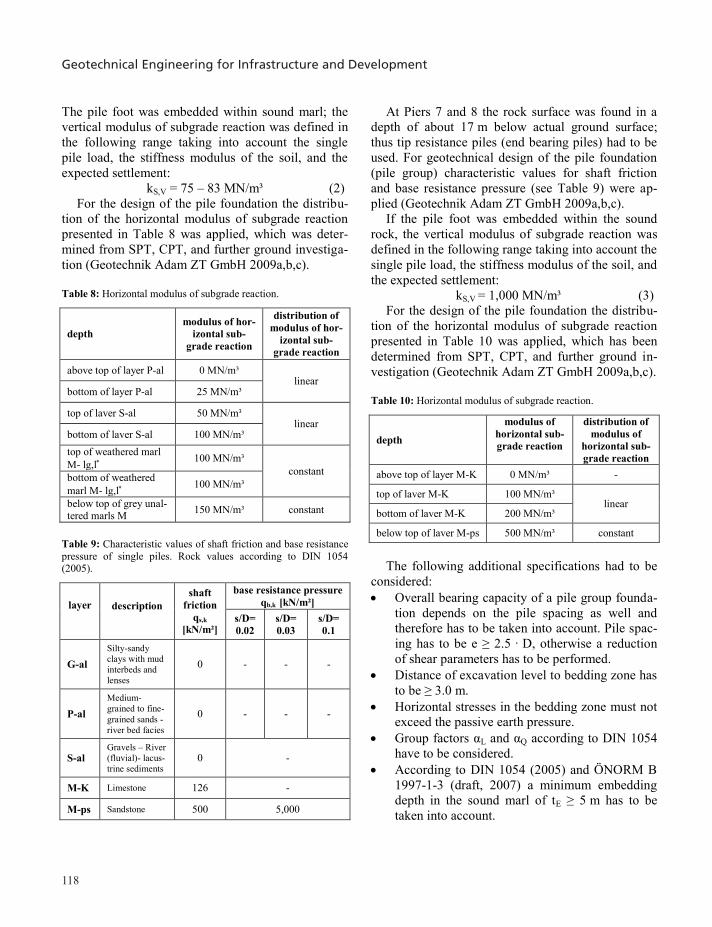
Geotechnical Engineering for Infrastructure and Development
118
The pile foot was embedded within sound marl; the vertical modulus of subgrade reaction was defined in the following range taking into account the single pile load, the stiffness modulus of the soil, and the expected settlement:
kS,V = 75 – 83 MN/m³ (2) For the design of the pile foundation the distribu-
tion of the horizontal modulus of subgrade reaction presented in Table 8 was applied, which was deter-mined from SPT, CPT, and further ground investiga-tion (Geotechnik Adam ZT GmbH 2009a,b,c).
Table 8: Horizontal modulus of subgrade reaction.
depth modulus of hor-
izontal sub-grade reaction
distribution of modulus of hor-
izontal sub-grade reaction
above top of layer P-al 0 MN/m³ linear
bottom of layer P-al 25 MN/m³
top of laver S-al 50 MN/m³ linear
bottom of laver S-al 100 MN/m³ top of weathered marl M- lg,l 100 MN/m³
constant bottom of weathered marl M- lg,l 100 MN/m³
below top of grey unal-tered marls M 150 MN/m³ constant
Table 9: Characteristic values of shaft friction and base resistance pressure of single piles. Rock values according to DIN 1054 (2005).
layer
description
shaft friction
qs,k [kN/m²]
base resistance pressure qb,k [kN/m²]
s/D= 0.02
s/D= 0.03
s/D= 0.1
G-al Silty-sandy clays with mud interbeds and lenses
0 - - -
P-al Medium-grained to fine-grained sands - river bed facies
0 - - -
S-al Gravels – River (fluvial)- lacus-trine sediments
0 -
M-K Limestone 126 -
M-ps Sandstone 500 5,000
At Piers 7 and 8 the rock surface was found in a depth of about 17 m below actual ground surface; thus tip resistance piles (end bearing piles) had to be used. For geotechnical design of the pile foundation (pile group) characteristic values for shaft friction and base resistance pressure (see Table 9) were ap-plied (Geotechnik Adam ZT GmbH 2009a,b,c).
If the pile foot was embedded within the sound rock, the vertical modulus of subgrade reaction was defined in the following range taking into account the single pile load, the stiffness modulus of the soil, and the expected settlement:
kS,V = 1,000 MN/m³ (3) For the design of the pile foundation the distribu-
tion of the horizontal modulus of subgrade reaction presented in Table 10 was applied, which has been determined from SPT, CPT, and further ground in-vestigation (Geotechnik Adam ZT GmbH 2009a,b,c).
Table 10: Horizontal modulus of subgrade reaction.
depth
modulus of horizontal sub-grade reaction
distribution of modulus of
horizontal sub-grade reaction
above top of layer M-K 0 MN/m³ -
top of laver M-K 100 MN/m³ linear
bottom of laver M-K 200 MN/m³
below top of laver M-ps 500 MN/m³ constant
The following additional specifications had to be
considered: Overall bearing capacity of a pile group founda-
tion depends on the pile spacing as well and therefore has to be taken into account. Pile spac-ing has to be e ≥ 2.5 · D, otherwise a reduction of shear parameters has to be performed.
Distance of excavation level to bedding zone has to be ≥ 3.0 m.
Horizontal stresses in the bedding zone must not exceed the passive earth pressure.
Group factors αL and αQ according to DIN 1054 have to be considered.
According to DIN 1054 (2005) and ÖNORM B 1997-1-3 (draft, 2007) a minimum embedding depth in the sound marl of tE ≥ 5 m has to be taken into account.
Figure 23. Geotechnical design parameters exemplary for Pier 6 (left) and Pier 7 (right).
In Figure 23 the geotechnical design parameters
derived from the soil parameters take into account the applied standards according to EC 7 (2006) are il-lustrated for Pier 6 (box-shaped foundation embed-ded in marl) and Pier 7 (pile group foundation em-bedded in rock).
3.5 Box-shaped foundation for the pylon at Pier 6
3.5.1 Layout and calculation model for box-shaped foundation
In the following the box-shaped foundation for the pylon at Pier 6 is described in more detail. It consists of an encasing diaphragm wall and piles inside (see Figure 24): Piles: 113 piles with a diameter of 1.5 m Pile length: 29.0 m Diaphragm wall: thickness of 1.0 m, length of
37 m Pile cap: diameter of 25.0, 30.0 and 34.0 m and a
total thickness of 8.0 m
The total load (serviceability limit state) amounted to 602 MN, whereas dead load of piles, diaphragm wall and pile cap were not included. The maximum working load of a single pile was 3.7 MN. Taking in-to account the additional load due to the dead load of the pile raft (uplift is considered for ground water level at low navigation level) the maximum working load of a single pile amounted to 4.4 MN (Hinter-plattner et al. 2011).
Compared to the original conceptual design a re-duction of the number of piles could be achieved. The encasing diaphragm wall additionally served as a retaining wall for the construction pit of the pile raft. Thus, no additional measures were necessary to se-cure the construction pit against earth pressure, traf-fic loads and water pressure in particular in case of floods.
The calculation model for the foundation substruc-ture illustrated in Figure 25 was established by con-sidering the geometry and the stiffness of the founda-tion elements (diaphragm wall, piles, and pile raft).
Adam
119
The pile foot was embedded within sound marl; the vertical modulus of subgrade reaction was defined in the following range taking into account the single pile load, the stiffness modulus of the soil, and the expected settlement:
kS,V = 75 – 83 MN/m³ (2) For the design of the pile foundation the distribu-
tion of the horizontal modulus of subgrade reaction presented in Table 8 was applied, which was deter-mined from SPT, CPT, and further ground investiga-tion (Geotechnik Adam ZT GmbH 2009a,b,c).
Table 8: Horizontal modulus of subgrade reaction.
depth modulus of hor-
izontal sub-grade reaction
distribution of modulus of hor-
izontal sub-grade reaction
above top of layer P-al 0 MN/m³ linear
bottom of layer P-al 25 MN/m³
top of laver S-al 50 MN/m³ linear
bottom of laver S-al 100 MN/m³ top of weathered marl M- lg,l 100 MN/m³
constant bottom of weathered marl M- lg,l 100 MN/m³
below top of grey unal-tered marls M 150 MN/m³ constant
Table 9: Characteristic values of shaft friction and base resistance pressure of single piles. Rock values according to DIN 1054 (2005).
layer
description
shaft friction
qs,k [kN/m²]
base resistance pressure qb,k [kN/m²]
s/D= 0.02
s/D= 0.03
s/D= 0.1
G-al Silty-sandy clays with mud interbeds and lenses
0 - - -
P-al Medium-grained to fine-grained sands - river bed facies
0 - - -
S-al Gravels – River (fluvial)- lacus-trine sediments
0 -
M-K Limestone 126 -
M-ps Sandstone 500 5,000
At Piers 7 and 8 the rock surface was found in a depth of about 17 m below actual ground surface; thus tip resistance piles (end bearing piles) had to be used. For geotechnical design of the pile foundation (pile group) characteristic values for shaft friction and base resistance pressure (see Table 9) were ap-plied (Geotechnik Adam ZT GmbH 2009a,b,c).
If the pile foot was embedded within the sound rock, the vertical modulus of subgrade reaction was defined in the following range taking into account the single pile load, the stiffness modulus of the soil, and the expected settlement:
kS,V = 1,000 MN/m³ (3) For the design of the pile foundation the distribu-
tion of the horizontal modulus of subgrade reaction presented in Table 10 was applied, which has been determined from SPT, CPT, and further ground in-vestigation (Geotechnik Adam ZT GmbH 2009a,b,c).
Table 10: Horizontal modulus of subgrade reaction.
depth
modulus of horizontal sub-grade reaction
distribution of modulus of
horizontal sub-grade reaction
above top of layer M-K 0 MN/m³ -
top of laver M-K 100 MN/m³ linear
bottom of laver M-K 200 MN/m³
below top of laver M-ps 500 MN/m³ constant
The following additional specifications had to be
considered: Overall bearing capacity of a pile group founda-
tion depends on the pile spacing as well and therefore has to be taken into account. Pile spac-ing has to be e ≥ 2.5 · D, otherwise a reduction of shear parameters has to be performed.
Distance of excavation level to bedding zone has to be ≥ 3.0 m.
Horizontal stresses in the bedding zone must not exceed the passive earth pressure.
Group factors αL and αQ according to DIN 1054 have to be considered.
According to DIN 1054 (2005) and ÖNORM B 1997-1-3 (draft, 2007) a minimum embedding depth in the sound marl of tE ≥ 5 m has to be taken into account.
Figure 23. Geotechnical design parameters exemplary for Pier 6 (left) and Pier 7 (right).
In Figure 23 the geotechnical design parameters
derived from the soil parameters take into account the applied standards according to EC 7 (2006) are il-lustrated for Pier 6 (box-shaped foundation embed-ded in marl) and Pier 7 (pile group foundation em-bedded in rock).
3.5 Box-shaped foundation for the pylon at Pier 6
3.5.1 Layout and calculation model for box-shaped foundation
In the following the box-shaped foundation for the pylon at Pier 6 is described in more detail. It consists of an encasing diaphragm wall and piles inside (see Figure 24): Piles: 113 piles with a diameter of 1.5 m Pile length: 29.0 m Diaphragm wall: thickness of 1.0 m, length of
37 m Pile cap: diameter of 25.0, 30.0 and 34.0 m and a
total thickness of 8.0 m
The total load (serviceability limit state) amounted to 602 MN, whereas dead load of piles, diaphragm wall and pile cap were not included. The maximum working load of a single pile was 3.7 MN. Taking in-to account the additional load due to the dead load of the pile raft (uplift is considered for ground water level at low navigation level) the maximum working load of a single pile amounted to 4.4 MN (Hinter-plattner et al. 2011).
Compared to the original conceptual design a re-duction of the number of piles could be achieved. The encasing diaphragm wall additionally served as a retaining wall for the construction pit of the pile raft. Thus, no additional measures were necessary to se-cure the construction pit against earth pressure, traf-fic loads and water pressure in particular in case of floods.
The calculation model for the foundation substruc-ture illustrated in Figure 25 was established by con-sidering the geometry and the stiffness of the founda-tion elements (diaphragm wall, piles, and pile raft).
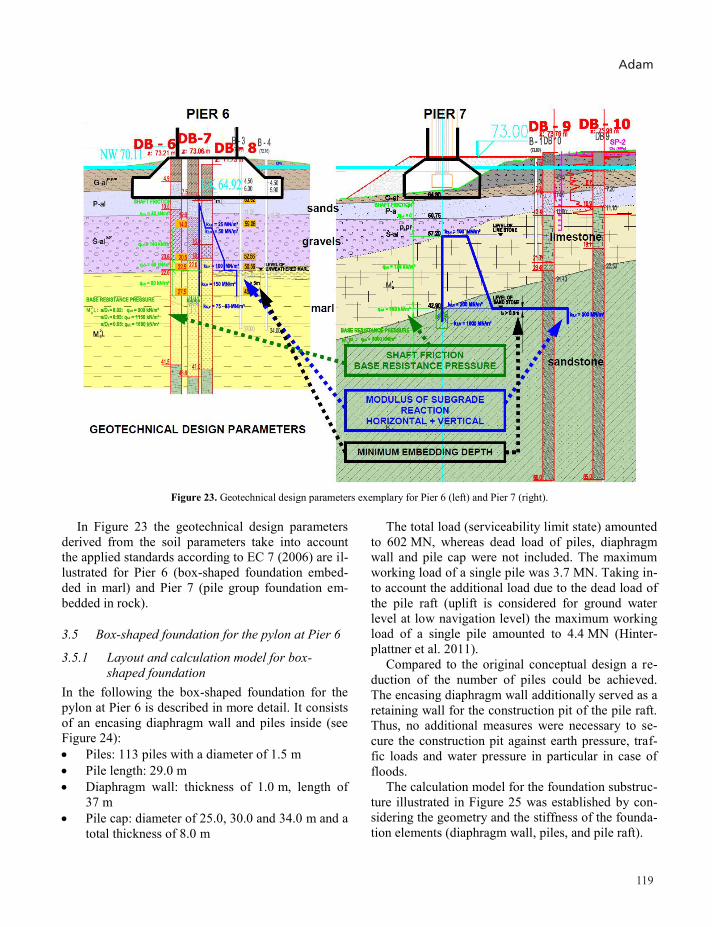
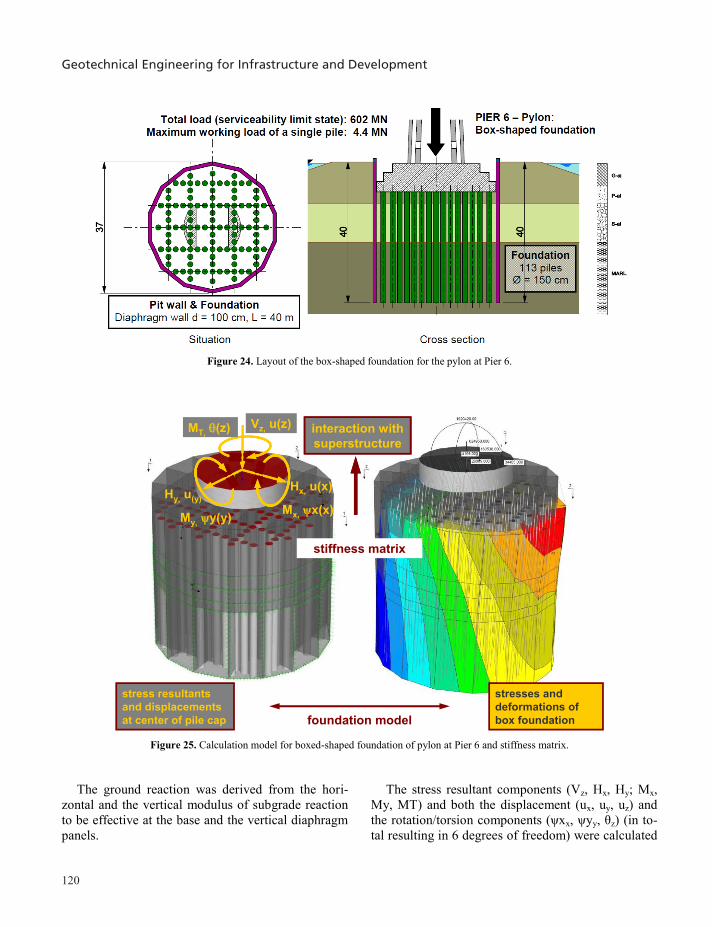
Geotechnical Engineering for Infrastructure and Development
120
Figure 24. Layout of the box-shaped foundation for the pylon at Pier 6.
Vz, u(z)
Hy, u(y)Hx, u(x)
MT, (z)
Mx, x(x)My, y(y)
stress resultants and displacements at center of pile cap
stresses and deformations of box foundationfoundation model
stiffness matrix
interaction with superstructureinteraction with superstructure
Figure 25. Calculation model for boxed-shaped foundation of pylon at Pier 6 and stiffness matrix.
The ground reaction was derived from the hori-zontal and the vertical modulus of subgrade reaction to be effective at the base and the vertical diaphragm panels.
The stress resultant components (Vz, Hx, Hy; Mx, My, MT) and both the displacement (ux, uy, uz) and the rotation/torsion components (ψxx, ψyy, θz) (in to-tal resulting in 6 degrees of freedom) were calculated
for a unit load at the top centre of the pile raft in or-der to derive the stiffness matrix of the box-shaped foundation compound interacting with the bridge su-perstructure. Stresses and deformations were then de-termined applying the substructure technique cou-pling the foundations of all piers with the bridge superstructure.
3.5.2 Trial piles In order to verify the soil parameters used for the cal-culation and design of the Sava Bridge pile founda-tions, four trial piles at Piers 5, 6 and 7 were installed and tested. The test load was assessed as the working load multiplied by a safety factor of 2.125 according to EC 7-1 (design situation BS1).
As an example Figure 26 shows measurement re-sults of trial pile No. 2, situated at Pier 6, with a di-ameter of 1.5 m, a length of 38.1 m and a maximum test load of 9.6 MN (considering a working load of 4.4 MN). Up to a depth of 8 m, which corresponds to a depth of the designed pile raft, an elimination pipe was installed in order to avoid skin friction within the upper soil layers. At the maximum load stage meas-ured settlements were 7.3 mm, with a plastic portion of 2.7 mm. The ratio of settlement to pile diameter was s/D = 0.0049 related to total settlements. The measurement results have shown that a base re-sistance of qb = 122 kN/m² (equates to 216 kN) oc-curred at the maximum load stage. The average skin
friction within sand layers (P-al) and gravel layers (S-al) and marl (M) was approx. qs = 56 kN/m².
By means of measurement results (particularly with regard to measured deformation) it was assumed that the ultimate limit state was not reached with the test load of 9.6 MN. This means, that the bearing ca-pacity was higher than the test load.
Hence, bearing capacity was better than expected. Due to rock-similar behaviour of marls, skin friction within layers P-al and S-al (both granular soil) was mobilised to a minor extent only, because of low ver-tical deformations. Although the ultimate bearing ca-pacity, base resistance and skin friction of each single layer could not be determined by pile load tests, it was proven that the intended workloads could be transferred to the ground with low deformations and sufficient safety. Thus, design parameters (Geotech-nik Adam ZT GmbH 2009a,b,c) were approved and could be used for design of pile foundations.
Finally, the results of these trial piles also provid-ed information about the settlements of a single pile and were applied for settlement calculations.
3.6 Settlements
Foundations also were designed for the servicea-bility limit state (SLS) so that calculated settlements met the requirements derived from the allowable de-formations of the superstructure. According to Brandl (2005) for settlement analyses the monolith-
Figure 26. Results of axial static pile load test at Pier 6; maximum test load of 9.6 MN with a maximum working load of 4.4 MN (Bauer
Spezialtiefbau GmbH 2009).
Adam
121
Figure 24. Layout of the box-shaped foundation for the pylon at Pier 6.
Vz, u(z)
Hy, u(y)Hx, u(x)
MT, (z)
Mx, x(x)My, y(y)
stress resultants and displacements at center of pile cap
stresses and deformations of box foundationfoundation model
stiffness matrix
interaction with superstructureinteraction with superstructure
Figure 25. Calculation model for boxed-shaped foundation of pylon at Pier 6 and stiffness matrix.
The ground reaction was derived from the hori-zontal and the vertical modulus of subgrade reaction to be effective at the base and the vertical diaphragm panels.
The stress resultant components (Vz, Hx, Hy; Mx, My, MT) and both the displacement (ux, uy, uz) and the rotation/torsion components (ψxx, ψyy, θz) (in to-tal resulting in 6 degrees of freedom) were calculated
for a unit load at the top centre of the pile raft in or-der to derive the stiffness matrix of the box-shaped foundation compound interacting with the bridge su-perstructure. Stresses and deformations were then de-termined applying the substructure technique cou-pling the foundations of all piers with the bridge superstructure.
3.5.2 Trial piles In order to verify the soil parameters used for the cal-culation and design of the Sava Bridge pile founda-tions, four trial piles at Piers 5, 6 and 7 were installed and tested. The test load was assessed as the working load multiplied by a safety factor of 2.125 according to EC 7-1 (design situation BS1).
As an example Figure 26 shows measurement re-sults of trial pile No. 2, situated at Pier 6, with a di-ameter of 1.5 m, a length of 38.1 m and a maximum test load of 9.6 MN (considering a working load of 4.4 MN). Up to a depth of 8 m, which corresponds to a depth of the designed pile raft, an elimination pipe was installed in order to avoid skin friction within the upper soil layers. At the maximum load stage meas-ured settlements were 7.3 mm, with a plastic portion of 2.7 mm. The ratio of settlement to pile diameter was s/D = 0.0049 related to total settlements. The measurement results have shown that a base re-sistance of qb = 122 kN/m² (equates to 216 kN) oc-curred at the maximum load stage. The average skin
friction within sand layers (P-al) and gravel layers (S-al) and marl (M) was approx. qs = 56 kN/m².
By means of measurement results (particularly with regard to measured deformation) it was assumed that the ultimate limit state was not reached with the test load of 9.6 MN. This means, that the bearing ca-pacity was higher than the test load.
Hence, bearing capacity was better than expected. Due to rock-similar behaviour of marls, skin friction within layers P-al and S-al (both granular soil) was mobilised to a minor extent only, because of low ver-tical deformations. Although the ultimate bearing ca-pacity, base resistance and skin friction of each single layer could not be determined by pile load tests, it was proven that the intended workloads could be transferred to the ground with low deformations and sufficient safety. Thus, design parameters (Geotech-nik Adam ZT GmbH 2009a,b,c) were approved and could be used for design of pile foundations.
Finally, the results of these trial piles also provid-ed information about the settlements of a single pile and were applied for settlement calculations.
3.6 Settlements
Foundations also were designed for the servicea-bility limit state (SLS) so that calculated settlements met the requirements derived from the allowable de-formations of the superstructure. According to Brandl (2005) for settlement analyses the monolith-
Figure 26. Results of axial static pile load test at Pier 6; maximum test load of 9.6 MN with a maximum working load of 4.4 MN (Bauer
Spezialtiefbau GmbH 2009).
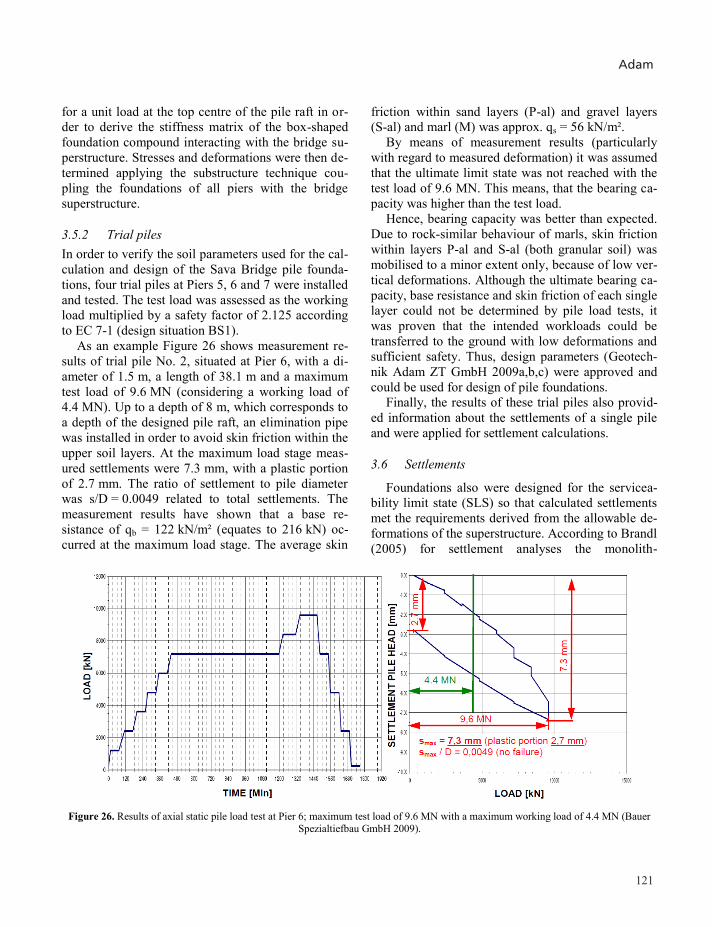
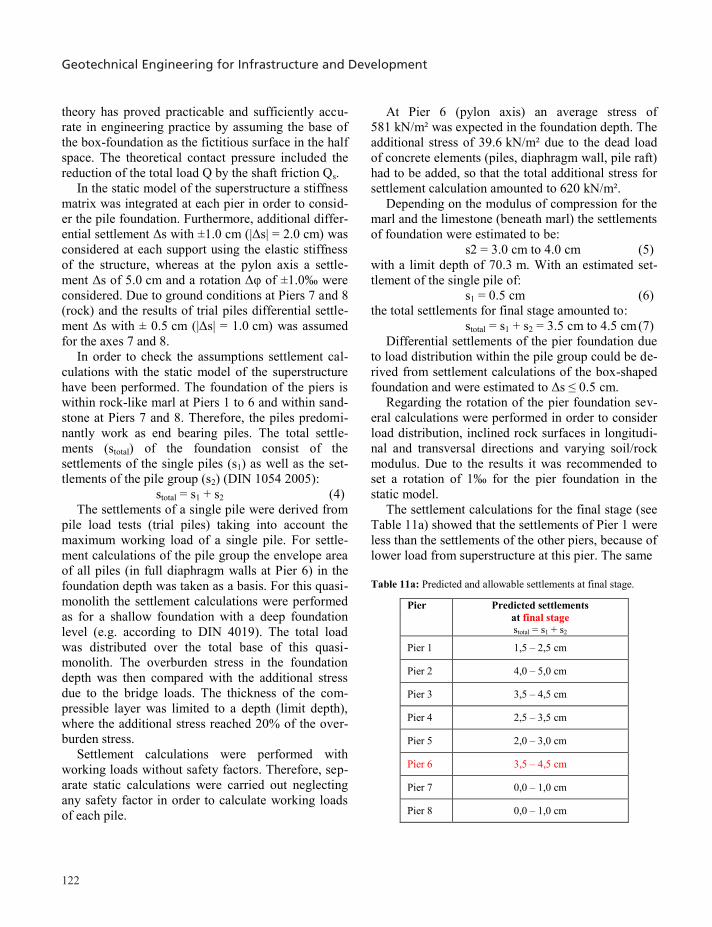
Geotechnical Engineering for Infrastructure and Development
122
theory has proved practicable and sufficiently accu-rate in engineering practice by assuming the base of the box-foundation as the fictitious surface in the half space. The theoretical contact pressure included the reduction of the total load Q by the shaft friction Qs.
In the static model of the superstructure a stiffness matrix was integrated at each pier in order to consid-er the pile foundation. Furthermore, additional differ-ential settlement Δs with ±1.0 cm (|Δs| = 2.0 cm) was considered at each support using the elastic stiffness of the structure, whereas at the pylon axis a settle-ment Δs of 5.0 cm and a rotation Δφ of ±1.0‰ were considered. Due to ground conditions at Piers 7 and 8 (rock) and the results of trial piles differential settle-ment Δs with ± 0.5 cm (|Δs| = 1.0 cm) was assumed for the axes 7 and 8.
In order to check the assumptions settlement cal-culations with the static model of the superstructure have been performed. The foundation of the piers is within rock-like marl at Piers 1 to 6 and within sand-stone at Piers 7 and 8. Therefore, the piles predomi-nantly work as end bearing piles. The total settle-ments (stotal) of the foundation consist of the settlements of the single piles (s1) as well as the set-tlements of the pile group (s2) (DIN 1054 2005):
stotal = s1 + s2 (4) The settlements of a single pile were derived from
pile load tests (trial piles) taking into account the maximum working load of a single pile. For settle-ment calculations of the pile group the envelope area of all piles (in full diaphragm walls at Pier 6) in the foundation depth was taken as a basis. For this quasi-monolith the settlement calculations were performed as for a shallow foundation with a deep foundation level (e.g. according to DIN 4019). The total load was distributed over the total base of this quasi-monolith. The overburden stress in the foundation depth was then compared with the additional stress due to the bridge loads. The thickness of the com-pressible layer was limited to a depth (limit depth), where the additional stress reached 20% of the over-burden stress.
Settlement calculations were performed with working loads without safety factors. Therefore, sep-arate static calculations were carried out neglecting any safety factor in order to calculate working loads of each pile.
At Pier 6 (pylon axis) an average stress of 581 kN/m² was expected in the foundation depth. The additional stress of 39.6 kN/m² due to the dead load of concrete elements (piles, diaphragm wall, pile raft) had to be added, so that the total additional stress for settlement calculation amounted to 620 kN/m².
Depending on the modulus of compression for the marl and the limestone (beneath marl) the settlements of foundation were estimated to be:
s2 = 3.0 cm to 4.0 cm (5) with a limit depth of 70.3 m. With an estimated set-tlement of the single pile of:
s1 = 0.5 cm (6) the total settlements for final stage amounted to:
stotal = s1 + s2 = 3.5 cm to 4.5 cm (7) Differential settlements of the pier foundation due
to load distribution within the pile group could be de-rived from settlement calculations of the box-shaped foundation and were estimated to Δs ≤ 0.5 cm.
Regarding the rotation of the pier foundation sev-eral calculations were performed in order to consider load distribution, inclined rock surfaces in longitudi-nal and transversal directions and varying soil/rock modulus. Due to the results it was recommended to set a rotation of 1‰ for the pier foundation in the static model.
The settlement calculations for the final stage (see Table 11a) showed that the settlements of Pier 1 were less than the settlements of the other piers, because of lower load from superstructure at this pier. The same
Table 11a: Predicted and allowable settlements at final stage.
Pier
Predicted settlements at final stage stotal = s1 + s2
Pier 1 1,5 – 2,5 cm
Pier 2 4,0 – 5,0 cm
Pier 3 3,5 – 4,5 cm
Pier 4 2,5 – 3,5 cm
Pier 5 2,0 – 3,0 cm
Pier 6 3,5 – 4,5 cm
Pier 7 0,0 – 1,0 cm
Pier 8 0,0 – 1,0 cm
situation occurs at Pier 5: due to the cables a part of the load from superstructure is transferred to Pier 6, which results in a minor foundation load at Pier 5. Piers 1 to 6 are founded within marl. However, at Pier 6 the settlements are relatively low, although the total load is high in comparison to the other piers. The reason is that at Pier 6 the limestone (rock) is on-ly a few meters below foundation level. The lime-stone was considered only at Pier 6 in the settlement calculations, because the interface was explored only in exploratory drillings at Pier 6.
However, the differential settlements for the su-perstructure shown in Table 11b are not relevant, be-cause construction stages and settlements, which have already occurred until bearings for superstruc-ture were installed, were not considered. Therefore, additional settlement calculations for the following construction stages were performed: Construction stage A: Start of construction
works. Construction stage B: Completion of pier con-
struction.
Construction stage C: Launching of superstruc-ture finished.
Final stage. Table 11b: Differential settlements after pier construction.
Pier
Differential settlements after pier construction
spredicted
sallowable
(superstructure) Pier 1 2,0 – 2,5 cm 2,7 cm
Pier 2 0,5 – 1,0 cm 2,1 cm
Pier 3 0,5 – 1,0 cm 2,4 cm
Pier 4 1,0 – 1,5 cm 2,4 cm
Pier 5 2,0 – 2,5 cm 5,4 cm
Pier 6 3,0 – 3,5 cm 7,1 cm
Pier 7 0,0 – 0,5 cm 1,2 cm
Pier 8
Figure 27. Main construction sequences of deep foundation works for box-shaped foundation at Pier 6 on man-made working platform at Ada Ciganlija Island (construction of diaphragm walls and piles, removal of pile heads after concreting, placing of blinding layer, rein-forcement works, construction of pile raft, scaffolding and formwork for pylon).
Adam
123
theory has proved practicable and sufficiently accu-rate in engineering practice by assuming the base of the box-foundation as the fictitious surface in the half space. The theoretical contact pressure included the reduction of the total load Q by the shaft friction Qs.
In the static model of the superstructure a stiffness matrix was integrated at each pier in order to consid-er the pile foundation. Furthermore, additional differ-ential settlement Δs with ±1.0 cm (|Δs| = 2.0 cm) was considered at each support using the elastic stiffness of the structure, whereas at the pylon axis a settle-ment Δs of 5.0 cm and a rotation Δφ of ±1.0‰ were considered. Due to ground conditions at Piers 7 and 8 (rock) and the results of trial piles differential settle-ment Δs with ± 0.5 cm (|Δs| = 1.0 cm) was assumed for the axes 7 and 8.
In order to check the assumptions settlement cal-culations with the static model of the superstructure have been performed. The foundation of the piers is within rock-like marl at Piers 1 to 6 and within sand-stone at Piers 7 and 8. Therefore, the piles predomi-nantly work as end bearing piles. The total settle-ments (stotal) of the foundation consist of the settlements of the single piles (s1) as well as the set-tlements of the pile group (s2) (DIN 1054 2005):
stotal = s1 + s2 (4) The settlements of a single pile were derived from
pile load tests (trial piles) taking into account the maximum working load of a single pile. For settle-ment calculations of the pile group the envelope area of all piles (in full diaphragm walls at Pier 6) in the foundation depth was taken as a basis. For this quasi-monolith the settlement calculations were performed as for a shallow foundation with a deep foundation level (e.g. according to DIN 4019). The total load was distributed over the total base of this quasi-monolith. The overburden stress in the foundation depth was then compared with the additional stress due to the bridge loads. The thickness of the com-pressible layer was limited to a depth (limit depth), where the additional stress reached 20% of the over-burden stress.
Settlement calculations were performed with working loads without safety factors. Therefore, sep-arate static calculations were carried out neglecting any safety factor in order to calculate working loads of each pile.
At Pier 6 (pylon axis) an average stress of 581 kN/m² was expected in the foundation depth. The additional stress of 39.6 kN/m² due to the dead load of concrete elements (piles, diaphragm wall, pile raft) had to be added, so that the total additional stress for settlement calculation amounted to 620 kN/m².
Depending on the modulus of compression for the marl and the limestone (beneath marl) the settlements of foundation were estimated to be:
s2 = 3.0 cm to 4.0 cm (5) with a limit depth of 70.3 m. With an estimated set-tlement of the single pile of:
s1 = 0.5 cm (6) the total settlements for final stage amounted to:
stotal = s1 + s2 = 3.5 cm to 4.5 cm (7) Differential settlements of the pier foundation due
to load distribution within the pile group could be de-rived from settlement calculations of the box-shaped foundation and were estimated to Δs ≤ 0.5 cm.
Regarding the rotation of the pier foundation sev-eral calculations were performed in order to consider load distribution, inclined rock surfaces in longitudi-nal and transversal directions and varying soil/rock modulus. Due to the results it was recommended to set a rotation of 1‰ for the pier foundation in the static model.
The settlement calculations for the final stage (see Table 11a) showed that the settlements of Pier 1 were less than the settlements of the other piers, because of lower load from superstructure at this pier. The same
Table 11a: Predicted and allowable settlements at final stage.
Pier
Predicted settlements at final stage stotal = s1 + s2
Pier 1 1,5 – 2,5 cm
Pier 2 4,0 – 5,0 cm
Pier 3 3,5 – 4,5 cm
Pier 4 2,5 – 3,5 cm
Pier 5 2,0 – 3,0 cm
Pier 6 3,5 – 4,5 cm
Pier 7 0,0 – 1,0 cm
Pier 8 0,0 – 1,0 cm
situation occurs at Pier 5: due to the cables a part of the load from superstructure is transferred to Pier 6, which results in a minor foundation load at Pier 5. Piers 1 to 6 are founded within marl. However, at Pier 6 the settlements are relatively low, although the total load is high in comparison to the other piers. The reason is that at Pier 6 the limestone (rock) is on-ly a few meters below foundation level. The lime-stone was considered only at Pier 6 in the settlement calculations, because the interface was explored only in exploratory drillings at Pier 6.
However, the differential settlements for the su-perstructure shown in Table 11b are not relevant, be-cause construction stages and settlements, which have already occurred until bearings for superstruc-ture were installed, were not considered. Therefore, additional settlement calculations for the following construction stages were performed: Construction stage A: Start of construction
works. Construction stage B: Completion of pier con-
struction.
Construction stage C: Launching of superstruc-ture finished.
Final stage. Table 11b: Differential settlements after pier construction.
Pier
Differential settlements after pier construction
spredicted
sallowable
(superstructure) Pier 1 2,0 – 2,5 cm 2,7 cm
Pier 2 0,5 – 1,0 cm 2,1 cm
Pier 3 0,5 – 1,0 cm 2,4 cm
Pier 4 1,0 – 1,5 cm 2,4 cm
Pier 5 2,0 – 2,5 cm 5,4 cm
Pier 6 3,0 – 3,5 cm 7,1 cm
Pier 7 0,0 – 0,5 cm 1,2 cm
Pier 8
Figure 27. Main construction sequences of deep foundation works for box-shaped foundation at Pier 6 on man-made working platform at Ada Ciganlija Island (construction of diaphragm walls and piles, removal of pile heads after concreting, placing of blinding layer, rein-forcement works, construction of pile raft, scaffolding and formwork for pylon).
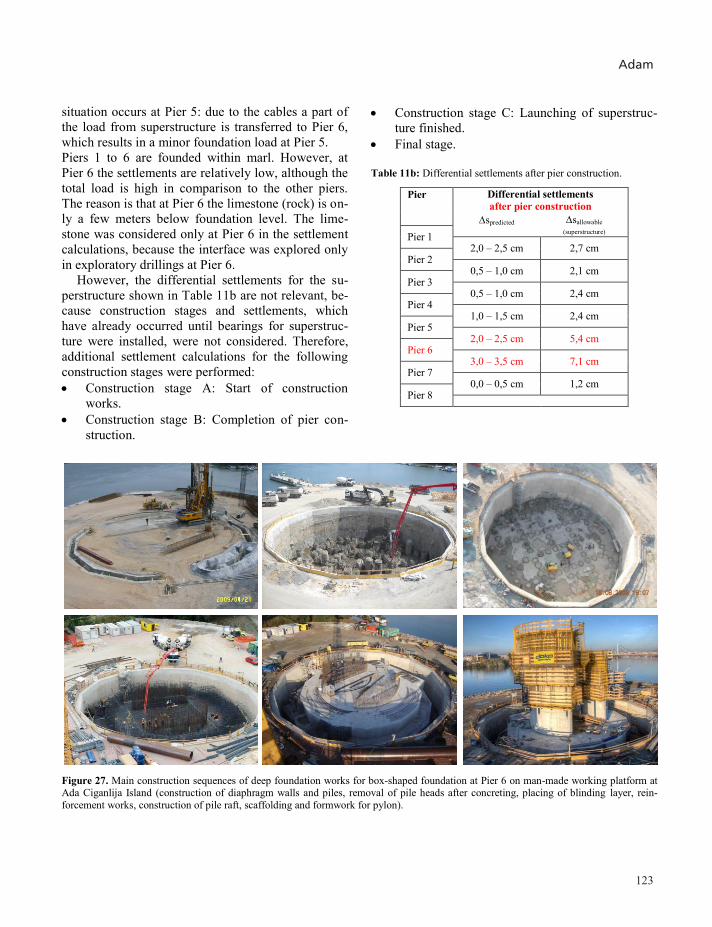
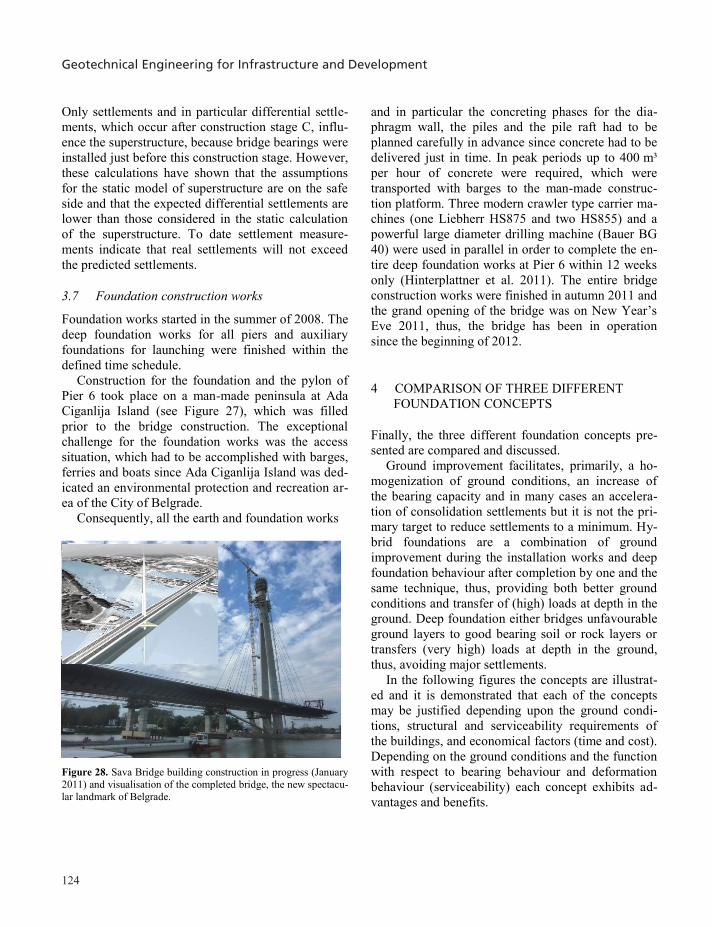
Geotechnical Engineering for Infrastructure and Development
124
Only settlements and in particular differential settle-ments, which occur after construction stage C, influ-ence the superstructure, because bridge bearings were installed just before this construction stage. However, these calculations have shown that the assumptions for the static model of superstructure are on the safe side and that the expected differential settlements are lower than those considered in the static calculation of the superstructure. To date settlement measure-ments indicate that real settlements will not exceed the predicted settlements.
3.7 Foundation construction works
Foundation works started in the summer of 2008. The deep foundation works for all piers and auxiliary foundations for launching were finished within the defined time schedule.
Construction for the foundation and the pylon of Pier 6 took place on a man-made peninsula at Ada Ciganlija Island (see Figure 27), which was filled prior to the bridge construction. The exceptional challenge for the foundation works was the access situation, which had to be accomplished with barges, ferries and boats since Ada Ciganlija Island was ded-icated an environmental protection and recreation ar-ea of the City of Belgrade.
Consequently, all the earth and foundation works
Figure 28. Sava Bridge building construction in progress (January 2011) and visualisation of the completed bridge, the new spectacu-lar landmark of Belgrade.
and in particular the concreting phases for the dia-phragm wall, the piles and the pile raft had to be planned carefully in advance since concrete had to be delivered just in time. In peak periods up to 400 m³ per hour of concrete were required, which were transported with barges to the man-made construc-tion platform. Three modern crawler type carrier ma-chines (one Liebherr HS875 and two HS855) and a powerful large diameter drilling machine (Bauer BG 40) were used in parallel in order to complete the en-tire deep foundation works at Pier 6 within 12 weeks only (Hinterplattner et al. 2011). The entire bridge construction works were finished in autumn 2011 and the grand opening of the bridge was on New Year’s Eve 2011, thus, the bridge has been in operation since the beginning of 2012.
4 COMPARISON OF THREE DIFFERENT FOUNDATION CONCEPTS
Finally, the three different foundation concepts pre-sented are compared and discussed.
Ground improvement facilitates, primarily, a ho-mogenization of ground conditions, an increase of the bearing capacity and in many cases an accelera-tion of consolidation settlements but it is not the pri-mary target to reduce settlements to a minimum. Hy-brid foundations are a combination of ground improvement during the installation works and deep foundation behaviour after completion by one and the same technique, thus, providing both better ground conditions and transfer of (high) loads at depth in the ground. Deep foundation either bridges unfavourable ground layers to good bearing soil or rock layers or transfers (very high) loads at depth in the ground, thus, avoiding major settlements.
In the following figures the concepts are illustrat-ed and it is demonstrated that each of the concepts may be justified depending upon the ground condi-tions, structural and serviceability requirements of the buildings, and economical factors (time and cost). Depending on the ground conditions and the function with respect to bearing behaviour and deformation behaviour (serviceability) each concept exhibits ad-vantages and benefits.
GROUND IMPROVEMENT HYBRID FOUNDATION DEEP FOUNDATION
working platform
stone columns
soft
soil
soft
soil
soft
soil
distribution layer (unbound or bound)
distribution layer (unbound or bound)
working platform
grouted stone columns
negative skin friction
bored piles
Figure 29. Comparison of foundation concepts.
GROUND IMPROVEMENT HYBRID FOUNDATION DEEP FOUNDATION
Ground & Function:
ground conditionssoft & loose soil (cl, si, sa, gr)fine grained soil: c ≥ ≈10 kN/m²
groundwater conditionsno restrictions
load transfer into soillateral (primary)vertical (secondary)
bearing behaviourshear strength of gravel & soilhorizontal beddingtip resistance (optional)
deformation behavioursettlement reductiondifferential settlement control
Application:
building structurenon-sensitive (to settlements)statically determinate (pref.)
load magnitude & distributionlow to mediumdistributed, (line, single)uniform (preferably)
foundation typeslab, (strip or single) “flexible” (preferably)combined with distribution layer
construction constraintsvibrations
working platform
stone columns
soft
soil
distribution layer (unbound or bound)
improvement and homogenization of soil
Figure 30. Ground improvement.
Adam
125
Only settlements and in particular differential settle-ments, which occur after construction stage C, influ-ence the superstructure, because bridge bearings were installed just before this construction stage. However, these calculations have shown that the assumptions for the static model of superstructure are on the safe side and that the expected differential settlements are lower than those considered in the static calculation of the superstructure. To date settlement measure-ments indicate that real settlements will not exceed the predicted settlements.
3.7 Foundation construction works
Foundation works started in the summer of 2008. The deep foundation works for all piers and auxiliary foundations for launching were finished within the defined time schedule.
Construction for the foundation and the pylon of Pier 6 took place on a man-made peninsula at Ada Ciganlija Island (see Figure 27), which was filled prior to the bridge construction. The exceptional challenge for the foundation works was the access situation, which had to be accomplished with barges, ferries and boats since Ada Ciganlija Island was ded-icated an environmental protection and recreation ar-ea of the City of Belgrade.
Consequently, all the earth and foundation works
Figure 28. Sava Bridge building construction in progress (January 2011) and visualisation of the completed bridge, the new spectacu-lar landmark of Belgrade.
and in particular the concreting phases for the dia-phragm wall, the piles and the pile raft had to be planned carefully in advance since concrete had to be delivered just in time. In peak periods up to 400 m³ per hour of concrete were required, which were transported with barges to the man-made construc-tion platform. Three modern crawler type carrier ma-chines (one Liebherr HS875 and two HS855) and a powerful large diameter drilling machine (Bauer BG 40) were used in parallel in order to complete the en-tire deep foundation works at Pier 6 within 12 weeks only (Hinterplattner et al. 2011). The entire bridge construction works were finished in autumn 2011 and the grand opening of the bridge was on New Year’s Eve 2011, thus, the bridge has been in operation since the beginning of 2012.
4 COMPARISON OF THREE DIFFERENT FOUNDATION CONCEPTS
Finally, the three different foundation concepts pre-sented are compared and discussed.
Ground improvement facilitates, primarily, a ho-mogenization of ground conditions, an increase of the bearing capacity and in many cases an accelera-tion of consolidation settlements but it is not the pri-mary target to reduce settlements to a minimum. Hy-brid foundations are a combination of ground improvement during the installation works and deep foundation behaviour after completion by one and the same technique, thus, providing both better ground conditions and transfer of (high) loads at depth in the ground. Deep foundation either bridges unfavourable ground layers to good bearing soil or rock layers or transfers (very high) loads at depth in the ground, thus, avoiding major settlements.
In the following figures the concepts are illustrat-ed and it is demonstrated that each of the concepts may be justified depending upon the ground condi-tions, structural and serviceability requirements of the buildings, and economical factors (time and cost). Depending on the ground conditions and the function with respect to bearing behaviour and deformation behaviour (serviceability) each concept exhibits ad-vantages and benefits.
GROUND IMPROVEMENT HYBRID FOUNDATION DEEP FOUNDATION
working platform
stone columns
soft
soil
soft
soil
soft
soil
distribution layer (unbound or bound)
distribution layer (unbound or bound)
working platform
grouted stone columns
negative skin friction
bored piles
Figure 29. Comparison of foundation concepts.
GROUND IMPROVEMENT HYBRID FOUNDATION DEEP FOUNDATION
Ground & Function:
ground conditionssoft & loose soil (cl, si, sa, gr)fine grained soil: c ≥ ≈10 kN/m²
groundwater conditionsno restrictions
load transfer into soillateral (primary)vertical (secondary)
bearing behaviourshear strength of gravel & soilhorizontal beddingtip resistance (optional)
deformation behavioursettlement reductiondifferential settlement control
Application:
building structurenon-sensitive (to settlements)statically determinate (pref.)
load magnitude & distributionlow to mediumdistributed, (line, single)uniform (preferably)
foundation typeslab, (strip or single) “flexible” (preferably)combined with distribution layer
construction constraintsvibrations
working platform
stone columns
soft
soil
distribution layer (unbound or bound)
improvement and homogenization of soil
Figure 30. Ground improvement.
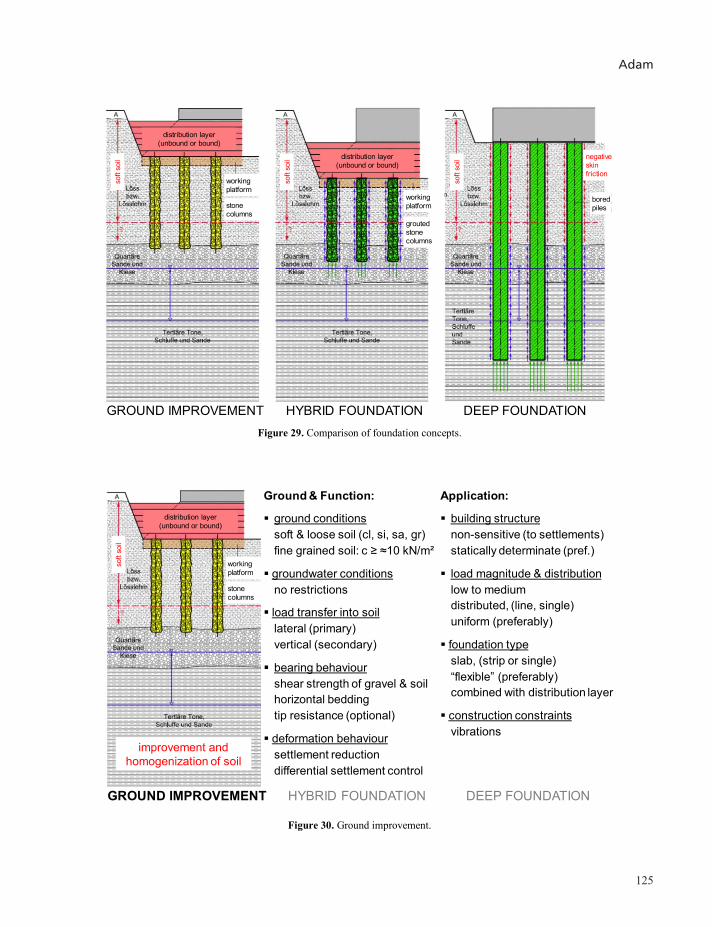
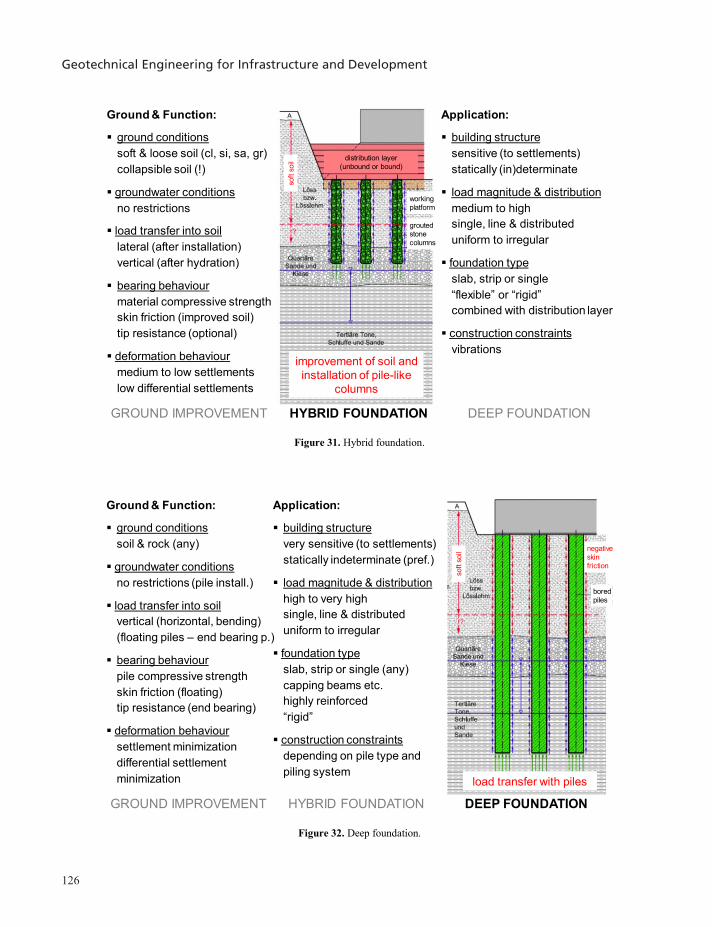
Geotechnical Engineering for Infrastructure and Development
126
Ground & Function:
ground conditionssoft & loose soil (cl, si, sa, gr)collapsible soil (!)
groundwater conditionsno restrictions
load transfer into soillateral (after installation)vertical (after hydration)
bearing behaviourmaterial compressive strengthskin friction (improved soil)tip resistance (optional)
deformation behaviourmedium to low settlementslow differential settlements
Application:
building structuresensitive (to settlements)statically (in)determinate
load magnitude & distributionmedium to highsingle, line & distributeduniform to irregular
foundation typeslab, strip or single “flexible” or “rigid”combined with distribution layer
construction constraintsvibrations
GROUND IMPROVEMENT HYBRID FOUNDATION DEEP FOUNDATION
soft
soil distribution layer
(unbound or bound)
working platform
grouted stone columns
improvement of soil and installation of pile-like
columns
Figure 31. Hybrid foundation.
GROUND IMPROVEMENT HYBRID FOUNDATION DEEP FOUNDATION
Ground & Function:
ground conditionssoil & rock (any)
groundwater conditionsno restrictions (pile install.)
load transfer into soilvertical (horizontal, bending)(floating piles – end bearing p.)
bearing behaviourpile compressive strengthskin friction (floating)tip resistance (end bearing)
deformation behavioursettlement minimizationdifferential settlement minimization
Application:
building structurevery sensitive (to settlements)statically indeterminate (pref.)
load magnitude & distributionhigh to very highsingle, line & distributeduniform to irregular
foundation typeslab, strip or single (any)capping beams etc.highly reinforced“rigid”
construction constraintsdepending on pile type and piling system
soft
soil negative
skin friction
bored piles
load transfer with piles
Figure 32. Deep foundation.
5 CONCLUSIONS
At first the ground improvement concept and in par-ticular the settlement behaviour of the new stadium in Klagenfurt is presented which was built from 2006 to 2007 for the European Soccer Championship EU-RO 2008. Due to the unfavourable soil conditions consisting of unconsolidated lake deposits underlain by moraine and the bed rock in varying depth, large settlements were predicted and significant differential settlements were expected due to non-uniform loads which had to be taken into account for compatibility requirements between adjacent structural elements. Ground conditions were improved and homogenized to depths of 18 m by installing stone columns using the vibro replacement technique. Long-term monitor-ing of settlements and a well instrumented field trial have been carried out to document the time-dependent settlement process and to investigate the performance of the floating stone column foundation. Back analysis using the Soft Soil Creep (SSC) model was performed to calculate the settlement process and final settlements. Results match well with meas-urements from extensometers and are in accordance with measured settlements of the foundation slab at the west side. Agreement on the east side is less satis-factory; one possible reason for this could be that the load has been overestimated in this part of the foun-dation.
Secondly the innovative hybrid foundation con-cept of CCPP Malženice is presented. The foundation measures for the 400 MW gas fired combined cycle power plant at Malženice, in the western part of Slo-vakia was constructed by E.ON Elektrárne, s.r.o., the Trakovice based subsidiary of E.ON Kraftwerke GmbH of Hannover, Germany. The foundations comprise deep soil improvement and deep foundation elements (hybrid foundation), and soil stabilization. The hybrid foundation was realized by grouted stone columns (pile-like bearing elements) through the col-lapsible loess layer and embedded in the gravel layer complex. The columns were produced by the deep vibro replacement technique and deep improvement of the soil around the columns due to the vibration process. Thus, anticipation of collapse of the soil structure and compaction of loess was caused. The working platform, stabilized by the mixed-in-place method with a lime-cement binder (KZM), ensured
the deep improvement and deep compaction. The fill-ing above the columns up to the level of the blinding layer has also been stabilized with KZM. The pre-sented innovative hybrid foundation concept was su-pervised by an extensive quality assurance system and was executed alternatively to the original founda-tion concept, which was based on bored piles. Thus, significantly shorter deep foundation elements in comparison with piles according to the original foun-dation concept could be realized due to avoiding negative skin friction along the deep foundation ele-ments.
Finally, the deep foundation concept of the new cable-stayed bridge over the Sava River in Belgrade near the entry of the Sava River into the River Dan-ube has been presented. The foundation at 8 piers for the new bridge over the Sava River in Belgrade was successfully accomplished based on an innovative design procedure according to EC 7. The Sava Bridge was the first project of that dimension which was executed in accordance with EC 7 using the na-tional application rules of Austria for pile founda-tions of a major bridge. In conclusion the foundations were economically designed in such a way that they exhibit sufficient overall safety against failure and al-so satisfactory behaviour in the serviceability limit-state, thus, considering the life time of the bridge.
All the bridge foundations showed satisfactory set-tlement behaviour already during construction and after completion. The bridge is the new landmark of Belgrade; nevertheless the deep foundations are in-visible but will provide a safe basis for the lifetime of the new Sava Bridge.
When comparing the different foundation con-cepts, in conclusion, no ranking can be made with re-spect to the issue of which is the best concept. Each may be justified depending upon the ground condi-tions, structural and serviceability requirements of the buildings, and economic factors (time and cost). Since every single building is a prototype taking into account the ground conditions and the function with respect to bearing behaviour and deformation behav-iour (serviceability) the most appropriate foundation concept has to be assessed in a profound geotechnical design procedure based on a comprehensive ground exploration and soil investigation programme, which needs continuous verification not only in the design phase but also during execution (monitoring etc.).
Adam
127
Ground & Function:
ground conditionssoft & loose soil (cl, si, sa, gr)collapsible soil (!)
groundwater conditionsno restrictions
load transfer into soillateral (after installation)vertical (after hydration)
bearing behaviourmaterial compressive strengthskin friction (improved soil)tip resistance (optional)
deformation behaviourmedium to low settlementslow differential settlements
Application:
building structuresensitive (to settlements)statically (in)determinate
load magnitude & distributionmedium to highsingle, line & distributeduniform to irregular
foundation typeslab, strip or single “flexible” or “rigid”combined with distribution layer
construction constraintsvibrations
GROUND IMPROVEMENT HYBRID FOUNDATION DEEP FOUNDATION
soft
soil distribution layer
(unbound or bound)
working platform
grouted stone columns
improvement of soil and installation of pile-like
columns
Figure 31. Hybrid foundation.
GROUND IMPROVEMENT HYBRID FOUNDATION DEEP FOUNDATION
Ground & Function:
ground conditionssoil & rock (any)
groundwater conditionsno restrictions (pile install.)
load transfer into soilvertical (horizontal, bending)(floating piles – end bearing p.)
bearing behaviourpile compressive strengthskin friction (floating)tip resistance (end bearing)
deformation behavioursettlement minimizationdifferential settlement minimization
Application:
building structurevery sensitive (to settlements)statically indeterminate (pref.)
load magnitude & distributionhigh to very highsingle, line & distributeduniform to irregular
foundation typeslab, strip or single (any)capping beams etc.highly reinforced“rigid”
construction constraintsdepending on pile type and piling system
soft
soil negative
skin friction
bored piles
load transfer with piles
Figure 32. Deep foundation.
5 CONCLUSIONS
At first the ground improvement concept and in par-ticular the settlement behaviour of the new stadium in Klagenfurt is presented which was built from 2006 to 2007 for the European Soccer Championship EU-RO 2008. Due to the unfavourable soil conditions consisting of unconsolidated lake deposits underlain by moraine and the bed rock in varying depth, large settlements were predicted and significant differential settlements were expected due to non-uniform loads which had to be taken into account for compatibility requirements between adjacent structural elements. Ground conditions were improved and homogenized to depths of 18 m by installing stone columns using the vibro replacement technique. Long-term monitor-ing of settlements and a well instrumented field trial have been carried out to document the time-dependent settlement process and to investigate the performance of the floating stone column foundation. Back analysis using the Soft Soil Creep (SSC) model was performed to calculate the settlement process and final settlements. Results match well with meas-urements from extensometers and are in accordance with measured settlements of the foundation slab at the west side. Agreement on the east side is less satis-factory; one possible reason for this could be that the load has been overestimated in this part of the foun-dation.
Secondly the innovative hybrid foundation con-cept of CCPP Malženice is presented. The foundation measures for the 400 MW gas fired combined cycle power plant at Malženice, in the western part of Slo-vakia was constructed by E.ON Elektrárne, s.r.o., the Trakovice based subsidiary of E.ON Kraftwerke GmbH of Hannover, Germany. The foundations comprise deep soil improvement and deep foundation elements (hybrid foundation), and soil stabilization. The hybrid foundation was realized by grouted stone columns (pile-like bearing elements) through the col-lapsible loess layer and embedded in the gravel layer complex. The columns were produced by the deep vibro replacement technique and deep improvement of the soil around the columns due to the vibration process. Thus, anticipation of collapse of the soil structure and compaction of loess was caused. The working platform, stabilized by the mixed-in-place method with a lime-cement binder (KZM), ensured
the deep improvement and deep compaction. The fill-ing above the columns up to the level of the blinding layer has also been stabilized with KZM. The pre-sented innovative hybrid foundation concept was su-pervised by an extensive quality assurance system and was executed alternatively to the original founda-tion concept, which was based on bored piles. Thus, significantly shorter deep foundation elements in comparison with piles according to the original foun-dation concept could be realized due to avoiding negative skin friction along the deep foundation ele-ments.
Finally, the deep foundation concept of the new cable-stayed bridge over the Sava River in Belgrade near the entry of the Sava River into the River Dan-ube has been presented. The foundation at 8 piers for the new bridge over the Sava River in Belgrade was successfully accomplished based on an innovative design procedure according to EC 7. The Sava Bridge was the first project of that dimension which was executed in accordance with EC 7 using the na-tional application rules of Austria for pile founda-tions of a major bridge. In conclusion the foundations were economically designed in such a way that they exhibit sufficient overall safety against failure and al-so satisfactory behaviour in the serviceability limit-state, thus, considering the life time of the bridge.
All the bridge foundations showed satisfactory set-tlement behaviour already during construction and after completion. The bridge is the new landmark of Belgrade; nevertheless the deep foundations are in-visible but will provide a safe basis for the lifetime of the new Sava Bridge.
When comparing the different foundation con-cepts, in conclusion, no ranking can be made with re-spect to the issue of which is the best concept. Each may be justified depending upon the ground condi-tions, structural and serviceability requirements of the buildings, and economic factors (time and cost). Since every single building is a prototype taking into account the ground conditions and the function with respect to bearing behaviour and deformation behav-iour (serviceability) the most appropriate foundation concept has to be assessed in a profound geotechnical design procedure based on a comprehensive ground exploration and soil investigation programme, which needs continuous verification not only in the design phase but also during execution (monitoring etc.).
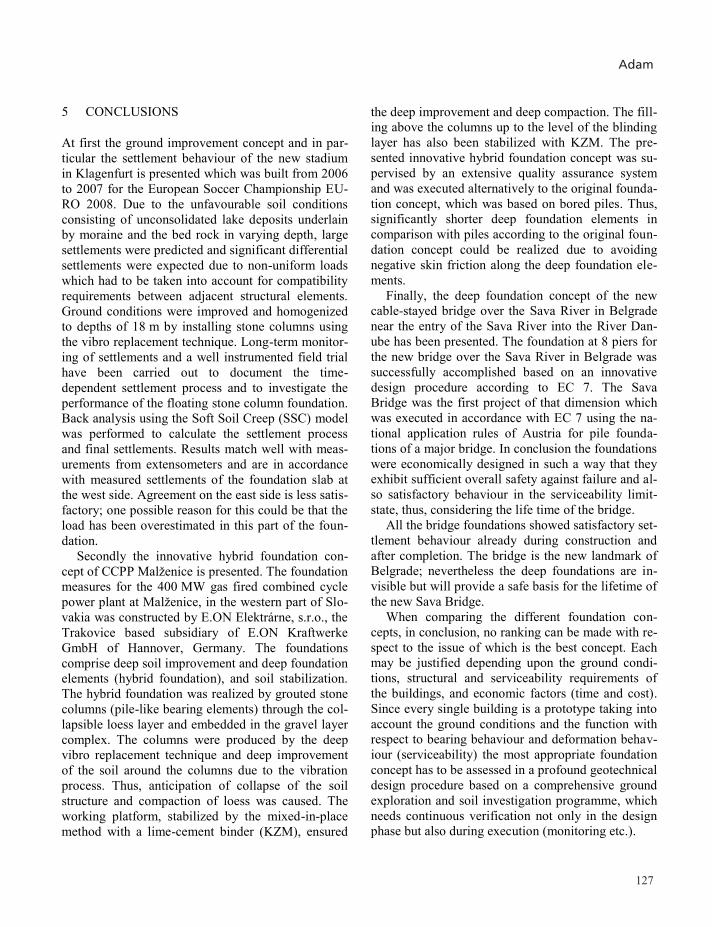
Geotechnical Engineering for Infrastructure and Development
128
REFERENCES
Adam D. & Geotechnik Adam ZT GmbH. 2008a. Geotechnical Report for the Construction of a 400 MW Combined Cycle Power Plant (CCPP) in SK 91929 Malzenice, Slovakia (in German): A-2345 Brunn am Gebirge, Wiener Straße 66-72/15/4; (unpublished). Adam D. & Geotechnik Adam ZT GmbH. 2008b. Quality control plan for the foundation works (in German). A-2345 Brunn am Gebirge, Wiener Straße 66-72/15/4; (unpublished). Adam, D. & Geotechnik Adam ZT GmbH. 2008c. Wörthersee-Stadion Klagenfurt, Gründungsarbeiten, Geotechnischer Schlussbericht. A-2345 Brunn am Gebirge, Austria. Adam, D. & Markiewicz, R. 2011. A new spectacular bridge over the Sava River in Belgrade – foundation design and construction. In: Proc. of 10th International Geotechnical Conference, 176-195, Slovak University of Technology Bratislava, Faculty of Civil En-gineering, Department of Geotechnics, 30 – 31 May 2011, Brati-slava, Slovakia. Adam, D., Schweiger, H.F., Markiewicz, R. & Knabe, T. 2010. EURO 2008 Stadium Klagenfurt – Prediction, Monitoring and Back Calculation of Settlement Behaviour. In: Proc. of the XIVth Danube-European Conference on Geotechnical Engineering: From Research to Design in European Practice, 217-230, Slovak University of Technology in Bratislava, 2 – 4 June 2010, Bratisla-va, Slovakia. Adam, D., Turcek, P. & Paulmichl, I. 2009. Innovative hybrid ground improvement and deep foundation concept for the CCPP Malženice (Slovakia). In: Proc. of 9th International Geotechnical Conference, 59-68, Slovak University of Technology Bratislava, Faculty of Civil Engineering, Department of Geotechnics, 1 – 2 June 2009, Bratislava, Slovakia. Bauer Spezialtiefbau GmbH 2009. Belgrad Sava Bridge, Pfahlprobebelastung, Bericht Nr. 04/02/09. February 2, 2009, unpubl. Bautechnische Versuchs- und Forschungsanstalt Salzburg. 2006. Prüfbericht, Baugrunderkundung, Probefeld Stadion Klagenfurt. A-5020 Salzburg, Austria. Bjerrum, L. 1967. Engineering geology of Norwegian normally-consolidated marine clays as related to settlements of buildings. Seventh Rankine Lecture. Géotechnique 17, 81-118. Brandl, H. 2003. Box-shaped foundations of bored and auger piles (or diaphragm walls). Proceedings of the 4th International Ge-otechnical Seminar on Deep Foundations on Bored and Auger Piles, 349-358, Millpress, Rotterdam. Brandl, H. 2005. Settlement-Minimizing pile and diaphragm wall foundations for high rise buildings and bridges. Geotechnics in ur-ban areas. Bratislava, June 27-28, 2005. Brinkgreve, R.B.J., Broere, W. & Waterman, D. 2006. Plaxis, Fi-nite element code for soil and rock analyses, user’s manual. The Netherlands. DIN 1054. 2005. Subsoil – Verification of the safety of earthworks and foundations. Fross, M., Adam, D. & Hofmann, R. 2010. Pile Foundations for River Bridges according to EC 7-1. Proc. of the XIVth Danube-European Conference on Geotechnical Engineering, From Re-search to Design in European Practice, 144-166, Slovak Universi-ty of Technology in Bratislava, 2 – 4 June 2010, Bratislava, Slo-vakia.
Gäb, M., Schweiger, H.F., Thurner, R. & Adam, D. 2007. Field trial to investigate the performance of a floating stone column foundation (in coop. with). In: Proc. of XIV European Conference on Soil Mechanics and Geotechnical Engineering (XIV ECSMGE), 1311-1316, Madrid, Spain. Millpress, Rotterdam. Gäb, M., Schweiger, H.F., Kamrat-Pietraszwska, D. & Karstunen, M. 2008. Numerical analysis of a floating stone column foundation using different constitutive models. In Karstunen and Leoni, Ge-otechnics of Soft Soils, volume 1, 137-142. Tylor & Francis Group, London. Geotechnik Adam ZT GmbH 2009a. Geotechnical Interpretive Report for the Bridge over the River Sava – Trial Piles. February 26, 2009, (unpublished). Geotechnik Adam ZT GmbH 2009b. Geotechnical Interpretive Report for the Bridge over the River Sava – Piers 1 to 7. Revision B. April 30, 2009, (unpublished). Geotechnik Adam ZT GmbH 2009c. Settlement Report for the Bridge over the River Sava – Piers 1 to 8. July 29, 2009, (unpublished). Hinterplattner, B., Markiewicz, R. & Adam, D. 2011. Sava Bridge Belgrad – Eine innovative Pylonfundierung für eine spektakuläre Schrägseilbrücke. 8. Österreichische Geotechniktagung 03.-04.02.2011, Wien. http://www.eon-elektrarne.com/pages/ekw_en/index.htm Ingenieurgemeinschaft Garber & Dalmatiner Zivilingenieure 2005a. Bodenmechanisches Gutachten zum Projekt Wörthersee-Stadion Klagenfurt, Neubau. A-8010 Graz bzw. A-9500 Villach, Austria. Ingenieurgemeinschaft Garber & Dalmatiner Zivilingenieure 2005b. Ergänzung zum bodenmechanischen Gutachten zum Projekt Sportpark Wörthersee, Stadion EURO 2008, Klagenfurt. A-8010 Graz bzw. A-9500 Villach, Austria. Janbu, N. 1967. The resistant concept applied to soils, Géotech-nique 17: 81-118. ÖNORM B 1997-1-1. 2007. Geotechnical design, General rules – National specifications concerning ÖNORM EN 1997-1 and na-tional supplements. ÖNORM B 1997-1-3. 2007. draft version: Berechnung und Bemessung in der Geotechnik – Pfahlgründungen, Ermittlung der Tragfähigkeit (in German). ÖNORM B 4440. 2001. Erd- und Grundbau, Großbohrpfähle, Tragfähigkeit (in German). ÖNORM B 4431-2. 1986. Geotechnical engineering; permissible soil pressures; settlement observations. ÖNORM EN 1997-1 (EC 7) 2006. Geotechnical design, General rules. Steinkühler, M. et al. 2010. Ein neues Wahrzeichenzeichen für Belgrad: Schrägseilbrücke mit 200 m Pylon über die Sava in Belgrad, Serbien. Betontag 22.-23.04.2010, ÖVBB, Wien. Vermeer P. & Neher, H. 2000. A soft soil model which accounts for creep. Beyond 2000 in Computational Geomechanics - 10 years of PLAXIS International, 249-262, Balkema, Rotterdam.
129
Proceedings of the XVI ECSMGEGeotechnical Engineering for Infrastructure and DevelopmentISBN 978-0-7277-6067-8
© The authors and ICE Publishing: All rights reserved, 2015doi:10.1680/ecsmge.60678
Developments in the use of geophysics in geotechnical engineering in soft ground
Développements dans l'utilisation de la géophysique en géotechnique dans un sol mou
M. Long*1 1 University College Dublin (UCD), Dublin, Ireland
* Corresponding Author
ABSTRACT This paper highlights recent developments in application of geophysics to soft ground geotechnical engineering. In particular emphasis is given to improving the confidence in the use of geophysics by showing how very useful information can be obtained on ground structure and in estimating of geotechnical parameters directly from geophysics. For example GPR can accurately profile peat thickness and inform on internal peat structure, thus providing valuable information for landslide studies. Similarly resistivity is very useful in quick clay landslide studies due to the strong correlation with salt content. Surface wave techniques, such as MASW, can provide economic and accurate profiles shear wave velocity provided care is taken with data interpretation. Very good correlations were obtained between Vs and various 1D compression parameters and undrained shear strength. RÉSUMÉ Ce document met en lumière les récents développements dans l'application de la géophysique au sol mou géotechnique. Dans un accent particulier a été donné à l'amélioration de la confiance dans l'utilisation de la géophysique en montrant comment des informations très utiles peuvent être obtenues sur la structure du sol et dans l'estimation des paramètres géotechniques directement à partir de la géophy-sique. Par exemple GPR peut profiler avec précision l'épaisseur de tourbe et d'informer sur la structure interne de la tourbe, fournissant ain-si des informations précieuses pour les études de glissements de terrain. De même résistivité est très utile dans les études rapides argile de glissements de terrain en raison de la forte corrélation avec la teneur en sel. Techniques d'ondes de surface, tels que MASW, peuvent four-nir des profils économiques et précises ondes de cisaillement vitesse fournie soin est apporté à l'interprétation des données. Très bonnes corrélations ont été obtenues entre Vs et divers paramètres de compression 1D et la résistance au cisaillement non drainée.
1 INTRODUCTION
This paper provides a review of recent developments in the use of in situ geophysical techniques in ge-otechnical engineering in soft ground. It is well es-tablished that geophysical techniques are very useful for delineation of significant geological features such as, the location of bedrock or the ground water table, the presence or otherwise of large voids or under-ground anomalies and the identification of contami-nated ground. Geophysical techniques have also been used for many years to give more details of the ground conditions such as the “rippability” of rock and the ground stiffness. However there have been significant recent developments where geophysics has been used to identify more minor but important
details of the soil structure and the different layers present and to give very good first order estimates of properties such as stiffness, one dimensional consoli-dation properties and shear strength.
A second motivation of this paper is to encourage use of geophysics to improve the quality of ground investigation practice. In the author’s experience there has been little development or improvement in the standard of ground investigation for medium scale “regular” projects. In fact many would claim that standards have decreased especially during the recent economic downturn. An objective of this pa-per is to demonstrate that geophysics provides a cost effective and reliable approach to supplement the more standard techniques. The paper focuses in par-ticular on ground penetrating radar (GPR), resistivity