Embed Size (px)
Citation preview

OCEAN RIG UDW INC.
Ocean Rig UDW Inc. 4th Quarter Ended December 31, 2012 Earnings Presentation
NASDAQ: “ORIG” March 7, 2013

OCEAN RIG UDW INC.
Forward Looking Statements
1
Matters discussed in this presentation may constitute forward-looking statements. Forward-looking statements reflect the Company’s current views with respect to future events and financial performance and may include statements concerning plans, objectives, goals, strategies, future events or performance, and underlying assumptions and other statements, which are not statements of historical facts.
The forward-looking statements in this presentation are based upon various assumptions, many of which are based, in turn, upon further assumptions, including without limitation, management's examination of historical operating trends, data contained in our records and other data available from third parties, which have not been independently verified by the Company. Although Ocean Rig UDW Inc. believes that these assumptions were reasonable when made, because these assumptions are inherently subject to significant uncertainties and contingencies which are difficult or impossible to predict and are beyond our control, Ocean Rig UDW Inc. cannot assure you that it will achieve or accomplish these expectations, beliefs or projections. Important factors that, in the Company’s view, could cause actual results to differ materially from those discussed in the forward-looking statements include the strength of world economies and currencies, general market conditions, including changes in charter hire rates and vessel values, changes in demand that may affect attitudes of time charterers to scheduled and unscheduled drydocking, changes in Ocean Rig UDW Inc’s operating expenses, including bunker prices, dry-docking and insurance costs, or actions taken by regulatory authorities, potential liability from pending or future litigation, domestic and international political conditions, potential disruption of shipping routes due to accidents and political events or acts by terrorists.
Risks and uncertainties that may affect our actual results are further described in reports filed by Ocean Rig UDW Inc. with the US Securities and Exchange Commission.
Information contained in this presentation (not limited to forward looking statements) speaks only as of the date of such information and the Company expressly disclaims any obligation to update or revise the information herein, except as required by law.

OCEAN RIG UDW INC.
2012 financial results
2
Reported Net Loss: ($71.0) million or ($0.54) per share
Plus 10-year class special survey (Eirik Raude) costs: $43.9 million or $0.33 per share
Adjusted Net Loss: ($27.1) million or ($0.21) per share
Results for Q4 2012
Reported Net Loss: ($132.3 ) million or ($1.00) per share
Plus 10-year class special survey (Eirik Raude) costs: $65.5 million or $0.50 per share
Adjusted Net Loss: ($66.8) million or ($0.50) per share
Results for FY 2012
OCEAN RIG UDW INC.
2012 key highlights
3
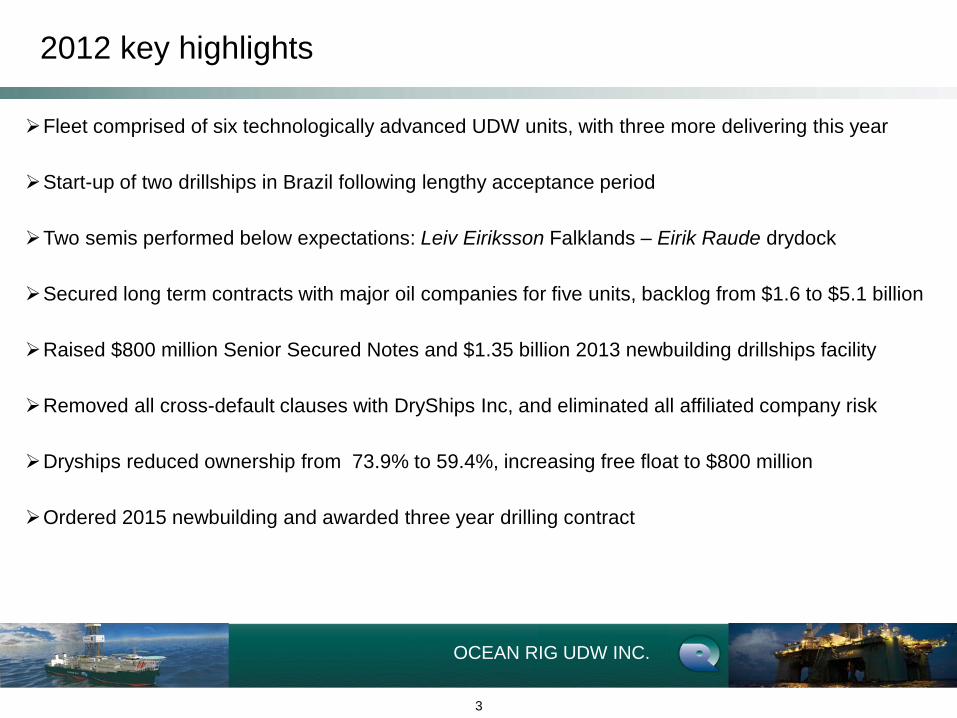
Fleet comprised of six technologically advanced UDW units, with three more delivering this year
Start-up of two drillships in Brazil following lengthy acceptance period
Two semis performed below expectations: Leiv Eiriksson Falklands – Eirik Raude drydock
Secured long term contracts with major oil companies for five units, backlog from $1.6 to $5.1 billion
Raised $800 million Senior Secured Notes and $1.35 billion 2013 newbuilding drillships facility
Removed all cross-default clauses with DryShips Inc, and eliminated all affiliated company risk
Dryships reduced ownership from 73.9% to 59.4%, increasing free float to $800 million
Ordered 2015 newbuilding and awarded three year drilling contract

OCEAN RIG UDW INC.
ER & LE 2013 developments
4
Developments on Eirik Raude:
Commenced contract with ExxonMobil for drilling offshore Ireland
Entered into a twelve-month four well contract with Lukoil for drilling offshore West Africa
European Hydrocarbons cancelled its contract; early termination payment appx. $13 million
Developments on Leiv Eiriksson:
Currently on drydock in Norway for contract related upgrades
Expected to commence drilling operation in early Q2 2013

OCEAN RIG UDW INC.
2012 operational performance
5
Notes 1) Operational performance calculated based on drilling days over days net of mobilization, acceptance testing and drydock
Strong operational performance despite unexpected hurdles
Short-term contracts with frequent relocations affected 2012 operational performance
Post-Macondo environment with frequent maintenance/BOP testing days affects operational performance
Ocean Rig Drilling Days Utilization for FY 2012
78.3%
96.2% 97.0% 94.1%
91.4%
84.2% 83.4% 83.8%
88.9%
21.7%
3.8% 3.0% 5.9%
8.6%
15.8% 16.6% 16.2%
11.1%
0%
10%
20%
30%
40%
50%
60%
70%
80%
90%
100%
Corcovado Olympia Poseidon Mykonos AverageDrillships
LeivEiriksson
Eirik Raude AverageSemis
AverageORIG Fleet
Uptime %
Downtime %

OCEAN RIG UDW INC.
2012 marketing efforts
6
$400,000
$450,000
$500,000
$550,000
$600,000
$650,000
$700,000
Dec-11 Jan-12 Mar-12 Apr-12 Jun-12 Aug-12 Sep-12 Nov-12 Jan-13 Feb-13 Apr-13
Dayra
tes
Ocean Rig
Olympia
Ocean Rig
Mylos
Ocean Rig Poseidon
Ocean Rig Athena
Eirik Raude
Leiv Eiriksson
ORIG
Three year contracts with major oil companies secured at market-leading rates
Leiv Eiriksson contract net of upgrades paid by Rig Management
New contracts incorporate provisions for increased revenue/operating efficiency
on-hire maintenance days and specific on-hire BOP maintenance
Source:
Note: Announced Contracts >12 months duration
Contracted Dayrates in UDW drilling segment
Peers

OCEAN RIG UDW INC.
2013 corporate reorganization
7
* Expected drilling location of newbuilding UDW drillship **Based on LOA: Expected drilling location in 2015 of newbuilding UDW drillship
Eirik Raude
Leiv Eiriksson
Stavanger
HQ Athens
OCR Olympia
OCR Poseidon
OCR Athena*
Angola
Brazil OCR Corcovado
OCR Mykonos
OCR Mylos*
: Drilling Location
: Regional Office
Corporate focus to increase efficiency & reduce expenses within challenging industry conditions
Relocation of regional offices near drilling locations
: Day-to-day Management HQ
: Principal Executive Office
Executive Office
Cyprus
OCR Apollo**
OCEAN RIG UDW INC.
Industry Overview

OCEAN RIG UDW INC.
Exploration success fuels deepwater E&P spending
9
E&P capex for UDW expected to accelerate
20.2 26.8
31.2 34.8 36.8 40.5 41.6 41.8 46.3 50.0 50.6
4.2
5.3
7.0 7.5
8.6 8.2
12.9
22.7
28.0 28.9
36.1
0
10
20
30
40
50
60
70
80
90
100
2005 2006 2007 2008 2009 2010 2011 2012 2013 2014 2015
US$ Bn
Deepwater Ultra Deepwater
Note: Deepwater defined as water depths of over 400 meters and less than 1,500 meters. Ultra-deepwater defined as water depths of 1,500 meters or greater Source: Wood Mackenzie, reserves discovered data based on oil industry research reports and company data.
Proven UDW reserves require substantial UDW drilling fleet
At the present time global open demand by type of well: 8% development, 92% exploration
Expected continuing exploratory drilling as a result of E&P capex growth and continuing development
drilling from existing proven reserves.

OCEAN RIG UDW INC.
Market fundamentals remain strong
10
Even though Petrobras has not chartered any UDW units
from the international market since early 2011, 2012 was
a landmark year
West Africa expected to be most important growth area
for UDW exploration
Ocean Rig UDW has unrivalled experience drilling
in the region
Four of our UDW units will be drilling in West
Africa in 2013
Young and high quality UDW units command premium
rates
Ocean Rig’s recent long-term contracts secured at
$600,000+ dayrates
UDW backlog signed by year UDW Dayrates

OCEAN RIG UDW INC.
Technological advances have reduced the cost of deepwater well
development
Oil Majors rank deepwater well IRR on par or above IRR of onshore projects
and prefer deepwater long lifetime projects
Oil Project Break-Even Economics ($/bbl)
OPEC
Mideast
Other
Conventional Deepwater
Ultra
Deepwater
Enhanced
Recovery
Extra
Heavy Oil Arctic
12 - 25 15 - 30 26 - 60 30 - 70 40 - 75 60 - 80 80 - 100
UDW oil project breakeven below OPEC fiscal breakeven
11
UDW oil project breakeven economics range
between $30 - $70 /bbl
Since early 2000s, OPEC producers have
made large investments in infrastructure and
non-oil sectors, driving up their fiscal
breakeven to as high as $100/bbl
Deepwater projects have the same or lower
development costs per barrel of oil equivalent
than certain onshore project
Source: International Monetary Fund, National Authorities, Total, DNB Markets, Wall Street Research
2011 Fiscal Balance Break-Even Price for major OPEC Producers ($/bbl)
Iraq Bahrain Algeria Iran UAE Saudi Arabia Oman Kuwait Qatar
102 100 95 87 82 80 77 50 39
Offshore projects are competitive with onshore projects
High fiscal breakeven for major producers supports current oil price levels
Onshore (top fields) 80+%
Deepsea 20%-25%
Conventional &
Onshore15%-20%
Sample IRR Estimates

OCEAN RIG UDW INC.
92.5%
1.1%
6.5%
>20yrs 10-20yrs 5-10 yrs <5yrs
5.8%
14.9%
4.1%
75.2%
>20yrs 10-20yrs 5-10 yrs <5yrs
12
Age Profile of MW fleet Age Profile of DW fleet Age Profile of UDW fleet
79.7%
12.2%
2.7% 5.4%
>20yrs 10-20yrs 5-10 yrs <5yrs
Aged midwater & deepwater fleets
Vast majority of midwater and deepwater floaters are over 20 years old and becoming obsolete
Stringent post-Macondo technical requirements create market cascading effect with many UDW units
already drilling deepwater wells at UDW rates
Source:
Significant shortage of midwater and deepwater high specification assets
This substantial increase in demand is stretching am aging and underinvested fleet

OCEAN RIG UDW INC.
0
5
10
15
20
25
30
2010 2011 2012 2013 2014 2015
19
29
15
23 21
13
3
18
11
6
18
7
Nu
mb
er
of
UD
W u
nit
s
NB deliveries NB Available* for employment
13
Supply constraints
Yard availability non-existent until 2015, over 2 ½ years from order to delivery
Drillships have become industry’s preferred UDW asset type
UDW Newbuilding Deliveries & Availability
Notes * Available for employment includes all rigs (existing and newbuilds) that are available for employment within that calendar year. Historical data as of start of each calendar year, data for 2013-2014 as of December 2012.
0
5
10
15
20
25
30
35
40
45
2004 2005 2006 2007 2008 2009 2010 2011 2012 2013
2
10
16 16
2 6
35 32
11
20 13
10
1
7 10
2
Semis Drillships
UDW Units Ordered Each Year
Nu
mb
er
of
UD
W u
nit
s
13
30 29
26
3 6
42 42
2

OCEAN RIG UDW INC.
Financial Highlights

OCEAN RIG UDW INC.
Average contract1 remaining fixed period of 2.8 years, 4.4 years with options
Enviable position with our 7th generation drillship Ocean Rig Skyros, available in 2013
98%, 88%, 64%, 30% calendar days under contract2 in 2013, 2014, 2015, and 2016 respectively
$5.1 billion backlog2 up from $1.6 billion in early 2012
Solid multi-year fleet employment profile
15
1) Average contract length excludes OCR Poseidon remaining period on the Petrobras contract, and Eirik Raude short term contracts 2) Including LOA for the Ocean Rig Apollo or similar vessel
Q1 Q2 Q3 Q4 Q1 Q2 Q3 Q4 Q1 Q2 Q3 Q4 Q1 Q2 Q3 Q4
Contract Coverage
Leiv Eiriksson
Eirik RaudeAfrican
PetroleumMob Mob
Ocean Rig Corcovado
Ocean Rig Olympia
Ocean Rig Poseidon Mob
Ocean Rig Mykonos
Ocean Rig Mylos Mob
Ocean Rig Skyros Mob
Ocean Rig Athena Mob
Ocean Rig Apollo MobExpected Delivery January 2015
Expected Delivery November 2013
Petrobras
Lukoil
LOA with major oil company
options for up to 2
years (through 2018)
3 X 1 year options
(through 2020)
Total
Petrobras
Repsol
2 x 1 year options (through Q3 2017)
2016
98% 88% 64%
Mobilization, Upgrades
Expected Delivery October 2013
Expected Delivery July 2013
2015
Q2Q1 Q3
Rig Management Norway (led by Total)
30%
2017
options for up to 2 years (through
2018)
Year2013 2014
Q4
Exxon Mobil
ConocoPhillips
Eni2 x 1 year options
(mid 2018)
Petrobras
OCEAN RIG UDW INC.
Q4 2012- Revenue analysis
16
Drilling Unit Mobilization
Days
Available
Drilling Days1
(a)
Off-hire Days
(b)
Revenue
Earning Days
(a-b)
Day Rate
(c)
Amortization of
Deferred
Revenues
($ mln)
Leiv Eiriksson 26 66 12 54 $530,000 0.0
Eirik Raude 12 0 0 0 - 0.0
OCR Corcovado1 92 5 87 $442,731 3.7
OCR Olympia 92 7 85 $584,450 0.8
OCR Poseidon 92 0 92 $586,000 6.9
OCR Mykonos1 92 4 88 $437,919 3.9
Total 38 434 28 406 15.3
Notes:
1) Available Drilling Days excluding Eirik Raude drydocking days
Mykonos and Corcovado contract dayrate based on average exchange rate of R$2.05:$1.00 during Q4 2012. Any differences due to rounding
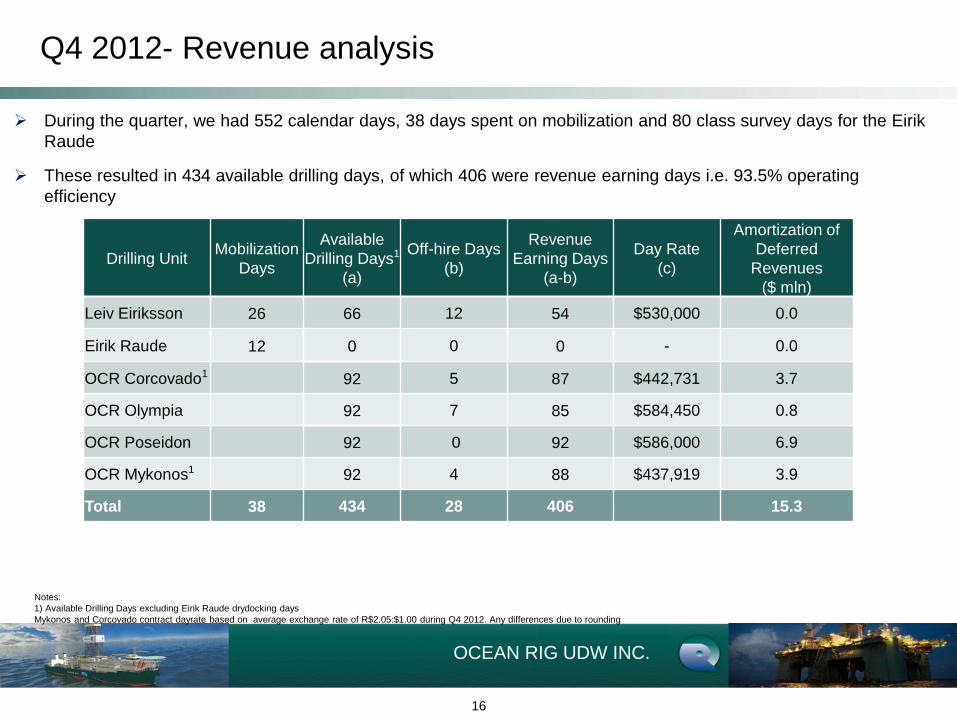
During the quarter, we had 552 calendar days, 38 days spent on mobilization and 80 class survey days for the Eirik
Raude
These resulted in 434 available drilling days, of which 406 were revenue earning days i.e. 93.5% operating
efficiency

OCEAN RIG UDW INC.
Q4 2012- OPEX analysis
17
Notes:
1) Excludes class survey costs, transit fuel costs related to the yard, towing services, chartered helicopters and certain one-off invoices, crew specialists
2) Available Drilling Days including Eirik Raude drydocking days
Drilling Unit
Direct Rig
Opex1 Q4 2012 Direct Rig Opex 1
Q3 2012
( $ per day)
(in USD
million) ($ per day)
Leiv Eiriksson 197,000 16.2 219,000
Eirik Raude 192,000 17.8 222,850
OCR Corcovado 227,000 17.9 194,000
OCR Olympia 199,000 16.3 177,000
OCR Poseidon 194,000 16.7 182,000
OCR Mykonos 216,000 17.4 189,000
Total 102.3
Q3 2012 Q4 2012
Available Drilling Days Direct Rig Opex1
($ per day)
Available Drilling
Days2 Direct Opex1
($ per day)
OCR Fleet 515 197,000 514 199,000
Q4 2012
Amortization of
Deferred Opex
(in USD million)
0.0
0.0
3.5
0.3
3.6
4.9
12.3
Falkland Island contract
completed
Peripheral costs related to class
survey (excl. drydock costs)

OCEAN RIG UDW INC.
Income Statement
18
Q4 2012 FY 2012
REVENUES:
Drilling revenues 214.5 863.8
Amortization of deferred revenue 15.3 78.1
Total Revenues from drilling contracts 229.8 941.9
EXPENSES:
Direct rig operating expenses 102.2 377.8
Eirik Raude 10-year class special survey 43.9 65.5
Onshore and maintenance expenses 14.7 50.2
Amortization of deferred operating expenses 12.3 70.1
Total drilling rig operating expenses 173.1 563.6
Depreciation and amortization 56.5 224.5
General and administrative expenses and other 23.5 83.8
Legal settlements and other - 4.5
Operating income/(loss) -23.3 65.5
OTHER INCOME/(EXPENSES):
Interest and finance costs, net of interest income -29.8 -115.9
Gain/(loss) on interest rate swaps -4.9 -36.9
Other, net -1.6 -1.0
Income taxes -11.4 -44.0
Total other expenses -47.7 -197.8
Earnings/ (loss) per common share, basic and diluted -$0.54 -$1.00
Weighted average number of shares, basic and diluted 131,696,955 131,696,935
Net income/ (loss) -71.0 -132.3
(Expressed in Millions of U.S. Dollars except for share and per share data)

OCEAN RIG UDW INC.
19
Healthy liquidity & capital structure
(in $ million)
December 31,
2012
Cash 317.4
Restricted cash 192.7
Secured bank debt 1,508.7
6.50% senior secured notes due 2017(1) 781.0
9.50% senior unsecured notes due 2016 (1) 491.7
Total debt (1) 2,853.4
Total shareholders’ equity 2,908.5
Total capitalization 5,761.9
Net Debt 2,343.5
Debt to capitalization 50%
Net Debt to Capitalization 41%
(1) (1) Net of financing fees (2) (2) Excludes 2015 delivery newbuilding (3) Assumes $15.0 share price
Ownership on March 1st, 2013
Shares Outstanding 131.7 million
Free float shares 53.4 million
% of free float shares 40.6 %
% ownership DRYS 59.4 %
Equity market capitalization: $ 1,975 mil Current Enterprise Value (2): $ 3,647 mil
Fully Delivered Enterprise Value: $ 5,665 mil (2)

OCEAN RIG UDW INC.
110 110 110 110
67 67 67 67
10
124 124 124
40 40
0
50
100
150
200
250
300
350
400
2013 2014 2015 2016
DB Nordea $1.35bn NBs Facility OCR Apollo Facility (assumption)
187
301
341 341
Our aggressive loan amortization schedule increases stakeholder value
($ in millions)
20
Debt Amortization 1
Conservative debt profile
($ in millions)
Notes 1) Assumes refinancing of $500 million Unsecured Notes and Nordea facility in 2016 with similar identical and facility respectively
($ million) 2013 2014 2015 2016
YB Bank Debt 1,608 2,771 2,470 2,579
Bank Debt Amortization 187 301 341 341
Newbuild Drillships Debt 1,350 450
YE Bank Debt 2,771 2,470 2,579 2,238
HY Notes 1,300 1,300 1,300 1,300
YE Total Debt 1 4,071 3,770 3,879 3,538
YE Total Debt / Rig 452 419 388 354
Ocean Rig Debt Outstanding as of 12/31/12
Facility Amortizing Balloon Total Maturity
$800m facility 233.3 466.7 700.0 Q2 2016
$990m facility 907.5 0.0 907.5 Q4 2020
$800m Senior Secured Note 0.0 800.0 800.0 Q4 2017
$500m Senior Unsecured Note 0.0 500.0 500.0 Q2 2016
Current OCR debt 1,140.8 1,766.7 2,907.5
$1,350m facility 600.0 750.0 1,350.0 Q3 2018

OCEAN RIG UDW INC.
2013 2014 2015 Delivery
OCR Mylos (NB #1) 670 242 428 - - July 2013
OCR Skyros (NB#2) 669 242 427 - - October 2013
OCR Athena (NB#3) 679 242 437 - - November 2013
OCR Apollo (NB#4) 683 153 83 - 447 January 2015
Total $2,701 $879 $1,375 - $447
Remaining Cost(1)Total
Delivered
Cost
Already
Funded From
Equity
(1) Represents construction payments and construction related expenses (excluding financing costs).
Sensible growth
21
(S millions)
DNB/Nordea led $1.35b senior secured term loan facility signed
All equity -over $727 million- for 2013 newbuilds already invested
Modest capital expenditures associated with 2015 newbuilding
0
2
4
6
8
10
12
2010 2011 2012 2013 2014 2015
Drillships
Semi-submersibles
2
9
6 6
9 10
On-the-water drilling units
OCEAN RIG UDW INC.
Closing Remarks

OCEAN RIG UDW INC.
Closing remarks
23
Pure-play ultra-deepwater
driller with premium
assets
Fleet composed of 100% UDW assets
Sixth largest UDW company globally with a fleet of 10 drillships/rigs
Latest generation assets with an average age of 2.9 years
Favorable market
fundamentals
UDW is the key growth market in the drilling space
Deepwater production has doubled in the last five years
Rising oil prices improve economics for UDW operators
Depleting reserves make UDW exploration & production critical
Healthy debt profile
Removed all cross-default clauses with DryShips Inc.
Secured Syndicated Term Loan for the three 2013 newbuildings
Rapid deleveraging across bank facilities increases stakeholder value
No debt maturities until Q2 2016
Strong cashflow visibility
and significant earnings
potential
Seven units employed to investment grade counter-parties
Revenue backlog of $5.1 billion
Uniquely positioned with the Ocean Rig Skyros, 7th generation drillship, available for
employment in 2013
Experienced management
team
Highly efficient drilling operator in harsh conditions
Corporate culture focused on safety and incident-free operations
Drilled more than 135 wells for 25 clients over the last 10+ years
1,380 employees of which 200 in corporate functions

OCEAN RIG UDW INC.
Appendix

OCEAN RIG UDW INC.
Strong contract backlog provides cash flow visibility
Unit Year built Redelivery Operating area Backlog ($m)
Leiv Eiriksson 2001 Q1 – 16 Norway $627
Eirik Raude 2002 Q3 – 13 Ireland $112
Eirik Raude 2002 Q4 – 14 Sierra Leone, Ghana, Ivory Coast $217
Ocean Rig Corcovado 2011 Q2 – 15 Brazil $357
Ocean Rig Olympia 2011 Q3 – 15 Ivory Coast, Gabon, Angola $517
Ocean Rig Poseidon 2011 Q1 – 13 Africa $22
Ocean Rig Poseidon 2011 Q2 – 16 Angola $781
Ocean Rig Mykonos 2011 Q1 – 15 Brazil $330
Ocean Rig Mylos 2013 Q3 – 16 Brazil $680
Ocean Rig Athena 2013 Q1 – 17 Angola $750
Total $4.4 billion
Note: Backlog as of 3/4/2013
25
LOA Ocean Rig Apollo 2015 Q1 – 18 West Africa $680
Total with LOA $5.1 billion

OCEAN RIG UDW INC.
Fleet status report
26
Notes
Fleet Status Report located on the Ocean Rig website (www.ocean-rig.com) in the Investor Relations section.
Date: March 7, 2013
Year Built / Estimated Estimated
Expected Commencement Completion 2013 Footnote
UDW Unit Name Delivery Location Customer Date Date Q1 Q2 Q3 Q4 Q1 References Q1 Q2 Q3 Q4
Liberia European Hydrocarbons Jan-13 Mar-13 22 1,2
Ireland ExxonMobil Mar-13 Q3 2013 25 3
West Africa Lukoil Q3 2013 Q2 2014 22 10 4,5
Shipyard
Rig Management
Ocean Rig Corcovado 2011 Brazil Petrobras May-12 Q2 2015 31 1 7 89 91 61 92 333
Tanzania Petrobras Jul-11 Q2 2013
Angola ENI Q2 2013 Q2 2016 48 9
Ocean Rig Mykonos 2011 Brazil Petrobras Mar-12 Q1 2015 31 10 90 91 61 92 334
Under construction NA NA Jul-13
Brazil Repsol Sinopec Jul-13 Q3 2016 60 11
Ocean Rig Skyros 2013 Under construction NA NA Oct-13 60 12 0 0
Under construction NA NA Nov-13
Angola ConocoPhillips Nov-13 Q1 2017 31 13
Ocean Rig Apollo 2015 On order LOA- Major Oil Company Jan-15 Q1 2018 0 0
Total Days 120 67 146 101 29 391 479 466 634 1970
Footnotes
1 Received contract termination notice on March 3, 2013
2 Total of 22 days off-hire of which 21 days downtime related to faulty BOP bonnets (replaced by the manufacturer at no cost to the Company)
3 Estimated 25 days mobilization to Ireland
4 Estimated 22 days for mobilization from Ireland to Sierra Leone
5 Estimated 10 days intra-contract transits to new drilling locations (Sierra Leone to Ghana to Ivory Coast)
6 Estimated 90 days in Q1 and 15 days in Q2 for mobilization & upgrades
7 Estimated 31 days yard stay in Brazil for Petrobras contract related upgrades
8 Estimated 5 days in Q1, 4 days in Q2 and 2 days in Q3 for intra-contract transits to new drilling locations (Angola to Ivory Coast to Gabon to Angola)
9 Estimated 48 days for mobilization and acceptance testing prior to commencement of new contract
10 Estimated 31 days for yard stay in Brazil for Petrobras contract related upgrades
11 Estimated 60 days for mobilization from Korea to drilling location and acceptance testing
12 Estimated 60 days for mobilization from Korea to drilling location and acceptance testing
13 Estimated 60 days for mobilization from Korea to drilling location and acceptance testing of which 31 in Q4 2013
Definitions
Mobilization Days: Includes estimated days related to drilling unit mobilization/demobilization, acceptance testing, time between contracts and estimated days for contract related rig upgrades prior to contract commencement.
Available Drilling Days: Calendar Days less estimated Mobilization days less estimated Off-Hire days; Available days do not include any utilization assumptions
348
317
92
0
90 15
FY 2013
Estimated Available Drilling Days
286
260
Known
Off-Hire Days
2013
2002Eirik Raude
Norway
Angola, Ivory Coast, Gabon Total Jul-12
Q2 2016
Off-Hire Days: Estimated unpaid operational days. Off-hire days estimate includes planned days for class survey dry-docks , planned days related to maintenance/repair work, days waiting to secure employment etc. During Off-
Hire days operating expenses are expensed in the period incurred.
Leiv Eiriksson 2001
2011Ocean Rig Olympia
Ocean Rig Poseidon 2011
2013
Jul-15
6
Ocean Rig Mylos
Ocean Rig Athena
2013
70 82
92 Q2 2013
2013
Estimated Mobilization Days
92
43 91
0 76
79 87 90 92
90 43 92 92
0 92
0
65 4 2 8

OCEAN RIG UDW INC.
Net drilling revenue indicative calculator
27
*Our projections for mobilization days and earnings efficiency will differ from actual mobilization days and actual earnings efficiency respectively.
1. Eirik Raude blended drilling day rate, reflects rates under different contracts
2. OCR Poseidon drilling day rate, reflects rates under different contracts
3. Mykonos and Corcovado contract dayrate based on average exchange rate of R$1.97:$1.00. Any differences due to rounding
2013 Available Drilling Days exclude known off-hire days
Data as of March 6th, 2013
To 2013 Net Drilling Revenue add approximately $103.8 million in amortization of deferred revenues
Available
Drilling Days (a)
2013 Drilling Day Rate
Earnings
Efficiency
Guidance
Gross Revenue (a) x (b) x (c ) = (d)
Local Agent
Fees &
Commisions
Net Drilling
Revenue (d)
* (100%-e)
Q1 2013 Q2 2013 Q3 2013 Q4 2013 FY 2013 FY 2013 (b) (c) FY 2013 (e ) FY 2013
Leiv Eiriksson 90 15 105 260 $545,000 92.50% ? 3.00% ?
Eirik Raude (1) 25 22 10 57 308 $590,000 blended rate 92.50% ? 3.00% ?
OCR Corcovado (3) 31 31 334 $446,000 92.50% ? 3.00% ?
OCR Olympia 5 4 2 11 354 $584,450 92.50% ? 3.00% ?
OCR Poseidon (2) 48 48 317 $632,000 blended rate 92.50% ? 3.00% ?
OCR Mykonos (3) 31 31 334 $441,000 92.50% ? 3.00% ?
OCR Mylos 60 60 92 $608,000 92.50% ? 3.00% ?
OCR Skyros 60 60 0 Market rate 92.50% ? 3.00% ?
OCR Athena 31 31 0 $633,500 92.50% ? 3.00% ?
Total 120 67 146 101 434 1,999 ? ?
Drilling UnitMobilization Days

OCEAN RIG UDW INC.
Deferred revenue & expense amortization
28
Estimated Deferred Revenue and Expenses Schedule
As of December 31, 2012
(USD million) Q4 2012 Q1 2013 Q2 2013 Q3 2013 Q4 2013 FY 2013
Amortization of deferred revenues1 15.3 32.7 13.7 11.6 11.6 69.6
Amortization of deferred expenses2 12.4 16.3 10.7 9.7 9.7 46.4
Definitions
Deferred Revenues include lump sum fees received related to mobilization, capital expenditures reimbursable for contract related
rig upgrades etc. These revenues are capitalized and amortized through the duration of the contract.
Deferred Expenses include costs (recurring operating expenses, tug boats & helicopter rentals etc.) incurred during mobilization,
capital expenditures for contract related rig upgrades etc. These costs are capitalized and amortized through the duration of the
contract.
1) based on current amortization schedule of deferred revenues received during prior quarters . Actual amortization of deferred
revenues will vary from current projections and will include future deferrals; such variations may be significant.
2) based on current amortization schedule of deferred expenses incurred during prior quarters. Actual amortization of deferred
expenses will vary from current projections and will include future deferrals; such variations may be significant.

OCEAN RIG UDW INC.
Deferred revenue & expense amortization adjustments
29
1. Mobilization revenue based on current estimates; actual revenue will differ from projections. Our projections for mobilization days will differ from actual days
2. Mobilization expenses based on estimated mobilization days indicatively multiplied by $200,000/day estimated operating expenses
Differences due to rounding, Data as of March 1, 2013 ,
Q1 2013 Q2 2013 Q3 2013 Q4 2013 FY 2013
Current Schedule 32.7 13.7 11.6 11.6 69.6
Plus: Eirik Raude Mobilization Projected additions for mobilization from Liberia to Ireland 17.3 5.8 23.0
Plus: Eirik Raude Mobilization Projected additions for mobilization from Ireland to West Africa 0.2 0.4 0.6
Plus: Leiv Eiriksson MobilizationProjected remaining additions for mobilization from Falklands to
Norway and certain upgrades0.8 0.9 0.9 2.6
Plus: OCR Poseidon MobilizationProjected additions for mobilization and acceptance testing from
Tanzania to Angola0.5 2.1 2.1 4.7
Plus: OCR Mylos MobilizationProjected additions for mobilization and acceptance testing from
Korea to Brazil3.4 3.4
Schedule Adjusted for Future Mobilizations 32.7 32.2 20.5 18.3 103.8
Q1 2013 Q2 2013 Q3 2013 Q4 2013 FY 2013
Current Schedule 16.3 10.7 9.7 9.7 46.4
Plus: Eirik Raude Mobilization Projected additions for mobilization from Liberia to Ireland 3.8 1.3 5.0
Plus: Eirik Raude Mobilization Projected additions for mobilization to West Africa 0.6 1.1 1.7
Plus: Leiv Eiriksson MobilizationProjected remaining additions for mobilization from Falklands to
Norway and certain upgrades1.4 1.6 1.6 4.7
Plus: OCR Poseidon MobilizationProjected additions for mobilization and acceptance testing from
Tanzania to Angola0.1 0.5 0.5 1.1
Plus: OCR Mylos MobilizationProjected additions for mobilization and acceptance testing from
Korea to Brazil1.0 1.0
Schedule Adjusted for Future Mobilizations 16.3 15.9 13.6 13.9 59.8
Amortization of Deferred Revenue
Drilling Unit
Amortization of Deferred Opex
Drilling Unit

OCEAN RIG UDW INC.
Balance Sheet
30