Embed Size (px)
Citation preview
The 4th Large-Scale Survey of Actual Conditions of Gender Equality in Scientific
and Technological Professions
Survey Report
Concise Summary
August 2017
Japan Inter-Society Liaison Association Committee for Promoting Equal Participation of Men and Women in Science
and Engineering (EPMEWSE)
© 2017 Japan Inter-Society Liaison Association Committee for Promoting Equal Participation of Men and Women in Science and Engineering (EPMEWSE)
Concise Summary of “The 4th Large-Scale Survey of Actual Conditions of Gender Equality in Scientific and Technological Professions (Survey Report)”
August 2017
Japan Inter-Society Liaison Association Committee for Promoting Equal Participation of Men and Women in Science and Engineering(EPMEWSE)
JAPAN
This report summarizes the results of “The 4th Large-Scale Survey of Actual Conditions of Gender Equality in Scientific and Technological Professions” which was carried out by EPMEWSE. It may not be reproduced, reprinted, or excerpted without the prior written permission of EPMEWSE.

i
Contents Table of figures ········································································· vii
Preface ·············································································· 1
Survey Results ··········································································· 2
Chapter 1 Summary of Results ····················································· 3 1.1 Basic Data ·············································································· 3
Age Group and Gender (Questions 1, 2; Figures 1.1-2) ····································· 3 Highest Academic Degree (Questions 3, 4; Figures 1.3-7) ·································· 3 Affiliated Academic Societies (Question 5; Figure 1.8) ····································· 5 Employment Status (Question 6; Figure 1.9) ·················································· 7 Breakdown of Respondents by Profession (Question 6; Figure 1.10) ····················· 7 Breakdown of Respondents by Profession and Job Category (Question 6, 8; Figure 1.11) ·································································································· 7 Affiliated Institution (Question 6; Figures 1.12-16) ·········································· 8 Job Position (Question 7; Figure 1.17) ······················································· 10 Job Category (Question 8; Figures 1.18-20) ················································· 10 Annual Salary (Question 9; Figures 1.21-22) ··············································· 11
1.2 Working Conditions ·································································· 14 Employment Status (Question 10; Figures 1.23-25) ······································· 14 Limited-term Employment (Questions 11, 12; Figures 1.26-39) ························· 17 Job Change/Relocation/Leaving a Job and Reasons (Questions 13, 14; Figures 1.40-43) ·································································································· 21 Working Hours (Questions 15, 16; Figures 1.44-51) ······································· 25 Career Goals (Question 17; Figures 1.52-54) ··············································· 29 Overseas Research Activities (Question 18; Figures 1.55-56) ···························· 33 Postdoctoral Position and Career Development (Question 19; Figures 1.57-59) ······ 34
1.3 Work and Family ······································································ 36 Marital Status (Questions 20, 21, 22, 23; Figures 1.60-74) ······························· 36 Number of Children (Questions 24, 25.1, 25.2, 32; Figures 1.75-82) ··················· 43 Childcare and Childcare Leave (Questions 25.3, 25.4, 26-31; Figures 1.83-88) ······ 47 Nursing Care (Question 33; Figures 1.89-92) ··············································· 49 Balancing Work and Family (Question 34; Figures 1.93-94) ····························· 50 Environment Required for R&D (Question 35; Figure 1.95) ····························· 54
1.4 Gender Equality ······································································· 54 Percentage of Female Researchers (Question 36; Figures 1.96—98) ··················· 54 Awareness of New Policies (Questions 37, 38; Figures 1.99-102) ······················· 56 Awareness and Significance of Numerical Target (Question 39; Figures 1.103-107) · 58 Promotion of Gender Equality (Question 40; Figures 1.108-111) ······················· 60 Future Requirements for Gender Equality (Question 41; Figure 1.112) ················ 62
Chapter 2 Important Issues: Gender Gap in Job Positions ··················· 64 Job Position Index (Figure 2.1) ································································ 64 Job Position Index by Age for Each Institution (Figure 2.2) ······························ 64 Job Position Index by Age for University/Technical College (Figure 2.3) ············· 65 Job Position Index by Age for Each University/Technical College Academic Field
ii
(Figure 2.4) ······················································································· 66 Years of Employment as a Female Faculty (Lecturer or above) in University/Technical College (Figure 2.5) ············································································· 68 Years Elapsed Since Acquiring Degree and Current Occupation (Figure 2.6) ········· 68
Chapter 3 Important Issues: Child and Nursing Cares ························ 70 Number of Children (Figures 3.1-2) ·························································· 70 Childcare Leave (Figures 3.3-6) ······························································· 72 Childcare Support (Figures 3.7-9) ····························································· 75 Experience Living Separately and Dual Career Support (Figures 3.10-15) ············ 77 Work and Child/Nursing Cares (Figures 3.16-17) ·········································· 82 Requirements for Further Promoting Gender Equality (Figures 3.18-20) ·············· 85
Chapter 4 Important Issues: Limited-term Employment and Limited-term Researcher (Postdocs) ································································ 101
4.1 Basic Data for Limited-term Employment ······································· 101 Working Arrangement by Age (Figure 4.1), Working Arrangement by Affiliated Institution (Figure 4.2), Working Arrangement by Job Position (Figure 4.3) ········· 101 Term of Employment by Occupational Field and Average Term of Employment by Gender, (Figure 4.4), Probability of Extending Limited-term Employment (Figure 4.5) ····································································································· 103 Employment Arrangement and Average Annual Salary (Figure 4.6), Health and Pension Plans for Limited-term Employment (Figures 4.7-8) ··························· 104 Limited-term Employment and Child Raising (Figure 4.9), Childcare Leave for Limited-term Employees (Figures 4.10-11) ················································ 106
4.2 Aging of Limited-term Employment ············································· 108 Elapsed Years after Degree Acquisition and Employment Arrangement (Figure 4.12), Total Years of Limited-term Employment by Age/Gender (Figure 4.13) ·············· 108 Job Position of Limited-term Employee and Desire for No-term Employment (Figure 4.14) ······························································································· 109
4.3 Employment Status of Limited-term Researcher/NPI ·························· 109 Male-Female Ratio of Limited-term Researchers (Figure 4.15) ························· 109 Working Hours of Limited-term Researchers/NPI (Figures 4.16-19) ·················· 110 Annual Salaries of Limited-term Researchers (Figures 4.20-21)························ 113
4.4 Tenure Track ········································································· 114 Ratio of Tenure Track Employment by Age (Figure 4.22), Elapsed Years after Degree Acquisition (Figure 4.23) ······································································ 114 Childcare Leave and Employment Extension for Tenure Track Employees (Figure 4.28) ······························································································· 117 Ratio of Time Spent on Research by Tenure Track Employees during Workplace Hours (Figure 4.29) ············································································· 118
Chapter 5 Important Issues: Program and Policy Awareness ··············· 119 5.1 Familiarity with Recent Laws and Policies ······································ 119 5.2 Support Programs Currently Underway for Female Researchers ············· 122 5.3 Numerical Targets for Hiring Female Researchers ······························ 125 5.4 Perception of Numerical Targets from Respondents with High Awareness ·· 127 5.5 Female Hiring Targets of Affiliated Institutions ································· 130
Chapter 6 Written Comments ···················································· 137 6.1 Respondents’ Characteristics ······················································ 137
iii
6.2 Frequently Made Comments······················································· 139 (i) Work-life Balance ··········································································· 139 (ii) Limited-term Researcher (Postdoc) Position ··········································· 141 (iii) Career Path ················································································· 142 (iv) Numerical Target for Female Researcher Hiring ····································· 143 (v) Supporting Science Course Selection for Middle and High School Students ····· 144 (vi) Necessity of Perception Reform ························································· 144 (vii) Others ······················································································· 146
Survey Wrap-up ······································································· 147 Chapter 1: Summary of Results ······························································ 147 Chapter 2: Important Issues: Gender Gap in Job Positions······························· 148 Chapter 3: Important Issues: Child and Nursing Cares ··································· 148 Chapter 4: Important Issues: Limited-term Employment and Limited-term Researcher (Postdocs) ························································································ 149 Chapter 5: Important Issues: Program and Policy Awareness···························· 150
Appendix 1 Questionnaire ························································ 151 Fourth Large-Scale Survey of Actual Conditions of Gender Equality in Scientific and Technological Professions ··············································· 151
Appendix 2 The Data of Each Scientific Society Attended ·················· 163
iv
English terms A brief supplement for the specific English terms used in this survey.
Page or figure number
English term to appear in the survey
Japanese term to appear in the original survey
Alternative English term or short description
p. 1 etc. limited-term employment 任期付き職 fixed-term employment (or fixed-term contract)
p. 2 etc. no-term employment 任期なし職 permanent employment (or permanent contract)
p. 2 etc. technical colleges 高専 colleges of technology (or National Institute of Technology, Japan)
p. 2 etc. regular employee 一般職 a clerical position with limited possibilities for promotion
p. 4 (Fig. 1.4)
Doctoral Degree (Course) 課程博士 Doctoral Degree (Course-based)
p. 4 (Fig. 1.4)
Doctoral Degree (Non-course) 論文博士 Doctoral Degree (Thesis-based)
p. 4 (Fig. 1.4)
Doctoral Degree (Both Course and Non-course)
課程論文両方 Doctoral Degree (Both Course and Thesis)
p. 21 Experience with Job Change/Relocation/Quitting Job
離職・転職・異動の有無 Experience of Job Resignation/Change/Relocation
p. 25 workplace hours 在職場時間 hours at workplace p. 40 (Fig. 1.69)
Dual Career Support Program 同居支援制度/帯同支援制度 Supporting system of faculty hiring who with an accompanying spouse
p. 46 (Fig. 1.78)
Middle school 中学 Junior high school
p. 50 Changes in "work as center" concept
仕事中心の考え方を変える Change the work-centered way of thinking
p. 51 (Fig. 1.93)
Balancing Family and Work 仕事と家庭の両立 Maintaining a Healthy Work-Life(or Work-Family) Balance
p. 51 (Fig. 1.93)
Municipal Childrearing Support
ファミリーサポート A local parenting project supported by Japan's Ministry of Health, Labor and Welfare. That is so called “Fami-Supo (Family-Support)” in Japan.
p. 54 (Fig. 1.95)
Joint researcher 共同研究者 Collaborator
p. 56 (Fig. 1.98)
Aggressive hiring 積極採用 Active hiring/ Active recruitment for female
p. 59 (Fig. 1.105)
Numerical Target for Female Hiring
女性比率の数値目標 Numerical Target for Female Employment Rate

v
Page or figure number
English term to appeare in the survey
Japanese term to appeare in the original survey
Alternative English term or short description
p. 63 (Fig. 1.112)
Separate surnames for married couples
夫婦別姓 Couple having different surnames / Married couples with different surnames
p. 76 (Fig. 3.9)
Care Giver During Academic Society Functions
学会参加時の保育担当者 People Providing Childcare Support during Academic Conference
p. 80 (Fig. 3.14)
General Staff 一般社員 Regular Employee
p. 93 (Fig. 3.19)
Frequent early retirement or leave of absence
女性に中途離職や休職が多い Women have high rates of early retirement and leave of absence
p. 93 (Fig. 3.19)
Female ratio is low for the generation currently in leadership position
現在指導的地位にある世代の
女性比率が低い The female labor force participation rate is low in the generation currently in leadership positions

vi
Members A member list of the abridged English translation working group (an alphabetical order):
Michiko Bando (Architectural Institute of Japan Yoshie Harada (The Biophysical Society of Japan) Noriko Hirata (The Mathematical Society of Japan) Yoshiko Ishida (The Institution of Professional Engineers, Japan) Taichi Ito (The Society of Chemical Engineers, Japan) Hiroko Ito (Japan Society for Bioscience, Biotechnology, and Agrochemistry) Miho Itoi (The Physical Society of Japan) Maki Iwakuma (The Institution of Professional Engineers, Japan) Akiko Kashimata (Architectural Institute of Japan) Naoko Kitagawa (The Society of Chemical Engineers, Japan) Akiko Koito (Architectural Institute of Japan) Hitomi Kumagai (Japan Society for Bioscience, Biotechnology, and Agrochemistry) Akane Miyazaki (The Society of Chemical Engineers, Japan) Lumi Negishi (The Biophysical Society of Japan) Chiaki Oguchi (Japan Geoscience Union) Hisako Ohtsubo (The Genetics Society of Japan) *Yukie Sano (The Physical Society of Japan) Megumi Sato (The Zoological Society of Japan) Kozo Shimada (The Institution of Professional Engineers, Japan) Misa Shimuta (The Physiological Society of Japan) Tomohiro Sudo (Architectural Institute of Japan) Yoshiko Tsuji (The Society of Chemical Engineers, Japan) Hiroko Tsukamura (The Japan Society for Comparative Endocrinology) Reiko Urade (Japan Society for Bioscience, Biotechnology, and Agrochemistry) Naoko Yoshie (The Society of Polymer Science, Japan) Naoko Yoshinaga (Japan Society for Bioscience, Biotechnology, and Agrochemistry) (* organizer of the working group)
vii
� Table of figures Figure 1.1 Age Distribution of Respondents and Percentage of Females ································· 3 Figure 1.2 Age Distribution of Respondents by Gender ····················································· 3 Figure 1.3 Highest Academic Degree (Single Answer) ······················································ 4 Figure 1.4 Types of Doctoral Degree (Single Answer) ······················································ 4 Figure 1.5 Male Respondents with Doctoral Degree by Age Group (Single Answer) ·················· 4 Figure 1.6 Female Respondents with Doctoral Degree by Age Group (Single Answer) ··············· 4 Figure 1.7 Years Elapsed Since Aquiring Degree (Single Answer) ········································ 5 Figure 1.8 Respondents’ Affiliated Academic Society and Percentage of Females (Multiple
Answers) ········································································································ 6 Figure 1.9 Current Employment Status (Single Answer) ···················································· 7 Figure 1.10 Number of Respondents by Profession (Single Answer) ····································· 7 Figure 1.11 Respondents’ Job Category by Profession (Single Answer) ································· 8 Figure 1.12 Respondents’ Affiliated Institution (Single Answer) ·········································· 8 Figure 1.13 Number of Respondents by Institution and Percentage of Females (Single Answer) ···· 9 Figure 1.14 Male Respondents’ Affiliated Institutions by Profession (Single Answer) ················ 9 Figure 1.15 Female Respondents’ Affiliated Institution by Profession (Single Answer) ··············· 9 Figure 1.16 Breakdown of Professions by Affiliated Institution (Single Answer) ···················· 10 Figure 1.17 Response by Job Positions (Multiple Answers) and Percentage of Females ············ 10 Figure 1.18 Percentage of Research and Technical Jobs (Single Answer) ······························ 11 Figure 1.19 Respondents with Doctoral Degree by Job Category (Single Answer) ··················· 11 Figure 1.20 Respondents’ Job Category by Affiliated Institution (Single Answer) ··················· 11 Figure 1.21 Annual Salary by Gender (Single Answer) ··················································· 12 Figure 1.22 Annual Salary by Age Group for Each Institution (Single Answer) ······················ 13 Figure 1.23 Employment Status by Institution (Single Answer) ········································· 14 Figure 1.24 Employment Status by Age Group for Each Institution (Single Answer) ················ 16 Figure 1.25 Employment Status by Profession (Single Answer) ········································· 17 Figure 1.26 Term of Current Occupation (Limited-term Employment) (Single Answer) ············ 18 Figure 1.27 Affiliation Changes (Current: Limited-term Employment) (Single Answer) ············ 18 Figure 1.28 Total Years as Limited-term Employee (Single Answer) ··································· 18 Figure 1.29 Contract Working Hours per Week (Single Answer) ········································ 18 Figure 1.30 Length of Limited-term Employment by Profession (Single Answer) ··················· 19 Figure 1.31 Affiliation Changes by Profession (Single Answer) ········································· 19 Figure 1.32 Social Security (Single Answer) ································································ 19 Figure 1.33 Provision for Childcare Leave (Single Answer) ············································· 20 Figure 1.34 Tenure Track Job (Single Answer) ····························································· 20 Figure 1.35 Desire for No-term Employment (Single Answer) ·········································· 20 Figure 1.36 Length of Limited-term Employment (Current: No-term Employment) (Single Answer)
·················································································································· 20 Figure 1.37 Affiliation Changes (Current: No-term Employment) (Single Answer) ·················· 20 Figure 1.38 Length of Limited-term Employment by Profession (Current: No-term Employment)
(Single Answer) ······························································································ 21 Figure 1.39 Affiliation Changes by Profession (Current: No-term Employment) (Single Answer) 21 Figure 1.40 Experience with Job Change/Relocation/Quitting Job (Multiple Answers) ············· 22 Figure 1.41 Number of Job Change/Relocation/Quitting Job (Single Answer) ························ 22 Figure 1.42 Reasons for Job Change/Relocation/Quitting Job (Multiple Answers) ··················· 23 Figure 1.43 Reasons for Job Change/Quitting Job by Age Group (Multiple Answers) ··············· 24 Figure 1.44 Hours Spent at Workplace per Week (Single Answer) ······································ 25
viii
Figure 1.45 Hours Spent in R&D per Week (Single Answer) ············································ 25 Figure 1.46 Hours Spent at Workplace per Week by Age Group (Single Answer) ···················· 26 Figure 1.47 Hours Spent Working at Home per Week (Single Answer) ································ 26 Figure 1.48 Hours Spent in R&D at Home per Week (Single Answer) ································· 26 Figure 1.49 Hours Spent Working at Home per Week by Age Group (Single Answer) ·············· 27 Figure 1.50 Hours Spent at Workplace per Week by Profession (Single Answer)····················· 28 Figure 1.51 Hours Spent Working at Home per Week by Profession (Single Answer) ··············· 29 Figure 1.52 Career Goals by Gender (Multiple Answers) ················································· 30 Figure 1.53 Career Goals by Occupational Field (Multiple Answers) Male/Female ················· 31 Figure 1.54 Career Goals by Profession (Multiple Answers) Male/Female ···························· 33 Figure 1.55 Impact of Overseas Activities on Career Development (Single Answer) ················ 33 Figure 1.56 Experience with Overseas Research Activities Lasting Over 6 Months (Single Answer)
·················································································································· 34 Figure 1.57 Benefits of Postdoctoral Position (Multiple Answers) ······································ 34 Figure 1.58 Problems with Postdoctoral Position (Multiple Answers) ·································· 35 Figure 1.59 Securing Career Path After Postdoc (Multiple Answers) ··································· 35 Figure 1.60 Marital Status (Single Answer) ································································· 36 Figure 1.61 Marital Status by Age Group for Each Institution (Single Answer) ······················ 37 Figure 1.62 Spouse’s Employment (Single Answer) ······················································· 37 Figure 1.63 Spouse’s Employment by Institution (Single Answer) ······································ 38 Figure 1.64 Term for Spouse’s Employment (Single Answer) ··········································· 38 Figure 1.65 Experience Living Separately (Single Answer) ·············································· 38 Figure 1.66 Experience Living Separately by Institution (Single Answer) ····························· 39 Figure 1.67 Percentage of Respondents with Separate Living Experience by Institution (Single
Answer) ······································································································· 39 Figure 1.68 Years Spent Living Separately (Single Answer) ············································· 39 Figure 1.69 Dual Career Support Program (Multiple Answers) ·········································· 40 Figure 1.70 Dual Career Support Program by Institution (Multiple Answers) ························· 40 Figure 1.71 Dual Career Support Program by Age Group (Multiple Answers) ························ 41 Figure 1.72 Use of Dual Career Support Program (Single Answer) ····································· 41 Figure 1.73 Use of Dual Career Support Program by Age Group (Single Answer) ··················· 42 Figure 1.74 Reason for Not Using Dual Career Support Program (Overall/by Institution)
(Multiple Answers) ·························································································· 43 Figure 1.75 Number of Children (Single Answer) ························································· 43 Figure 1.76 Number of Children Overall (Single Answer)················································ 44 Figure 1.77 Number of Children by Institution (Single Answer) ········································ 45 Figure 1.78 Age of Children (for those with children) (Multiple Answers) ···························· 46 Figure 1.79 Age Relation of Respondents and Their Children (Multiple Answers) ··················· 46 Figure 1.80 Ideal Number of Children (Single Answer) ··················································· 46 Figure 1.81 Actual and Ideal Number of Children (Single Answer) ····································· 46 Figure 1.82 Reasons Why Number of Children Are Less Than Ideal (Multiple Answers)··········· 47 Figure 1.83 Person Responsible for Daytime Childcare (Pre-school) (Multiple Answers) ·········· 47 Figure 1.84 Person Responsible for Daytime Childcare (Elementary School) (Multiple Answers) 48 Figure 1.85 Status of Childcare Leave (Multiple Answers) ··············································· 48 Figure 1.86 Length of Childcare Leave (Single Answer) ················································· 48 Figure 1.87 Reasons for Not Taking Leave (Multiple Answers) ········································· 49 Figure 1.88 Status After Leave (Single Answer)···························································· 49 Figure 1.89 Need for Nursing Care of Family Member (Single Answer) ······························ 49 Figure 1.90 Awareness of Nursing-Care Leave (Single Answer) ········································ 50 Figure 1.91 Percentage of Respondents Aware of Nursing-Care Leave by Age Group (Single
Answer) ······································································································· 50
ix
Figure 1.92 Provision for Nursing-Care Leave at Respondent’s or Spouse’s Workplace (Single Answer) ······································································································· 50
Figure 1.93 Requirements for Balancing Family and Work (Multiple Answers) ······················ 51 Figure 1.94 Requirements for Balancing Family and Work by Presence of Children (Multiple
Answers) ······································································································ 53 Figure 1.95 Environment Required for R&D (Multiple Answers) ······································· 54 Figure 1.96 Reasons for Low Percentage of Female Researchers (Multiple Answers) ··············· 55 Figure 1.97 Reasons for Low Percentage of Females in Leadership Position (Multiple Answers) · 55 Figure 1.98 Remedies for Improving Female Ratio (Multiple Answers) ······························· 56 Figure 1.99 Awareness of Policies (Multiple Answers) ···················································· 56 Figure 1.100 Awareness of Policies by Institution (Multiple Answers) ································· 57 Figure 1.101 Awareness of Policies by Occupational Field (Multiple Answers) ······················ 57 Figure 1.102 Awareness and Significance of National Policies and Support for Female Researchers
(Single Answer) ······························································································ 58 Figure 1.103 Awareness of Numerical Target for Female Hiring (Single Answer)···················· 58 Figure 1.104 Significance of Setting a Numerical Target for Female Hiring (Single Answer) ······ 59 Figure 1.105 Numerical Target for Female Hiring (Single Answer) ····································· 59 Figure 1.106 Published Numerical Target for Female Hiring (for those who replied yes to set target)
(Single Answer) ······························································································ 59 Figure 1.107 Need for Numerical Target (for those who replied no to set target) (Single Answer) 59 Figure 1.108 Progress in the Promotion of Gender Equality (Single Answer) ························· 60 Figure 1.109 Progress in the Promotion of Gender Equality by Occupational Field (Single Answer)
·················································································································· 61 Figure 1.110 Progress in the Promotion of Gender Equality by Institution (Single Answer) ········ 61 Figure 1.111 Progress in the Promotion of Gender Equality by Profession (Single Answer) ······· 62 Figure 1.112 Future Requirements for Gender Equality (Multiple Answers) ·························· 63 Figure 2.1 Definition of Job Position Index (Single Answer) ············································ 64 Figure 2.2 Job Position Index by Age for Each Institution ················································ 65 Figure 2.3 Job Position Index by Age for University/Technical College ······························· 66 Figure 2.4 Job Position Index by Age for Each University/Technical College Academic Field ···· 67 Figure 2.5 Percentage of Active Female Faculties (Lecturer or above) in University/Technical
College (Single Answer) ···················································································· 68 Figure 2.6 Years Elapsed Since Acquiring Degree x Current Occupation x Gender (Single
Answer) ······································································································· 69 Figure 2.6 (Supplemental) Job Position and Years Elapsed Since Acquiring Degree (Ratio of
Respondents) ( ) is number of responses ························································· 69 Figure 3.1 Hours Spent at Workplace by Children’s Age Group (Single Answer) ···················· 70 Figure 3.2 Annual Salary and Number of Children (respondents in their late 30’s) (Single
Answer) ······································································································· 71 Figure 3.3 Taking Childcare Leave (Single Answer)······················································· 72 Figure 3.4 Why Parents with Pre-school Children Did Not Take Leave (Multiple Answers) ······· 73 Figure 3.5 Why Parents with Pre-school Children Did Not Take Leave by Employment Status
(Multiple Answers) ·························································································· 73 Figure 3.6 Why Parents with Pre-school Children Did Not Take Leave by Job Position (Multiple
Answers) ······································································································ 74 Figure 3.7 Daytime Care Giver of Pre-school Children by Age of Youngest Child (Multiple
Answers) ······································································································ 75 Figure 3.8 After-school Care Giver of Elementary School Children by Age of Youngest Child
(Multiple Answers) ·························································································· 75 Figure 3.9 Care Giver During Academic Society Functions by Age of Youngest Child (Multiple
Answers) ······································································································ 76 Figure 3.10 Length of Separation and Number of Children (Single Answer) ·························· 77
x
Figure 3.11 Length of Separation by Institution (Single Answer) ······································· 78 Figure 3.12 Consideration to Eliminate Separation (Single Answer) ··································· 79 Figure 3.13 Consideration to Eliminate Separation by Institution (Single Answer) ·················· 79 Figure 3.14 Use of Dual Career Support Program by Job Position (Single Answer) ················· 80 Figure 3.15 Reasons for Not Using Dual Career Support Program (Multiple Answers) ············· 81 Figure 3.16 People Requiring Nursing Care (Single Answer) ············································ 82 Figure 3.17 Requirements for Balancing Work and Child/Nursing Care (Multiple Answers)······· 84 Figure 3.18 Reasons for Low Proportion of Females in Science and Technology Fields in General
(Multiple Answers) ·························································································· 90 Figure 3.19 Reasons for Low Proportion of Females in Leadership Positions in Science and
Technology Fields (Multiple Answers) ··································································· 93 Figure 3.20 Requirements for Further Promoting Gender Equality (Multiple Answers) ············ 100 Figure 4.1a Working Arrangement by Age: Overall (Single Answer) ·································· 101 Figure 4.1b Working Arrangement by Age: University/Technical College (Single Answer) ······· 101 Figure 4.1c Working Arrangement by Age: Research Institution (Single Answer) ·················· 101 Figure 4.1d Working Arrangement by Age: Corporation (Single Answer) ···························· 102 Figure 4.2 Working Arrangement by Institution (Single Answer) ······································ 102 Figure 4.3a Working Arrangement by Job Position: University/Technical College (Single Answer)
················································································································· 102 Figure 4.3b Working Arrangement by Job Position: Research Institution (Single Answer) ········ 103 Figure 4.3c Working Arrangement by Job Position: Corporation (Single Answer) ·················· 103 Figure 4.4a Term of Employment by Occupational Field (Single Answer) ··························· 103 Figure 4.4b Average Term of Employment by Gender (Single Answer) ······························· 104 Figure 4.5 Probability of Extending Limited-term Employment (Single Answer) ··················· 104 Figure 4.6 Employment Arrangement and Average Annual Salary (University/technical College
and Research Institution) by Occupational Field/Gender (only those spending more than 40 hours per week at the workplace) ········································································ 105
Figure 4.7a Health Plan Participation: Participants (Single Answer) ··································· 105 Figure 4.7b Health Plan Participation Ratio: Participants (Single Answer) ··························· 105 Figure 4.8a Welfare/Mutual Pension Plan Participation: Participants (Single Answer) ············· 106 Figure 4.8b Welfare/Mutual Pension Plan Participation: Participation Ratio (Single Answer) ···· 106 Figure 4.9a Number of Children by Gender/Job Position (for males ages 35 to 39 only) (Single
Answer) ······································································································ 106 Figure 4.9b Number of Children by Gender/Job Position (for females ages 35 to 39 only) (Single
Answer) ······································································································ 107 Figure 4.10 Childcare Leave for Limited-term Employment (Single Answer) ······················· 107 Figure 4.11 Term Extension Due to Childcare Leave for Limited-term Employment (Single
Answer) ······································································································ 107 Figure 4.12 Employment Arrangement by Elapsed Years after Degree Acquisition for
University/Technical College and Research Institution (Single Answer) ·························· 108 Figure 4.13 Total Years of Limited-term Employment x Age/Gender (Single Answer) ············· 108 Figure 4.14 Desire for No-term Employment x Current Job (Single Answer) ························ 109 Figure 4.15a Limited-term Researchers by Age Group and Ratio of Females (Single Answer) ··· 109 Figure 4.15b Limited-term Researchers by Age Group and Ratio of Females (Single Answer)
(horizontal axis aligned with third survey) ····························································· 110 Figure 4.16 Contract Working Hours per Week of Limited-term Researcher (Single Answer) ···· 110 Figure 4.17 Weekly Hours Spent at Workplace by Occupational Field (Single Answer) ··········· 111 Figure 4.18a Contract Working Hours per Week of Limited-term Researcher and Hours Spent at
Workplace (Single Answer) ··············································································· 111 Figure 4.18b Contract Working Hours per Week of Limited-term NPI and Hours Spent at
Workplace (Single Answer) ··············································································· 111

xi
Figure 4.18c Average Hours Spent at Workplace/Contract Working Hours per Week of Limited-term Researcher (Single Answer) ········································································ 112
Figure 4.18d Average Hours Spent at Workplace/Contract Working Hours per Week of Limited-term NPI (Single Answer) ················································································· 112
Figure 4.19 Average Hours Spent in Research While at Workplace (Single Answer) ··············· 112 Figure 4.20a Annual Salary of Limited-term Researcher by Age and Gender (Single Answer) ··· 113 Figure 4.20b Average Annual Salary of Limited-term Researcher by Age and Gender (Single
Answer) ······································································································ 113 Figure 4.20c Median Annual Salary of Limited-term Researcher by Age and Gender (Single
Answer) ······································································································ 113 Figure 4.21 Annual Salary of Respondents with Doctoral Degree that Spend Over 40 Hours at
Workplace (Single Answer) ··············································································· 114 Figure 4.22 Tenure Track Employment x Age (Single Answer) ········································· 114 Figure 4.23 Tenure Track Employment x Elapsed Years after Degree Acquisition (Single Answer)
················································································································· 115 Figure 4.24 Tenure Track Employment x Current Job (Single Answer) ······························· 115 Figure 4.25 Working Arrangement by Age: University/Technical College (Single Answer) ······· 115 Figure 4.26 Contract Working Hours for Tenure and Non-tenure Employments (Single Answer) 116 Figure 4.27a Annual Salary of Tenure Track Employee by Age and Gender (Single Answer) ····· 116 Figure 4.27b Annual Salary of Non-tenure Track Employee by Age and Gender (Single Answer)
················································································································· 116 Figure 4.27c Annual Salary of Tenure and Non-tenure Employees by Age and Gender (Single
Answer) ······································································································ 117 Figure 4.27d Annual Salary of Tenure and Non-tenure Employees by Age and Gender (Single
Answer) ······································································································ 117 Figure 4.28a Childcare Leave for Tenure and Non-tenure Employees (Single Answer) ············ 117 Figure 4.28b Employment Extension for Tenure and Non-tenure Employees after Childcare Leave
(Single Answer) ····························································································· 118 Figure 4.29 Average Time Spent on R&D at Workplace for Tenure and Non-tenure Employees
(Single Answer) ····························································································· 118 Figure 5.1 Awareness of Recent Laws/Policies by Age Group and Gender (Single Answer per
Item) ·········································································································· 119 Figure 5.2 Awareness of Recent Laws/Policies by Occupational Field (Single Answer) ··········· 120 Figure 5.3 Awareness of Recent Laws/Policies by Job Position (Single Answer per Item) ········· 121 Figure 5.4 Awareness of Recent Laws/Policies Overall by Profession (Single Answer per Item)
(excludes students) ························································································· 122 Figure 5.5 Perception of Recent Policies by Occupational Field (Single Answer) ··················· 124 Figure 5.6 Awareness of Numerical Target for Newly Hired Female Researchers by Occupational
Field (Single Answer) ······················································································ 125 Figure 5.7 Perception of Numerical Target for Newly Hired Female Researchers by Occupational
Field (Single Answer) ······················································································ 125 Figure 5.8 Perception of Numerical Target for Newly Hired Female Researchers by Profession
(Single Answer) (excludes students) ····································································· 126 Figure 5.9 Perception of Numerical Target for Newly Hired Female Researchers by Age Group
(Single Answer) ····························································································· 126 Figure 5.10 Awareness of Numerical Target by Job Position (Single Answer) ······················· 128 Figure 5.11 Awareness of Numerical Target and Perception on Significance (Single Answer)
(excludes "uncertain")······················································································ 128 Figure 5.12 Awareness of Numerical Target and Perception on Significance Compared with Third
Survey (excludes "uncertain") ············································································ 129 Figure 5.13 Awareness by Job Position of Numerical Target for Female Hiring in Affiliated
Organization (Single Answer) ············································································ 131
xii
Figure 5.14 Awareness by Job Position of Publicized Numerical Target for Female Hiring in Affiliated Organization (Single Answer) ································································ 133
Figure 5.15 Perception by Job Position on Necessity of Numerical Target (Single Answer) ······· 136 Figure 6.1.1 Total Responses and Written Comments ···················································· 137 Figure 6.2.1 Number of Written Comments by Age/Gender ············································· 137 Figure 6.2.2 Ratio of Written Comments by Age/Gender ················································ 137 Figure 6.3.1 Number of Written Comments by Occupational Field ···································· 138 Figure 6.3.2 Ratio of Written Comments from Females by Occupational Field ······················ 138 Figure 6.4 Major Topics and Number of Comments ······················································ 139

1
Preface The Japan Inter-Society Liaison Association Committee for Promoting Equal Participation of Men and Women
in Science and Engineering (EPMEWSE) conducts a large-scale survey roughly every four years on gender equality in the science and engineering professions “to understand the current environment surrounding the communities of science and engineering professionals, to identify issues and to propose recommendations.”1) The first and second surveys were carried out under the consignment of Japan’s Ministry of Education, Culture, Sports, Science and Technology, but from the third survey, the EPMEWSE itself has been working on the project with the combined strength of its member academic societies. Our intention is to capture the trends over time through periodic research, investigate the awareness of the gender equality related laws and policies set up with the movement of the times, verify the effect of government projects and recommend new policies as necessary.
Raising productivity and innovation power in Japan, which has entered an era of depopulation, is a challenging issue, and how women work is drawing attention as a key to solving that issue. “To maintain and strengthen international competitiveness and to revitalize science and technology/academic activities incorporating various perspectives and ideas,” as stated in the Fourth Basic Plan for Gender Equality (approved by Cabinet in December 2015), and “to incorporate a broad array of perspectives and excellent ideas in the stimulation of STI (Science, Technology and Innovation) activities,” as stated in the 5th Science and Technology Basic Plan (approved by the Cabinet in January 2016), “it will be essential to develop environments in which women have opportunities to exert their abilities to the fullest and to continue to promote the advancement of their careers.” For the comprehensive promotion of women’s activities, the “Act on Promotion of Women's Participation and Advancement in the Workplace” was placed in to full effect in April 2016. The act made it obligatory for national and local governments as well as private enterprises to comprehend the situation concerning the activity of women, analyze issues, formulate action plans, and publish information. Internationally, at the G7 Ise Shima Summit in 2016, which Japan chaired, the world leaders declared their commitment “to empowering women and girls, including through capacity-building such as education and training as well as promoting active role of women in Science, Technology, Engineering and Mathematics (STEM) fields,” and for that purpose set up the “Women’s Initiative in Developing STEM Career (WINDS).”
Against such social trends, this research study clarified how the current situation of female researchers and engineers is changing along with the situation of their male counterparts. Similar to the third survey, we considered “Gender Gap in Job Positions,” “Child and Nursing Care,” “Limited-term Employment and Postdocs” and “Programs and Policies” as important topics in our analysis. The number of responses to the latest survey exceeded 18,000 surpassing the number received in previous surveys, and more than 4,500 comments were gathered making the report more content rich than ever before. We would like to thank the survey participants from each academic society for their cooperation, and as with previous reports, we strongly hope that this report will contribute to the promotion of gender equality and further development of science and technology.
1) Japan Inter-Society Liaison Association Committee for Promoting Equal Participation of Men and Women in Science and Engineering, Report on the MEXT-Commissioned Project in FY2003 “Diverse Visions of Scientists and Engineers in the 21st Century -For the Promotion of Gender Equality- ,” March 2004

Chapter 1 Summary of Results
2
Survey Results In the fourth survey, a questionnaire containing 88 questions covering 42 items was prepared. The survey was carried out through a Website from October 8 to November 7, 2016 targeting members of academic societies.
Note:
In the fourth survey, the following common definitions apply in each chapter.
○ Affiliated institution
Affiliated institution is divided into five categories of “university/technical college”, “research institution”, “corporation”, “government” and “others”.
○ Occupational field
Based on job title, occupational field is divided into five major categories.
Two categories for “university/technical college” and research institution”:
① PI: Principal Investigator (professor, associate professor, lecturer, dean, director, division head, group lab chief, senior researcher)
② NPI: Not Principal Investigator (assistant professor, research assistant, researcher (including limited-term researcher), research technician)
Two categories for “government” and “corporation”:
③ manager (executive director, general manager, senior manager, manager)
④ regular employee (group leader, general staff)
One category for:
⑤ student
These categories were further divided into nine categories depending on the presence of term limits. That is, (A) no-term PI, (B) limited-term PI, (C) no-term NPI (excludes no-term researcher), (D) limited-term NPI (excludes limited-term researcher), (E) no-term researcher, (F) limited-term researcher (includes researcher reappointed to limited-term employment after reaching retirement age), (G) manager (corporate executive director, general manager, senior manager, manager), (H) regular employee (group leader, general staff), and (I) student.
Chapter 1 Summary of Results
3
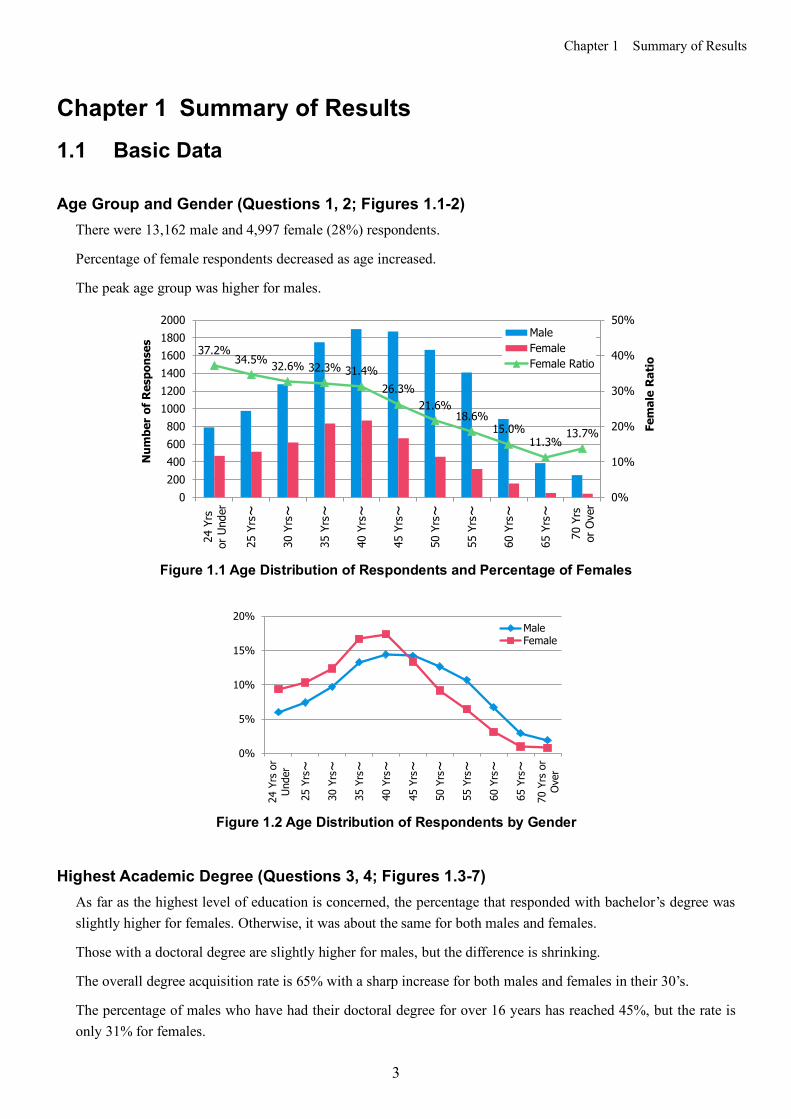
Chapter 1 Summary of Results 1.1 Basic Data Age Group and Gender (Questions 1, 2; Figures 1.1-2)
There were 13,162 male and 4,997 female (28%) respondents.
Percentage of female respondents decreased as age increased.
The peak age group was higher for males.
Figure 1.1 Age Distribution of Respondents and Percentage of Females
Figure 1.2 Age Distribution of Respondents by Gender
Highest Academic Degree (Questions 3, 4; Figures 1.3-7) As far as the highest level of education is concerned, the percentage that responded with bachelor’s degree was slightly higher for females. Otherwise, it was about the same for both males and females.
Those with a doctoral degree are slightly higher for males, but the difference is shrinking.
The overall degree acquisition rate is 65% with a sharp increase for both males and females in their 30’s.
The percentage of males who have had their doctoral degree for over 16 years has reached 45%, but the rate is only 31% for females.
37.2%34.5% 32.6% 32.3% 31.4%
26.3%21.6%
18.6%15.0%
11.3%13.7%
0%
10%
20%
30%
40%
50%
0200400600800
100012001400160018002000
24 Y
rsor
Und
er
25 Y
rs~
30 Y
rs~
35 Y
rs~
40 Y
rs~
45 Y
rs~
50 Y
rs~
55 Y
rs~
60 Y
rs~
65 Y
rs~
70 Y
rsor
Ove
r
Fem
ale
Ratio
Num
ber
of R
espo
nses
MaleFemaleFemale Ratio
0%
5%
10%
15%
20%
24 Y
rs o
rUn
der
25 Y
rs~
30 Y
rs~
35 Y
rs~
40 Y
rs~
45 Y
rs~
50 Y
rs~
55 Y
rs~
60 Y
rs~
65 Y
rs~
70 Y
rs o
rOv
er
MaleFemale

Chapter 1 Summary of Results
4
Figure 1.3 Highest Academic Degree (Single Answer)
Figure 1.4 Types of Doctoral Degree (Single Answer)
Figure 1.5 Male Respondents with Doctoral Degree by Age Group (Single Answer)
Figure 1.6 Female Respondents with Doctoral Degree by Age Group (Single Answer)
0% 20% 40% 60% 80% 100%
Male(n=13162)
Female (n=4997)
Associate DegreeBachelor’sMaster’sDoctor’sOthers
0% 20% 40% 60% 80% 100%
Male(n=13162)
Female(n=4997)
NoneDoctoral Degree (Course)Doctoral Degree (Non-course)Doctoral Degree (Both Course and Non-course)
790 976 1277 1750 1899 1871 1665 1409 885 386 251
0%
20%
40%
60%
80%
100%
24 Y
rsor
Und
er
25 Y
rs~
30 Y
rs~
35 Y
rs~
40 Y
rs~
45 Y
rs~
50 Y
rs~
55 Y
rs~
60 Y
rs~
65 Y
rs~
70 Y
rsor
Ove
r
Doctoral Degree (Both Course and Non-course)Doctoral Degree (Non-course)Doctoral Degree (Course)None
467 515 619 834 868 667 459 321 156 49 40
0%
20%
40%
60%
80%
100%
24 Y
rsor
Und
er
25 Y
rs~
30 Y
rs~
35 Y
rs~
40 Y
rs~
45 Y
rs~
50 Y
rs~
55 Y
rs~
60 Y
rs~
65 Y
rs~
70 Y
rsor
Ove
r
Doctoral Degree (Both Course and Non-course)Doctoral Degree (Non-course)Doctoral Degree (Course)None
Chapter 1 Summary of Results
5
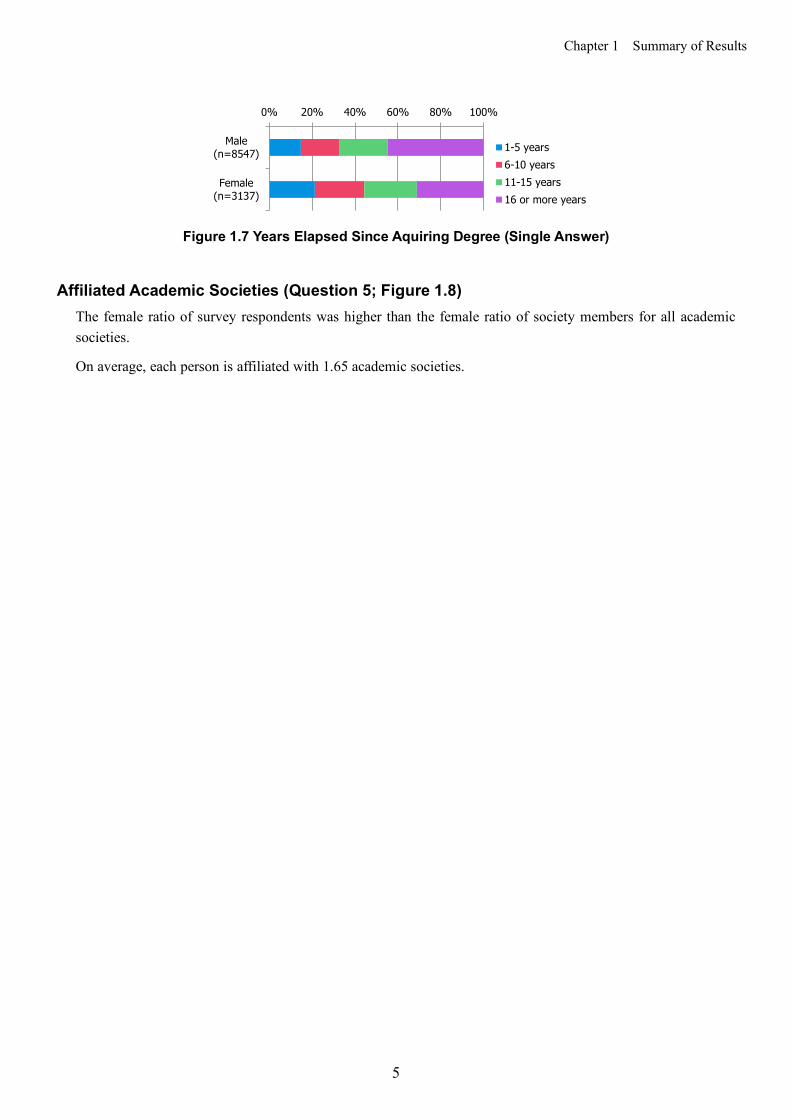
Figure 1.7 Years Elapsed Since Aquiring Degree (Single Answer)
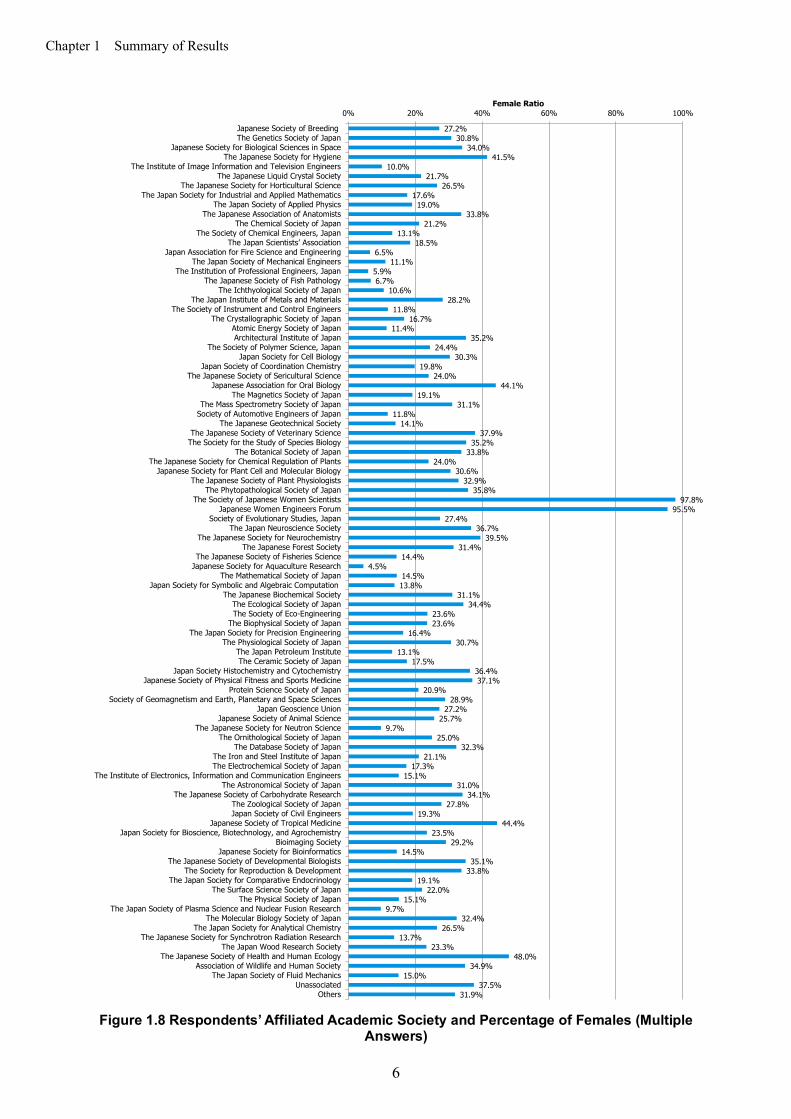
Affiliated Academic Societies (Question 5; Figure 1.8) The female ratio of survey respondents was higher than the female ratio of society members for all academic societies.
On average, each person is affiliated with 1.65 academic societies.
0% 20% 40% 60% 80% 100%
Male(n=8547)
Female(n=3137)
1-5 years6-10 years11-15 years16 or more years
Chapter 1 Summary of Results
6
Figure 1.8 Respondents’ Affiliated Academic Society and Percentage of Females (Multiple
Answers)
27.2%30.8%
34.0%41.5%
10.0%21.7%
26.5%17.6%19.0%
33.8%21.2%
13.1%18.5%
6.5%11.1%
5.9%6.7%
10.6%28.2%
11.8%16.7%
11.4%35.2%
24.4%30.3%
19.8%24.0%
44.1%19.1%
31.1%11.8%
14.1%37.9%
35.2%33.8%
24.0%30.6%
32.9%35.8%
97.8%95.5%
27.4%36.7%
39.5%31.4%
14.4%4.5%
14.5%13.8%
31.1%34.4%
23.6%23.6%
16.4%30.7%
13.1%17.5%
36.4%37.1%
20.9%28.9%
27.2%25.7%
9.7%25.0%
32.3%21.1%
17.3%15.1%
31.0%34.1%
27.8%19.3%
44.4%23.5%
29.2%14.5%
35.1%33.8%
19.1%22.0%
15.1%9.7%
32.4%26.5%
13.7%23.3%
48.0%34.9%
15.0%37.5%
31.9%
0% 20% 40% 60% 80% 100%
Japanese Society of BreedingThe Genetics Society of Japan
Japanese Society for Biological Sciences in SpaceThe Japanese Society for Hygiene
The Institute of Image Information and Television EngineersThe Japanese Liquid Crystal Society
The Japanese Society for Horticultural ScienceThe Japan Society for Industrial and Applied Mathematics
The Japan Society of Applied PhysicsThe Japanese Association of Anatomists
The Chemical Society of JapanThe Society of Chemical Engineers, Japan
The Japan Scientists’ AssociationJapan Association for Fire Science and Engineering
The Japan Society of Mechanical EngineersThe Institution of Professional Engineers, Japan
The Japanese Society of Fish PathologyThe Ichthyological Society of Japan
The Japan Institute of Metals and MaterialsThe Society of Instrument and Control Engineers
The Crystallographic Society of JapanAtomic Energy Society of JapanArchitectural Institute of Japan
The Society of Polymer Science, JapanJapan Society for Cell Biology
Japan Society of Coordination ChemistryThe Japanese Society of Sericultural Science
Japanese Association for Oral BiologyThe Magnetics Society of Japan
The Mass Spectrometry Society of JapanSociety of Automotive Engineers of Japan
The Japanese Geotechnical SocietyThe Japanese Society of Veterinary Science
The Society for the Study of Species BiologyThe Botanical Society of Japan
The Japanese Society for Chemical Regulation of PlantsJapanese Society for Plant Cell and Molecular Biology
The Japanese Society of Plant PhysiologistsThe Phytopathological Society of Japan
The Society of Japanese Women ScientistsJapanese Women Engineers Forum
Society of Evolutionary Studies, JapanThe Japan Neuroscience Society
The Japanese Society for NeurochemistryThe Japanese Forest Society
The Japanese Society of Fisheries ScienceJapanese Society for Aquaculture Research
The Mathematical Society of JapanJapan Society for Symbolic and Algebraic Computation
The Japanese Biochemical SocietyThe Ecological Society of JapanThe Society of Eco-Engineering
The Biophysical Society of JapanThe Japan Society for Precision Engineering
The Physiological Society of JapanThe Japan Petroleum InstituteThe Ceramic Society of Japan
Japan Society Histochemistry and CytochemistryJapanese Society of Physical Fitness and Sports Medicine
Protein Science Society of JapanSociety of Geomagnetism and Earth, Planetary and Space Sciences
Japan Geoscience UnionJapanese Society of Animal Science
The Japanese Society for Neutron ScienceThe Ornithological Society of Japan
The Database Society of JapanThe Iron and Steel Institute of JapanThe Electrochemical Society of Japan
The Institute of Electronics, Information and Communication EngineersThe Astronomical Society of Japan
The Japanese Society of Carbohydrate ResearchThe Zoological Society of JapanJapan Society of Civil Engineers
Japanese Society of Tropical MedicineJapan Society for Bioscience, Biotechnology, and Agrochemistry
Bioimaging SocietyJapanese Society for Bioinformatics
The Japanese Society of Developmental BiologistsThe Society for Reproduction & Development
The Japan Society for Comparative EndocrinologyThe Surface Science Society of Japan
The Physical Society of JapanThe Japan Society of Plasma Science and Nuclear Fusion Research
The Molecular Biology Society of JapanThe Japan Society for Analytical Chemistry
The Japanese Society for Synchrotron Radiation ResearchThe Japan Wood Research Society
The Japanese Society of Health and Human EcologyAssociation of Wildlife and Human Society
The Japan Society of Fluid MechanicsUnassociated
Others
Female Ratio

Chapter 1 Summary of Results
7
Employment Status (Question 6; Figure 1.9) About 85% of the respondents are currently employed, and no big difference was seen between genders.
Figure 1.9 Current Employment Status (Single Answer)
Breakdown of Respondents by Profession (Question 6; Figure 1.10) The largest number of responses came from those in the life science and biology field.
Figure 1.10 Number of Respondents by Profession (Single Answer)
Breakdown of Respondents by Profession and Job Category (Question 6, 8; Figure 1.11) In terms of job category, large portion of engineering professionals was with a corporation, and respondents in technical and sales jobs were high.
0% 20% 40% 60% 80% 100%
Male(n=13162)
Female(n=4997)
Not workingWorkingStudent
14.4% 16.9%15.7%
20.4%
31.3%25.7%
10.4%
28.3%26.0%
39.9%
54.0%
38.8%
0%
10%
20%
30%
40%
50%
60%
0
500
1000
1500
2000
2500
3000
Mat
hem
atics
Elec
troni
cs a
ndIn
form
atio
n
Phys
ics
Chem
ical a
nd M
ater
ial
Engi
neer
ing
Life
scie
nce
and
Biol
ogy
Civi
l Eng
inee
ring
Mec
hani
cal E
ngin
eerin
g
Earth
and
Pla
neta
rySc
ienc
e
Agric
ultu
re
Med
icine
, Den
tistry
and
Phar
mac
olog
y
Heal
th a
nd N
ursin
g
Othe
rs
Fem
ale
Ratio
Num
ber
of R
espo
nses
MaleFemaleFemale Ratio

Chapter 1 Summary of Results
8
Figure 1.11 Respondents’ Job Category by Profession (Single Answer)
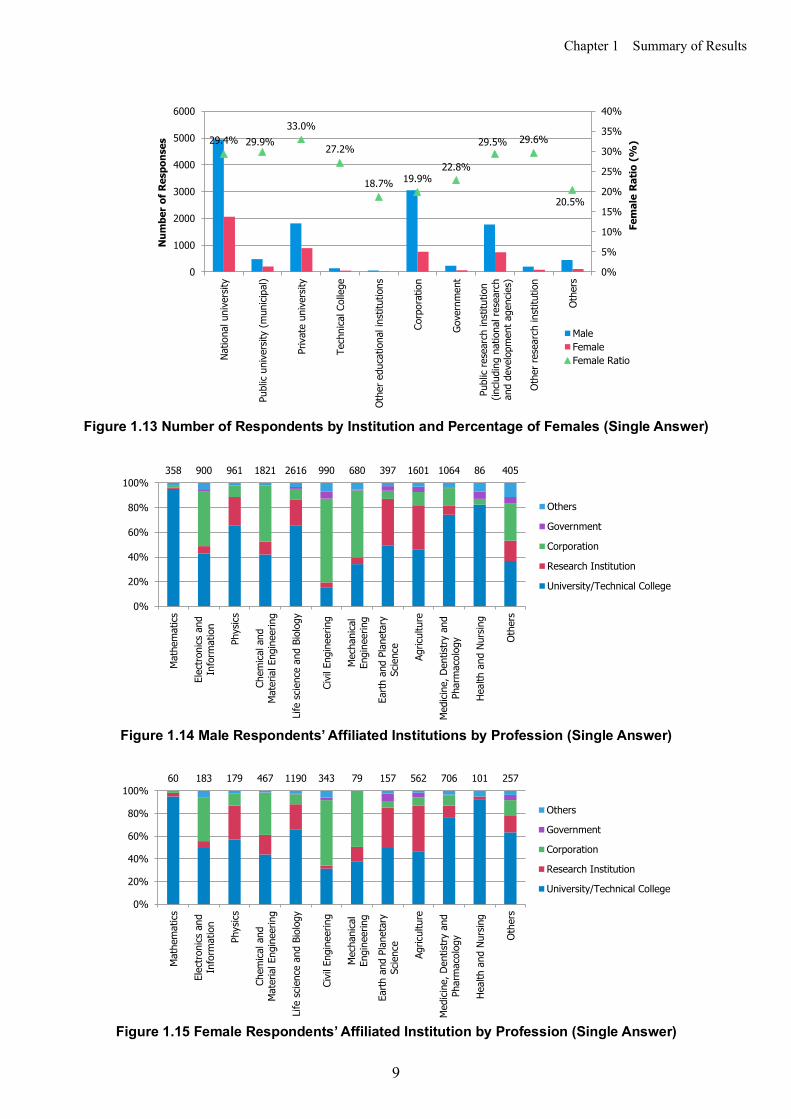
Affiliated Institution (Question 6; Figures 1.12-16) Respondents’ affiliation was highest with university/technical college. There was a 6 to 10 point difference in female ratios of corporation and government (20% and 23%, respectively) compared with university and research institution (30% and 29%, respectively).
For both genders, almost all mathematics professionals were affiliated with a university while ratio of engineering professionals was high with the corporation.
Looking at the same data by affiliated institution, life science and biology accounted for a large portion with university and research institution.
Figure 1.12 Respondents’ Affiliated Institution (Single Answer)
358 60 900 183 961 179 1821 467 2616 1190 990 343 680 79 397 157 1601 562 1064 706 86 101 405 257
0%
20%
40%
60%
80%
100%
Mal
e
Fem
ale
Mal
e
Fem
ale
Mal
e
Fem
ale
Mal
e
Fem
ale
Mal
e
Fem
ale
Mal
e
Fem
ale
Mal
e
Fem
ale
Mal
e
Fem
ale
Mal
e
Fem
ale
Mal
e
Fem
ale
Mal
e
Fem
ale
Mal
e
Fem
ale
MathematicsElectronicsand
Information
Physics Chemicaland
MaterialEngineering
Life scienceand Biology
CivilEngineering
MechanicalEngineering
Earth andPlanetaryScience
Agriculture Medicine,Dentistry
andPharmacology
Health andNursing
Others
Research / Education Technical Sales Others
0% 20% 40% 60% 80% 100%
Male(n=13162)
Female(n=4997)
University/Technical CollegeResearch InstitutionCorporationGovernmentOthers
Chapter 1 Summary of Results
9
Figure 1.13 Number of Respondents by Institution and Percentage of Females (Single Answer)
Figure 1.14 Male Respondents’ Affiliated Institutions by Profession (Single Answer)
Figure 1.15 Female Respondents’ Affiliated Institution by Profession (Single Answer)
29.4% 29.9%33.0%
27.2%
18.7% 19.9%22.8%
29.5% 29.6%
20.5%
0%
5%
10%
15%
20%
25%
30%
35%
40%
0
1000
2000
3000
4000
5000
6000
Natio
nal u
nive
rsity
Publ
ic un
iver
sity
(mun
icipa
l)
Priv
ate
univ
ersit
y
Tech
nica
l Col
lege
Othe
r edu
catio
nal i
nstit
utio
ns
Corp
orat
ion
Gove
rnm
ent
Publ
ic re
sear
ch in
stitu
tion
(inclu
ding
nat
iona
l res
earc
han
d de
velo
pmen
t age
ncie
s)
Othe
r res
earc
h in
stitu
tion
Othe
rs
Fem
ale
Ratio
(%
)
Num
ber
of R
espo
nses
MaleFemaleFemale Ratio
358 900 961 1821 2616 990 680 397 1601 1064 86 405
0%
20%
40%
60%
80%
100%
Mat
hem
atics
Elec
troni
cs a
ndIn
form
atio
n
Phys
ics
Chem
ical a
ndM
ater
ial E
ngin
eerin
g
Life
scie
nce
and
Biol
ogy
Civi
l Eng
inee
ring
Mec
hani
cal
Engi
neer
ing
Earth
and
Pla
neta
rySc
ienc
e
Agric
ultu
re
Med
icine
, Den
tistry
and
Phar
mac
olog
y
Heal
th a
nd N
ursin
g
Othe
rsOthers
Government
Corporation
Research Institution
University/Technical College
60 183 179 467 1190 343 79 157 562 706 101 257
0%
20%
40%
60%
80%
100%
Mat
hem
atics
Elec
troni
cs a
ndIn
form
atio
n
Phys
ics
Chem
ical a
ndM
ater
ial E
ngin
eerin
g
Life
scie
nce
and
Biol
ogy
Civi
l Eng
inee
ring
Mec
hani
cal
Engi
neer
ing
Earth
and
Pla
neta
rySc
ienc
e
Agric
ultu
re
Med
icine
, Den
tistry
and
Phar
mac
olog
y
Heal
th a
nd N
ursin
g
Othe
rs
Others
Government
Corporation
Research Institution
University/Technical College
Chapter 1 Summary of Results
10
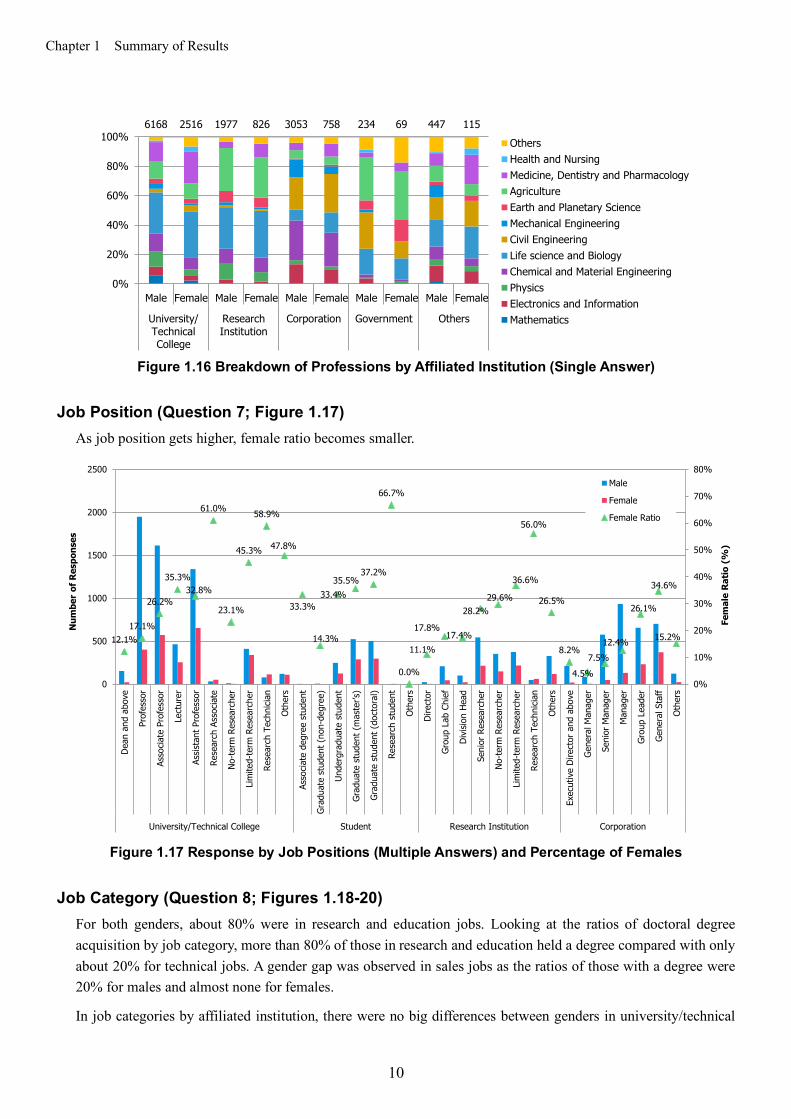
Figure 1.16 Breakdown of Professions by Affiliated Institution (Single Answer)
Job Position (Question 7; Figure 1.17)
As job position gets higher, female ratio becomes smaller.
Figure 1.17 Response by Job Positions (Multiple Answers) and Percentage of Females
Job Category (Question 8; Figures 1.18-20)
For both genders, about 80% were in research and education jobs. Looking at the ratios of doctoral degree acquisition by job category, more than 80% of those in research and education held a degree compared with only about 20% for technical jobs. A gender gap was observed in sales jobs as the ratios of those with a degree were 20% for males and almost none for females.
In job categories by affiliated institution, there were no big differences between genders in university/technical
6168 2516 1977 826 3053 758 234 69 447 115
0%
20%
40%
60%
80%
100%
Male Female Male Female Male Female Male Female Male Female
University/TechnicalCollege
ResearchInstitution
Corporation Government Others
OthersHealth and NursingMedicine, Dentistry and PharmacologyAgricultureEarth and Planetary ScienceMechanical EngineeringCivil EngineeringLife science and BiologyChemical and Material EngineeringPhysicsElectronics and InformationMathematics
12.1%17.1%
26.2%
35.3%32.8%
61.0%
23.1%
45.3%
58.9%
47.8%
33.3%
14.3%
33.4%35.5%
37.2%
66.7%
0.0%
11.1%
17.8%17.4%
28.2%29.6%
36.6%
56.0%
26.5%
8.2%
4.5%7.5%
12.4%
26.1%
34.6%
15.2%
0%
10%
20%
30%
40%
50%
60%
70%
80%
0
500
1000
1500
2000
2500
Dean
and
abo
ve
Prof
esso
r
Asso
ciate
Pro
fess
or
Lect
urer
Assis
tant
Pro
fess
or
Rese
arch
Ass
ocia
te
No-te
rm R
esea
rche
r
Lim
ited-
term
Res
earc
her
Rese
arch
Tec
hnici
an
Othe
rs
Asso
ciate
deg
ree
stud
ent
Grad
uate
stu
dent
(non
-deg
ree)
Unde
rgra
duat
e st
uden
t
Grad
uate
stu
dent
(mas
ter’s
)
Grad
uate
stu
dent
(doc
tora
l)
Rese
arch
stu
dent
Othe
rs
Dire
ctor
Grou
p La
b Ch
ief
Divis
ion
Head
Seni
or R
esea
rche
r
No-te
rm R
esea
rche
r
Lim
ited-
term
Res
earc
her
Rese
arch
Tec
hnici
an
Othe
rs
Exec
utiv
e Di
rect
or a
nd a
bove
Gene
ral M
anag
er
Seni
or M
anag
er
Man
ager
Grou
p Le
ader
Gene
ral S
taff
Othe
rs
University/Technical College Student Research Institution Corporation
Fem
ale
Ratio
(%
)
Num
ber
of R
espo
nses
Male
Female
Female Ratio

Chapter 1 Summary of Results
11
college and research institution, however in corporation, number of females in research and education jobs tended to be higher.
Figure 1.18 Percentage of Research and Technical Jobs (Single Answer)
Figure 1.19 Respondents with Doctoral Degree by Job Category (Single Answer)
Figure 1.20 Respondents’ Job Category by Affiliated Institution (Single Answer)
Annual Salary (Question 9; Figures 1.21-22)
There was a huge difference between genders in terms of annual salaries as males peaked around the 6 to 9 million JPY range while the peak range for females was around 6 to 7 million JPY.
In almost all affiliated institutions and age groups, the average annual salaries of females were lower at about 80% of males.
0% 20% 40% 60% 80% 100%
Male(n=11879)
Female(n=4284)
Research / EducationTechnicalSalesOthers
8879 3412 2421 698 100 8 479 166
0%
20%
40%
60%
80%
100%
Male Female Male Female Male Female Male Female
Research/Education Job
Technical Job Sales Job Others
Have Doctoral Degree No Doctoral Degree
6168 2516 1977 826 3053 758 234 69 447 115
0%
20%
40%
60%
80%
100%
Male Female Male Female Male Female Male Female Male Female
University/TechnicalCollege
ResearchInstitution
Corporation Government Others
Research/Education Job Technical Job Sales Job Others

Chapter 1 Summary of Results
12
Figure 1.21 Annual Salary by Gender (Single Answer)
0
200
400
600
800
1000
1200
1400
1600
1800
Unan
swer
ed
None
(0 JP
Y)
Unde
r 1 M
illion
JPY
1 M
illion
JPY~
2 M
illion
JPY~
3 M
illion
JPY~
4 M
illion
JPY~
5 M
illion
JPY~
6 M
illion
JPY~
7 M
illion
JPY~
8 M
illion
JPY~
9 M
illion
JPY~
10 M
illion
JPY~
11 M
illion
JPY~
12 M
illion
JPY~
13 M
illion
JPY~
14 M
illion
JPY~
15 M
illion
JPY
or
Over
Num
ber
of R
espo
nses
MaleFemale

Chapter 1 Summary of Results
13
Figure 1.22 Annual Salary by Age Group for Each Institution (Single Answer)
0200400600800
10001200
24 Y
rs o
r Und
er25
Yrs~
30 Y
rs~
35 Y
rs~
40 Y
rs~
45 Y
rs~
50 Y
rs~
55 Y
rs~
60 Y
rs~
65 Y
rs~
70 Y
rs o
r Ove
rAver
age
Annu
al S
alar
y (T
en T
hous
and
JPY)
University/Technical College
MaleFemale
0200400600800
10001200
24 Y
rs o
r Und
er25
Yrs~
30 Y
rs~
35 Y
rs~
40 Y
rs~
45 Y
rs~
50 Y
rs~
55 Y
rs~
60 Y
rs~
65 Y
rs~
70 Y
rs o
r Ove
r
Aver
age
Annu
al S
alar
y (T
en T
hous
and
JPY)
Research Institution
MaleFemale
0200400600800
10001200
24 Y
rs o
r Und
er25
Yrs~
30 Y
rs~
35 Y
rs~
40 Y
rs~
45 Y
rs~
50 Y
rs~
55 Y
rs~
60 Y
rs~
65 Y
rs~
70 Y
rs o
r Ove
rAver
age
Annu
al S
alar
y (T
en T
hous
and
JPY)
Corporation
MaleFemale
0
200
400
600
800
1000
1200
24 Y
rs o
r Und
er25
Yrs~
30 Y
rs~
35 Y
rs~
40 Y
rs~
45 Y
rs~
50 Y
rs~
55 Y
rs~
60 Y
rs~
65 Y
rs~
70 Y
rs o
r Ove
rAver
age
Annu
al S
alar
y (T
en T
hous
and
JPY)
GovernmentMaleFemale
0
200
400
600
800
1000
1200
24 Y
rs o
r Und
er25
Yrs~
30 Y
rs~
35 Y
rs~
40 Y
rs~
45 Y
rs~
50 Y
rs~
55 Y
rs~
60 Y
rs~
65 Y
rs~
70 Y
rs o
r Ove
rAver
age
Annu
al S
alar
y (T
en T
hous
and
JPY)
OthersMaleFemale
Chapter 1 Summary of Results
14
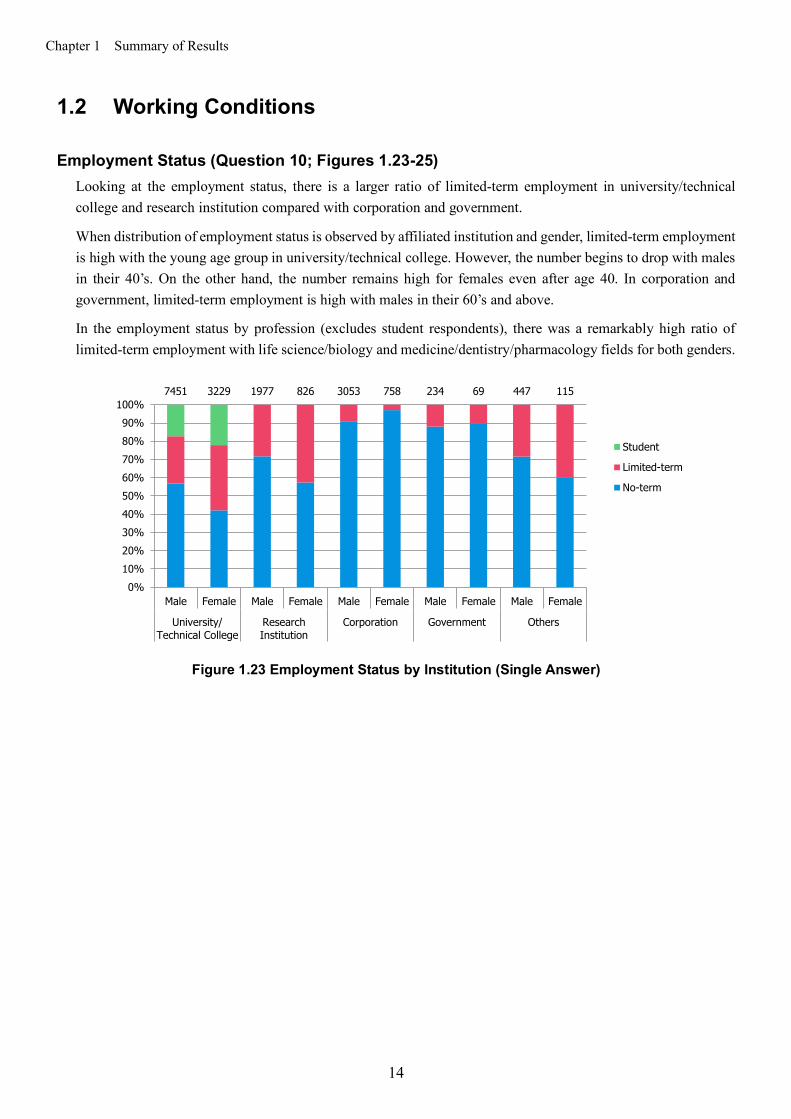
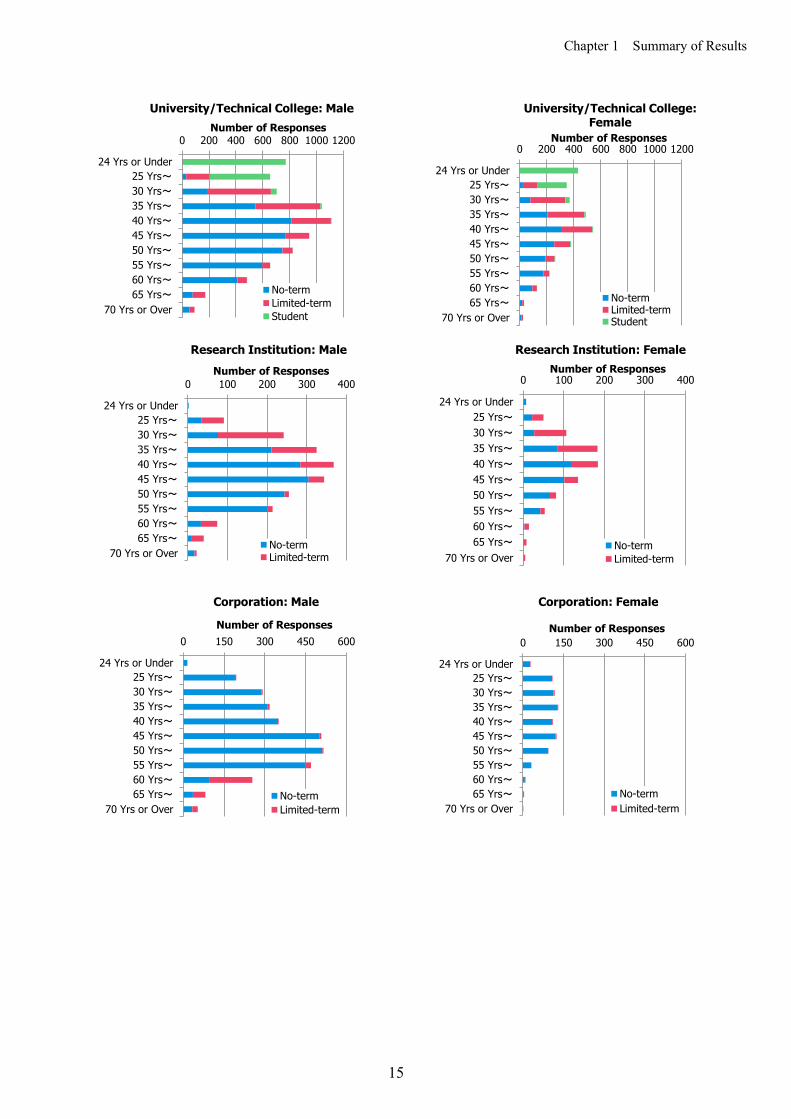
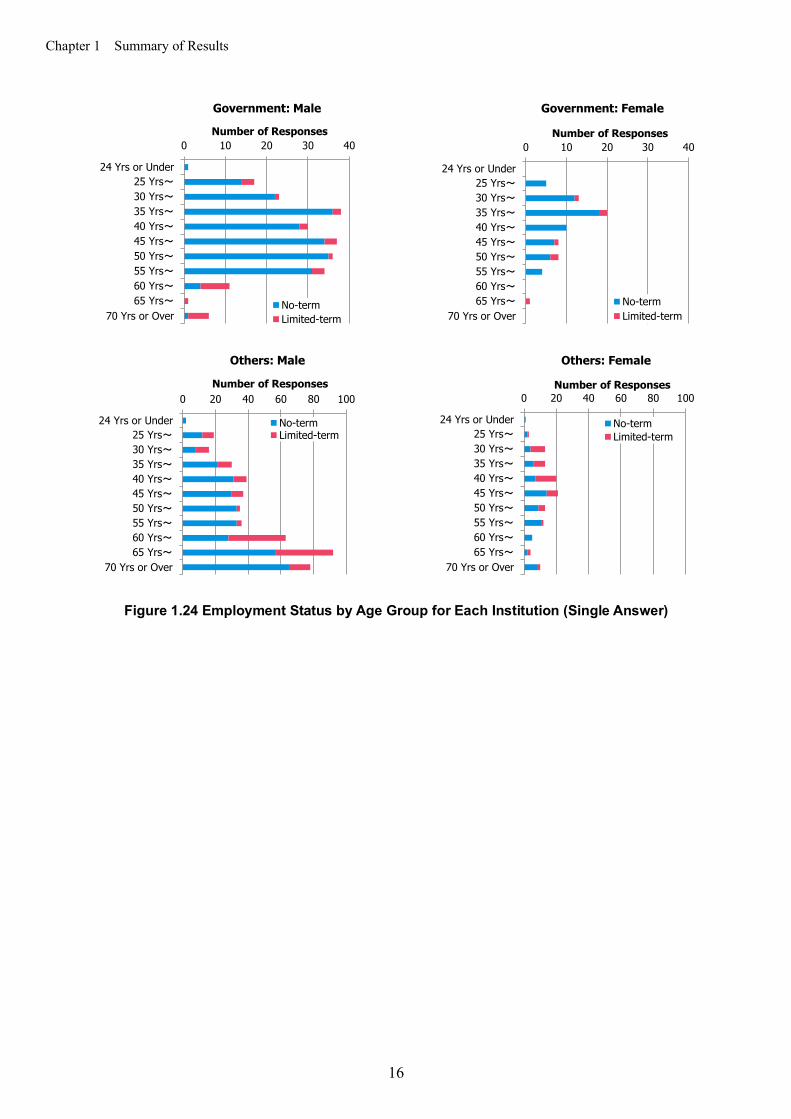
1.2 Working Conditions Employment Status (Question 10; Figures 1.23-25)
Looking at the employment status, there is a larger ratio of limited-term employment in university/technical college and research institution compared with corporation and government.
When distribution of employment status is observed by affiliated institution and gender, limited-term employment is high with the young age group in university/technical college. However, the number begins to drop with males in their 40’s. On the other hand, the number remains high for females even after age 40. In corporation and government, limited-term employment is high with males in their 60’s and above.
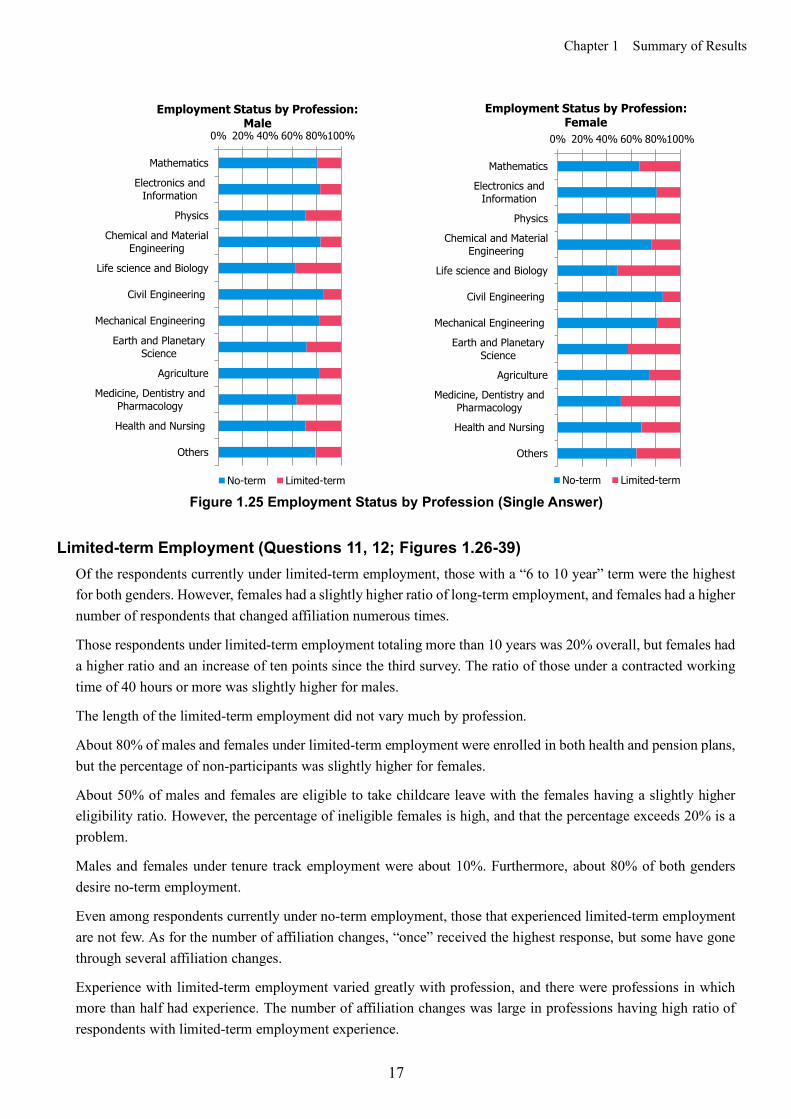
In the employment status by profession (excludes student respondents), there was a remarkably high ratio of limited-term employment with life science/biology and medicine/dentistry/pharmacology fields for both genders.
Figure 1.23 Employment Status by Institution (Single Answer)
7451 3229 1977 826 3053 758 234 69 447 115
0%10%20%30%40%50%60%70%80%90%
100%
Male Female Male Female Male Female Male Female Male Female
University/Technical College
ResearchInstitution
Corporation Government Others
Student
Limited-term
No-term
Chapter 1 Summary of Results
15
0 200 400 600 800 1000 1200
24 Yrs or Under25 Yrs~30 Yrs~35 Yrs~40 Yrs~45 Yrs~50 Yrs~55 Yrs~60 Yrs~65 Yrs~
70 Yrs or Over
Number of ResponsesUniversity/Technical College: Male
No-termLimited-termStudent
0 200 400 600 800 1000 1200
24 Yrs or Under25 Yrs~30 Yrs~35 Yrs~40 Yrs~45 Yrs~50 Yrs~55 Yrs~60 Yrs~65 Yrs~
70 Yrs or Over
Number of Responses
University/Technical College: Female
No-termLimited-termStudent
0 100 200 300 400
24 Yrs or Under25 Yrs~30 Yrs~35 Yrs~40 Yrs~45 Yrs~50 Yrs~55 Yrs~60 Yrs~65 Yrs~
70 Yrs or Over
Number of Responses
Research Institution: Male
No-termLimited-term
0 100 200 300 400
24 Yrs or Under25 Yrs~30 Yrs~35 Yrs~40 Yrs~45 Yrs~50 Yrs~55 Yrs~60 Yrs~65 Yrs~
70 Yrs or Over
Number of ResponsesResearch Institution: Female
No-termLimited-term
0 150 300 450 600
24 Yrs or Under25 Yrs~30 Yrs~35 Yrs~40 Yrs~45 Yrs~50 Yrs~55 Yrs~60 Yrs~65 Yrs~
70 Yrs or Over
Number of Responses
Corporation: Male
No-termLimited-term
0 150 300 450 600
24 Yrs or Under25 Yrs~30 Yrs~35 Yrs~40 Yrs~45 Yrs~50 Yrs~55 Yrs~60 Yrs~65 Yrs~
70 Yrs or Over
Number of Responses
Corporation: Female
No-termLimited-term
Chapter 1 Summary of Results
16
Figure 1.24 Employment Status by Age Group for Each Institution (Single Answer)
0 10 20 30 40
24 Yrs or Under25 Yrs~30 Yrs~35 Yrs~40 Yrs~45 Yrs~50 Yrs~55 Yrs~60 Yrs~65 Yrs~
70 Yrs or Over
Number of Responses
Government: Male
No-termLimited-term
0 10 20 30 40
24 Yrs or Under25 Yrs~30 Yrs~35 Yrs~40 Yrs~45 Yrs~50 Yrs~55 Yrs~60 Yrs~65 Yrs~
70 Yrs or Over
Number of Responses
Government: Female
No-termLimited-term
0 20 40 60 80 100
24 Yrs or Under25 Yrs~30 Yrs~35 Yrs~40 Yrs~45 Yrs~50 Yrs~55 Yrs~60 Yrs~65 Yrs~
70 Yrs or Over
Number of Responses
Others: Male
No-termLimited-term
0 20 40 60 80 100
24 Yrs or Under25 Yrs~30 Yrs~35 Yrs~40 Yrs~45 Yrs~50 Yrs~55 Yrs~60 Yrs~65 Yrs~
70 Yrs or Over
Number of Responses
Others: Female
No-termLimited-term
Chapter 1 Summary of Results
17
Figure 1.25 Employment Status by Profession (Single Answer)
Limited-term Employment (Questions 11, 12; Figures 1.26-39)
Of the respondents currently under limited-term employment, those with a “6 to 10 year” term were the highest for both genders. However, females had a slightly higher ratio of long-term employment, and females had a higher number of respondents that changed affiliation numerous times.
Those respondents under limited-term employment totaling more than 10 years was 20% overall, but females had a higher ratio and an increase of ten points since the third survey. The ratio of those under a contracted working time of 40 hours or more was slightly higher for males.
The length of the limited-term employment did not vary much by profession.
About 80% of males and females under limited-term employment were enrolled in both health and pension plans, but the percentage of non-participants was slightly higher for females.
About 50% of males and females are eligible to take childcare leave with the females having a slightly higher eligibility ratio. However, the percentage of ineligible females is high, and that the percentage exceeds 20% is a problem.
Males and females under tenure track employment were about 10%. Furthermore, about 80% of both genders desire no-term employment.
Even among respondents currently under no-term employment, those that experienced limited-term employment are not few. As for the number of affiliation changes, “once” received the highest response, but some have gone through several affiliation changes.
Experience with limited-term employment varied greatly with profession, and there were professions in which more than half had experience. The number of affiliation changes was large in professions having high ratio of respondents with limited-term employment experience.
0% 20% 40% 60% 80%100%
Mathematics
Electronics andInformation
Physics
Chemical and MaterialEngineering
Life science and Biology
Civil Engineering
Mechanical Engineering
Earth and PlanetaryScience
Agriculture
Medicine, Dentistry andPharmacology
Health and Nursing
Others
Employment Status by Profession: Male
No-term Limited-term
0% 20% 40% 60% 80%100%
Mathematics
Electronics andInformation
Physics
Chemical and MaterialEngineering
Life science and Biology
Civil Engineering
Mechanical Engineering
Earth and PlanetaryScience
Agriculture
Medicine, Dentistry andPharmacology
Health and Nursing
Others
Employment Status by Profession: Female
No-term Limited-term

Chapter 1 Summary of Results
18
Figure 1.26 Term of Current Occupation (Limited-term Employment) (Single Answer)
Figure 1.27 Affiliation Changes (Current: Limited-term Employment) (Single Answer)
Figure 1.28 Total Years as Limited-term Employee (Single Answer)
Figure 1.29 Contract Working Hours per Week (Single Answer)
0% 20% 40% 60% 80% 100%
Male(n=2922)
Female(n=1582)
0 Years1 Year3 Years or Less5 Years or Less10 Years or LessOver 10 YearsUnanswered
0% 20% 40% 60% 80% 100%
Male(n=2925)
Female(n=1582)
0 Times1 Time2 Times3 Times4 or More TimesUnanswered
0% 10% 20% 30% 40% 50% 60% 70% 80% 90% 100%
Male(n=2922)
Female(n=1582)
0 Years1 Year3 Years or Less5 Years or Less10 Years or LessOver 10 YearsUnanswered
0% 20% 40% 60% 80% 100%
Male(n=2923)
Female(n=1580)
Under 10 Hrs10 Hrs〜20 Hrs〜30 Hrs〜40 Hrs〜Unanswered

Chapter 1 Summary of Results
19
Figure 1.30 Length of Limited-term Employment by Profession (Single Answer)
Figure 1.31 Affiliation Changes by Profession (Single Answer)
Figure 1.32 Social Security (Single Answer)
0% 10% 20% 30% 40% 50% 60% 70% 80% 90% 100%
Mathematics
Electronics and Information
Physics
Chemical and MaterialEngineering
Life science and Biology
Civil Engineering
Mechanical Engineering
Earth and Planetary Science
Agriculture
Medicine, Dentistry andPharmacologyHealth and Nursing
Others
0 Years
1 Year
2 Years
3 Years
4 Years
5 Years
6 Years
7 Years
8 Years
9 Years
10 Years or More
Unanswered
0% 10% 20% 30% 40% 50% 60% 70% 80% 90% 100%
Mathematics
Electronics and Information
Physics
Chemical and MaterialEngineering
Life science and Biology
Civil Engineering
Mechanical Engineering
Earth and Planetary Science
Agriculture
Medicine, Dentistry andPharmacology
Health and Nursing
Others
0 Times1 Time2 Times3 Times4 or More TimesUnanswered
0% 20% 40% 60% 80% 100%
Male(n=2874)
Female(n=1569)
BothNeitherHealth Plan OnlyPension Plan OnlyUnsure

Chapter 1 Summary of Results
20
Figure 1.33 Provision for Childcare Leave (Single Answer)
Figure 1.34 Tenure Track Job (Single Answer)
Figure 1.35 Desire for No-term Employment (Single Answer)
Figure 1.36 Length of Limited-term Employment (Current: No-term Employment) (Single Answer)
Figure 1.37 Affiliation Changes (Current: No-term Employment) (Single Answer)
0% 20% 40% 60% 80% 100%
Male(n=2845)
Female(n=1562)
YesNoUnsure
0% 20% 40% 60% 80% 100%
Male(n=2859)
Female(n=1555)
YesNoUnsure
0% 20% 40% 60% 80% 100%
Male(n=2866)
Female(n=1568)
YesNoUnsure
0% 20% 40% 60% 80% 100%
Male(n=8953)
Female(n=2702)
0 Years1 Year2~3 Years4~5 Years6~10 YearsOver 10 YearsUnanswered
0% 20% 40% 60% 80% 100%
Male(n=8948)
Female(n=2702)
0 Times1 Time2 Times3 Times4 or More TimesUnanswered
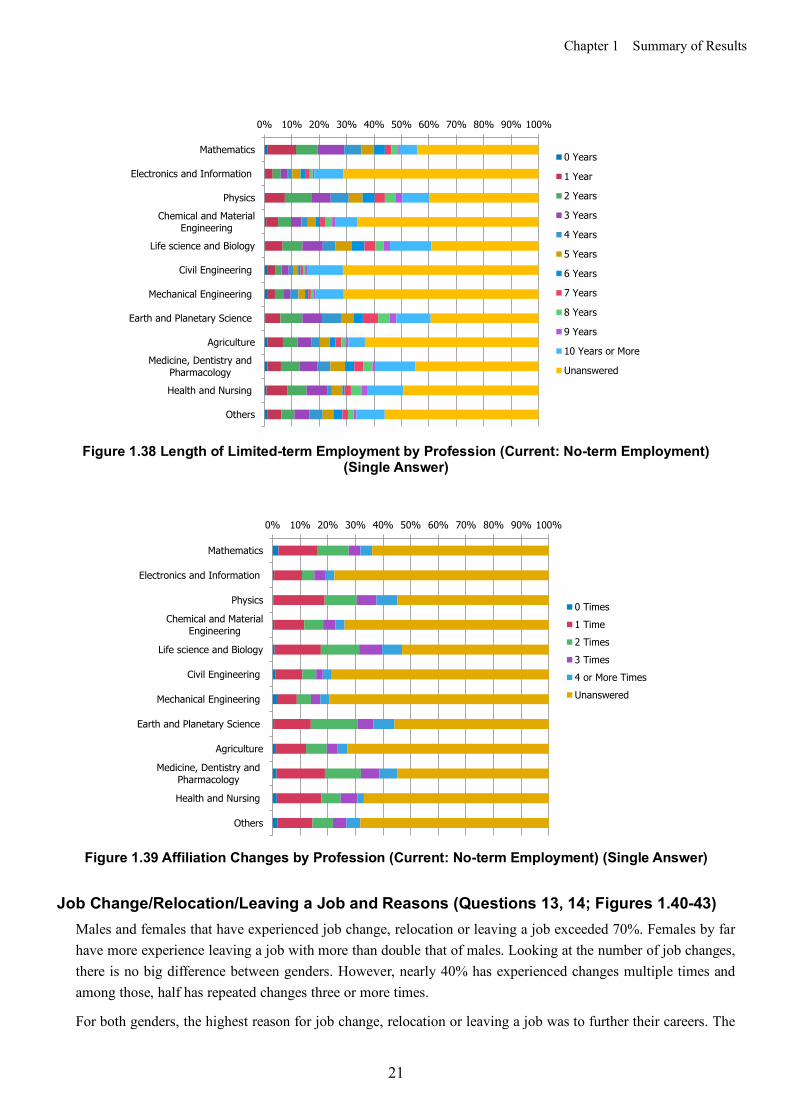
Chapter 1 Summary of Results
21
Figure 1.38 Length of Limited-term Employment by Profession (Current: No-term Employment)
(Single Answer)
Figure 1.39 Affiliation Changes by Profession (Current: No-term Employment) (Single Answer)
Job Change/Relocation/Leaving a Job and Reasons (Questions 13, 14; Figures 1.40-43)
Males and females that have experienced job change, relocation or leaving a job exceeded 70%. Females by far have more experience leaving a job with more than double that of males. Looking at the number of job changes, there is no big difference between genders. However, nearly 40% has experienced changes multiple times and among those, half has repeated changes three or more times.
For both genders, the highest reason for job change, relocation or leaving a job was to further their careers. The
0% 10% 20% 30% 40% 50% 60% 70% 80% 90% 100%
Mathematics
Electronics and Information
Physics
Chemical and MaterialEngineering
Life science and Biology
Civil Engineering
Mechanical Engineering
Earth and Planetary Science
Agriculture
Medicine, Dentistry andPharmacologyHealth and Nursing
Others
0 Years
1 Year
2 Years
3 Years
4 Years
5 Years
6 Years
7 Years
8 Years
9 Years
10 Years or More
Unanswered
0% 10% 20% 30% 40% 50% 60% 70% 80% 90% 100%
Mathematics
Electronics and Information
Physics
Chemical and MaterialEngineering
Life science and Biology
Civil Engineering
Mechanical Engineering
Earth and Planetary Science
Agriculture
Medicine, Dentistry andPharmacology
Health and Nursing
Others
0 Times1 Time2 Times3 Times4 or More TimesUnanswered
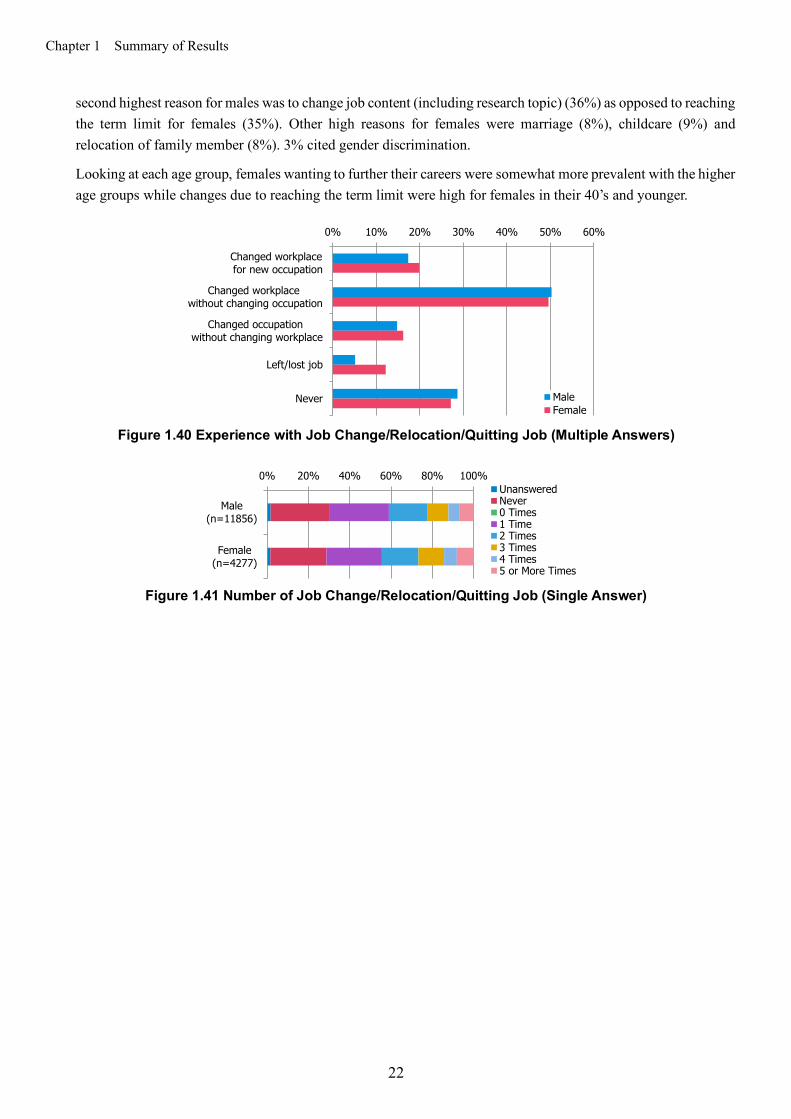
Chapter 1 Summary of Results
22
second highest reason for males was to change job content (including research topic) (36%) as opposed to reaching the term limit for females (35%). Other high reasons for females were marriage (8%), childcare (9%) and relocation of family member (8%). 3% cited gender discrimination.
Looking at each age group, females wanting to further their careers were somewhat more prevalent with the higher age groups while changes due to reaching the term limit were high for females in their 40’s and younger.
Figure 1.40 Experience with Job Change/Relocation/Quitting Job (Multiple Answers)
Figure 1.41 Number of Job Change/Relocation/Quitting Job (Single Answer)
0% 10% 20% 30% 40% 50% 60%
Changed workplace for new occupation
Changed workplace without changing occupation
Changed occupation without changing workplace
Left/lost job
Never MaleFemale
0% 20% 40% 60% 80% 100%
Male(n=11856)
Female(n=4277)
UnansweredNever0 Times1 Time2 Times3 Times4 Times5 or More Times

Chapter 1 Summary of Results
23
Figure 1.42 Reasons for Job Change/Relocation/Quitting Job (Multiple Answers)
0% 10% 20% 30% 40% 50% 60%
Further my career
Change in job content (or research topic)
Better income
Avoid relocation required by employer
Job relocation of family member
Workplace location
End of contract
Marriage
Caring for children
Caring for sick family member
Concern for future
Gender discrimination
Difficulty with personal relations
Unhappy with previous workplace
Laid-off or dismissed
Bankruptcy
OthersMaleFemale

Chapter 1 Summary of Results
24
Figure 1.43 Reasons for Job Change/Quitting Job by Age Group (Multiple Answers)
0%
10%
20%
30%
40%
50%
60%24
Yrs
or U
nder
25 Y
rs~
30 Y
rs~
35 Y
rs~
40 Y
rs~
45 Y
rs~
50 Y
rs~
55 Y
rs~
60 Y
rs~
65 Y
rs~
70 Y
rsor
Ove
r
Male
Further my career
Change in job content(or research topic)Better income
Avoid relocationrequired by employerJob relocation of familymemberWorkplace location
End of contract
Marriage
Caring for children
Caring for sick familymemberConcern for future
Gender discrimination
Difficulty with personalrelationsUnhappy with previousworkplaceLaid-off or dismissed
Bankruptcy
Others
n=1 n=151 n=756 n=1316 n=1467 n=1287 n=1129 n=1016 n=662 n=304 n=194
0%
10%
20%
30%
40%
50%
60%
24 Y
rsor
Und
er
25 Y
rs~
30 Y
rs~
35 Y
rs~
40 Y
rs~
45 Y
rs~
50 Y
rs~
55 Y
rs~
60 Y
rs~
65 Y
rs~
70 Y
rsor
Ove
r
Female
Further my career
Change in job content(or research topic)Better income
Avoid relocationrequired by employerJob relocation of familymemberWorkplace location
End of contract
Marriage
Caring for children
Caring for sick familymemberConcern for future
Gender discrimination
Difficulty with personalrelationsUnhappy with previousworkplaceLaid-off or dismissed
Bankruptcy
Others
n=2 n=78 n=392 n=615 n=679 n=514 n=345 n=253 n=111 n=41 n=32
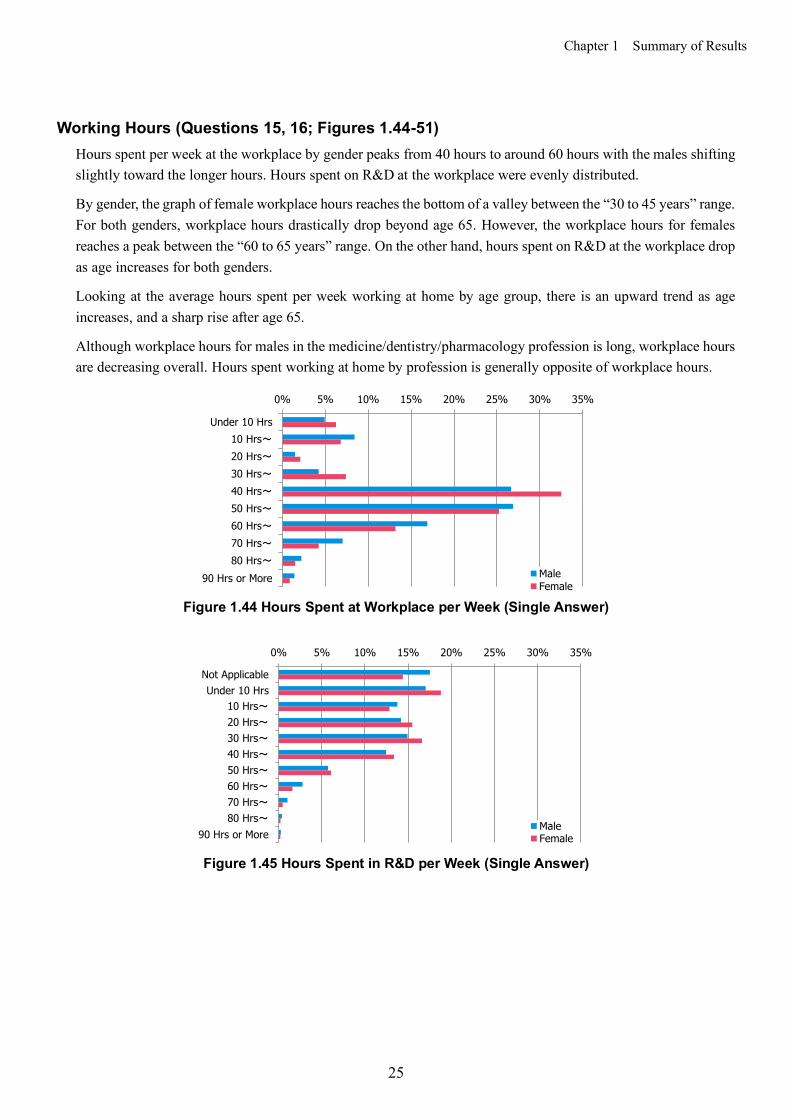
Chapter 1 Summary of Results
25
Working Hours (Questions 15, 16; Figures 1.44-51)
Hours spent per week at the workplace by gender peaks from 40 hours to around 60 hours with the males shifting slightly toward the longer hours. Hours spent on R&D at the workplace were evenly distributed.
By gender, the graph of female workplace hours reaches the bottom of a valley between the “30 to 45 years” range. For both genders, workplace hours drastically drop beyond age 65. However, the workplace hours for females reaches a peak between the “60 to 65 years” range. On the other hand, hours spent on R&D at the workplace drop as age increases for both genders.
Looking at the average hours spent per week working at home by age group, there is an upward trend as age increases, and a sharp rise after age 65.
Although workplace hours for males in the medicine/dentistry/pharmacology profession is long, workplace hours are decreasing overall. Hours spent working at home by profession is generally opposite of workplace hours.
Figure 1.44 Hours Spent at Workplace per Week (Single Answer)
Figure 1.45 Hours Spent in R&D per Week (Single Answer)
0% 5% 10% 15% 20% 25% 30% 35%
Under 10 Hrs10 Hrs〜20 Hrs〜30 Hrs〜40 Hrs〜50 Hrs〜60 Hrs〜70 Hrs〜80 Hrs〜
90 Hrs or More MaleFemale
0% 5% 10% 15% 20% 25% 30% 35%
Not ApplicableUnder 10 Hrs
10 Hrs〜20 Hrs〜30 Hrs〜40 Hrs〜50 Hrs〜60 Hrs〜70 Hrs〜80 Hrs〜
90 Hrs or MoreMaleFemale
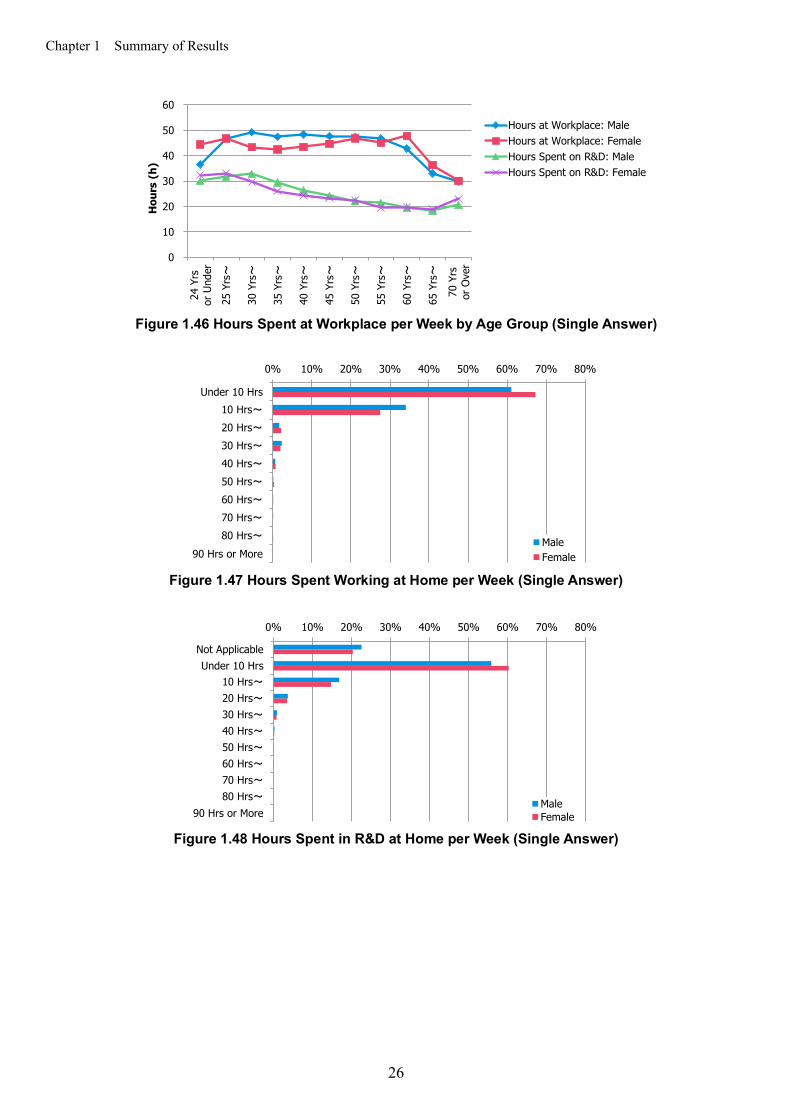
Chapter 1 Summary of Results
26
Figure 1.46 Hours Spent at Workplace per Week by Age Group (Single Answer)
Figure 1.47 Hours Spent Working at Home per Week (Single Answer)
Figure 1.48 Hours Spent in R&D at Home per Week (Single Answer)
0
10
20
30
40
50
60
24 Y
rsor
Und
er25
Yrs~
30 Y
rs~
35 Y
rs~
40 Y
rs~
45 Y
rs~
50 Y
rs~
55 Y
rs~
60 Y
rs~
65 Y
rs~
70 Y
rsor
Ove
r
Hou
rs (
h)
Hours at Workplace: MaleHours at Workplace: FemaleHours Spent on R&D: MaleHours Spent on R&D: Female
0% 10% 20% 30% 40% 50% 60% 70% 80%
Under 10 Hrs10 Hrs〜20 Hrs〜30 Hrs〜40 Hrs〜50 Hrs〜60 Hrs〜70 Hrs〜80 Hrs〜
90 Hrs or MoreMaleFemale
0% 10% 20% 30% 40% 50% 60% 70% 80%
Not ApplicableUnder 10 Hrs
10 Hrs〜20 Hrs〜30 Hrs〜40 Hrs〜50 Hrs〜60 Hrs〜70 Hrs〜80 Hrs〜
90 Hrs or MoreMaleFemale
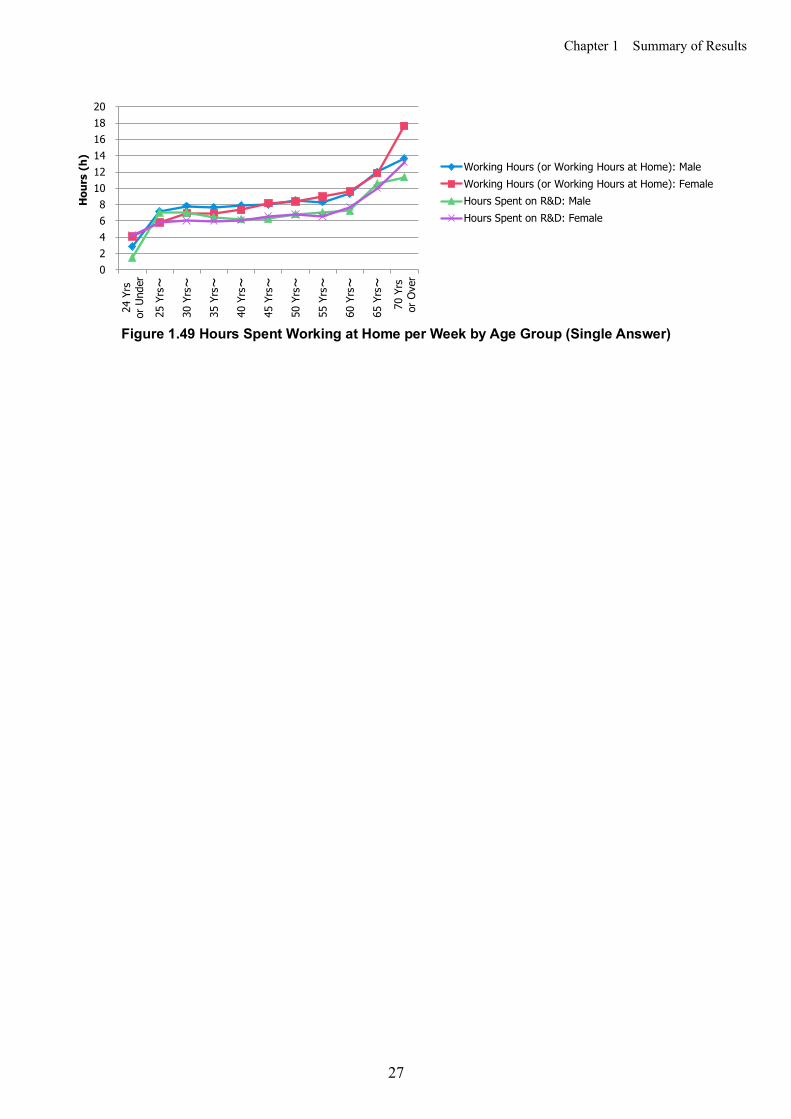
Chapter 1 Summary of Results
27
Figure 1.49 Hours Spent Working at Home per Week by Age Group (Single Answer)
02468
101214161820
24 Y
rsor
Und
er
25 Y
rs~
30 Y
rs~
35 Y
rs~
40 Y
rs~
45 Y
rs~
50 Y
rs~
55 Y
rs~
60 Y
rs~
65 Y
rs~
70 Y
rsor
Ove
r
Hou
rs (
h) Working Hours (or Working Hours at Home): MaleWorking Hours (or Working Hours at Home): FemaleHours Spent on R&D: MaleHours Spent on R&D: Female
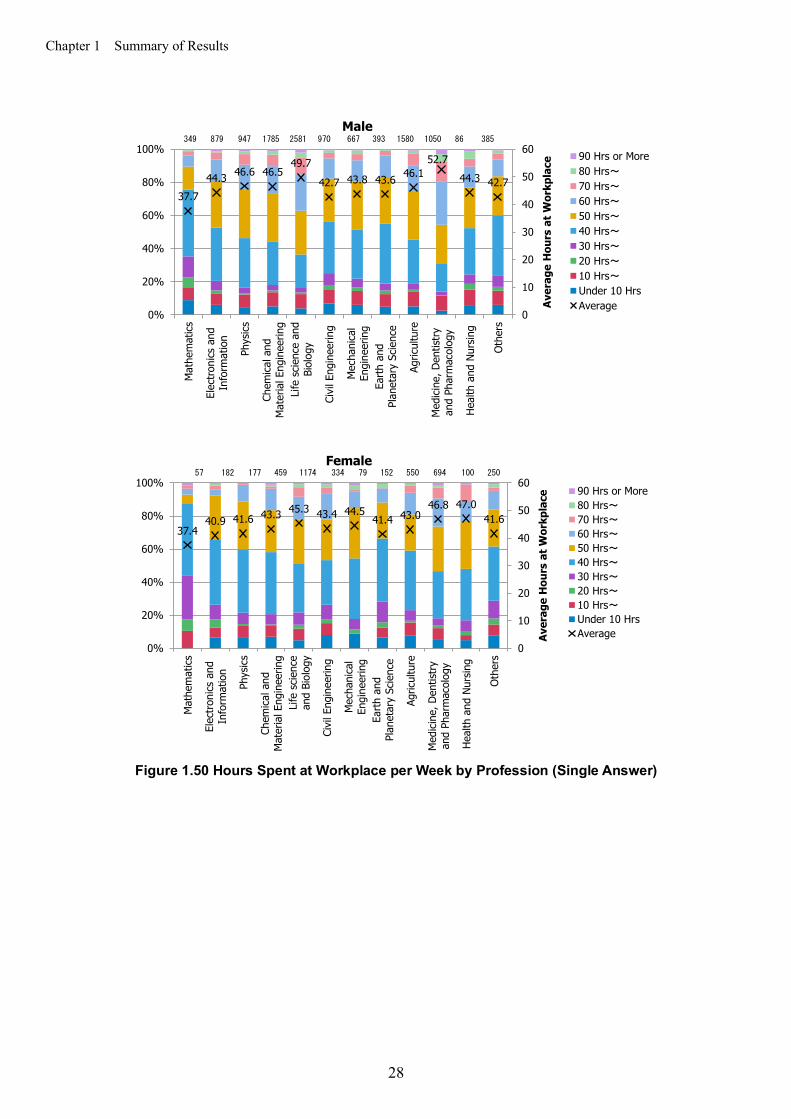
Chapter 1 Summary of Results
28
Figure 1.50 Hours Spent at Workplace per Week by Profession (Single Answer)
37.7 44.3 46.6 46.5
49.7
42.7 43.8 43.6 46.1 52.7
44.3 42.7
0
10
20
30
40
50
60
0%
20%
40%
60%
80%
100%
Mat
hem
atics
Elec
troni
cs a
ndIn
form
atio
n
Phys
ics
Chem
ical a
ndM
ater
ial E
ngin
eerin
gLi
fe s
cienc
e an
dBi
olog
y
Civi
l Eng
inee
ring
Mec
hani
cal
Engi
neer
ing
Earth
and
Plan
etar
y Sc
ienc
e
Agric
ultu
re
Med
icine
, Den
tistry
and
Phar
mac
olog
y
Heal
th a
nd N
ursin
g
Othe
rs
Aver
age
Hou
rs a
t Wor
kpla
ce
Male
90 Hrs or More80 Hrs〜70 Hrs〜60 Hrs〜50 Hrs〜40 Hrs〜30 Hrs〜20 Hrs〜10 Hrs〜Under 10 HrsAverage
349 879 947 1785 2581 970 667 393 1580 1050 86 385
37.4 40.9 41.6 43.3 45.3 43.4 44.5
41.4 43.0 46.8 47.0
41.6
0
10
20
30
40
50
60
0%
20%
40%
60%
80%
100%
Mat
hem
atics
Elec
troni
cs a
ndIn
form
atio
n
Phys
ics
Chem
ical a
ndM
ater
ial E
ngin
eerin
gLi
fe s
cienc
ean
d Bi
olog
y
Civi
l Eng
inee
ring
Mec
hani
cal
Engi
neer
ing
Earth
and
Plan
etar
y Sc
ienc
e
Agric
ultu
re
Med
icine
, Den
tistry
and
Phar
mac
olog
y
Heal
th a
nd N
ursin
g
Othe
rs
Aver
age
Hou
rs a
t Wor
kpla
ce
Female
90 Hrs or More80 Hrs〜70 Hrs〜60 Hrs〜50 Hrs〜40 Hrs〜30 Hrs〜20 Hrs〜10 Hrs〜Under 10 HrsAverage
57 182 177 459 1174 334 79 152 550 694 100 250

Chapter 1 Summary of Results
29
Figure 1.51 Hours Spent Working at Home per Week by Profession (Single Answer)
Career Goals (Question 17; Figures 1.52-54)
For both males and females, the desire for a R&D job was overwhelming, and most respondents desired research positions at universities and research institutions. Males were more likely than females to desire supervising laboratories or R&D.
By occupational field, there was no big difference in the tendency for both genders to desire research work at universities.
The respondents’ desire for research work at a university depends considerably on their profession. For both genders, fields in which the desire exceeded 50% were basic research and medicine.
14.4 9.9
9.1 7.9 7.8 8.3 8.2 8.7
7.6 7.5 8.1 7.6
0
3
6
9
12
15
0%
20%
40%
60%
80%
100%
Mat
hem
atics
Elec
troni
cs a
ndIn
form
atio
n
Phys
ics
Chem
ical a
ndM
ater
ial E
ngin
eerin
gLi
fe s
cienc
ean
d Bi
olog
y
Civi
l Eng
inee
ring
Mec
hani
cal
Engi
neer
ing
Earth
and
Plan
etar
y Sc
ienc
e
Agric
ultu
re
Med
icine
, Den
tistry
and
Phar
mac
olog
y
Heal
th a
nd N
ursin
g
Othe
rs Aver
age
Hou
rs W
okin
g at
Hom
e
Male
90 Hrs or More80 Hrs〜70 Hrs〜60 Hrs〜50 Hrs〜40 Hrs〜30 Hrs〜20 Hrs〜10 Hrs〜Under 10 HrsAverage
305 535 723 1128 1906 440 372 319 1022 740 69 215
13.2 10.9
8.3 7.1 7.7
9.3
5.5
8.1 7.0 6.9 7.6
9.0
0
3
6
9
12
15
0%
20%
40%
60%
80%
100%
Mat
hem
atics
Elec
troni
cs a
ndIn
form
atio
n
Phys
ics
Chem
ical a
ndM
ater
ial E
ngin
eerin
gLi
fe s
cienc
ean
d Bi
olog
y
Civi
l Eng
inee
ring
Mec
hani
cal
Engi
neer
ing
Earth
and
Plan
etar
y Sc
ienc
e
Agric
ultu
re
Med
icine
, Den
tistry
and
Phar
mac
olog
y
Heal
th a
nd N
ursin
g
Othe
rs Aver
age
Hou
rs W
okin
g at
Hom
e
Female
90 Hrs or More80 Hrs〜70 Hrs〜60 Hrs〜50 Hrs〜40 Hrs〜30 Hrs〜20 Hrs〜10 Hrs〜Under 10 HrsAverage
50 110 143 282 854 195 45 122 346 520 73 165
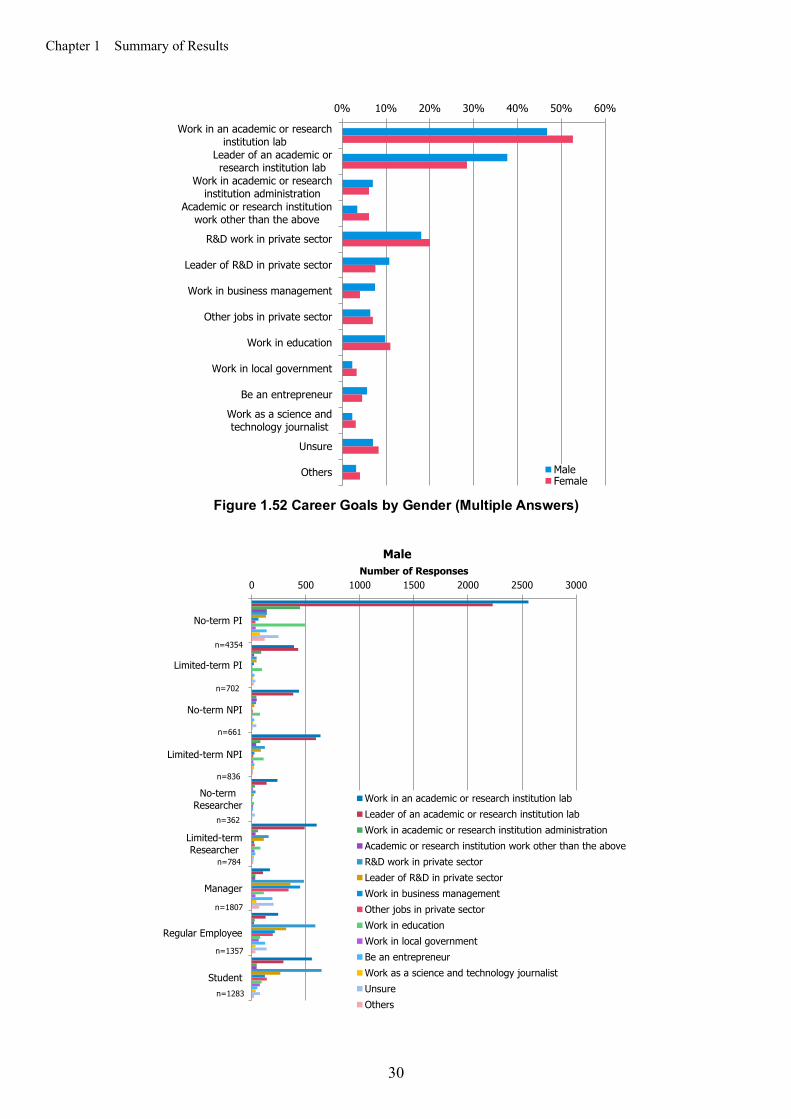
Chapter 1 Summary of Results
30
Figure 1.52 Career Goals by Gender (Multiple Answers)
0% 10% 20% 30% 40% 50% 60%
Work in an academic or researchinstitution lab
Leader of an academic orresearch institution lab
Work in academic or researchinstitution administration
Academic or research institutionwork other than the above
R&D work in private sector
Leader of R&D in private sector
Work in business management
Other jobs in private sector
Work in education
Work in local government
Be an entrepreneur
Work as a science andtechnology journalist
Unsure
Others MaleFemale
0 500 1000 1500 2000 2500 3000
No-term PI
Limited-term PI
No-term NPI
Limited-term NPI
No-termResearcher
Limited-termResearcher
Manager
Regular Employee
Student
Number of ResponsesMale
Work in an academic or research institution labLeader of an academic or research institution labWork in academic or research institution administrationAcademic or research institution work other than the aboveR&D work in private sectorLeader of R&D in private sectorWork in business managementOther jobs in private sectorWork in educationWork in local governmentBe an entrepreneurWork as a science and technology journalistUnsureOthers
n=4354
n=702
n=661
n=836
n=362
n=784
n=1807
n=1357
n=1283

Chapter 1 Summary of Results
31
Figure 1.53 Career Goals by Occupational Field (Multiple Answers) Male/Female
0 150 300 450 600 750 900
No-term PI
Limited-term PI
No-term NPI
Limited-term NPI
No-term Researcher
Limited-termResearcher
Manager
Regular Employee
Student
Number of ResponsesFemale
Work in an academic or research institutionlabLeader of an academic or researchinstitution labWork in academic or research institutionadministrationAcademic or research institution work otherthan the aboveR&D work in private sector
Leader of R&D in private sector
Work in business management
Other jobs in private sector
Work in education
Work in local government
Be an entrepreneur
Work as a science and technology journalist
Unsure
Others
n=1275
n=257
n=329
n=548
n=151
n=555
n=202
n=603
n=713

Chapter 1 Summary of Results
32
0 200 400 600 800 1000 1200 1400 1600 1800
Mathematics
Electronics and Information
Physics
Chemical and MaterialEngineering
Life science and Biology
Civil Engineering
Mechanical Engineering
Earth and Planetary Science
Agriculture
Medicine, Dentistry andPharmacology
Health and Nursing
Others
Number of Responses
Male
Work in an academic or research institution labLeader of an academic or research institution labWork in academic or research institution administrationAcademic or research institution work other than the aboveR&D work in private sectorLeader of R&D in private sectorWork in business managementOther jobs in private sectorWork in educationWork in local governmentBe an entrepreneurWork as a science and technology journalistUnsureOthers
n=358
n=900
n=961
n=1821
n=2616
n=990
n=680
n=397
n=1601
n=1064
n=86
n=405
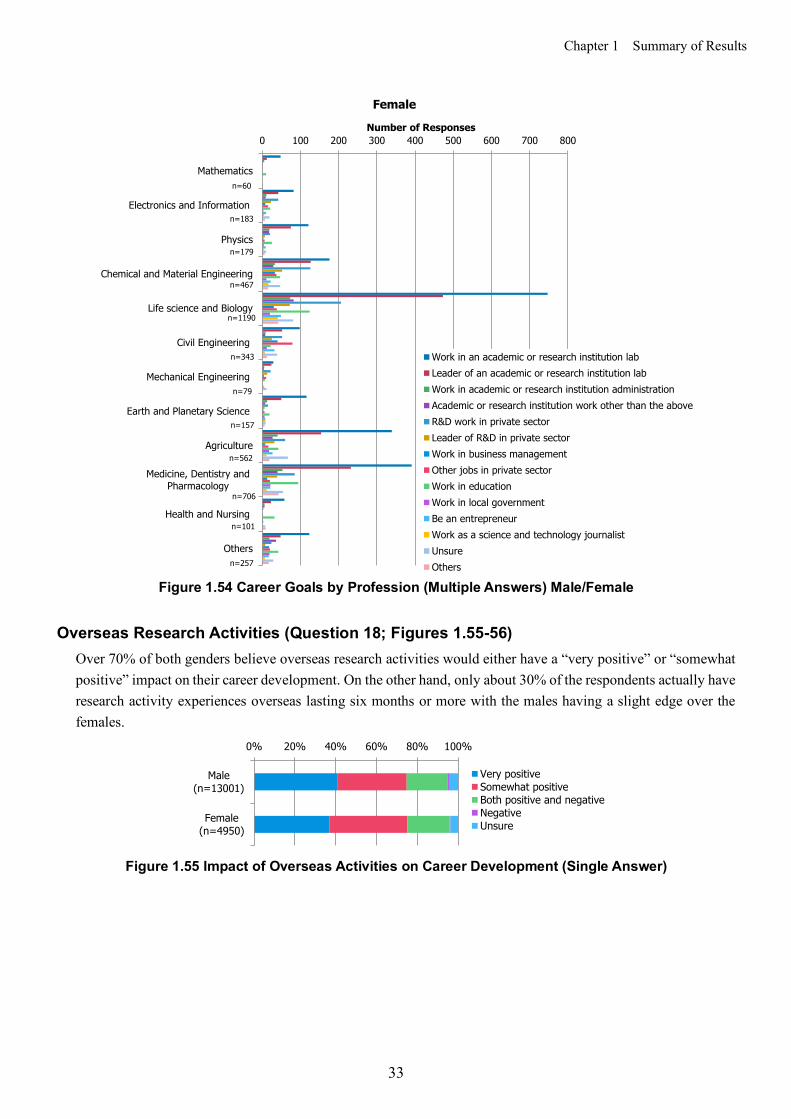
Chapter 1 Summary of Results
33
Figure 1.54 Career Goals by Profession (Multiple Answers) Male/Female
Overseas Research Activities (Question 18; Figures 1.55-56)
Over 70% of both genders believe overseas research activities would either have a “very positive” or “somewhat positive” impact on their career development. On the other hand, only about 30% of the respondents actually have research activity experiences overseas lasting six months or more with the males having a slight edge over the females.
Figure 1.55 Impact of Overseas Activities on Career Development (Single Answer)
0 100 200 300 400 500 600 700 800
Mathematics
Electronics and Information
Physics
Chemical and Material Engineering
Life science and Biology
Civil Engineering
Mechanical Engineering
Earth and Planetary Science
Agriculture
Medicine, Dentistry andPharmacology
Health and Nursing
Others
Number of Responses
Female
Work in an academic or research institution labLeader of an academic or research institution labWork in academic or research institution administrationAcademic or research institution work other than the aboveR&D work in private sectorLeader of R&D in private sectorWork in business managementOther jobs in private sectorWork in educationWork in local governmentBe an entrepreneurWork as a science and technology journalistUnsureOthers
n=60
n=183
n=179
n=467
n=1190
n=343
n=79
n=157
n=562
n=706
n=101
n=257
0% 20% 40% 60% 80% 100%
Male(n=13001)
Female(n=4950)
Very positiveSomewhat positiveBoth positive and negativeNegativeUnsure
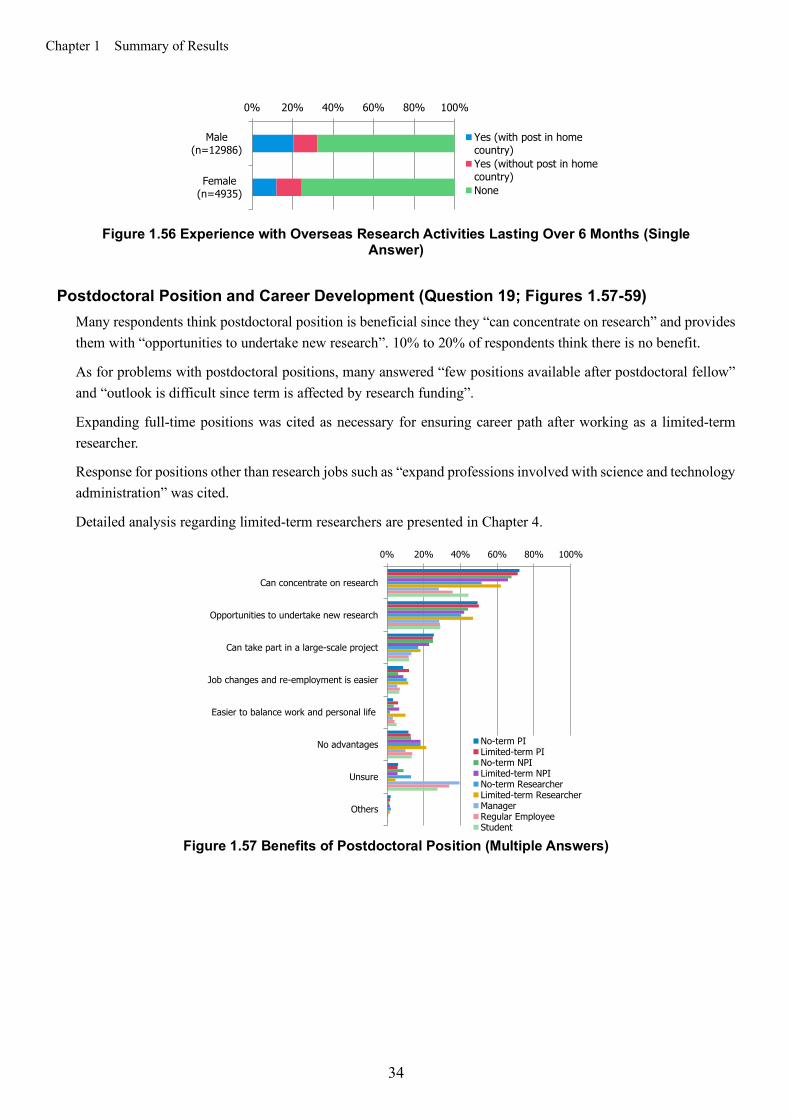
Chapter 1 Summary of Results
34
Figure 1.56 Experience with Overseas Research Activities Lasting Over 6 Months (Single
Answer) Postdoctoral Position and Career Development (Question 19; Figures 1.57-59)
Many respondents think postdoctoral position is beneficial since they “can concentrate on research” and provides them with “opportunities to undertake new research”. 10% to 20% of respondents think there is no benefit.
As for problems with postdoctoral positions, many answered “few positions available after postdoctoral fellow” and “outlook is difficult since term is affected by research funding”.
Expanding full-time positions was cited as necessary for ensuring career path after working as a limited-term researcher.
Response for positions other than research jobs such as “expand professions involved with science and technology administration” was cited.
Detailed analysis regarding limited-term researchers are presented in Chapter 4.
Figure 1.57 Benefits of Postdoctoral Position (Multiple Answers)
0% 20% 40% 60% 80% 100%
Male(n=12986)
Female(n=4935)
Yes (with post in homecountry)Yes (without post in homecountry)None
0% 20% 40% 60% 80% 100%
Can concentrate on research
Opportunities to undertake new research
Can take part in a large-scale project
Job changes and re-employment is easier
Easier to balance work and personal life
No advantages
Unsure
Others
No-term PILimited-term PINo-term NPILimited-term NPINo-term ResearcherLimited-term ResearcherManagerRegular EmployeeStudent
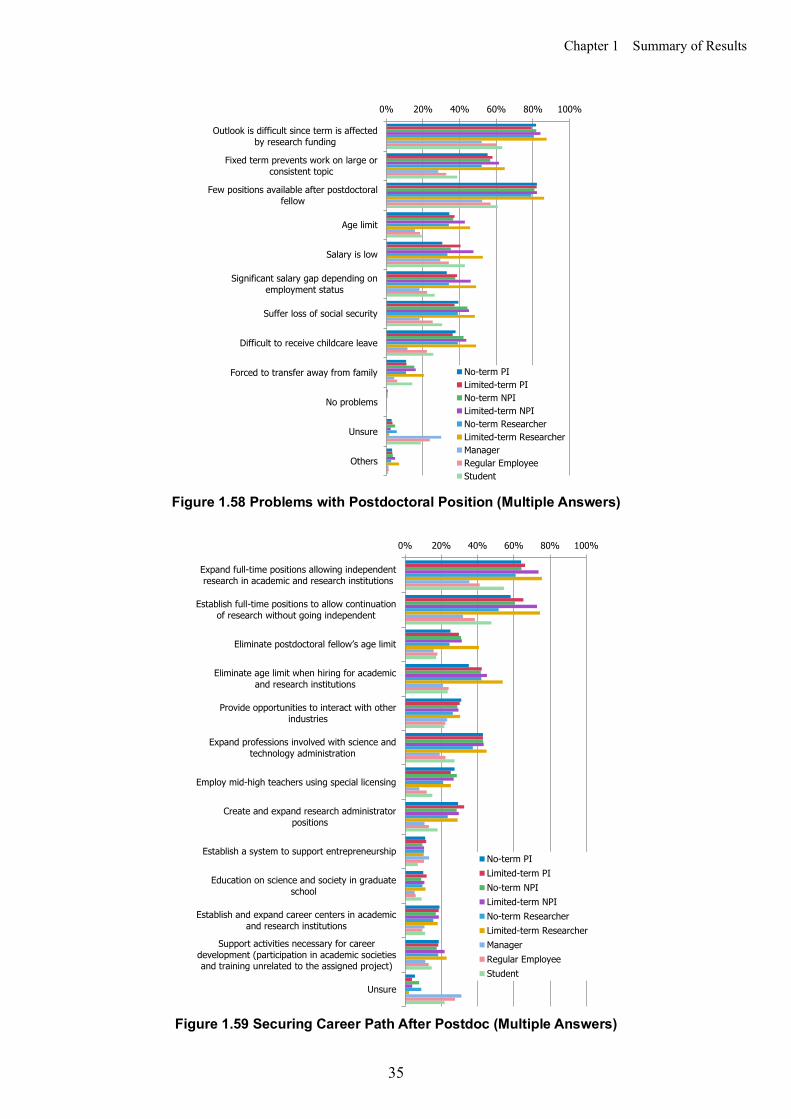
Chapter 1 Summary of Results
35
Figure 1.58 Problems with Postdoctoral Position (Multiple Answers)
Figure 1.59 Securing Career Path After Postdoc (Multiple Answers)
0% 20% 40% 60% 80% 100%
Outlook is difficult since term is affectedby research funding
Fixed term prevents work on large orconsistent topic
Few positions available after postdoctoralfellow
Age limit
Salary is low
Significant salary gap depending onemployment status
Suffer loss of social security
Difficult to receive childcare leave
Forced to transfer away from family
No problems
Unsure
Others
No-term PILimited-term PINo-term NPILimited-term NPINo-term ResearcherLimited-term ResearcherManagerRegular EmployeeStudent
0% 20% 40% 60% 80% 100%
Expand full-time positions allowing independentresearch in academic and research institutions
Establish full-time positions to allow continuationof research without going independent
Eliminate postdoctoral fellow’s age limit
Eliminate age limit when hiring for academicand research institutions
Provide opportunities to interact with otherindustries
Expand professions involved with science andtechnology administration
Employ mid-high teachers using special licensing
Create and expand research administratorpositions
Establish a system to support entrepreneurship
Education on science and society in graduateschool
Establish and expand career centers in academicand research institutions
Support activities necessary for careerdevelopment (participation in academic societiesand training unrelated to the assigned project)
Unsure
No-term PILimited-term PINo-term NPILimited-term NPINo-term ResearcherLimited-term ResearcherManagerRegular EmployeeStudent

Chapter 1 Summary of Results
36
1.3 Work and Family Marital Status (Questions 20, 21, 22, 23; Figures 1.60-74)
For the younger age groups, there is almost no difference between genders in the ratio of respondents with spouses, but gender differences begin to appear starting in the late 30’s.
More than half of the males’ spouses are unemployed, but over 98% of females’ spouses are employed.
Males have a higher ratio of spouses with limited-term employment.
About 28% of males and 50% of females have experience living separately from their spouses.
Figure 1.60 Marital Status (Single Answer)
0% 20% 40% 60% 80% 100%
Male(n=13162)
Female(n=4997)
MarriedUnmarried
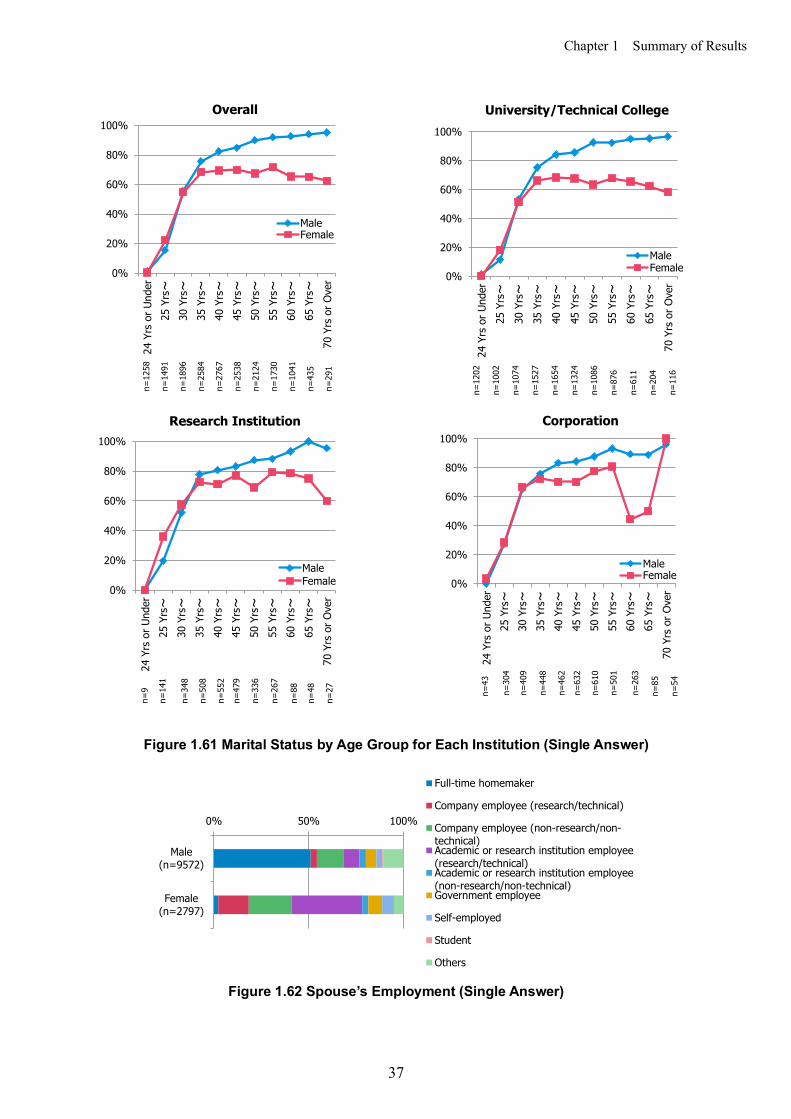
Chapter 1 Summary of Results
37
Figure 1.61 Marital Status by Age Group for Each Institution (Single Answer)
Figure 1.62 Spouse’s Employment (Single Answer)
0%
20%
40%
60%
80%
100%
24 Y
rs o
r Und
er25
Yrs~
30 Y
rs~
35 Y
rs~
40 Y
rs~
45 Y
rs~
50 Y
rs~
55 Y
rs~
60 Y
rs~
65 Y
rs~
70 Y
rs o
r Ove
r
Overall
MaleFemale
n=18
96
n=27
67
n=21
24
n=10
41
n=14
91
n=25
84
n=25
38
n=17
30
n=43
5
n=12
58
n=29
1
0%
20%
40%
60%
80%
100%
24 Y
rs o
r Und
er25
Yrs~
30 Y
rs~
35 Y
rs~
40 Y
rs~
45 Y
rs~
50 Y
rs~
55 Y
rs~
60 Y
rs~
65 Y
rs~
70 Y
rs o
r Ove
r
University/Technical College
MaleFemale
n=12
02
n=10
02
n=10
74
n=15
27
n=16
54
n=13
24
n=10
86
n=87
6
n=61
1
n=20
4
n=11
6
0%
20%
40%
60%
80%
100%
24 Y
rs o
r Und
er25
Yrs~
30 Y
rs~
35 Y
rs~
40 Y
rs~
45 Y
rs~
50 Y
rs~
55 Y
rs~
60 Y
rs~
65 Y
rs~
70 Y
rs o
r Ove
r
Research Institution
MaleFemale
n=9
n=14
1
n=34
8
n=50
8
n=55
2
n=47
9
n=33
6
n=26
7
n=88
n=48
n=27
0%
20%
40%
60%
80%
100%
24 Y
rs o
r Und
er25
Yrs~
30 Y
rs~
35 Y
rs~
40 Y
rs~
45 Y
rs~
50 Y
rs~
55 Y
rs~
60 Y
rs~
65 Y
rs~
70 Y
rs o
r Ove
r
Corporation
MaleFemale
n=43
n=30
4
n=40
9
n=44
8
n=46
2
n=63
2
n=61
0
n=50
1
n=26
3
n=85
n=54
0% 50% 100%
Male(n=9572)
Female(n=2797)
Full-time homemaker
Company employee (research/technical)
Company employee (non-research/non-technical)Academic or research institution employee(research/technical)Academic or research institution employee(non-research/non-technical)Government employee
Self-employed
Student
Others
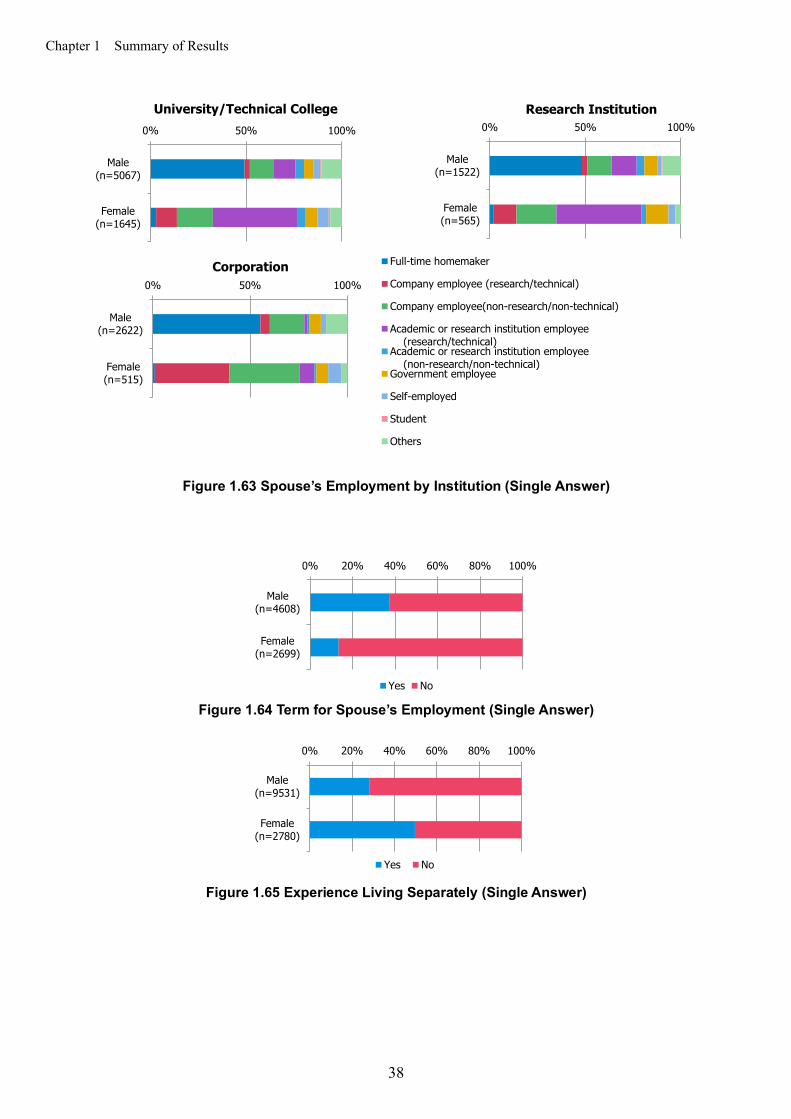
Chapter 1 Summary of Results
38
Figure 1.63 Spouse’s Employment by Institution (Single Answer)
Figure 1.64 Term for Spouse’s Employment (Single Answer)
Figure 1.65 Experience Living Separately (Single Answer)
0% 50% 100%
Male(n=5067)
Female(n=1645)
University/Technical College0% 50% 100%
Male(n=1522)
Female(n=565)
Research Institution
0% 50% 100%
Male(n=2622)
Female(n=515)
Corporation Full-time homemaker
Company employee (research/technical)
Company employee(non-research/non-technical)
Academic or research institution employee (research/technical)Academic or research institution employee (non-research/non-technical)Government employee
Self-employed
Student
Others
0% 20% 40% 60% 80% 100%
Male(n=4608)
Female(n=2699)
Yes No
0% 20% 40% 60% 80% 100%
Male(n=9531)
Female(n=2780)
Yes No
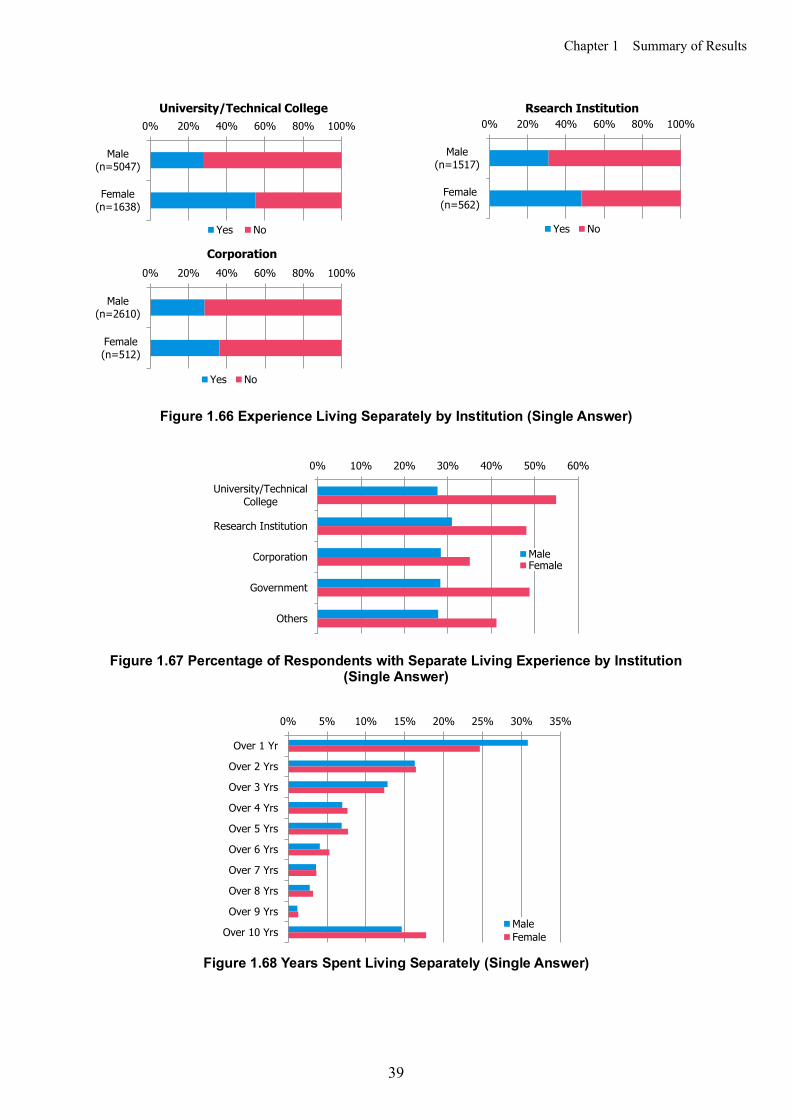
Chapter 1 Summary of Results
39
Figure 1.66 Experience Living Separately by Institution (Single Answer)
Figure 1.67 Percentage of Respondents with Separate Living Experience by Institution
(Single Answer)
Figure 1.68 Years Spent Living Separately (Single Answer)
0% 20% 40% 60% 80% 100%
Male(n=5047)
Female(n=1638)
University/Technical College
Yes No
0% 20% 40% 60% 80% 100%
Male(n=1517)
Female(n=562)
Rsearch Institution
Yes No
0% 20% 40% 60% 80% 100%
Male(n=2610)
Female(n=512)
Corporation
Yes No
0% 10% 20% 30% 40% 50% 60%
University/TechnicalCollege
Research Institution
Corporation
Government
Others
MaleFemale
0% 5% 10% 15% 20% 25% 30% 35%
Over 1 Yr
Over 2 Yrs
Over 3 Yrs
Over 4 Yrs
Over 5 Yrs
Over 6 Yrs
Over 7 Yrs
Over 8 Yrs
Over 9 Yrs
Over 10 YrsMaleFemale
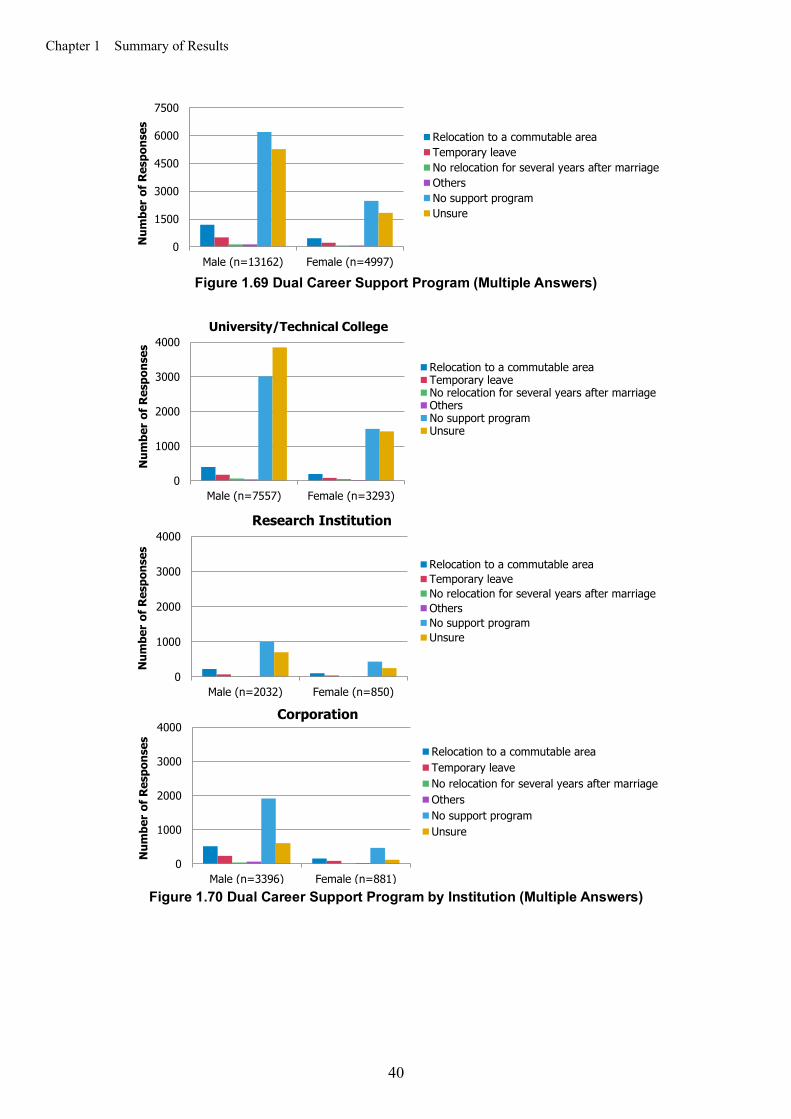
Chapter 1 Summary of Results
40
Figure 1.69 Dual Career Support Program (Multiple Answers)
Figure 1.70 Dual Career Support Program by Institution (Multiple Answers)
0
1500
3000
4500
6000
7500
Male (n=13162) Female (n=4997)
Num
ber
of R
espo
nses Relocation to a commutable area
Temporary leaveNo relocation for several years after marriageOthersNo support programUnsure
0
1000
2000
3000
4000
Male (n=7557) Female (n=3293)
Num
ber
of R
espo
nses
University/Technical College
Relocation to a commutable areaTemporary leaveNo relocation for several years after marriageOthersNo support programUnsure
0
1000
2000
3000
4000
Male (n=2032) Female (n=850)
Num
ber
of R
espo
nses
Research Institution
Relocation to a commutable areaTemporary leaveNo relocation for several years after marriageOthersNo support programUnsure
0
1000
2000
3000
4000
Male (n=3396) Female (n=881)
Num
ber
of R
espo
nses
Corporation
Relocation to a commutable areaTemporary leaveNo relocation for several years after marriageOthersNo support programUnsure
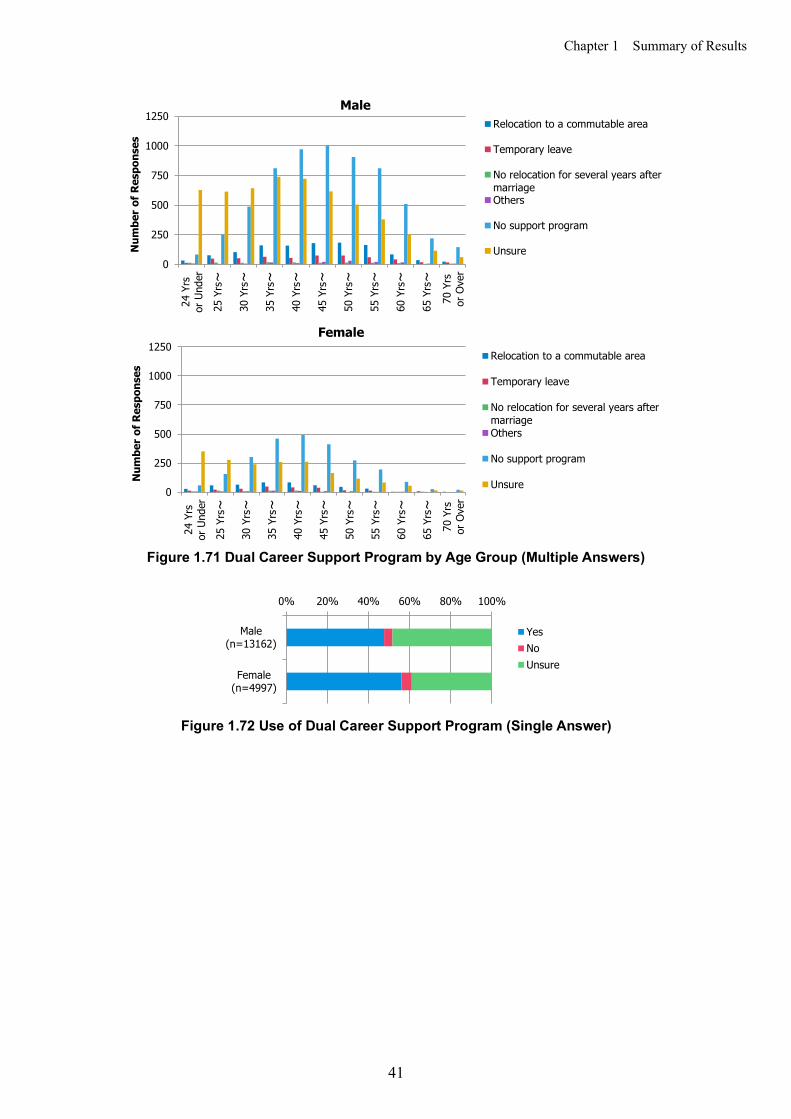
Chapter 1 Summary of Results
41
Figure 1.71 Dual Career Support Program by Age Group (Multiple Answers)
Figure 1.72 Use of Dual Career Support Program (Single Answer)
0
250
500
750
1000
1250
24 Y
rsor
Und
er
25 Y
rs~
30 Y
rs~
35 Y
rs~
40 Y
rs~
45 Y
rs~
50 Y
rs~
55 Y
rs~
60 Y
rs~
65 Y
rs~
70 Y
rsor
Ove
r
Num
ber
of R
espo
nses
MaleRelocation to a commutable area
Temporary leave
No relocation for several years aftermarriageOthers
No support program
Unsure
0
250
500
750
1000
1250
24 Y
rsor
Und
er25
Yrs~
30 Y
rs~
35 Y
rs~
40 Y
rs~
45 Y
rs~
50 Y
rs~
55 Y
rs~
60 Y
rs~
65 Y
rs~
70 Y
rsor
Ove
r
Num
ber
of R
espo
nses
FemaleRelocation to a commutable area
Temporary leave
No relocation for several years aftermarriageOthers
No support program
Unsure
0% 20% 40% 60% 80% 100%
Male(n=13162)
Female(n=4997)
YesNoUnsure
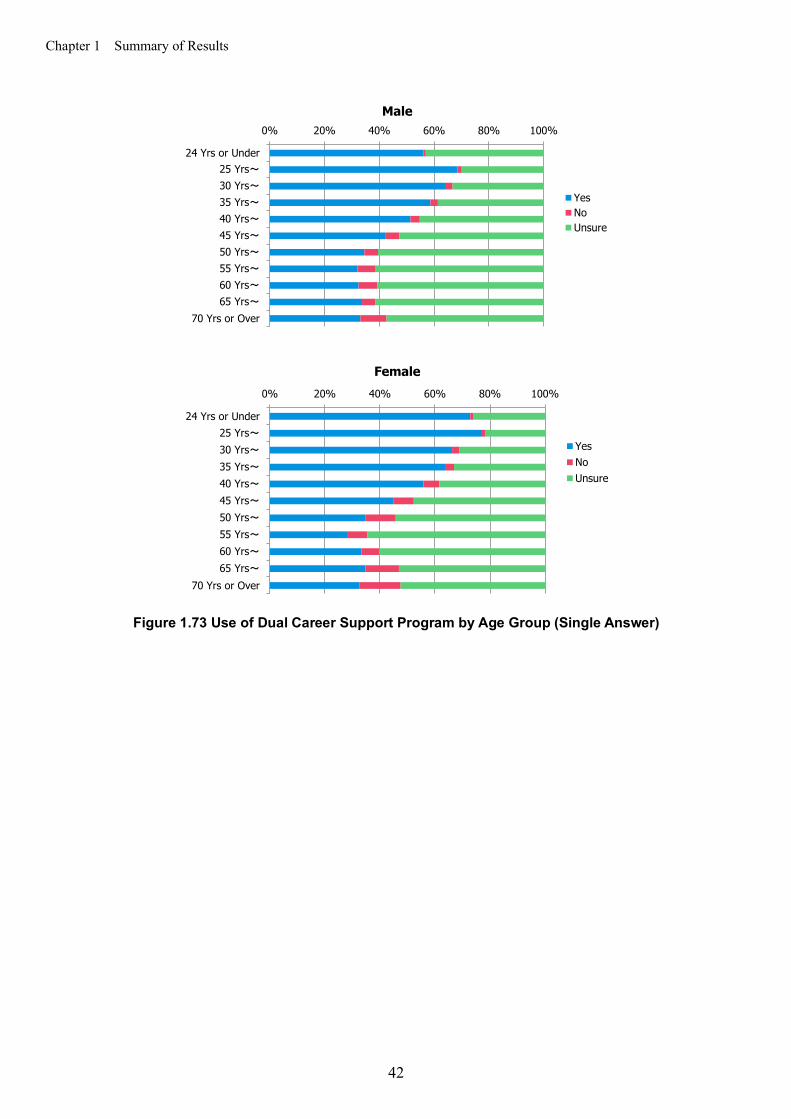
Chapter 1 Summary of Results
42
Figure 1.73 Use of Dual Career Support Program by Age Group (Single Answer)
0% 20% 40% 60% 80% 100%
24 Yrs or Under25 Yrs~30 Yrs~35 Yrs~40 Yrs~45 Yrs~50 Yrs~55 Yrs~60 Yrs~65 Yrs~
70 Yrs or Over
Male
YesNoUnsure
0% 20% 40% 60% 80% 100%
24 Yrs or Under25 Yrs~30 Yrs~35 Yrs~40 Yrs~45 Yrs~50 Yrs~55 Yrs~60 Yrs~65 Yrs~
70 Yrs or Over
Female
YesNoUnsure

Chapter 1 Summary of Results
43
Figure 1.74 Reason for Not Using Dual Career Support Program (Overall/by Institution)
(Multiple Answers) Number of Children (Questions 24, 25.1, 25.2, 32; Figures 1.75-82)
About two-thirds of females are without children, but more than half of males have children. For males the number of children reaches two at age 60, whereas the number of children for females remains nearly flat from their 40’s to the early 60's with one child.
The ideal number of children for both genders is two or more, but there is a big difference between that number and the actual number of children.
Figure 1.75 Number of Children (Single Answer)
020406080
100120140160180200
Male (n=538) Female (n=252)
Num
ber
of R
espo
nses
Overall
0
20
40
60
80
100
Male (n=267) Female (n=139)
Num
ber
of R
espo
nses
University/Technical College
Cannot relocate due to workmattersCannot relocate due to familymattersStability is highly questionableeven after relocationOthers
0
20
40
60
80
100
Male (n=87) Female (n=46)
Num
ber
of R
espo
nses
Research Institution
0
20
40
60
80
100
Male (n=163) Female (n=57)
Num
ber
of R
espo
nses
Corporation
Cannot relocate due to workmattersCannot relocate due to familymattersStability is highly questionableeven after relocationOthers
0% 20% 40% 60% 80% 100%
Male(n=13094)
Female(n=4983)
None12345 or More
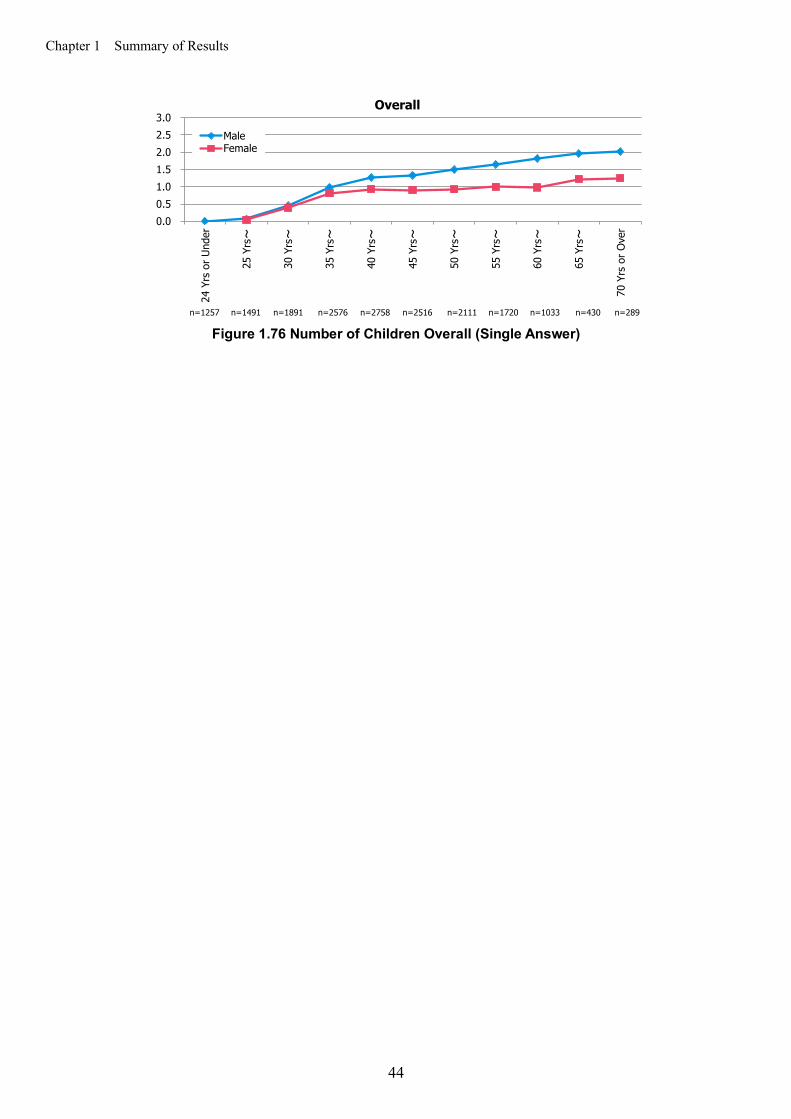
Chapter 1 Summary of Results
44
Figure 1.76 Number of Children Overall (Single Answer)
0.00.51.01.52.02.53.0
24 Y
rs o
r Und
er
25 Y
rs~
30 Y
rs~
35 Y
rs~
40 Y
rs~
45 Y
rs~
50 Y
rs~
55 Y
rs~
60 Y
rs~
65 Y
rs~
70 Y
rs o
r Ove
r
Overall
MaleFemale
n=1491 n=2516 n=1720 n=430n=2576n=1891 n=2758 n=2111 n=1033 n=289n=1257

Chapter 1 Summary of Results
45
Figure 1.77 Number of Children by Institution (Single Answer)
0.00.51.01.52.02.53.0
24 Y
rs o
r Und
er
25 Y
rs~
30 Y
rs~
35 Y
rs~
40 Y
rs~
45 Y
rs~
50 Y
rs~
55 Y
rs~
60 Y
rs~
65 Y
rs~
70 Y
rs o
r Ove
r
University/Technical College
MaleFemale
n=1002 n=1070 n=1649 n=1315 n=1080 n=871 n=606 n=202 n=115n=1524n=1201
0.00.51.01.52.02.53.0
24 Y
rs o
r Und
er
25 Y
rs~
30 Y
rs~
35 Y
rs~
40 Y
rs~
45 Y
rs~
50 Y
rs~
55 Y
rs~
60 Y
rs~
65 Y
rs~
70 Y
rs o
r Ove
r
Research Institution
MaleFemale
n=141 n=348 n=551 n=473 n=334 n=266 n=87 n=48 n=27n=506n=9
0.00.51.01.52.02.53.0
24 Y
rs o
r Und
er
25 Y
rs~
30 Y
rs~
35 Y
rs~
40 Y
rs~
45 Y
rs~
50 Y
rs~
55 Y
rs~
60 Y
rs~
65 Y
rs~
70 Y
rs o
r Ove
r
Corporation
MaleFemale
n=304 n=408 n=459 n=627 n=606 n=498 n=261 n=84 n=54n=445n=43
0.00.51.01.52.02.53.0
24 Y
rs o
r Und
er
25 Y
rs~
30 Y
rs~
35 Y
rs~
40 Y
rs~
45 Y
rs~
50 Y
rs~
55 Y
rs~
60 Y
rs~
65 Y
rs~
70 Y
rs o
r Ove
r
Government
MaleFemale
n=22 n=36 n=40 n=44 n=44 n=38 n=11 n=2 n=6n=58n=1

Chapter 1 Summary of Results
46
Figure 1.78 Age of Children (for those with children) (Multiple Answers)
Figure 1.79 Age Relation of Respondents and Their Children (Multiple Answers)
Figure 1.80 Ideal Number of Children (Single Answer)
Figure 1.81 Actual and Ideal Number of Children (Single Answer)
0%
10%
20%
30%
40%
50%
Pre-school Elementaryschool
Middleschool
High schoolHigh schoolgraduate
MaleFemale
97.3%
8.1%0.0% 0.0% 0.0%
91.6%
24.8%
1.3% 0.3% 0.2%
40.5%54.4%
26.8%
17.1% 8.4%1.8%7.6%
11.4% 19.2%
80.9%
0%
20%
40%
60%
80%
100%
Pre-school Elementaryschool
Middleschool
High school High schoolgraduate
20~2930~3940~4950~
0% 20% 40% 60% 80% 100%
Male(n=13160)
Female(n=4997)
Unanswered012345 or More
0.00.51.01.52.02.53.0
Male Female Male Female
39 Yrs or Under 40 Yrs or Over
Aver
age
Num
ber
of C
hild
ren
Number of ChildrenIdeal Number of Children
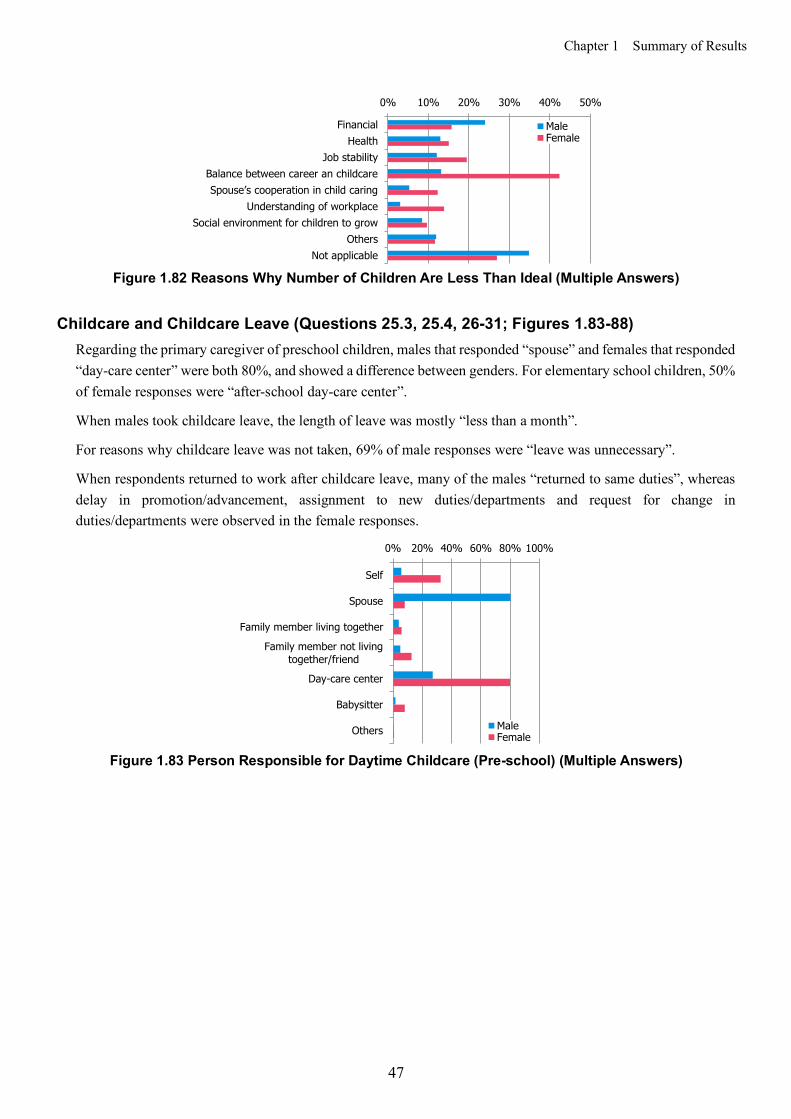
Chapter 1 Summary of Results
47
Figure 1.82 Reasons Why Number of Children Are Less Than Ideal (Multiple Answers)
Childcare and Childcare Leave (Questions 25.3, 25.4, 26-31; Figures 1.83-88)
Regarding the primary caregiver of preschool children, males that responded “spouse” and females that responded “day-care center” were both 80%, and showed a difference between genders. For elementary school children, 50% of female responses were “after-school day-care center”.
When males took childcare leave, the length of leave was mostly “less than a month”.
For reasons why childcare leave was not taken, 69% of male responses were “leave was unnecessary”.
When respondents returned to work after childcare leave, many of the males “returned to same duties”, whereas delay in promotion/advancement, assignment to new duties/departments and request for change in duties/departments were observed in the female responses.
Figure 1.83 Person Responsible for Daytime Childcare (Pre-school) (Multiple Answers)
0% 10% 20% 30% 40% 50%
FinancialHealth
Job stabilityBalance between career an childcareSpouse’s cooperation in child caring
Understanding of workplaceSocial environment for children to grow
OthersNot applicable
MaleFemale
0% 20% 40% 60% 80% 100%
Self
Spouse
Family member living together
Family member not livingtogether/friend
Day-care center
Babysitter
Others MaleFemale
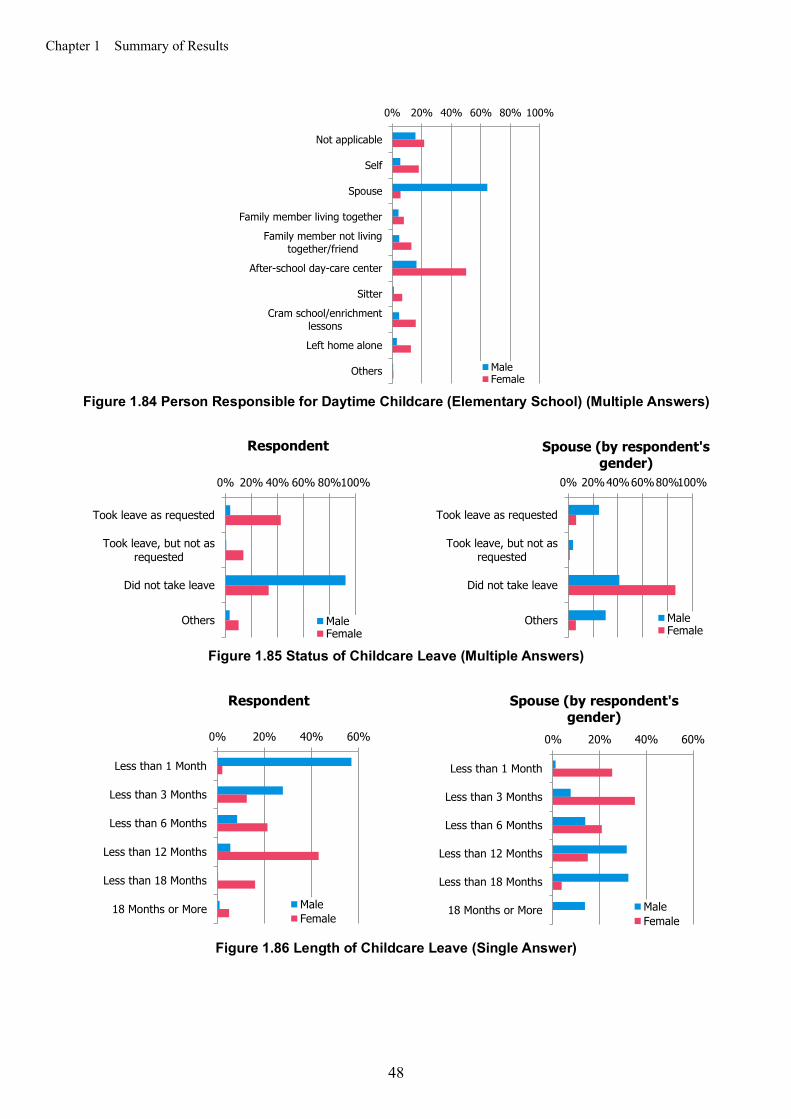
Chapter 1 Summary of Results
48
Figure 1.84 Person Responsible for Daytime Childcare (Elementary School) (Multiple Answers)
Figure 1.85 Status of Childcare Leave (Multiple Answers)
Figure 1.86 Length of Childcare Leave (Single Answer)
0% 20% 40% 60% 80% 100%
Not applicable
Self
Spouse
Family member living together
Family member not livingtogether/friend
After-school day-care center
Sitter
Cram school/enrichmentlessons
Left home alone
Others MaleFemale
0% 20% 40% 60% 80%100%
Took leave as requested
Took leave, but not asrequested
Did not take leave
Others
Respondent
MaleFemale
0% 20%40%60%80%100%
Took leave as requested
Took leave, but not asrequested
Did not take leave
Others
Spouse (by respondent's gender)
MaleFemale
0% 20% 40% 60%
Less than 1 Month
Less than 3 Months
Less than 6 Months
Less than 12 Months
Less than 18 Months
18 Months or More
Respondent
MaleFemale
0% 20% 40% 60%
Less than 1 Month
Less than 3 Months
Less than 6 Months
Less than 12 Months
Less than 18 Months
18 Months or More
Spouse (by respondent's gender)
MaleFemale
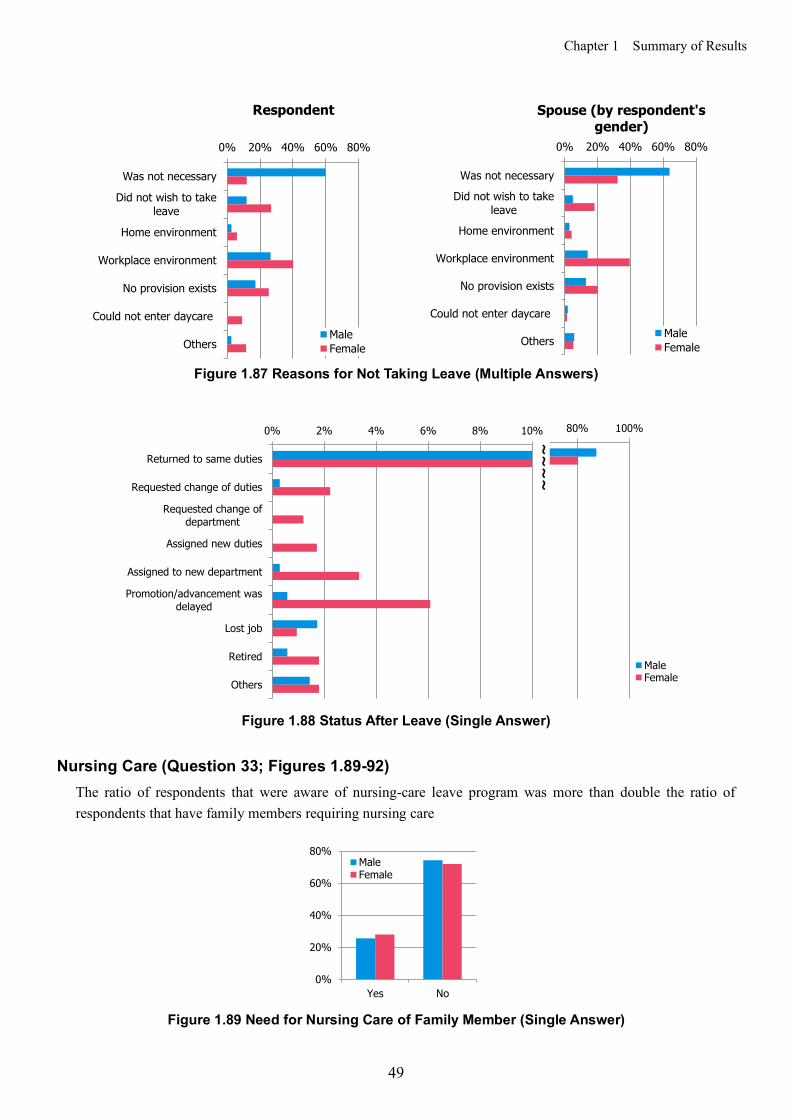
Chapter 1 Summary of Results
49
Figure 1.87 Reasons for Not Taking Leave (Multiple Answers)
Figure 1.88 Status After Leave (Single Answer)
Nursing Care (Question 33; Figures 1.89-92)
The ratio of respondents that were aware of nursing-care leave program was more than double the ratio of respondents that have family members requiring nursing care
Figure 1.89 Need for Nursing Care of Family Member (Single Answer)
0% 20% 40% 60% 80%
Was not necessary
Did not wish to takeleave
Home environment
Workplace environment
No provision exists
Could not enter daycare
Others
Respondent
MaleFemale
0% 20% 40% 60% 80%
Was not necessary
Did not wish to takeleave
Home environment
Workplace environment
No provision exists
Could not enter daycare
Others
Spouse (by respondent's gender)
MaleFemale
0% 20% 40% 60% 80% 100%
Returned to sameduties
Requested change ofduties
Requested change ofdepartment
Assigned new duties
Assigned to newdepartment
Promotion/advancement was delayed
Lost job
Retired
OthersMaleFemale
0% 2% 4% 6% 8% 10%
Returned to same duties
Requested change of duties
Requested change ofdepartment
Assigned new duties
Assigned to new department
Promotion/advancement wasdelayed
Lost job
Retired
Others
~~~~
0%
20%
40%
60%
80%
Yes No
MaleFemale
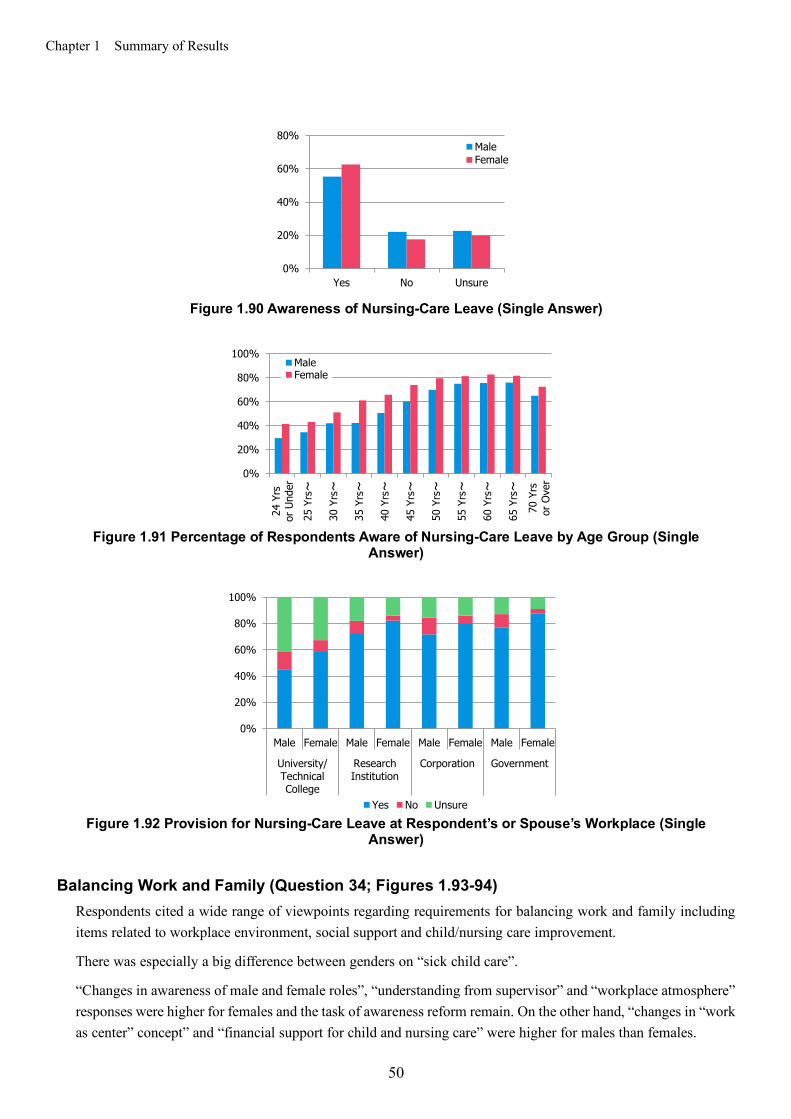
Chapter 1 Summary of Results
50
Figure 1.90 Awareness of Nursing-Care Leave (Single Answer)
Figure 1.91 Percentage of Respondents Aware of Nursing-Care Leave by Age Group (Single
Answer)
Figure 1.92 Provision for Nursing-Care Leave at Respondent’s or Spouse’s Workplace (Single
Answer) Balancing Work and Family (Question 34; Figures 1.93-94)
Respondents cited a wide range of viewpoints regarding requirements for balancing work and family including items related to workplace environment, social support and child/nursing care improvement.
There was especially a big difference between genders on “sick child care”.
“Changes in awareness of male and female roles”, “understanding from supervisor” and “workplace atmosphere” responses were higher for females and the task of awareness reform remain. On the other hand, “changes in “work as center” concept” and “financial support for child and nursing care” were higher for males than females.
0%
20%
40%
60%
80%
Yes No Unsure
MaleFemale
0%
20%
40%
60%
80%
100%
24 Y
rsor
Und
er25
Yrs~
30 Y
rs~
35 Y
rs~
40 Y
rs~
45 Y
rs~
50 Y
rs~
55 Y
rs~
60 Y
rs~
65 Y
rs~
70 Y
rsor
Ove
r
MaleFemale
0%
20%
40%
60%
80%
100%
Male Female Male Female Male Female Male Female
University/TechnicalCollege
ResearchInstitution
Corporation Government
Yes No Unsure

Chapter 1 Summary of Results
51
“Changes in awareness of male and female roles” and “changes in “work as center” concept” responses were higher for females with “elementary school or younger children” compared with females with “no child”.
Figure 1.93 Requirements for Balancing Family and Work (Multiple Answers)
0% 20% 40% 60% 80%
Changes in "work as center" concept
Changes in awareness of male and female roles
Workplace atmosphere
Understanding from supervisor
Relationship with child and nursing care serviceproviders
Shorter working hours
Work support
Variety of provisions for leave of absence
Alternate staffing while on leave
Provision for working at home while on leave
Work sharing
Flexible working hours
Improve employment system
Various ways of working and career paths
Financial support for child and nursing care
Public subsidies for employer of person on leave
Financial support for long distance care (such as careallowance, transportation discount, etc.)
Expanded child-care facilities and services
Sick child care
Expanded after-school care for children
Expanded nursing-care facilities and services (includinghome)
Expanded municipal childrearing support
Unsure
Others
Awar
enes
s Re
form
Prog
ram
Ref
orm
Fina
ncia
lSu
ppor
tFa
cility
and
Ser
vice
Impr
ovem
ent
MaleFemale

Chapter 1 Summary of Results
52
0% 20% 40% 60% 80% 100%
Changes in "work as center" concept
Changes in awareness of male and female roles
Workplace atmosphere
Understanding from supervisor
Relationship with child and nursing care serviceproviders
Shorter working hours
Work support
Variety of provisions for leave of absence
Alternate staffing while on leave
Provision for working at home while on leave
Work sharing
Flexible working hours
Improve employment system
Various ways of working and career paths
Financial support for child and nursing care
Public subsidies for employer of person on leave
Financial support for long distance care (such as careallowance, transportation discount, etc.)
Expanded child-care facilities and services
Sick child care
Expanded after-school care for children
Expanded nursing-care facilities and services (includinghome)
Expanded municipal childrearing support
Unsure
Others
Awar
enes
s Re
form
Prog
ram
Ref
orm
Fina
ncia
lSu
ppor
tFa
cility
and
Ser
vice
Impr
ovem
ent
Male
No ChildWith Child (Elementary School or Younger)With Child (Middle School or Older)

Chapter 1 Summary of Results
53
Figure 1.94 Requirements for Balancing Family and Work by Presence of Children
(Multiple Answers)
0% 20% 40% 60% 80% 100%
Changes in "work as center" concept
Changes in awareness of male and female roles
Workplace atmosphere
Understanding from supervisor
Relationship with child and nursing care serviceproviders
Shorter working hours
Work support
Variety of provisions for leave of absence
Alternate staffing while on leave
Provision for working at home while on leave
Work sharing
Flexible working hours
Improve employment system
Various ways of working and career paths
Financial support for child and nursing care
Public subsidies for employer of person on leave
Financial support for long distance care (such as careallowance, transportation discount, etc.)
Expanded child-care facilities and services
Sick child care
Expanded after-school care for children
Expanded nursing-care facilities and services (includinghome)
Expanded municipal childrearing support
Unsure
Others
Awar
enes
s Re
form
Prog
ram
Ref
orm
Fina
ncia
lSu
ppor
tFa
cility
and
Ser
vice
Impr
ovem
ent
Female
No ChildWith Child (Elementary School or Younger)With Child (Middle School or Older)
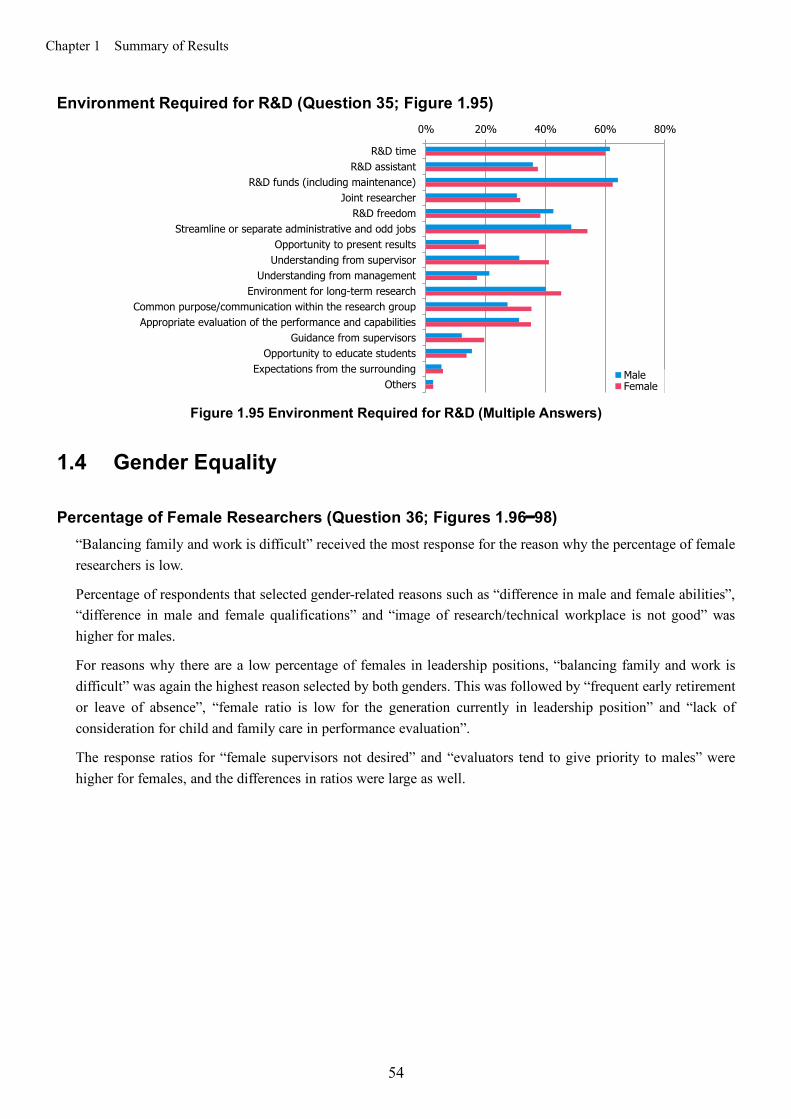
Chapter 1 Summary of Results
54
Environment Required for R&D (Question 35; Figure 1.95)
Figure 1.95 Environment Required for R&D (Multiple Answers)
1.4 Gender Equality
Percentage of Female Researchers (Question 36; Figures 1.96—98) “Balancing family and work is difficult” received the most response for the reason why the percentage of female researchers is low.
Percentage of respondents that selected gender-related reasons such as “difference in male and female abilities”, “difference in male and female qualifications” and “image of research/technical workplace is not good” was higher for males.
For reasons why there are a low percentage of females in leadership positions, “balancing family and work is difficult” was again the highest reason selected by both genders. This was followed by “frequent early retirement or leave of absence”, “female ratio is low for the generation currently in leadership position” and “lack of consideration for child and family care in performance evaluation”.
The response ratios for “female supervisors not desired” and “evaluators tend to give priority to males” were higher for females, and the differences in ratios were large as well.
0% 20% 40% 60% 80%
R&D timeR&D assistant
R&D funds (including maintenance)Joint researcher
R&D freedomStreamline or separate administrative and odd jobs
Opportunity to present resultsUnderstanding from supervisor
Understanding from managementEnvironment for long-term research
Common purpose/communication within the research groupAppropriate evaluation of the performance and capabilities
Guidance from supervisorsOpportunity to educate students
Expectations from the surroundingOthers
MaleFemale
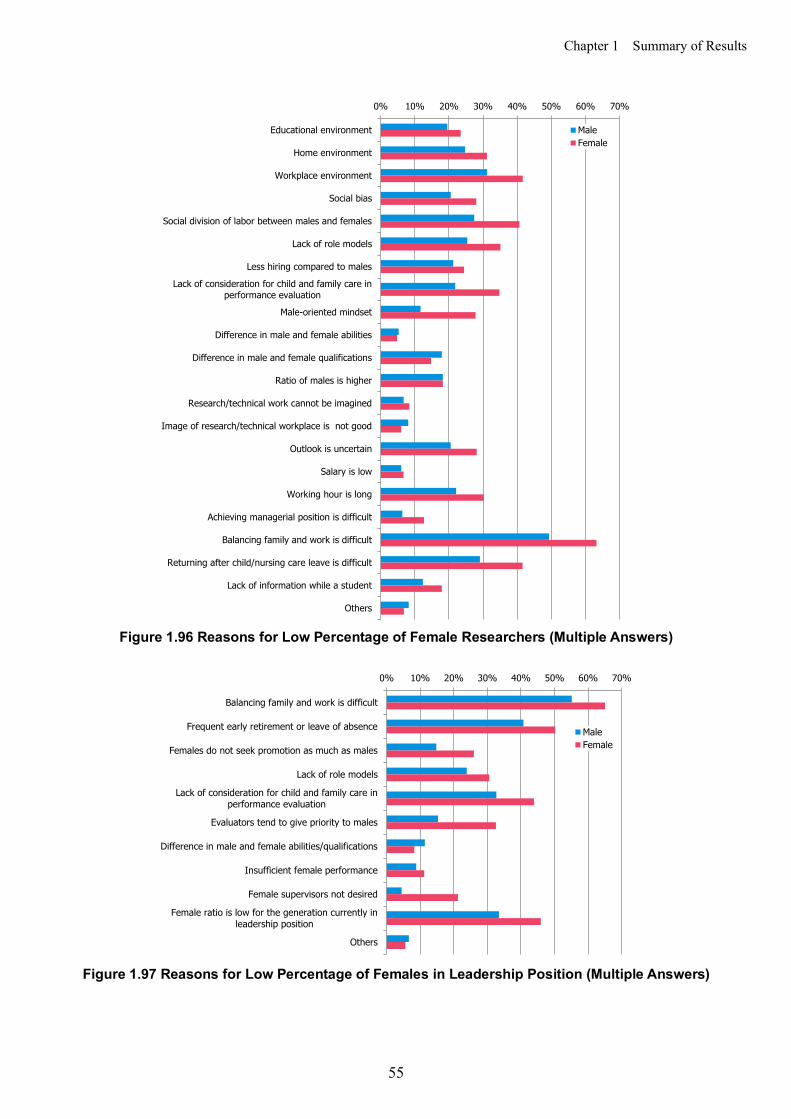
Chapter 1 Summary of Results
55
Figure 1.96 Reasons for Low Percentage of Female Researchers (Multiple Answers)
Figure 1.97 Reasons for Low Percentage of Females in Leadership Position (Multiple Answers)
0% 10% 20% 30% 40% 50% 60% 70%
Educational environment
Home environment
Workplace environment
Social bias
Social division of labor between males and females
Lack of role models
Less hiring compared to males
Lack of consideration for child and family care inperformance evaluation
Male-oriented mindset
Difference in male and female abilities
Difference in male and female qualifications
Ratio of males is higher
Research/technical work cannot be imagined
Image of research/technical workplace is not good
Outlook is uncertain
Salary is low
Working hour is long
Achieving managerial position is difficult
Balancing family and work is difficult
Returning after child/nursing care leave is difficult
Lack of information while a student
Others
MaleFemale
0% 10% 20% 30% 40% 50% 60% 70%
Balancing family and work is difficult
Frequent early retirement or leave of absence
Females do not seek promotion as much as males
Lack of role models
Lack of consideration for child and family care inperformance evaluation
Evaluators tend to give priority to males
Difference in male and female abilities/qualifications
Insufficient female performance
Female supervisors not desired
Female ratio is low for the generation currently inleadership position
Others
MaleFemale

Chapter 1 Summary of Results
56
Figure 1.98 Remedies for Improving Female Ratio (Multiple Answers)
Awareness of New Policies (Questions 37, 38; Figures 1.99-102)
The percentage of respondents who “do not know” any of the policies was more than 30%, and the awareness of policies is still low.
Half of the respondents believe support programs related to childbirth and childcare is “meaningful”.
Figure 1.99 Awareness of Policies (Multiple Answers)
0% 20% 40% 60%
Aggressive hiring
Promotion to managerial positions
Facilitate promotions/salary increases
Increase R&D funds
Employ research assistants
Consideration of life events in performanceevaluations
Reduce non-research/non-primary workload
Provide opportunities for domestic and overseasstudies
Increase opportunities to participate in conferencesas speakers, chairs or organizers
Increase opportunities for receiving awards
Provide leadership training
Others
MaleFemale
0% 10% 20% 30% 40% 50%
The Act on Promotion of Women’s Participation and Advancement in the Workplace
5th Science and Technology Basic Plan
Fourth Basic Plan for Gender Equality
Excellent Young Researchers Program
Do not know
MaleFemale
0% 10% 20% 30% 40% 50%
The Act on Promotion of Women’s Participation and Advancement in the Workplace
5th Science and Technology Basic Plan
Fourth Basic Plan for Gender Equality
Excellent Young Researchers Program
Do not know
University/Technical College
MaleFemale

Chapter 1 Summary of Results
57
Figure 1.100 Awareness of Policies by Institution (Multiple Answers)
Figure 1.101 Awareness of Policies by Occupational Field (Multiple Answers)
0% 10% 20% 30% 40% 50%
The Act on Promotion of Women’s Participation and Advancement in the Workplace
5th Science and Technology Basic Plan
Fourth Basic Plan for Gender Equality
Excellent Young Researchers Program
Do not know
Research Institution
MaleFemale
0% 10% 20% 30% 40% 50%
The Act on Promotion of Women’s Participation and Advancement in the Workplace
5th Science and Technology Basic Plan
Fourth Basic Plan for Gender Equality
Excellent Young Researchers Program
Do not know
Corporation
MaleFemale
0% 20% 40% 60% 80%
The Act on Promotion of Women’s Participation and Advancement in
the Workplace
5th Science and Technology BasicPlan
Fourth Basic Plan for GenderEquality
Excellent Young ResearchersProgram
Do not know
No-term PILimited-term PINo-term NPILimited-term NPINo-term ResearcherLimited-term ResearcherManagerRegular EmployeeStudent
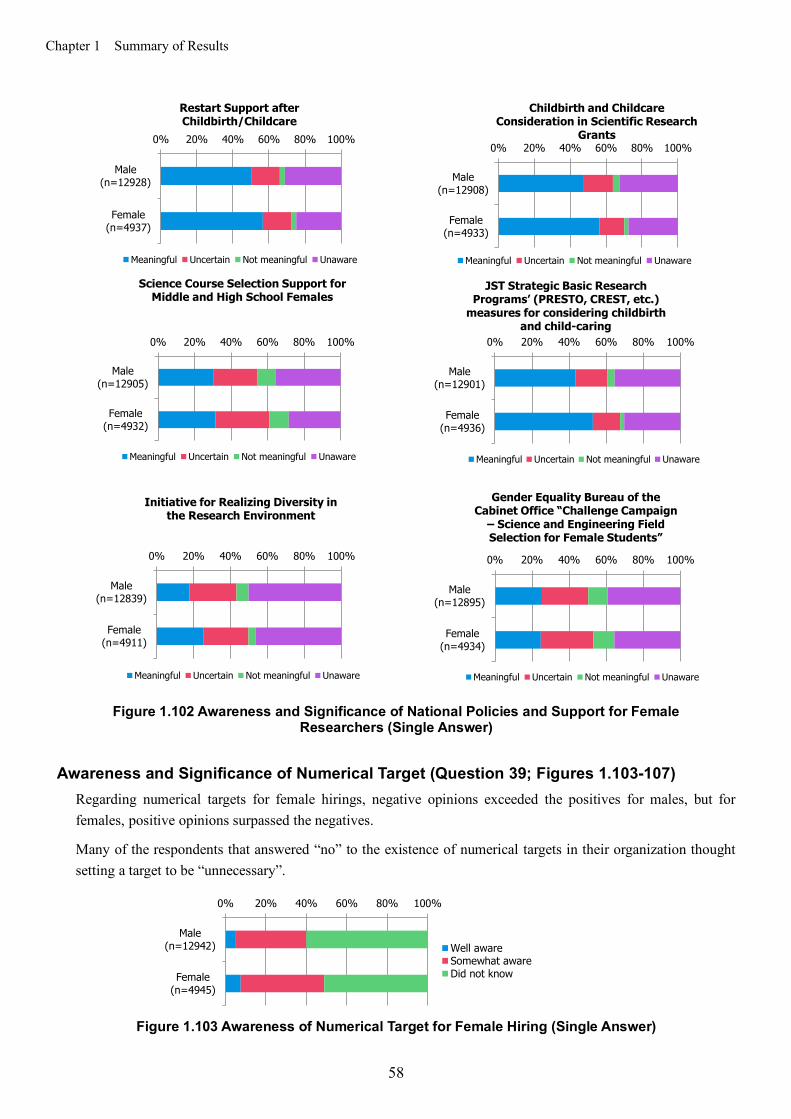
Chapter 1 Summary of Results
58
Figure 1.102 Awareness and Significance of National Policies and Support for Female Researchers (Single Answer)
Awareness and Significance of Numerical Target (Question 39; Figures 1.103-107)
Regarding numerical targets for female hirings, negative opinions exceeded the positives for males, but for females, positive opinions surpassed the negatives.
Many of the respondents that answered “no” to the existence of numerical targets in their organization thought setting a target to be “unnecessary”.
Figure 1.103 Awareness of Numerical Target for Female Hiring (Single Answer)
0% 20% 40% 60% 80% 100%
Male(n=12928)
Female(n=4937)
Restart Support after Childbirth/Childcare
Meaningful Uncertain Not meaningful Unaware
0% 20% 40% 60% 80% 100%
Male(n=12908)
Female(n=4933)
Childbirth and Childcare Consideration in Scientific Research
Grants
Meaningful Uncertain Not meaningful Unaware
0% 20% 40% 60% 80% 100%
Male(n=12905)
Female(n=4932)
Science Course Selection Support for Middle and High School Females
Meaningful Uncertain Not meaningful Unaware
0% 20% 40% 60% 80% 100%
Male(n=12901)
Female(n=4936)
JST Strategic Basic Research Programs’ (PRESTO, CREST, etc.)
measures for considering childbirth and child-caring
Meaningful Uncertain Not meaningful Unaware
0% 20% 40% 60% 80% 100%
Male(n=12839)
Female(n=4911)
Initiative for Realizing Diversity in the Research Environment
Meaningful Uncertain Not meaningful Unaware
0% 20% 40% 60% 80% 100%
Male(n=12895)
Female(n=4934)
Gender Equality Bureau of the Cabinet Office “Challenge Campaign
– Science and Engineering Field Selection for Female Students”
Meaningful Uncertain Not meaningful Unaware
0% 20% 40% 60% 80% 100%
Male(n=12942)
Female(n=4945)
Well awareSomewhat awareDid not know

Chapter 1 Summary of Results
59
Figure 1.104 Significance of Setting a Numerical Target for Female Hiring (Single Answer)
Figure 1.105 Numerical Target for Female Hiring (Single Answer)
Figure 1.106 Published Numerical Target for Female Hiring (for those who replied yes to set
target) (Single Answer)
Figure 1.107 Need for Numerical Target (for those who replied no to set target) (Single Answer)
0% 20% 40% 60% 80% 100%
Male(n=12938)
Female(n=4930)
MeaningfulShould be expanded and promotedHas room for improvementNot meaningfulWill have adverse effectUncertain
7451 3229 1977 826 3053 758 234 69
0%
20%
40%
60%
80%
100%
Male Female Male Female Male Female Male Female
University/Technical College
ResearchInstitution
Corporation Government
Yes No Unsure
2892
674
659
35
0% 20% 40% 60% 80% 100%
University/Technical College(n=2892)
Research Institution(n=674)
Corporation(n=659)
Government(n=35)
Yes No Uncertain
1252 647 496 181 1313 321 111 34
0%
20%
40%
60%
80%
100%
Male Female Male Female Male Female Male Female
University/Technical College
Research Institution Corporation Government
Necessary Unnecessary Uncertain
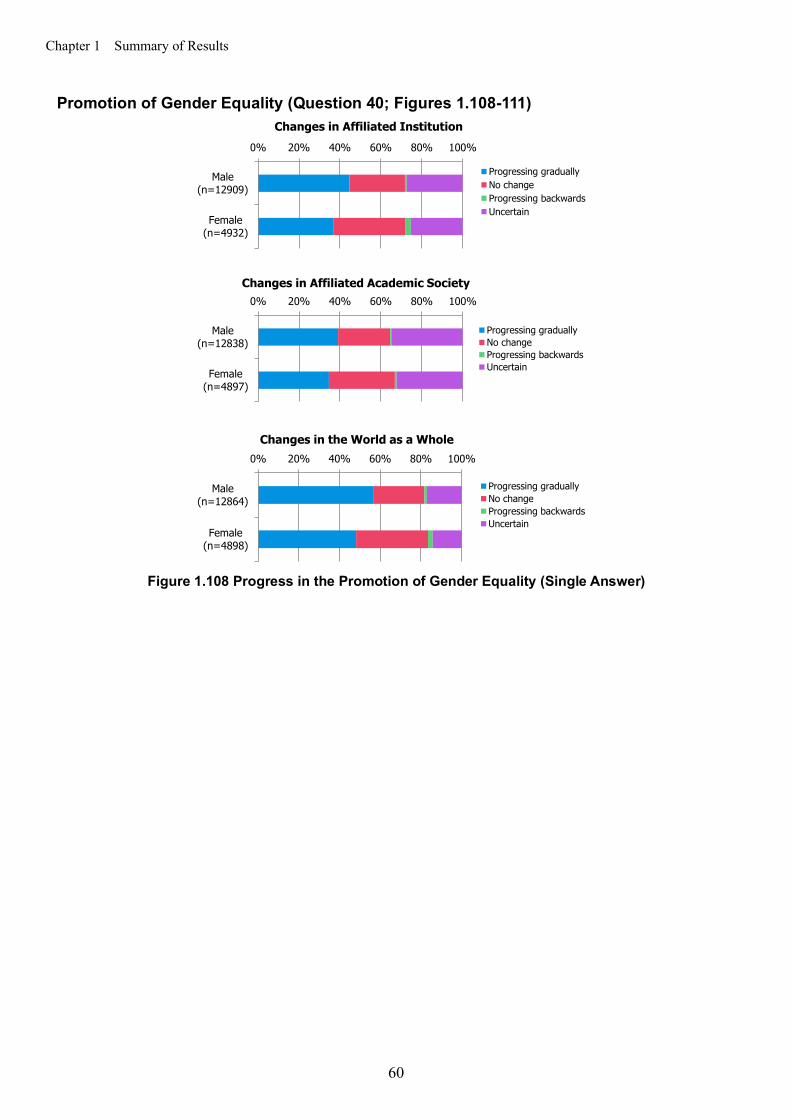
Chapter 1 Summary of Results
60
Promotion of Gender Equality (Question 40; Figures 1.108-111)
Figure 1.108 Progress in the Promotion of Gender Equality (Single Answer)
0% 20% 40% 60% 80% 100%
Male(n=12909)
Female(n=4932)
Changes in Affiliated Institution
Progressing graduallyNo changeProgressing backwardsUncertain
0% 20% 40% 60% 80% 100%
Male(n=12838)
Female(n=4897)
Changes in Affiliated Academic Society
Progressing graduallyNo changeProgressing backwardsUncertain
0% 20% 40% 60% 80% 100%
Male(n=12864)
Female(n=4898)
Changes in the World as a Whole
Progressing graduallyNo changeProgressing backwardsUncertain
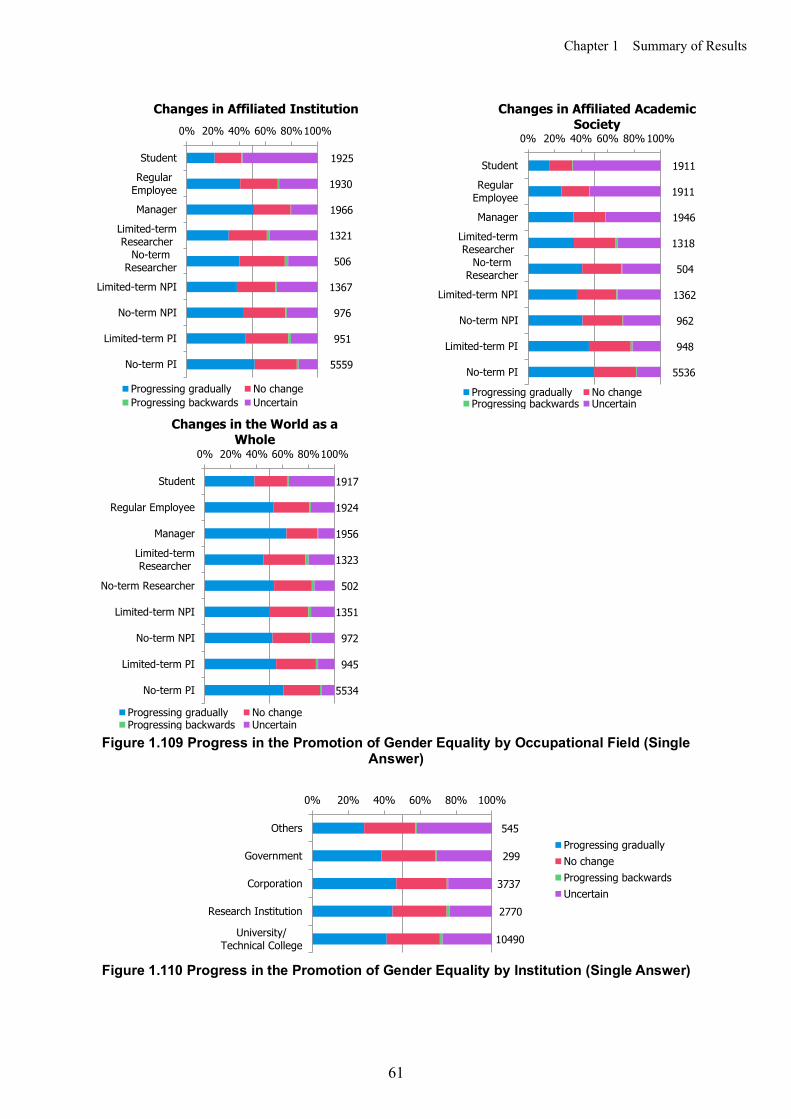
Chapter 1 Summary of Results
61
Figure 1.109 Progress in the Promotion of Gender Equality by Occupational Field (Single Answer)
Figure 1.110 Progress in the Promotion of Gender Equality by Institution (Single Answer)
5559
951
976
1367
506
1321
1966
1930
1925
0% 20% 40% 60% 80%100%
No-term PI
Limited-term PI
No-term NPI
Limited-term NPI
No-termResearcher
Limited-termResearcher
Manager
RegularEmployee
Student
Changes in Affiliated Institution
Progressing gradually No changeProgressing backwards Uncertain
5536
948
962
1362
504
1318
1946
1911
1911
0% 20% 40% 60% 80% 100%
No-term PI
Limited-term PI
No-term NPI
Limited-term NPI
No-termResearcher
Limited-termResearcher
Manager
RegularEmployee
Student
Changes in Affiliated Academic Society
Progressing gradually No changeProgressing backwards Uncertain
5534
945
972
1351
502
1323
1956
1924
1917
0% 20% 40% 60% 80%100%
No-term PI
Limited-term PI
No-term NPI
Limited-term NPI
No-term Researcher
Limited-termResearcher
Manager
Regular Employee
Student
Changes in the World as a Whole
Progressing gradually No changeProgressing backwards Uncertain
10490
2770
3737
299
545
0% 20% 40% 60% 80% 100%
University/Technical College
Research Institution
Corporation
Government
OthersProgressing graduallyNo changeProgressing backwardsUncertain
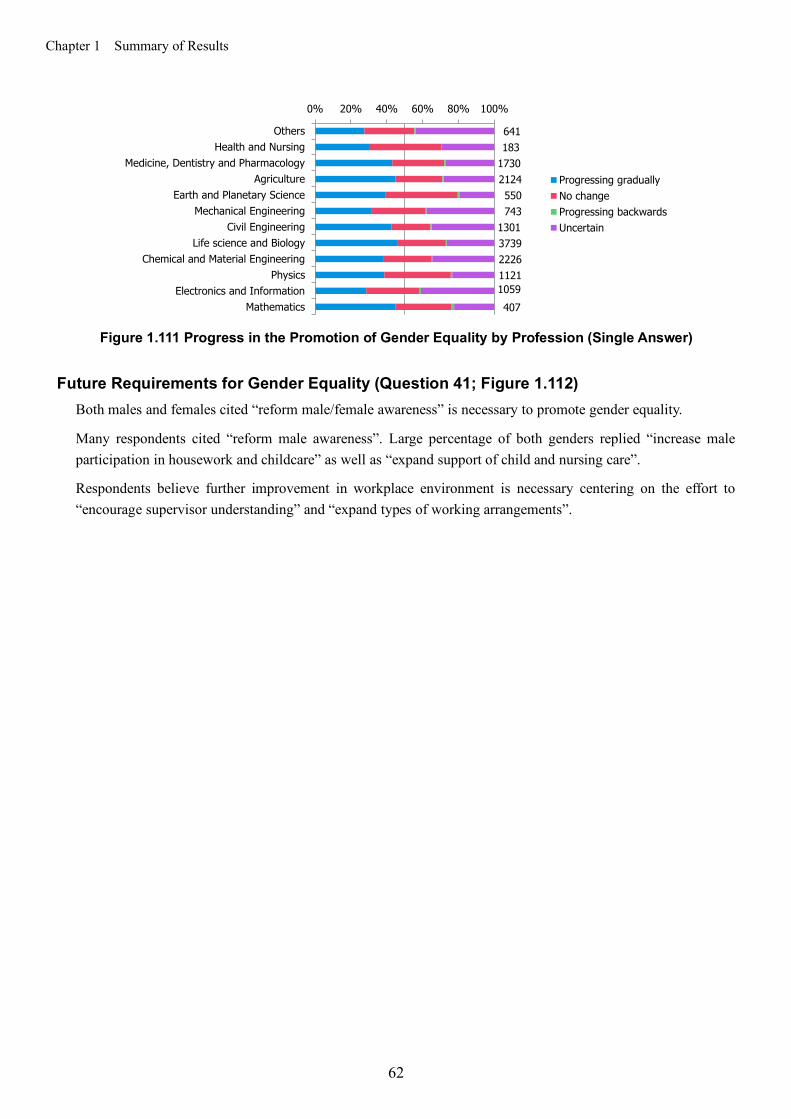
Chapter 1 Summary of Results
62
Figure 1.111 Progress in the Promotion of Gender Equality by Profession (Single Answer)
Future Requirements for Gender Equality (Question 41; Figure 1.112)
Both males and females cited “reform male/female awareness” is necessary to promote gender equality.
Many respondents cited “reform male awareness”. Large percentage of both genders replied “increase male participation in housework and childcare” as well as “expand support of child and nursing care”.
Respondents believe further improvement in workplace environment is necessary centering on the effort to “encourage supervisor understanding” and “expand types of working arrangements”.
40710591121222637391301
743550
21241730183641
0% 20% 40% 60% 80% 100%
MathematicsElectronics and Information
PhysicsChemical and Material Engineering
Life science and BiologyCivil Engineering
Mechanical EngineeringEarth and Planetary Science
AgricultureMedicine, Dentistry and Pharmacology
Health and NursingOthers
Progressing graduallyNo changeProgressing backwardsUncertain

Chapter 1 Summary of Results
63
Figure 1.112 Future Requirements for Gender Equality (Multiple Answers)
0% 10% 20% 30% 40% 50% 60% 70% 80%
Reform female awareness
Reform male awareness
Increase male participationin housework and childcare
Separate surnames for married couples
Improve work environment
Give females priority during certain periods
Eliminate various age limits
Improve evaluation system
Encourage supervisor understanding
Expand types of working arrangements
Expand support of child and nursing care
Introduce fixed-term employment
Improve fixed-term employment
Eliminate fixed-term employment
Form a female researchers network
Comparative studies and policiesto meet international standards
Clarification of national policies
Funding for policies
Expanded promotion by national/local government or employers
Expansion of social security system
Others
Nothing required
MaleFemale
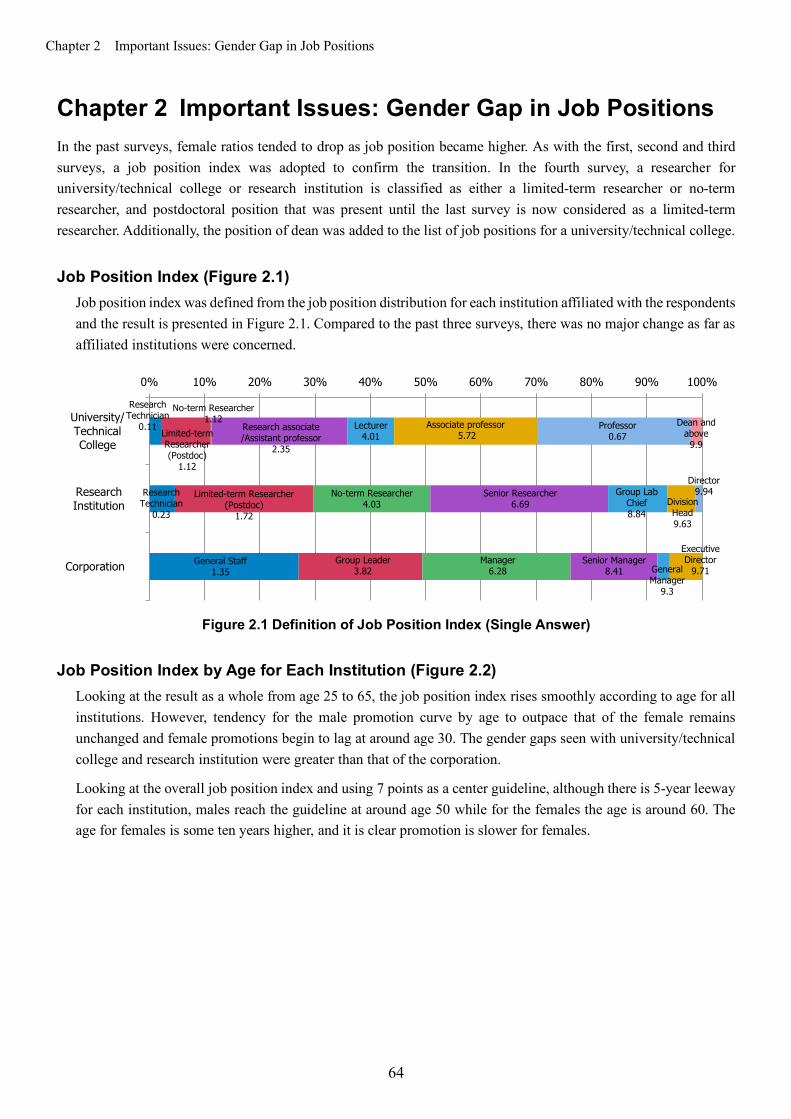
Chapter 2 Important Issues: Gender Gap in Job Positions
64
Chapter 2 Important Issues: Gender Gap in Job Positions In the past surveys, female ratios tended to drop as job position became higher. As with the first, second and third surveys, a job position index was adopted to confirm the transition. In the fourth survey, a researcher for university/technical college or research institution is classified as either a limited-term researcher or no-term researcher, and postdoctoral position that was present until the last survey is now considered as a limited-term researcher. Additionally, the position of dean was added to the list of job positions for a university/technical college. Job Position Index (Figure 2.1)
Job position index was defined from the job position distribution for each institution affiliated with the respondents and the result is presented in Figure 2.1. Compared to the past three surveys, there was no major change as far as affiliated institutions were concerned.
Figure 2.1 Definition of Job Position Index (Single Answer)
Job Position Index by Age for Each Institution (Figure 2.2)
Looking at the result as a whole from age 25 to 65, the job position index rises smoothly according to age for all institutions. However, tendency for the male promotion curve by age to outpace that of the female remains unchanged and female promotions begin to lag at around age 30. The gender gaps seen with university/technical college and research institution were greater than that of the corporation.
Looking at the overall job position index and using 7 points as a center guideline, although there is 5-year leeway for each institution, males reach the guideline at around age 50 while for the females the age is around 60. The age for females is some ten years higher, and it is clear promotion is slower for females.
Research Technician
0.11
Research Technician
0.23
General Staff 1.35
Limited-term Researcher (Postdoc)
1.12
Limited-term Researcher (Postdoc)
1.72
Group Leader 3.82
No-term Researcher 1.12
No-term Researcher 4.03
Manager 6.28
Research associate/Assistant professor
2.35
Senior Researcher 6.69
Senior Manager 8.41
Lecturer 4.01
Group Lab Chief 8.84
General Manager
9.3
Associate professor 5.72
Division Head 9.63
Executive Director
9.71
Professor 0.67
Director 9.94
Dean and above 9.9
0% 10% 20% 30% 40% 50% 60% 70% 80% 90% 100%
University/TechnicalCollege
ResearchInstitution
Corporation
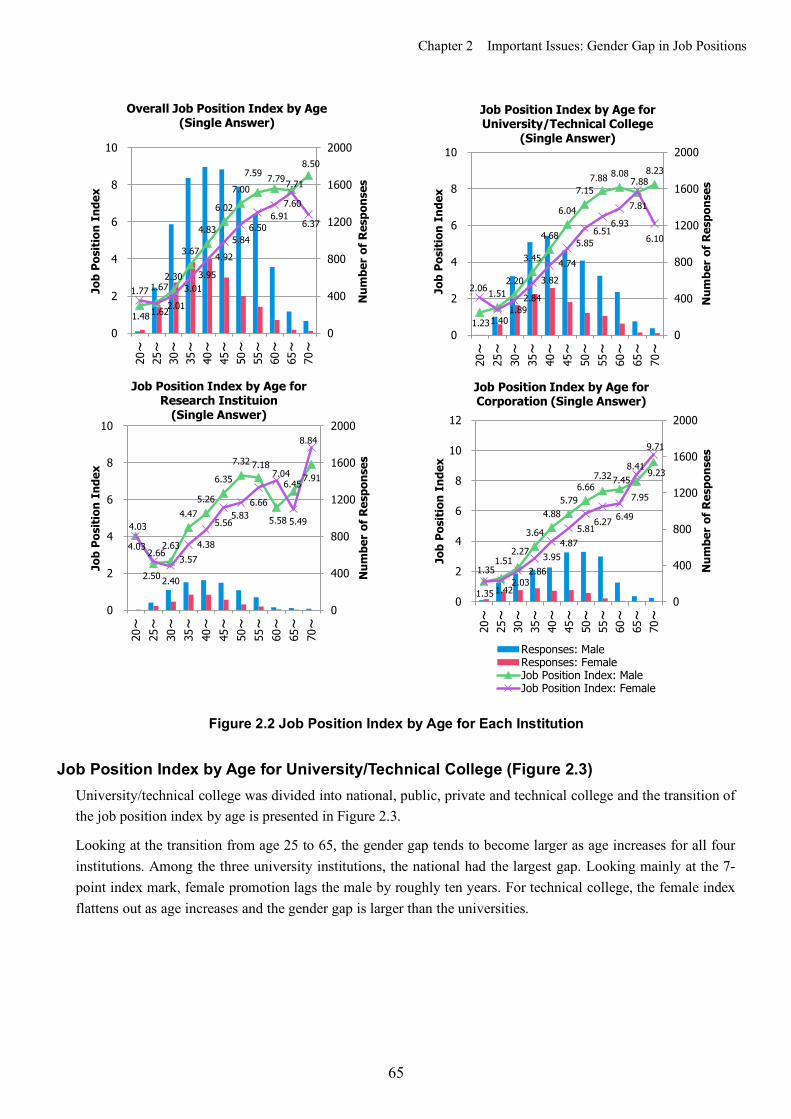
Chapter 2 Important Issues: Gender Gap in Job Positions
65
Figure 2.2 Job Position Index by Age for Each Institution Job Position Index by Age for University/Technical College (Figure 2.3)
University/technical college was divided into national, public, private and technical college and the transition of the job position index by age is presented in Figure 2.3.
Looking at the transition from age 25 to 65, the gender gap tends to become larger as age increases for all four institutions. Among the three university institutions, the national had the largest gap. Looking mainly at the 7-point index mark, female promotion lags the male by roughly ten years. For technical college, the female index flattens out as age increases and the gender gap is larger than the universities.
1.48
1.67 2.30
3.67
4.83
6.02
7.00 7.59 7.79 7.71
8.50
1.77
1.62 2.01
3.01 3.95
4.92
5.84 6.50
6.91 7.60
6.37
0
400
800
1200
1600
2000
0
2
4
6
8
1020~
25~
30~
35~
40~
45~
50~
55~
60~
65~
70~
Num
ber
of R
espo
nses
Job
Posi
tion
Inde
xOverall Job Position Index by Age
(Single Answer)
1.23
1.51 2.20
3.45
4.68
6.04
7.15 7.88 8.08
7.81
8.23
2.06
1.40 1.89
2.84
3.82
4.74
5.85 6.51
6.93
7.88
6.10
0
400
800
1200
1600
2000
0
2
4
6
8
10
20~
25~
30~
35~
40~
45~
50~
55~
60~
65~
70~
Num
ber
of R
espo
nses
Job
Posi
tion
Inde
x
Job Position Index by Age for University/Technical College
(Single Answer)
4.03
2.50
2.63
4.47 5.26
6.35
7.32 7.18
5.58
6.45 7.91
4.03
2.66
2.40
3.57 4.38
5.56 5.83
6.66
7.04
5.49
8.84
0
400
800
1200
1600
2000
0
2
4
6
8
10
20~
25~
30~
35~
40~
45~
50~
55~
60~
65~
70~
Num
ber
of R
espo
nses
Job
Posi
tion
Inde
x
Job Position Index by Age for Research Instituion
(Single Answer)
1.35
1.51 2.27
3.64
4.88 5.79
6.66 7.32 7.45
7.95
9.23
1.35
1.42 2.03
2.86 3.95
4.87 5.81
6.27 6.49
8.41
9.71
0
400
800
1200
1600
2000
0
2
4
6
8
10
12
20~
25~
30~
35~
40~
45~
50~
55~
60~
65~
70~
Num
ber
of R
espo
nses
Job
Posi
tion
Inde
x
Job Position Index by Age for Corporation (Single Answer)
Responses: MaleResponses: FemaleJob Position Index: MaleJob Position Index: Female
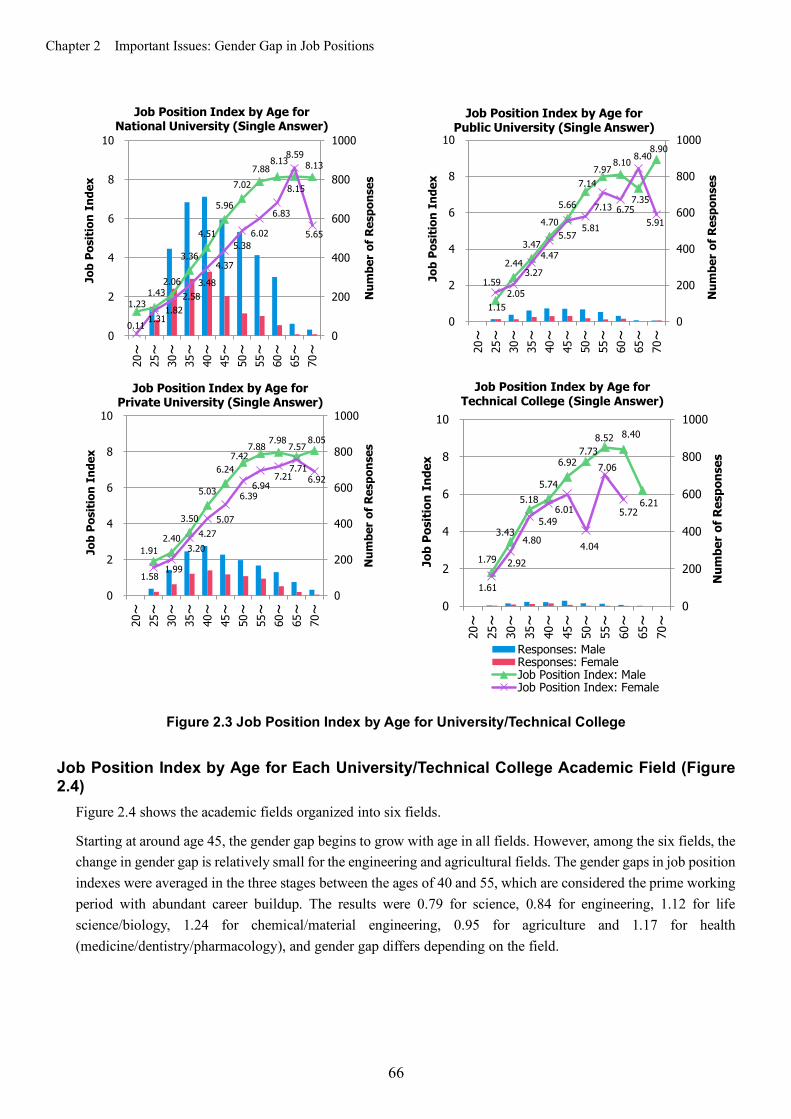
Chapter 2 Important Issues: Gender Gap in Job Positions
66
Figure 2.3 Job Position Index by Age for University/Technical College Job Position Index by Age for Each University/Technical College Academic Field (Figure 2.4)
Figure 2.4 shows the academic fields organized into six fields.
Starting at around age 45, the gender gap begins to grow with age in all fields. However, among the six fields, the change in gender gap is relatively small for the engineering and agricultural fields. The gender gaps in job position indexes were averaged in the three stages between the ages of 40 and 55, which are considered the prime working period with abundant career buildup. The results were 0.79 for science, 0.84 for engineering, 1.12 for life science/biology, 1.24 for chemical/material engineering, 0.95 for agriculture and 1.17 for health (medicine/dentistry/pharmacology), and gender gap differs depending on the field.
1.23 1.43
2.06
3.36
4.51
5.96
7.02 7.88
8.13
8.15
8.13
0.11 1.31
1.82 2.58
3.48
4.37
5.38 6.02
6.83
8.59
5.65
0
200
400
600
800
1000
0
2
4
6
8
1020~
25~
30~
35~
40~
45~
50~
55~
60~
65~
70~
Num
ber
of R
espo
nses
Job
Posi
tion
Inde
x
Job Position Index by Age for National University (Single Answer)
1.15
2.44
3.47
4.70
5.66
7.14 7.97
8.10
7.35
8.90
1.59 2.05
3.27
4.47
5.57 5.81
7.13 6.75
8.40
5.91
0
200
400
600
800
1000
0
2
4
6
8
10
20~
25~
30~
35~
40~
45~
50~
55~
60~
65~
70~
Num
ber
of R
espo
nses
Job
Posi
tion
Inde
x
Job Position Index by Age for Public University (Single Answer)
1.91 2.40
3.50
5.03
6.24 7.42
7.88 7.98
7.71
8.05
1.58 1.99
3.20 4.27
5.07
6.39 6.94
7.21
7.57
6.92
0
200
400
600
800
1000
0
2
4
6
8
10
20~
25~
30~
35~
40~
45~
50~
55~
60~
65~
70~
Num
ber
of R
espo
nses
Job
Posi
tion
Inde
x
Job Position Index by Age for Private University (Single Answer)
1.79
3.43
5.18 5.74
6.92 7.73
8.52 8.40
6.21
1.61
2.92
4.80
5.49 6.01
4.04
7.06
5.72
0
200
400
600
800
1000
0
2
4
6
8
10
20~
25~
30~
35~
40~
45~
50~
55~
60~
65~
70~
Num
ber
of R
espo
nses
Job
Posi
tion
Inde
x
Job Position Index by Age for Technical College (Single Answer)
Responses: MaleResponses: FemaleJob Position Index: MaleJob Position Index: Female

Chapter 2 Important Issues: Gender Gap in Job Positions
67
Figure 2.4 Job Position Index by Age for Each University/Technical College Academic Field
1.53
2.37
4.09
5.09
6.28 7.27
8.03 8.29
7.76 7.96
1.20
2.35 3.55
4.06
5.64 6.56
6.87
6.66 7.68
5.28
0
200
400
600
800
1000
0
2
4
6
8
1020~
25~
30~
35~
40~
45~
50~
55~
60~
65~
70~
Num
ber
of R
espo
nses
Job
Posi
tion
Inde
xJob Position Index by Age for Science Field (Single Answer)
0.11
1.66
2.66
4.19 4.90
6.60 7.32
7.78
7.89 7.51 7.61
1.62 2.16
3.61
4.72 5.26
6.30
6.95
8.57 8.40
0
200
400
600
800
1000
0
2
4
6
8
10
20~
25~
30~
35~
40~
45~
50~
55~
60~
65~
70~
Num
ber
of R
espo
nses
Job
Posi
tion
Inde
x
Job Position Index by Age for Engineering Field (Single Answer)
1.16 1.90
2.90
4.38
5.70 6.82
7.66 8.06
7.83
8.01
0.11 1.25 1.46
2.21 3.36
4.10
6.08 6.32
6.54
7.99
4.33
0
200
400
600
800
1000
0
2
4
6
8
10
20~
25~
30~
35~
40~
45~
50~
55~
60~
65~
70~
Num
ber
of R
espo
nses
Job
Posi
tion
Inde
x
Job Position Index by Age for Life Science/Biology Field
(Single Answer)
2.35 1.82
2.30
3.66
4.93
6.51 7.47
8.03 7.68
7.77
8.40
1.34 2.12
3.45
4.83 5.53
4.82
6.86 7.08
8.40
8.40
0
200
400
600
800
1000
0
2
4
6
8
10
20~
25~
30~
35~
40~
45~
50~
55~
60~
65~
70~
Num
ber
of R
espo
nses
Job
Posi
tion
Inde
x
Job Position Index by Age for Chemical/Material Engineering Field
(Single Answer)
1.45 1.89
3.50
4.64
6.18 7.20
7.89
8.37 8.81
8.70
1.31
2.06 2.98
4.30 4.66
6.22
8.05
7.62
8.40
0
200
400
600
800
1000
0
2
4
6
8
10
20~
25~
30~
35~
40~
45~
50~
55~
60~
65~
70~
Num
ber
of R
espo
nses
Job
Posi
tion
Inde
x
Job Position Index by Age for Agriculture Field (Single Answer)
1.74 2.11
2.93
4.47
5.53
7.02
7.85 8.00
6.72
8.63
1.65 1.71
2.64 3.34
4.61 5.58
5.83
6.59
7.30 7.71
0
200
400
600
800
1000
0
2
4
6
8
10
20~
25~
30~
35~
40~
45~
50~
55~
60~
65~
70~
Num
ber
of R
espo
nses
Job
Posi
tion
Inde
x
Job Position Index by Age for Health (Medicine, Dentistry and
Pharmacology) Field (Single Answer)
Responses: MaleResponses: FemaleJob Position Index: MaleJob Position Index: Female

Chapter 2 Important Issues: Gender Gap in Job Positions
68
Years of Employment as a Female Faculty (Lecturer or above) in University/Technical College (Figure 2.5)
The number of years a female has been employed as a faculty member is shown in Figure 2.5. Ratio of females that have been employed at their current faculty post from one to fewer than ten years range between 19% and 32% with 25% being the average. Years of employment for female faculties are gradually up since the previous survey and the range indicates female hiring is progressing in recent years. Ratio of female faculties that have been at their post for ten years or more is 19% and years of employment are up from the previous survey.
Figure 2.5 Percentage of Active Female Faculties (Lecturer or above)
in University/Technical College (Single Answer) Years Elapsed Since Acquiring Degree and Current Occupation (Figure 2.6)
The elapsed years and current occupation have been organized by gender (Figure 2.6).
Summarizing the status of limited-term NPI and limited-term researcher (postdoc), for both limited-term NPI and limited-term researcher and for both genders, 70% or more have had their doctoral degree for less than ten years. After acquiring a degree, many initially start with limited-term employment, but as years pass from six to fifteen years, no-term employment and limited-term employment reaches the same level. At sixteen years or more, about 10% are under limited-term employment regardless of gender. Comparing the genders, there is no clear difference between the genders until ten years have passed after degree acquisition. Beyond ten years, female ratio of limited-term employment is higher than of the male suggesting females spend more years under limited-term employment than males.
19.0%21.2%
19.0%28.3%
28.5%
23.3%25.8%
22.2%
31.9%29.7%
0%
20%
40%
60%
80%
100%
0
500
1000
1500
2000
250010
or m
ore
1~le
ss th
an 1
0
1~le
ss th
an 9
1~le
ss th
an 8
1~le
ss th
an7
1~le
ss th
an 6
1~le
ss th
an 5
1~le
ss th
an 4
1~le
ss th
an 3
1~le
ss th
an 2
Fem
ale
Ratio
(%
)
Num
ber
of R
espo
nses
Number of Years at Present Post
MalesFemalesFemale Ratio
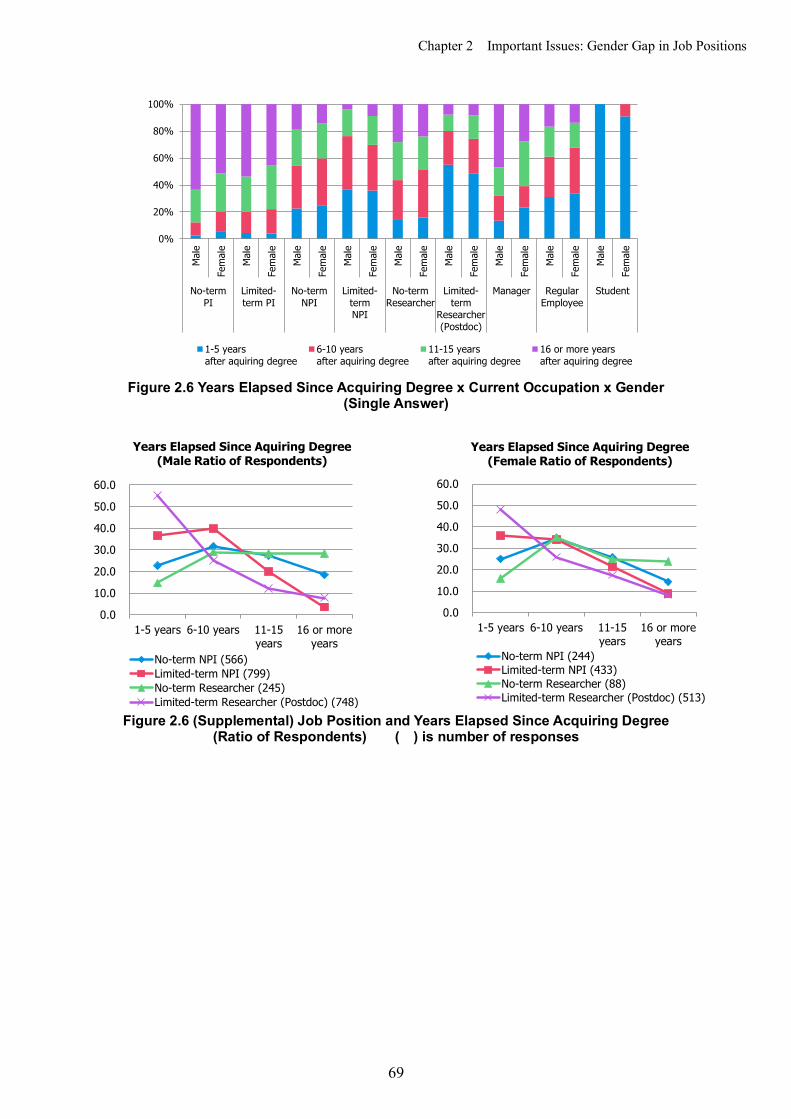
Chapter 2 Important Issues: Gender Gap in Job Positions
69
Figure 2.6 Years Elapsed Since Acquiring Degree x Current Occupation x Gender
(Single Answer)
Figure 2.6 (Supplemental) Job Position and Years Elapsed Since Acquiring Degree
(Ratio of Respondents) ( ) is number of responses
0%
20%
40%
60%
80%
100%
Mal
e
Fem
ale
Mal
e
Fem
ale
Mal
e
Fem
ale
Mal
e
Fem
ale
Mal
e
Fem
ale
Mal
e
Fem
ale
Mal
e
Fem
ale
Mal
e
Fem
ale
Mal
e
Fem
ale
No-termPI
Limited-term PI
No-termNPI
Limited-termNPI
No-termResearcher
Limited-term
Researcher(Postdoc)
Manager RegularEmployee
Student
1-5 yearsafter aquiring degree
6-10 yearsafter aquiring degree
11-15 yearsafter aquiring degree
16 or more yearsafter aquiring degree
0.0
10.0
20.0
30.0
40.0
50.0
60.0
1-5 years 6-10 years 11-15years
16 or moreyears
Years Elapsed Since Aquiring Degree (Male Ratio of Respondents)
No-term NPI (566)Limited-term NPI (799)No-term Researcher (245)Limited-term Researcher (Postdoc) (748)
0.0
10.0
20.0
30.0
40.0
50.0
60.0
1-5 years 6-10 years 11-15years
16 or moreyears
Years Elapsed Since Aquiring Degree (Female Ratio of Respondents)
No-term NPI (244)Limited-term NPI (433)No-term Researcher (88)Limited-term Researcher (Postdoc) (513)

Chapter 3 Important Issues: Child and Nursing Cares
70
Chapter 3 Important Issues: Child and Nursing Cares In order for the male and female to balance work and family together, raising awareness and improving the environment are very important. This chapter analyzes in detail the actual condition of “child and nursing cares”, an area in which a great gender gap exists.
Number of Children (Figures 3.1-2) (Figure 3.1) There is almost no difference between the genders in the hours spent at the workplace for parents with no children or children of high school age and above, but there is a clear difference among parents with preschool to middle school children.
Especially for those with elementary school children, there is an average difference of 9.0 hours between genders.
Figure 3.1 Hours Spent at Workplace by Children’s Age Group (Single Answer)
49.2 46.6 48.6 48.1 45.9
0
10
20
30
40
50
60
0%
20%
40%
60%
80%
100%
None
Pre-
scho
ol
Elem
enta
rySc
hool
Mid
dle
Scho
ol
High
Sch
ool
or O
lder
Male
Less than 10 Hrs 10 Hrs∼20 Hrs∼ 30 Hrs∼40 Hrs∼ 50 Hrs∼60 Hrs∼ 70 Hrs∼80 Hrs∼ 90 Hrs∼Average
48.0
38.7 39.6 41.7 46.0
0
10
20
30
40
50
60
0%
20%
40%
60%
80%
100%
None
Pre-
scho
ol
Elem
enta
rySc
hool
Mid
dle
Scho
ol
High
Sch
ool
or O
lder
Female
Less than 10 Hrs 10 Hrs∼20 Hrs∼ 30 Hrs∼40 Hrs∼ 50 Hrs∼60 Hrs∼ 70 Hrs∼80 Hrs∼ 90 Hrs∼Average

Chapter 3 Important Issues: Child and Nursing Cares
71
(Figure 3.2) For females, there is very little correlation between annual salary and the number of children, while for males, the number of children increases proportionally with annual salary. This is similar to the third survey (Figure 3.2).
Figure 3.2 Annual Salary and Number of Children (respondents in their late 30’s)
(Single Answer)
0.86 0.83
0.00
0.56 0.28
0.49
0.77 0.88
1.18 1.29
1.48
0.61
1.44
0.94 0.88
0.60
0.92
0.74
0.88
0.62 0.83
1.00
0.00
0.50
1.00
1.50
2.00
2.50
04080
120160200240280320360
Unan
swer
edLe
ss th
an 1
Milli
on J
PY1
Milli
on J
PY∼
2 M
illion
JPY∼
3 M
illion
JPY∼
4 M
illion
JPY∼
5 M
illion
JPY∼
6 M
illion
JPY∼
7 M
illion
JPY∼
8 M
illion
JPY∼
10 M
illion
JPY∼
Aver
age
Num
ber
of C
hild
ren
Num
ber
of R
espo
nses
University/Technical College
0.75
1.00
0.00 0.00
0.38 0.77
0.95 1.11
1.15
1.64
2.50
0.78
0.50
0.71
0.89 0.86
0.69 0.82 0.82
0.80
0.00
0.50
1.00
1.50
2.00
2.50
0
10
20
30
40
50
60
70
80
Unan
swer
edLe
ss th
an 1
Milli
on J
PY1
Milli
on J
PY∼
2 M
illion
JPY∼
3 M
illion
JPY∼
4 M
illion
JPY∼
5 M
illion
JPY∼
6 M
illion
JPY∼
7 M
illion
JPY∼
8 M
illion
JPY∼
10 M
illion
JPY∼
Aver
age
Num
ber
of C
hild
ren
Num
ber
of R
espo
nses
Research Institution
1.28
0.75
2.00
0.50
0.27
0.78 0.78 0.96
1.19
1.14
1.32
0.60
0.00 0.33
0.80 0.81 0.87
1.20
0.87 0.64
0.50
0.00
0.50
1.00
1.50
2.00
2.50
0102030405060708090
100
Unan
swer
edLe
ss th
an 1
Milli
on J
PY1
Milli
on J
PY∼
2 M
illion
JPY∼
3 M
illion
JPY∼
4 M
illion
JPY∼
5 M
illion
JPY∼
6 M
illion
JPY∼
7 M
illion
JPY∼
8 M
illion
JPY∼
10 M
illion
JPY∼
Aver
age
Num
ber
of C
hild
ren
Num
ber
of R
espo
nses
Corporation
Male: ResponsesFemale: ResponsesMale: Average Number of ChildrenFemale: Average Number of Children
0.95
0.75
0.25 0.40
0.29 0.59
0.84 0.93
1.17 1.29
1.53
0.64
0.89 0.88 0.82 0.74
0.89
0.77 0.92 0.72
0.76
0.82
0.00
0.50
1.00
1.50
2.00
2.50
050
100150200250300350400450500
Unan
swer
edLe
ss th
an 1
Milli
on J
PY1
Milli
on J
PY∼
2 M
illion
JPY∼
3 M
illion
JPY∼
4 M
illion
JPY∼
5 M
illion
JPY∼
6 M
illion
JPY∼
7 M
illion
JPY∼
8 M
illion
JPY∼
10 M
illion
JPY∼
Aver
age
Num
ber
of C
hild
ren
Num
ber
of R
espo
nses
Overall
Male: ResponsesFemale: ResponsesMale: Average Number of ChildrenFemale: Average Number of Children

Chapter 3 Important Issues: Child and Nursing Cares
72
Childcare Leave (Figures 3.3-6) (Figure 3.3-6) Overall, for females, lower the children’s age, higher the numbers of those that take childcare leave. The ratio of females working for corporations that take leave was higher than those working at university/technical college or research institutions. Although the ratio of males that take leave is very low, there was a slight increase compared to the third survey (Figure 3.3).
Figure 3.3 Taking Childcare Leave (Single Answer)
0% 20% 40% 60% 80% 100%
Pre-school
Elementary School
Middle School
High School or Older
University/Technical College: Male
Took leave as requestedTook leave, but not as requestedDid not take leave
0% 20% 40% 60% 80% 100%
Pre-school
Elementary School
Middle School
High School or Older
University/Technical College: Female
Took leave as requestedTook leave, but not as requestedDid not take leave
0% 20% 40% 60% 80% 100%
Pre-school
Elementary School
Middle School
High School or Older
Research Institution: Male
Took leave as requestedTook leave, but not as requestedDid not take leave
0% 20% 40% 60% 80% 100%
Pre-school
Elementary School
Middle School
High School or Older
Research Institution: Female
Took leave as requestedTook leave, but not as requestedDid not take leave
0% 20% 40% 60% 80% 100%
Pre-school
Elementary School
Middle School
High School or Older
Corporation: Male
Took leave as requestedTook leave, but not as requestedDid not take leave
0% 20% 40% 60% 80% 100%
Pre-school
Elementary School
Middle School
High School or Older
Corporation: Female
Took leave as requestedTook leave, but not as requestedDid not take leave
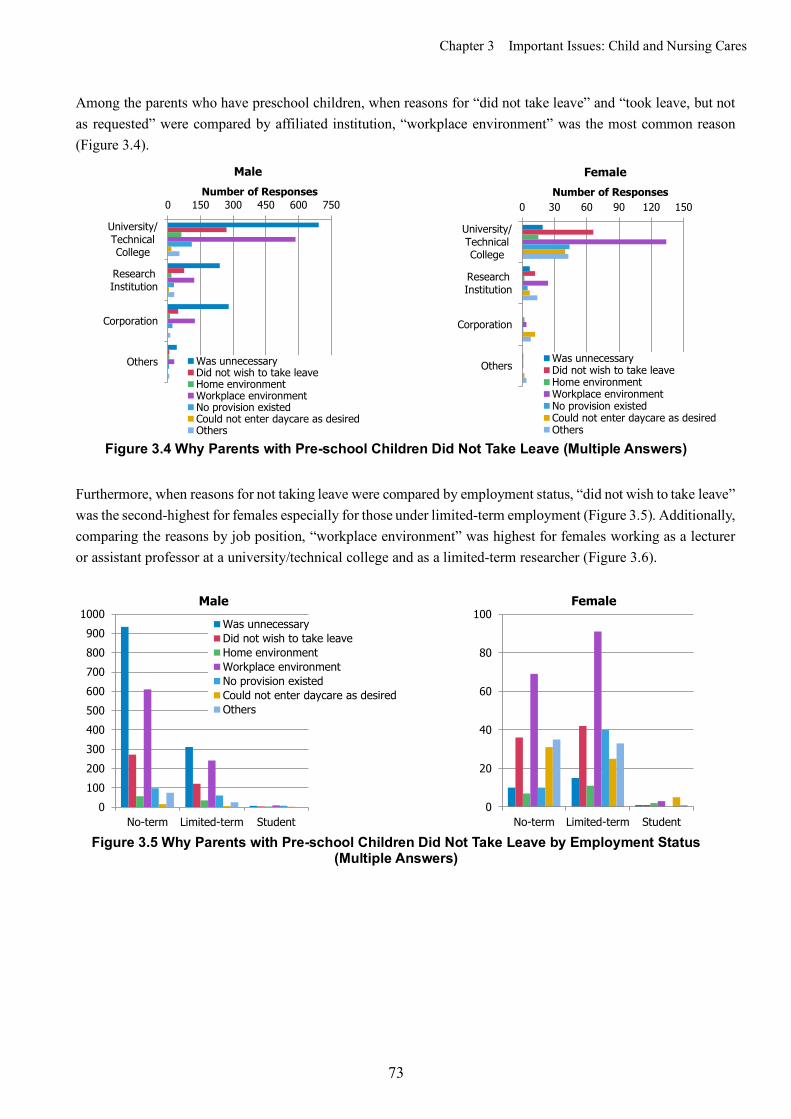
Chapter 3 Important Issues: Child and Nursing Cares
73
Among the parents who have preschool children, when reasons for “did not take leave” and “took leave, but not as requested” were compared by affiliated institution, “workplace environment” was the most common reason (Figure 3.4).
Figure 3.4 Why Parents with Pre-school Children Did Not Take Leave (Multiple Answers)
Furthermore, when reasons for not taking leave were compared by employment status, “did not wish to take leave” was the second-highest for females especially for those under limited-term employment (Figure 3.5). Additionally, comparing the reasons by job position, “workplace environment” was highest for females working as a lecturer or assistant professor at a university/technical college and as a limited-term researcher (Figure 3.6).
Figure 3.5 Why Parents with Pre-school Children Did Not Take Leave by Employment Status
(Multiple Answers)
0 150 300 450 600 750
University/TechnicalCollege
ResearchInstitution
Corporation
Others
Number of Responses
Male
Was unnecessaryDid not wish to take leaveHome environmentWorkplace environmentNo provision existedCould not enter daycare as desiredOthers
0 30 60 90 120 150
University/TechnicalCollege
ResearchInstitution
Corporation
Others
Number of Responses
Female
Was unnecessaryDid not wish to take leaveHome environmentWorkplace environmentNo provision existedCould not enter daycare as desiredOthers
0100200300400500600700800900
1000
No-term Limited-term Student
Male
Was unnecessaryDid not wish to take leaveHome environmentWorkplace environmentNo provision existedCould not enter daycare as desiredOthers
0
20
40
60
80
100
No-term Limited-term Student
Female
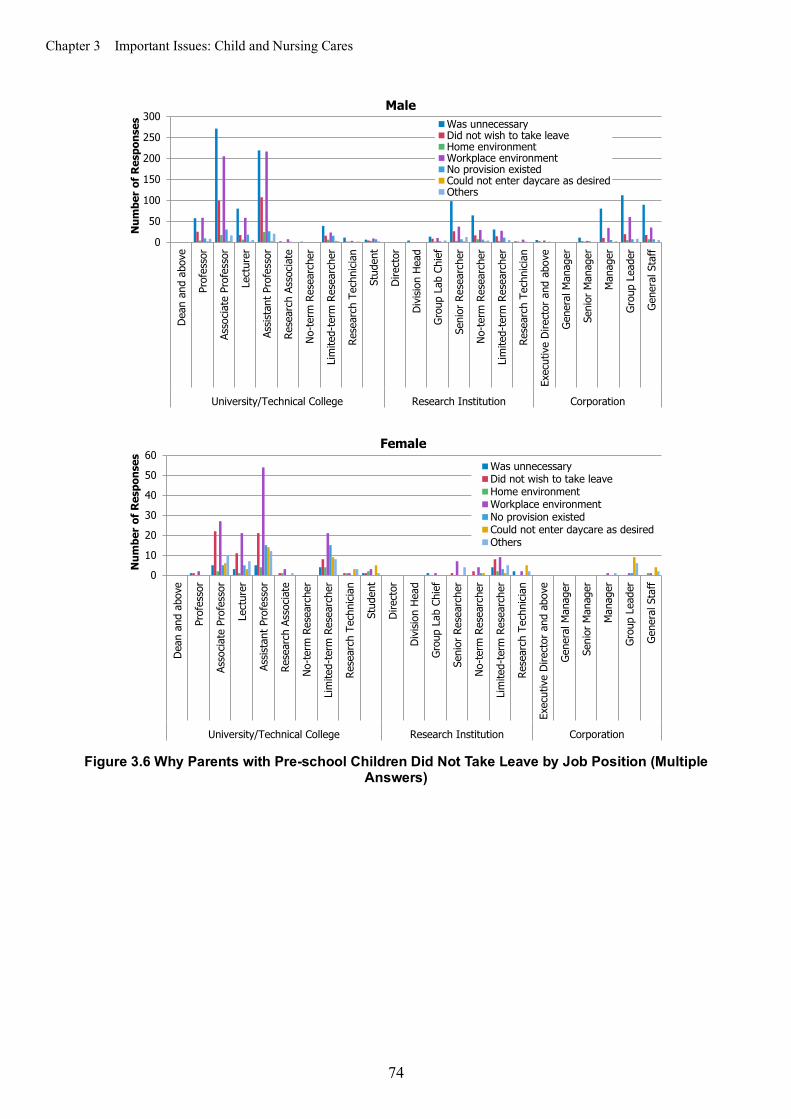
Chapter 3 Important Issues: Child and Nursing Cares
74
Figure 3.6 Why Parents with Pre-school Children Did Not Take Leave by Job Position (Multiple
Answers)
0
50
100
150
200
250
300
Dean
and
abo
ve
Prof
esso
r
Asso
ciate
Pro
fess
or
Lect
urer
Assis
tant
Pro
fess
or
Rese
arch
Ass
ocia
te
No-te
rm R
esea
rche
r
Lim
ited-
term
Res
earc
her
Rese
arch
Tec
hnici
an
Stud
ent
Dire
ctor
Divis
ion
Head
Grou
p La
b Ch
ief
Seni
or R
esea
rche
r
No-te
rm R
esea
rche
r
Lim
ited-
term
Res
earc
her
Rese
arch
Tec
hnici
an
Exec
utiv
e Di
rect
or a
nd a
bove
Gene
ral M
anag
er
Seni
or M
anag
er
Man
ager
Grou
p Le
ader
Gene
ral S
taff
University/Technical College Research Institution Corporation
Num
ber
of R
espo
nses
MaleWas unnecessaryDid not wish to take leaveHome environmentWorkplace environmentNo provision existedCould not enter daycare as desiredOthers
0
10
20
30
40
50
60
Dean
and
abo
ve
Prof
esso
r
Asso
ciate
Pro
fess
or
Lect
urer
Assis
tant
Pro
fess
or
Rese
arch
Ass
ocia
te
No-te
rm R
esea
rche
r
Lim
ited-
term
Res
earc
her
Rese
arch
Tec
hnici
an
Stud
ent
Dire
ctor
Divis
ion
Head
Grou
p La
b Ch
ief
Seni
or R
esea
rche
r
No-te
rm R
esea
rche
r
Lim
ited-
term
Res
earc
her
Rese
arch
Tec
hnici
an
Exec
utiv
e Di
rect
or a
nd a
bove
Gene
ral M
anag
er
Seni
or M
anag
er
Man
ager
Grou
p Le
ader
Gene
ral S
taff
University/Technical College Research Institution Corporation
Num
ber
of R
espo
nses
FemaleWas unnecessaryDid not wish to take leaveHome environmentWorkplace environmentNo provision existedCould not enter daycare as desiredOthers
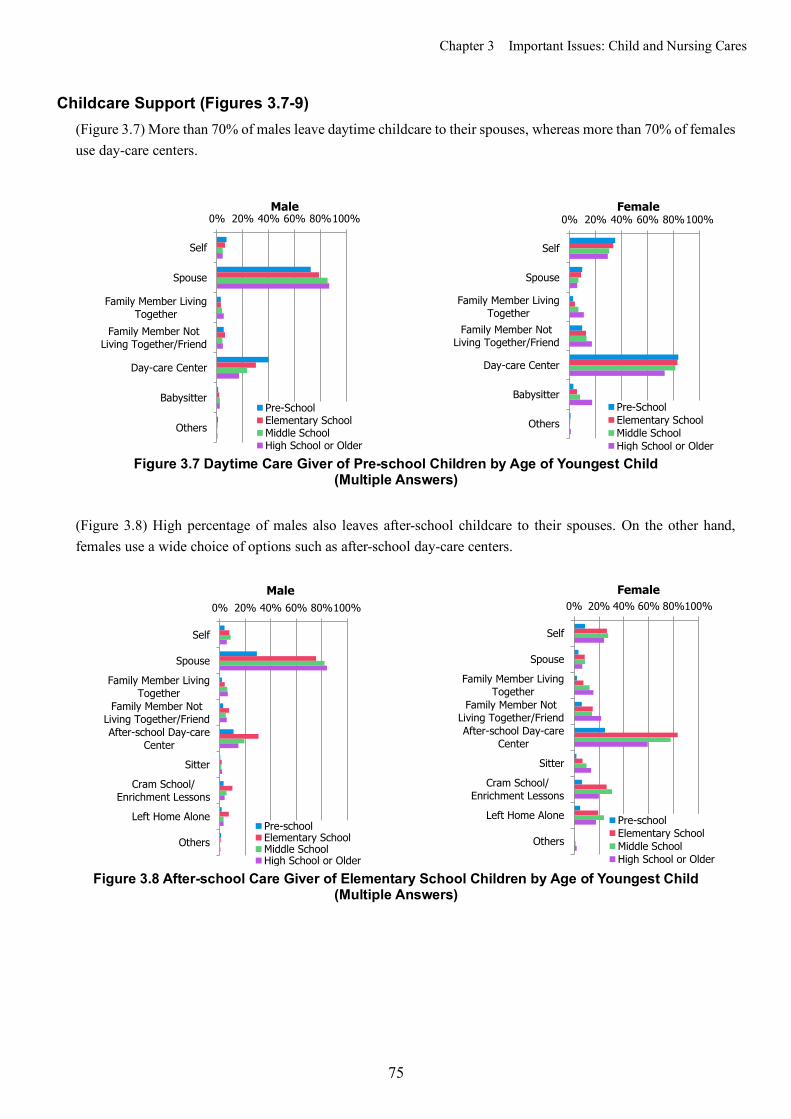
Chapter 3 Important Issues: Child and Nursing Cares
75
Childcare Support (Figures 3.7-9) (Figure 3.7) More than 70% of males leave daytime childcare to their spouses, whereas more than 70% of females use day-care centers.
Figure 3.7 Daytime Care Giver of Pre-school Children by Age of Youngest Child
(Multiple Answers)
(Figure 3.8) High percentage of males also leaves after-school childcare to their spouses. On the other hand, females use a wide choice of options such as after-school day-care centers.
Figure 3.8 After-school Care Giver of Elementary School Children by Age of Youngest Child
(Multiple Answers)
0% 20% 40% 60% 80%100%
Self
Spouse
Family Member LivingTogether
Family Member NotLiving Together/Friend
Day-care Center
Babysitter
Others
Male
Pre-SchoolElementary SchoolMiddle SchoolHigh School or Older
0% 20% 40% 60% 80%100%
Self
Spouse
Family Member LivingTogether
Family Member NotLiving Together/Friend
Day-care Center
Babysitter
Others
Female
Pre-SchoolElementary SchoolMiddle SchoolHigh School or Older
0% 20% 40% 60% 80%100%
Self
Spouse
Family Member LivingTogether
Family Member NotLiving Together/FriendAfter-school Day-care
Center
Sitter
Cram School/Enrichment Lessons
Left Home Alone
Others
Male
Pre-schoolElementary SchoolMiddle SchoolHigh School or Older
0% 20% 40% 60% 80%100%
Self
Spouse
Family Member LivingTogether
Family Member NotLiving Together/FriendAfter-school Day-care
Center
Sitter
Cram School/Enrichment Lessons
Left Home Alone
Others
Female
Pre-schoolElementary SchoolMiddle SchoolHigh School or Older
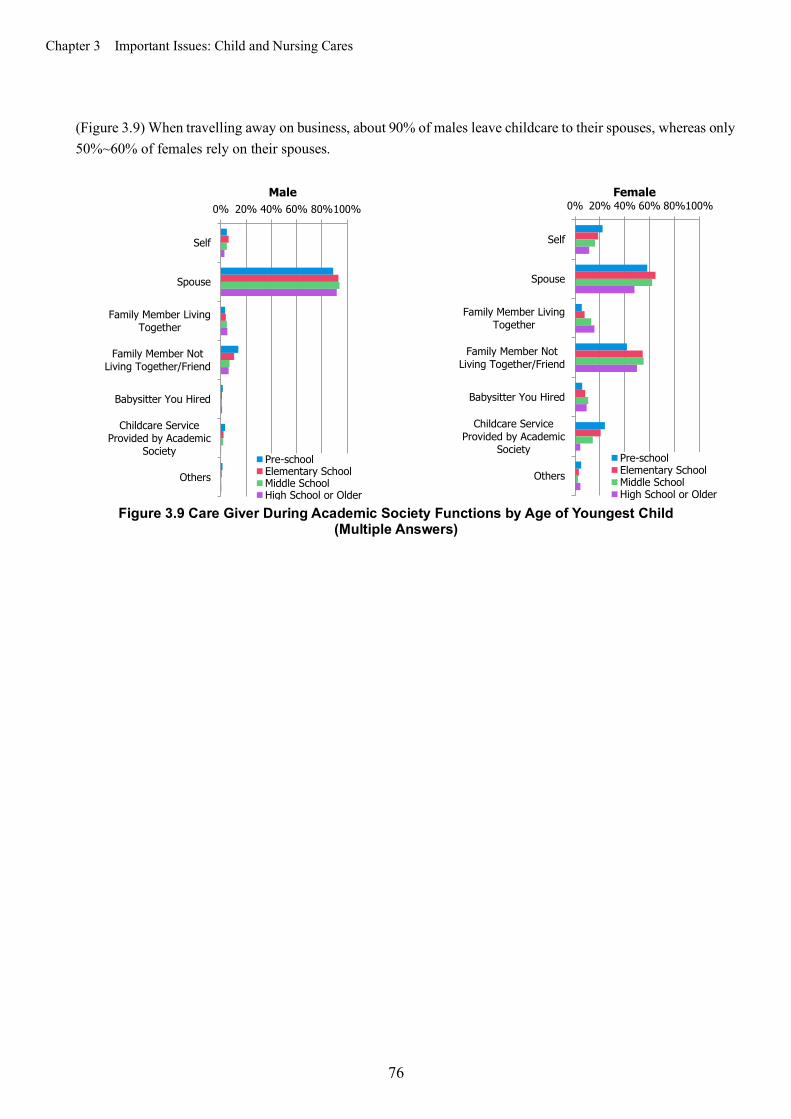
Chapter 3 Important Issues: Child and Nursing Cares
76
(Figure 3.9) When travelling away on business, about 90% of males leave childcare to their spouses, whereas only 50%~60% of females rely on their spouses.
Figure 3.9 Care Giver During Academic Society Functions by Age of Youngest Child
(Multiple Answers)
0% 20% 40% 60% 80%100%
Self
Spouse
Family Member LivingTogether
Family Member NotLiving Together/Friend
Babysitter You Hired
Childcare ServiceProvided by Academic
Society
Others
Male
Pre-schoolElementary SchoolMiddle SchoolHigh School or Older
0% 20% 40% 60% 80%100%
Self
Spouse
Family Member LivingTogether
Family Member NotLiving Together/Friend
Babysitter You Hired
Childcare ServiceProvided by Academic
Society
Others
Female
Pre-schoolElementary SchoolMiddle SchoolHigh School or Older

Chapter 3 Important Issues: Child and Nursing Cares
77
Experience Living Separately and Dual Career Support (Figures 3.10-15) Among married respondents, 28.3% of males and 49.7% of females have had experience living separately from their spouse.
(Figure 3.10) In case of males, those that never lived separately from their spouses and those that lived six or more years apart have slightly more children than the others. On the other hand, for females, there were no notable differences in the number of children between those with and without separate living experience or the number of years spent apart.
Figure 3.10 Length of Separation and Number of Children (Single Answer)
1.54 1.47 1.49 1.63 1.71
0.00.20.40.60.81.01.21.41.61.82.0
0%
20%
40%
60%
80%
100%
Neve
r
2 Ye
ars
or le
ss
3~5
Year
s
6~10
Yea
rs
11 Y
ears
or m
ore Aver
age
Num
ber
of C
hild
ren
Overall: Male
1.14 1.18 1.02 1.15 1.15
0.00.20.40.60.81.01.21.41.61.82.0
0%
20%
40%
60%
80%
100%
Neve
r
2 Ye
ars
or le
ss
3~5
Year
s
6~10
Yea
rs
11 Y
ears
or m
ore
Aver
age
Num
ber
of C
hild
ren
Overall: Female
1.58 1.58 1.63 1.94
1.74
0.00.20.40.60.81.01.21.41.61.82.0
0%
20%
40%
60%
80%
100%
Neve
r
2 Ye
ars
or le
ss
3~5
Year
s
6~10
Yea
rs
11 Y
ears
or m
ore
Aver
age
Num
ber
of C
hild
ren
Corporation: Male
1.06 1.02 1.08 1.10
0.70
0.00.20.40.60.81.01.21.41.61.82.0
0%
20%
40%
60%
80%
100%
Neve
r
2 Ye
ars
or le
ss
3~5
Year
s
6~10
Yea
rs
11 Y
ears
or m
ore
Aver
age
Num
ber
of C
hild
ren
Corporation: Female
1.53 1.44 1.42 1.49 1.70
0.00.20.40.60.81.01.21.41.61.82.0
0%
20%
40%
60%
80%
100%
Neve
r
2 Ye
ars
or le
ss
3~5
Year
s
6~10
Yea
rs
11 Y
ears
or m
ore
Aver
age
Num
ber
of C
hild
ren
Non-corporation: Male
0 1 2 3 4 5 6 7 8 Average
1.17 1.21 1.01
1.16 1.18
0.00.20.40.60.81.01.21.41.61.82.0
0%
20%
40%
60%
80%
100%
Neve
r
2 Ye
ars
or le
ss
3~5
Year
s
6~10
Yea
rs
11 Y
ears
or m
ore Av
erag
e N
umbe
r of
Chi
ldre
nNon-corporation: Female
0 1 2 3 4 5 6 7 8 Average

Chapter 3 Important Issues: Child and Nursing Cares
78
(Figure 3.11) Males working at public university and research institution have a longer average of years spent living separately compared with others. Females working at universities (public and private) have a longer average than other females. Furthermore, apart from those working for corporations, females spend longer living separately than males.
Figure 3.11 Length of Separation by Institution (Single Answer)
0.84
1.22
0.85
0.58
0.88 0.96
1.31
1.01 1.14
0.00.20.40.60.81.01.21.4
0
500
1000
1500
2000
2500Na
tiona
l Uni
vers
ity
Publ
ic Un
iver
sity
Priv
ate
Univ
ersit
y
Tech
nica
l Col
lege
Gove
rnm
ent
Publ
ic Re
sear
chIn
stitu
tion
Othe
r Res
earc
hIn
stitu
tion
Corp
orat
ion
Othe
rs Aver
age
Year
s of
Sep
arat
ion
Num
ber
of R
espo
nses
Male
Never 2 Years or less 3-5 Years 6-10 Years 11 Years or more Average
1.38
2.17 1.82
1.33 1.55 1.60 1.71
0.82
1.53
0.0
0.5
1.0
1.5
2.0
2.5
0
100
200
300
400
500
Natio
nal U
nive
rsity
Publ
ic Un
iver
sity
Priv
ate
Univ
ersit
y
Tech
nica
l Col
lege
Gove
rnm
ent
Publ
ic Re
sear
chIn
stitu
tion
Othe
r Res
earc
hIn
stitu
tion
Corp
orat
ion
Othe
rs Aver
age
Year
s of
Sep
arat
ion
Num
ber
of R
espo
nses
Female
Never 2 Years or less 3-5 Years 6-10 Years 11 Years or more Average
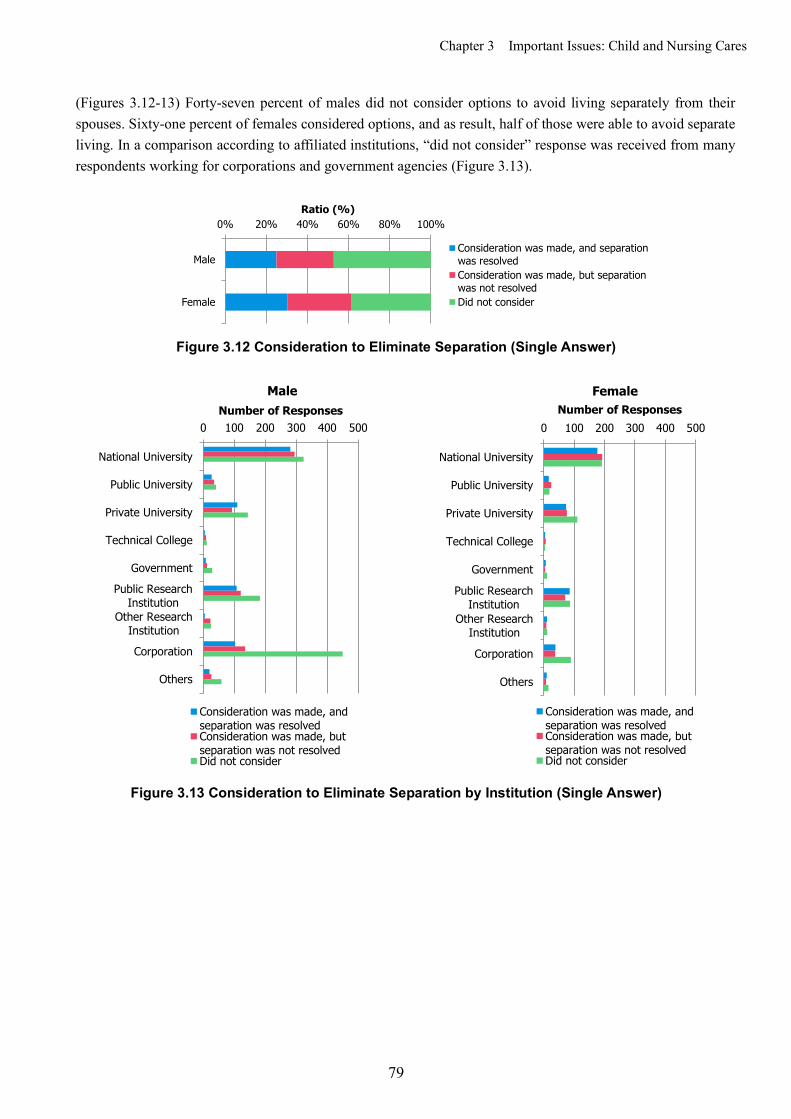
Chapter 3 Important Issues: Child and Nursing Cares
79
(Figures 3.12-13) Forty-seven percent of males did not consider options to avoid living separately from their spouses. Sixty-one percent of females considered options, and as result, half of those were able to avoid separate living. In a comparison according to affiliated institutions, “did not consider” response was received from many respondents working for corporations and government agencies (Figure 3.13).
Figure 3.12 Consideration to Eliminate Separation (Single Answer)
Figure 3.13 Consideration to Eliminate Separation by Institution (Single Answer)
0% 20% 40% 60% 80% 100%
Male
Female
Ratio (%)
Consideration was made, and separationwas resolvedConsideration was made, but separationwas not resolvedDid not consider
0 100 200 300 400 500
National University
Public University
Private University
Technical College
Government
Public ResearchInstitution
Other ResearchInstitution
Corporation
Others
Number of ResponsesMale
Consideration was made, andseparation was resolvedConsideration was made, butseparation was not resolvedDid not consider
0 100 200 300 400 500
National University
Public University
Private University
Technical College
Government
Public ResearchInstitution
Other ResearchInstitution
Corporation
Others
Number of ResponsesFemale
Consideration was made, andseparation was resolvedConsideration was made, butseparation was not resolvedDid not consider
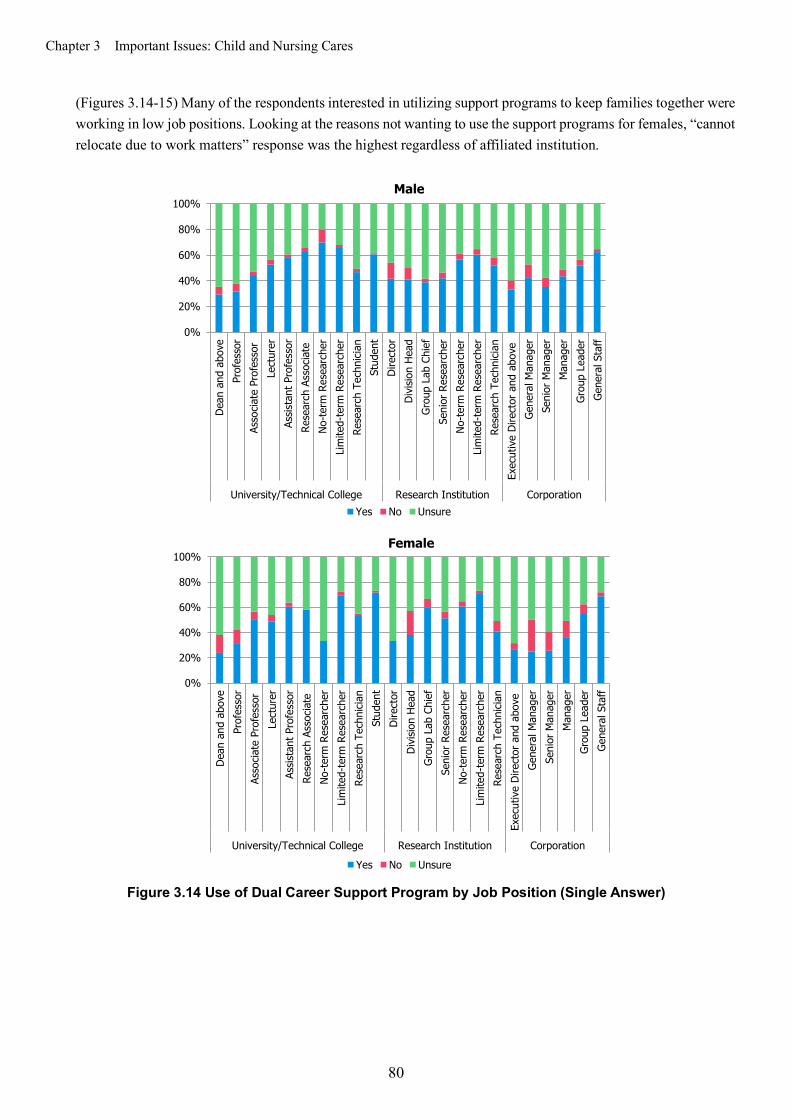
Chapter 3 Important Issues: Child and Nursing Cares
80
(Figures 3.14-15) Many of the respondents interested in utilizing support programs to keep families together were working in low job positions. Looking at the reasons not wanting to use the support programs for females, “cannot relocate due to work matters” response was the highest regardless of affiliated institution.
Figure 3.14 Use of Dual Career Support Program by Job Position (Single Answer)
0%
20%
40%
60%
80%
100%De
an a
nd a
bove
Prof
esso
rAs
socia
te P
rofe
ssor
Lect
urer
Assis
tant
Pro
fess
orRe
sear
ch A
ssoc
iate
No-te
rm R
esea
rche
rLi
mite
d-te
rm R
esea
rche
rRe
sear
ch T
echn
ician
Stud
ent
Dire
ctor
Divis
ion
Head
Grou
p La
b Ch
ief
Seni
or R
esea
rche
rNo
-term
Res
earc
her
Lim
ited-
term
Res
earc
her
Rese
arch
Tec
hnici
anEx
ecut
ive
Dire
ctor
and
abo
veGe
nera
l Man
ager
Seni
or M
anag
erM
anag
erGr
oup
Lead
erGe
nera
l Sta
ff
University/Technical College Research Institution Corporation
Male
Yes No Unsure
0%
20%
40%
60%
80%
100%
Dean
and
abo
vePr
ofes
sor
Asso
ciate
Pro
fess
orLe
ctur
erAs
sista
nt P
rofe
ssor
Rese
arch
Ass
ocia
teNo
-term
Res
earc
her
Lim
ited-
term
Res
earc
her
Rese
arch
Tec
hnici
anSt
uden
tDi
rect
orDi
visio
n He
adGr
oup
Lab
Chie
fSe
nior
Res
earc
her
No-te
rm R
esea
rche
rLi
mite
d-te
rm R
esea
rche
rRe
sear
ch T
echn
ician
Exec
utiv
e Di
rect
or a
nd a
bove
Gene
ral M
anag
erSe
nior
Man
ager
Man
ager
Grou
p Le
ader
Gene
ral S
taff
University/Technical College Research Institution Corporation
Female
Yes No Unsure
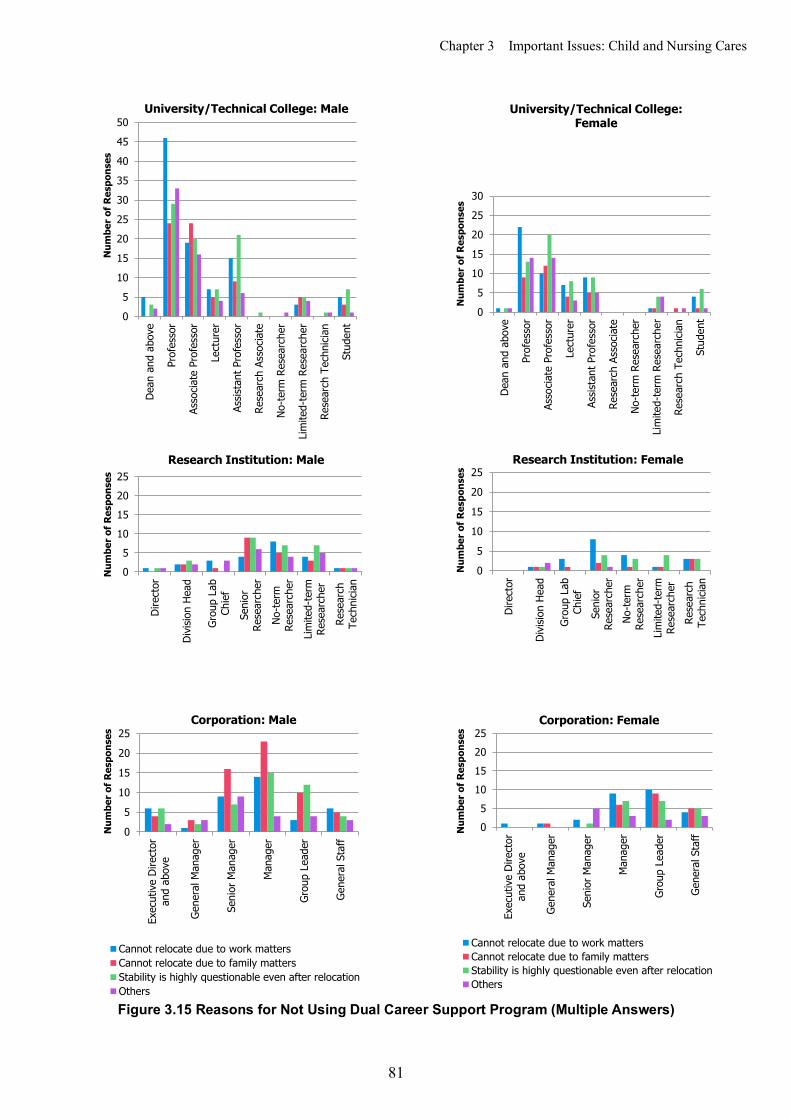
Chapter 3 Important Issues: Child and Nursing Cares
81
Figure 3.15 Reasons for Not Using Dual Career Support Program (Multiple Answers)
0
5
10
15
20
25
30
35
40
45
50
Dean
and
abo
ve
Prof
esso
r
Asso
ciate
Pro
fess
or
Lect
urer
Assis
tant
Pro
fess
or
Rese
arch
Ass
ocia
te
No-te
rm R
esea
rche
r
Lim
ited-
term
Res
earc
her
Rese
arch
Tec
hnici
an
Stud
ent
Num
ber o
f Res
pons
esUniversity/Technical College: Male
0
5
10
15
20
25
30
Dean
and
abo
ve
Prof
esso
r
Asso
ciate
Pro
fess
or
Lect
urer
Assis
tant
Pro
fess
or
Rese
arch
Ass
ocia
te
No-te
rm R
esea
rche
r
Lim
ited-
term
Res
earc
her
Rese
arch
Tec
hnici
an
Stud
ent
Num
ber o
f Res
pons
es
University/Technical College: Female
05
10152025
Dire
ctor
Divis
ion
Head
Grou
p La
bCh
ief
Seni
orRe
sear
cher
No-te
rmRe
sear
cher
Lim
ited-
term
Rese
arch
erRe
sear
chTe
chni
cian
Num
ber o
f Res
pons
es
Research Institution: Male
0
5
10
15
20
25
Dire
ctor
Divis
ion
Head
Grou
p La
bCh
ief
Seni
orRe
sear
cher
No-te
rmRe
sear
cher
Lim
ited-
term
Rese
arch
erRe
sear
chTe
chni
cian
Num
ber o
f Res
pons
esResearch Institution: Female
0
5
10
15
20
25
Exec
utive
Dire
ctor
and
abov
e
Gene
ral M
anag
er
Seni
or M
anag
er
Man
ager
Grou
p Le
ader
Gene
ral S
taff
Num
ber o
f Res
pons
es
Corporation: Male
Cannot relocate due to work mattersCannot relocate due to family mattersStability is highly questionable even after relocationOthers
05
10152025
Exec
utive
Dire
ctor
and
abov
e
Gene
ral M
anag
er
Seni
or M
anag
er
Man
ager
Grou
p Le
ader
Gene
ral S
taffN
umbe
r of R
espo
nses
Corporation: Female
Cannot relocate due to work mattersCannot relocate due to family mattersStability is highly questionable even after relocationOthers
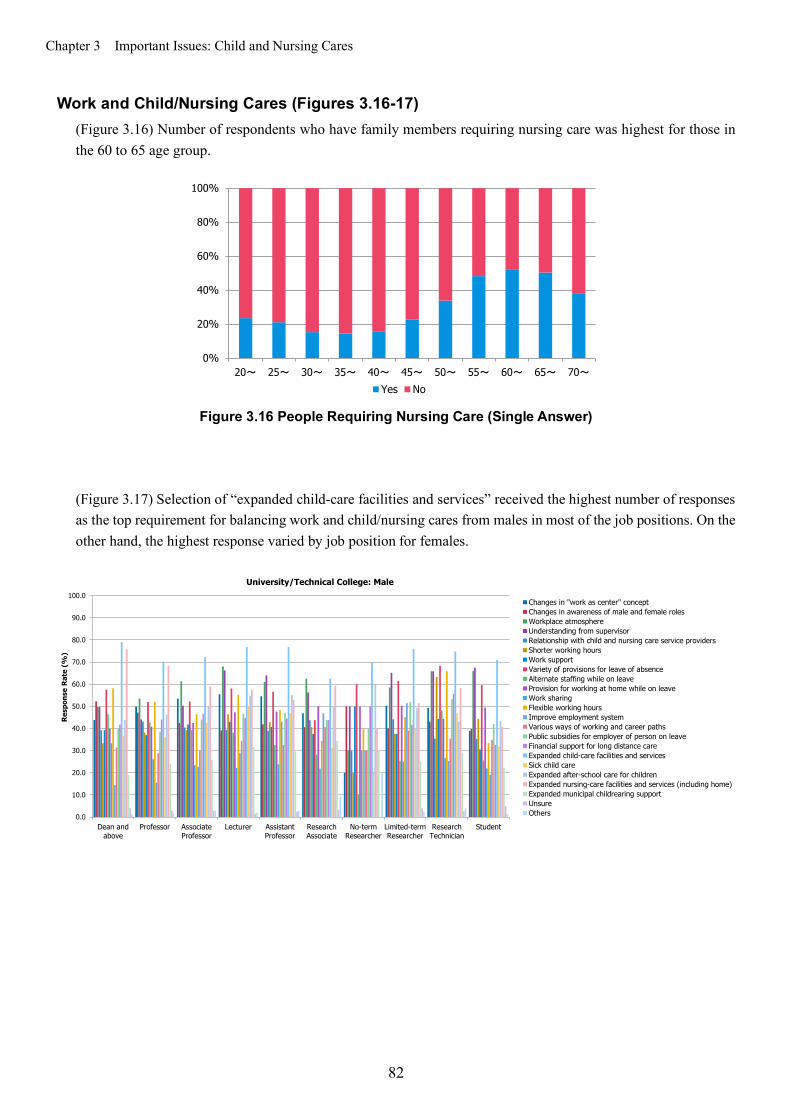
Chapter 3 Important Issues: Child and Nursing Cares
82
Work and Child/Nursing Cares (Figures 3.16-17) (Figure 3.16) Number of respondents who have family members requiring nursing care was highest for those in the 60 to 65 age group.
Figure 3.16 People Requiring Nursing Care (Single Answer)
(Figure 3.17) Selection of “expanded child-care facilities and services” received the highest number of responses as the top requirement for balancing work and child/nursing cares from males in most of the job positions. On the other hand, the highest response varied by job position for females.
0%
20%
40%
60%
80%
100%
20~ 25~ 30~ 35~ 40~ 45~ 50~ 55~ 60~ 65~ 70~Yes No
0.0
10.0
20.0
30.0
40.0
50.0
60.0
70.0
80.0
90.0
100.0
Dean andabove
Professor AssociateProfessor
Lecturer AssistantProfessor
ResearchAssociate
No-termResearcher
Limited-termResearcher
ResearchTechnician
Student
Resp
onse
Rat
e (%
)
University/Technical College: Male
Changes in "work as center" conceptChanges in awareness of male and female rolesWorkplace atmosphereUnderstanding from supervisorRelationship with child and nursing care service providersShorter working hoursWork supportVariety of provisions for leave of absenceAlternate staffing while on leaveProvision for working at home while on leaveWork sharingFlexible working hoursImprove employment systemVarious ways of working and career pathsPublic subsidies for employer of person on leaveFinancial support for long distance careExpanded child-care facilities and servicesSick child careExpanded after-school care for childrenExpanded nursing-care facilities and services (including home)Expanded municipal childrearing supportUnsureOthers

Chapter 3 Important Issues: Child and Nursing Cares
83
0.0
10.0
20.0
30.0
40.0
50.0
60.0
70.0
80.0
90.0
100.0
Dean andabove
Professor AssociateProfessor
Lecturer AssistantProfessor
ResearchAssociate
No-termResearcher
Limited-termResearcher
ResearchTechnician
Student
Resp
onse
Rat
e (%
)
University/Technical College: Female
Changes in "work as center" conceptChanges in awareness of male and female rolesWorkplace atmosphereUnderstanding from supervisorRelationship with child and nursing care service providersShorter working hoursWork supportVariety of provisions for leave of absenceAlternate staffing while on leaveProvision for working at home while on leaveWork sharingFlexible working hoursImprove employment systemVarious ways of working and career pathsPublic subsidies for employer of person on leaveFinancial support for long distance careExpanded child-care facilities and servicesSick child careExpanded after-school care for childrenExpanded nursing-care facilities and services (including home)Expanded municipal childrearing supportUnsureOthers
0.0
10.0
20.0
30.0
40.0
50.0
60.0
70.0
80.0
90.0
100.0
Director Division Head Group Lab Chief Senior Researcher No-termResearcher
Limited-termResearcher
ResearchTechnician
Resp
onse
Rat
e (%
)
Research Institution: Male
Changes in "work as center" conceptChanges in awareness of male and female rolesWorkplace atmosphereUnderstanding from supervisorRelationship with child and nursing care service providersShorter working hoursWork supportVariety of provisions for leave of absenceAlternate staffing while on leaveProvision for working at home while on leaveWork sharingFlexible working hoursImprove employment systemVarious ways of working and career pathsPublic subsidies for employer of person on leaveFinancial support for long distance careExpanded child-care facilities and servicesSick child careExpanded after-school care for childrenExpanded nursing-care facilities and services (including home)Expanded municipal childrearing supportUnsureOthers
0.0
10.0
20.0
30.0
40.0
50.0
60.0
70.0
80.0
90.0
100.0
Director Division Head Group Lab Chief Senior Researcher No-termResearcher
Limited-termResearcher
ResearchTechnician
Resp
onse
Rat
e (%
)
Research Institution: FemaleChanges in "work as center" conceptChanges in awareness of male and female rolesWorkplace atmosphereUnderstanding from supervisorRelationship with child and nursing care service providersShorter working hoursWork supportVariety of provisions for leave of absenceAlternate staffing while on leaveProvision for working at home while on leaveWork sharingFlexible working hoursImprove employment systemVarious ways of working and career pathsPublic subsidies for employer of person on leaveFinancial support for long distance careExpanded child-care facilities and servicesSick child careExpanded after-school care for childrenExpanded nursing-care facilities and services (including home)Expanded municipal childrearing supportUnsureOthers

Chapter 3 Important Issues: Child and Nursing Cares
84
Figure 3.17 Requirements for Balancing Work and Child/Nursing Care (Multiple Answers)
0.0
10.0
20.0
30.0
40.0
50.0
60.0
70.0
80.0
90.0
100.0
Executive Directorand above
General Manager Senior Manager Manager Group Leader General Staff
Resp
onse
Rat
e (%
)
Corporation: MaleChanges in "work as center" conceptChanges in awareness of male and female rolesWorkplace atmosphereUnderstanding from supervisorRelationship with child and nursing care service providersShorter working hoursWork supportVariety of provisions for leave of absenceAlternate staffing while on leaveProvision for working at home while on leaveWork sharingFlexible working hoursImprove employment systemVarious ways of working and career pathsPublic subsidies for employer of person on leaveFinancial support for long distance careExpanded child-care facilities and servicesSick child careExpanded after-school care for childrenExpanded nursing-care facilities and services (including home)Expanded municipal childrearing supportUnsureOthers
0.0
10.0
20.0
30.0
40.0
50.0
60.0
70.0
80.0
90.0
100.0
Executive Directorand above
General Manager Senior Manager Manager Group Leader General Staff
Resp
onse
Rat
e (%
)
Corporation: FemaleChanges in "work as center" conceptChanges in awareness of male and female rolesWorkplace atmosphereUnderstanding from supervisorRelationship with child and nursing care service providersShorter working hoursWork supportVariety of provisions for leave of absenceAlternate staffing while on leaveProvision for working at home while on leaveWork sharingFlexible working hoursImprove employment systemVarious ways of working and career pathsPublic subsidies for employer of person on leaveFinancial support for long distance careExpanded child-care facilities and servicesSick child careExpanded after-school care for childrenExpanded nursing-care facilities and services (including home)Expanded municipal childrearing supportUnsureOthers
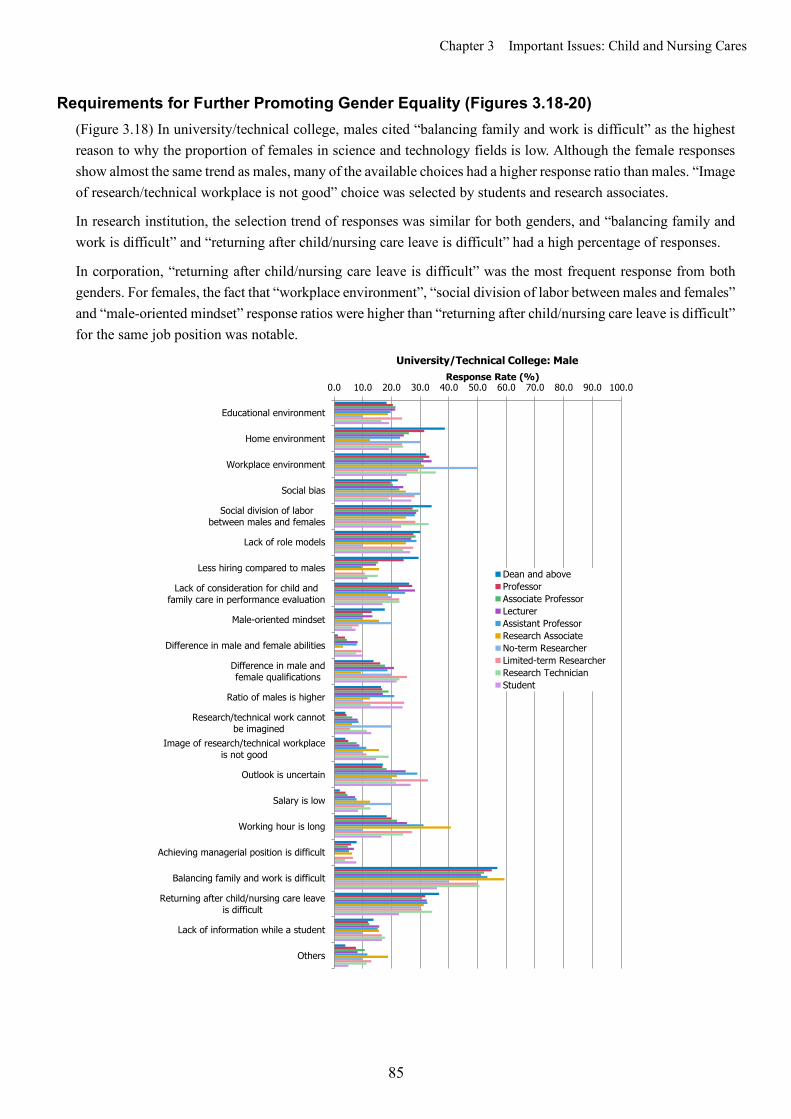
Chapter 3 Important Issues: Child and Nursing Cares
85
Requirements for Further Promoting Gender Equality (Figures 3.18-20) (Figure 3.18) In university/technical college, males cited “balancing family and work is difficult” as the highest reason to why the proportion of females in science and technology fields is low. Although the female responses show almost the same trend as males, many of the available choices had a higher response ratio than males. “Image of research/technical workplace is not good” choice was selected by students and research associates.
In research institution, the selection trend of responses was similar for both genders, and “balancing family and work is difficult” and “returning after child/nursing care leave is difficult” had a high percentage of responses.
In corporation, “returning after child/nursing care leave is difficult” was the most frequent response from both genders. For females, the fact that “workplace environment”, “social division of labor between males and females” and “male-oriented mindset” response ratios were higher than “returning after child/nursing care leave is difficult” for the same job position was notable.
0.0 10.0 20.0 30.0 40.0 50.0 60.0 70.0 80.0 90.0 100.0
Educational environment
Home environment
Workplace environment
Social bias
Social division of laborbetween males and females
Lack of role models
Less hiring compared to males
Lack of consideration for child andfamily care in performance evaluation
Male-oriented mindset
Difference in male and female abilities
Difference in male andfemale qualifications
Ratio of males is higher
Research/technical work cannotbe imagined
Image of research/technical workplaceis not good
Outlook is uncertain
Salary is low
Working hour is long
Achieving managerial position is difficult
Balancing family and work is difficult
Returning after child/nursing care leaveis difficult
Lack of information while a student
Others
Response Rate (%)University/Technical College: Male
Dean and aboveProfessorAssociate ProfessorLecturerAssistant ProfessorResearch AssociateNo-term ResearcherLimited-term ResearcherResearch TechnicianStudent
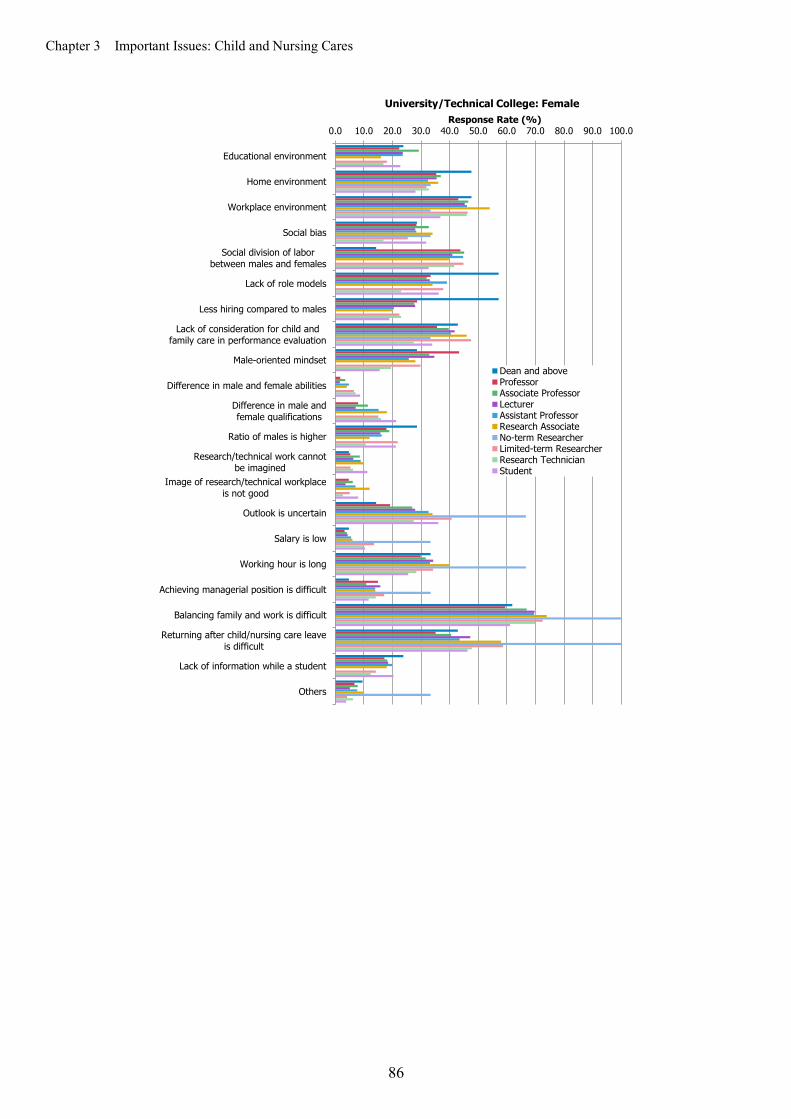
Chapter 3 Important Issues: Child and Nursing Cares
86
0.0 10.0 20.0 30.0 40.0 50.0 60.0 70.0 80.0 90.0 100.0
Educational environment
Home environment
Workplace environment
Social bias
Social division of laborbetween males and females
Lack of role models
Less hiring compared to males
Lack of consideration for child andfamily care in performance evaluation
Male-oriented mindset
Difference in male and female abilities
Difference in male andfemale qualifications
Ratio of males is higher
Research/technical work cannotbe imagined
Image of research/technical workplaceis not good
Outlook is uncertain
Salary is low
Working hour is long
Achieving managerial position is difficult
Balancing family and work is difficult
Returning after child/nursing care leaveis difficult
Lack of information while a student
Others
Response Rate (%)University/Technical College: Female
Dean and aboveProfessorAssociate ProfessorLecturerAssistant ProfessorResearch AssociateNo-term ResearcherLimited-term ResearcherResearch TechnicianStudent
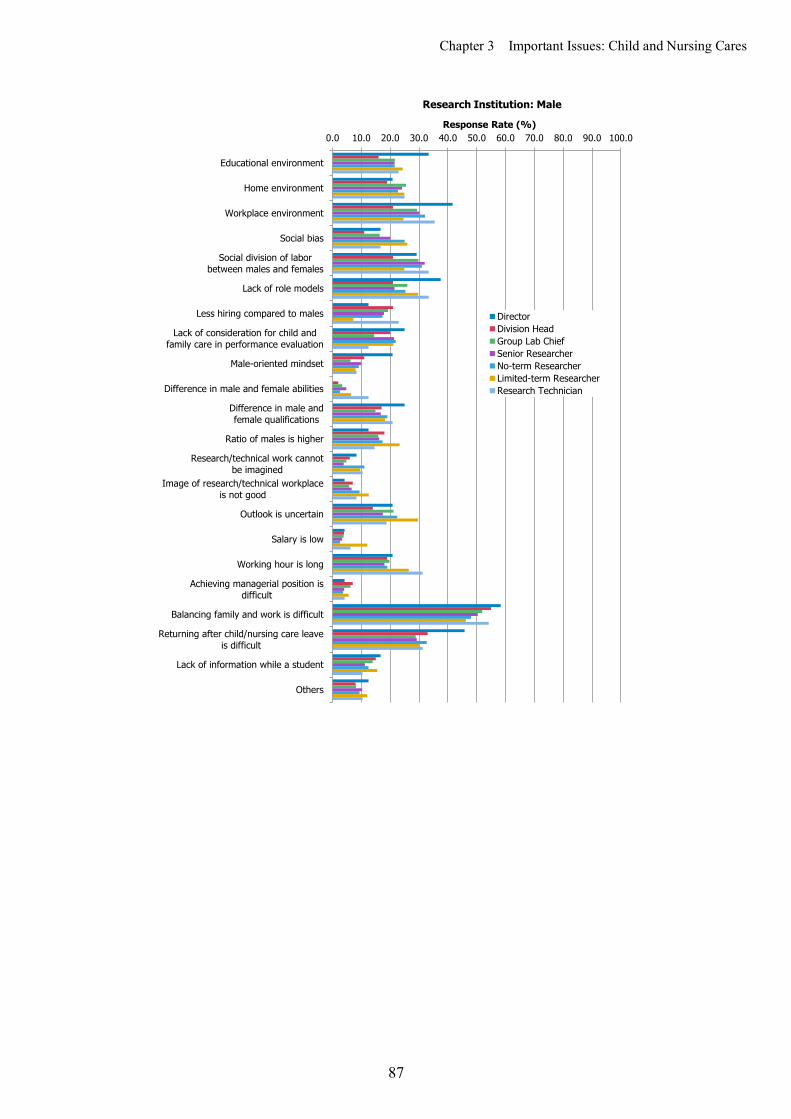
Chapter 3 Important Issues: Child and Nursing Cares
87
0.0 10.0 20.0 30.0 40.0 50.0 60.0 70.0 80.0 90.0 100.0
Educational environment
Home environment
Workplace environment
Social bias
Social division of laborbetween males and females
Lack of role models
Less hiring compared to males
Lack of consideration for child andfamily care in performance evaluation
Male-oriented mindset
Difference in male and female abilities
Difference in male andfemale qualifications
Ratio of males is higher
Research/technical work cannotbe imagined
Image of research/technical workplaceis not good
Outlook is uncertain
Salary is low
Working hour is long
Achieving managerial position isdifficult
Balancing family and work is difficult
Returning after child/nursing care leaveis difficult
Lack of information while a student
Others
Response Rate (%)
Research Institution: Male
DirectorDivision HeadGroup Lab ChiefSenior ResearcherNo-term ResearcherLimited-term ResearcherResearch Technician

Chapter 3 Important Issues: Child and Nursing Cares
88
0.0 10.0 20.0 30.0 40.0 50.0 60.0 70.0 80.0 90.0 100.0
Educational environment
Home environment
Workplace environment
Social bias
Social division of laborbetween males and females
Lack of role models
Less hiring compared to males
Lack of consideration for child andfamily care in performance evaluation
Male-oriented mindset
Difference in male and female abilities
Difference in male andfemale qualifications
Ratio of males is higher
Research/technical work cannotbe imagined
Image of research/technical workplaceis not good
Outlook is uncertain
Salary is low
Working hour is long
Achieving managerial position isdifficult
Balancing family and work is difficult
Returning after child/nursing care leaveis difficult
Lack of information while a student
Others
Response Rate (%)
Research Institution: Female
DirectorDivision HeadGroup Lab ChiefSenior ResearcherNo-term ResearcherLimited-term ResearcherResearch Technician
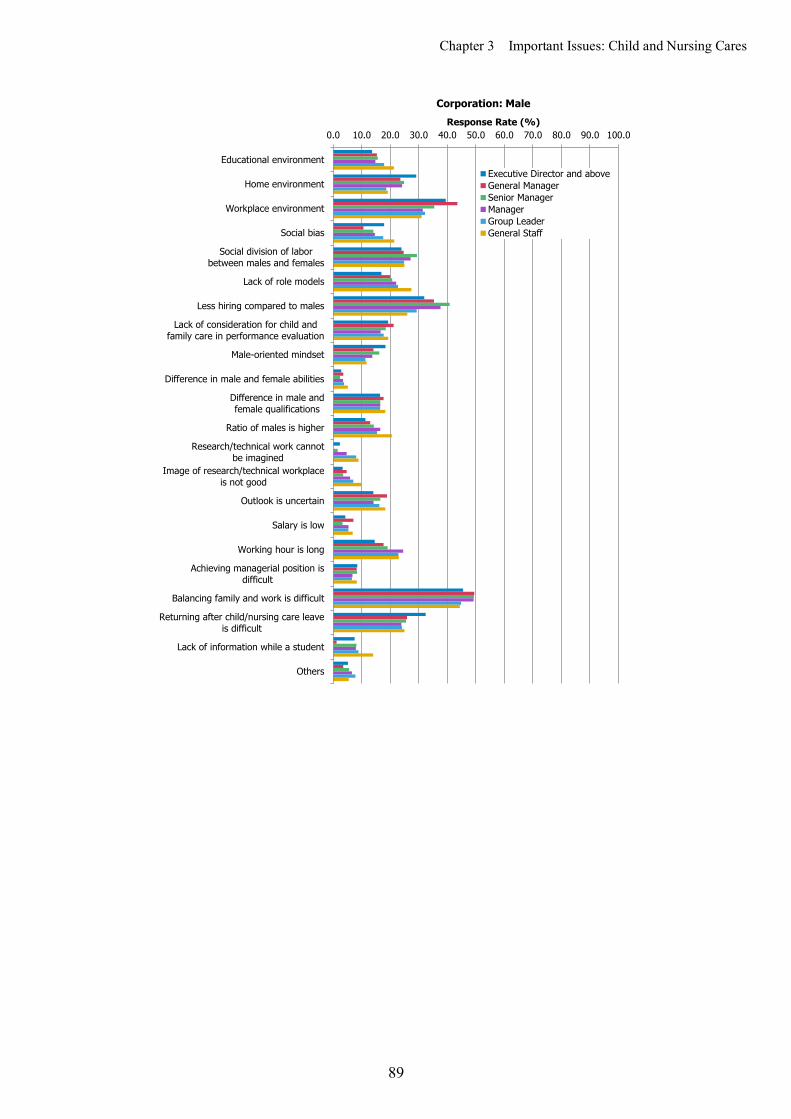
Chapter 3 Important Issues: Child and Nursing Cares
89
0.0 10.0 20.0 30.0 40.0 50.0 60.0 70.0 80.0 90.0 100.0
Educational environment
Home environment
Workplace environment
Social bias
Social division of laborbetween males and females
Lack of role models
Less hiring compared to males
Lack of consideration for child andfamily care in performance evaluation
Male-oriented mindset
Difference in male and female abilities
Difference in male andfemale qualifications
Ratio of males is higher
Research/technical work cannotbe imagined
Image of research/technical workplaceis not good
Outlook is uncertain
Salary is low
Working hour is long
Achieving managerial position isdifficult
Balancing family and work is difficult
Returning after child/nursing care leaveis difficult
Lack of information while a student
Others
Response Rate (%)
Corporation: Male
Executive Director and aboveGeneral ManagerSenior ManagerManagerGroup LeaderGeneral Staff
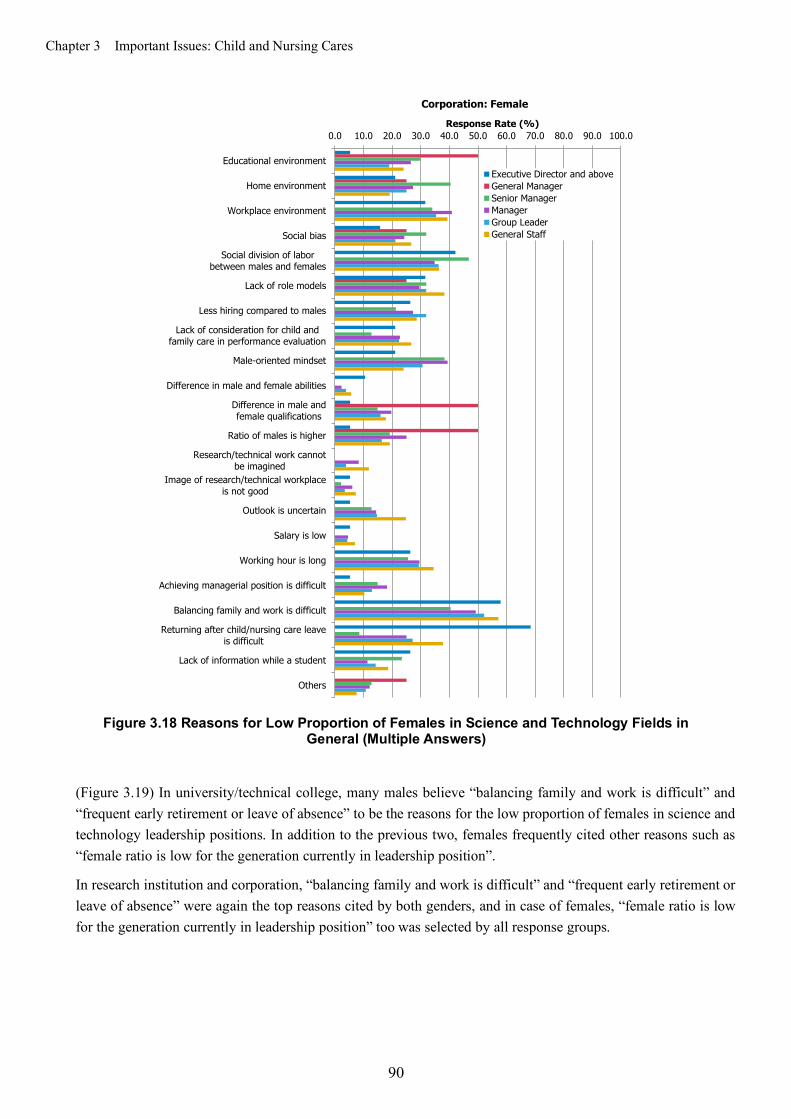
Chapter 3 Important Issues: Child and Nursing Cares
90
Figure 3.18 Reasons for Low Proportion of Females in Science and Technology Fields in
General (Multiple Answers)
(Figure 3.19) In university/technical college, many males believe “balancing family and work is difficult” and “frequent early retirement or leave of absence” to be the reasons for the low proportion of females in science and technology leadership positions. In addition to the previous two, females frequently cited other reasons such as “female ratio is low for the generation currently in leadership position”.
In research institution and corporation, “balancing family and work is difficult” and “frequent early retirement or leave of absence” were again the top reasons cited by both genders, and in case of females, “female ratio is low for the generation currently in leadership position” too was selected by all response groups.
0.0 10.0 20.0 30.0 40.0 50.0 60.0 70.0 80.0 90.0 100.0
Educational environment
Home environment
Workplace environment
Social bias
Social division of laborbetween males and females
Lack of role models
Less hiring compared to males
Lack of consideration for child andfamily care in performance evaluation
Male-oriented mindset
Difference in male and female abilities
Difference in male andfemale qualifications
Ratio of males is higher
Research/technical work cannotbe imagined
Image of research/technical workplaceis not good
Outlook is uncertain
Salary is low
Working hour is long
Achieving managerial position is difficult
Balancing family and work is difficult
Returning after child/nursing care leaveis difficult
Lack of information while a student
Others
Response Rate (%)
Corporation: Female
Executive Director and aboveGeneral ManagerSenior ManagerManagerGroup LeaderGeneral Staff

Chapter 3 Important Issues: Child and Nursing Cares
91
0.0 10.0 20.0 30.0 40.0 50.0 60.0 70.0 80.0 90.0100.0
Balancing family and work is difficult
Frequent early retirementor leave of absence
Females do not seek promotionas much as males
Lack of role models
Lack of consideration for child andfamily care in performance evaluation
Evaluators tend to give priority to males
Difference in male and femaleabilities/qualifications
Insufficient female performance
Female supervisors not desired
Female ratio is low for the generationcurrently in leadership position
Others
Response Rate (%)University/Technical College: Male
Dean and aboveProfessorAssociate ProfessorLecturerAssistant ProfessorResearch AssociateNo-term ResearcherLimited-term ResearcherResearch TechnicianStudent
0.0 10.0 20.0 30.0 40.0 50.0 60.0 70.0 80.0 90.0100.0
Balancing family and work is difficult
Frequent early retirementor leave of absence
Females do not seek promotionas much as males
Lack of role models
Lack of consideration for child andfamily care in performance evaluation
Evaluators tend to give priority to males
Difference in male and femaleabilities/qualifications
Insufficient female performance
Female supervisors not desired
Female ratio is low for the generation currentlyin leadership position
Others
Response Rate (%)University/Technical College: Female
Dean and aboveProfessorAssociate ProfessorLecturerAssistant ProfessorResearch AssociateNo-term ResearcherLimited-term ResearcherResearch TechnicianStudent
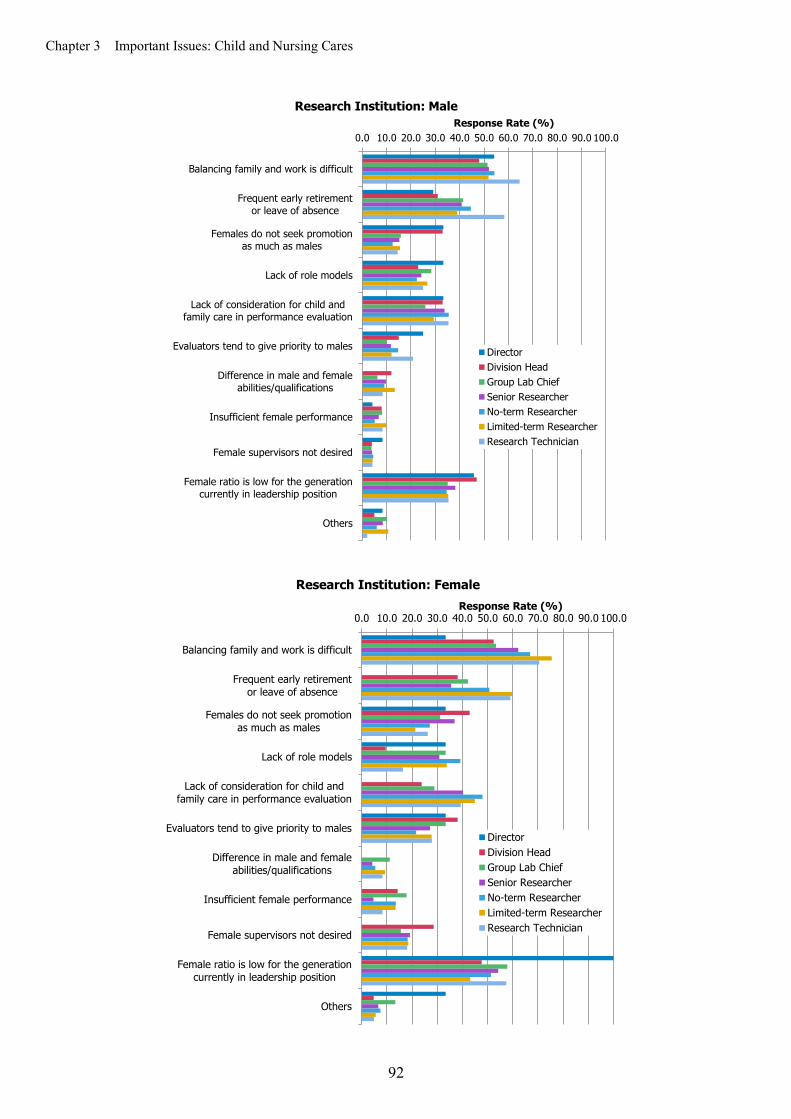
Chapter 3 Important Issues: Child and Nursing Cares
92
0.0 10.0 20.0 30.0 40.0 50.0 60.0 70.0 80.0 90.0 100.0
Balancing family and work is difficult
Frequent early retirementor leave of absence
Females do not seek promotionas much as males
Lack of role models
Lack of consideration for child andfamily care in performance evaluation
Evaluators tend to give priority to males
Difference in male and femaleabilities/qualifications
Insufficient female performance
Female supervisors not desired
Female ratio is low for the generationcurrently in leadership position
Others
Response Rate (%)Research Institution: Male
DirectorDivision HeadGroup Lab ChiefSenior ResearcherNo-term ResearcherLimited-term ResearcherResearch Technician
0.0 10.0 20.0 30.0 40.0 50.0 60.0 70.0 80.0 90.0 100.0
Balancing family and work is difficult
Frequent early retirementor leave of absence
Females do not seek promotionas much as males
Lack of role models
Lack of consideration for child andfamily care in performance evaluation
Evaluators tend to give priority to males
Difference in male and femaleabilities/qualifications
Insufficient female performance
Female supervisors not desired
Female ratio is low for the generationcurrently in leadership position
Others
Response Rate (%)
Research Institution: Female
DirectorDivision HeadGroup Lab ChiefSenior ResearcherNo-term ResearcherLimited-term ResearcherResearch Technician
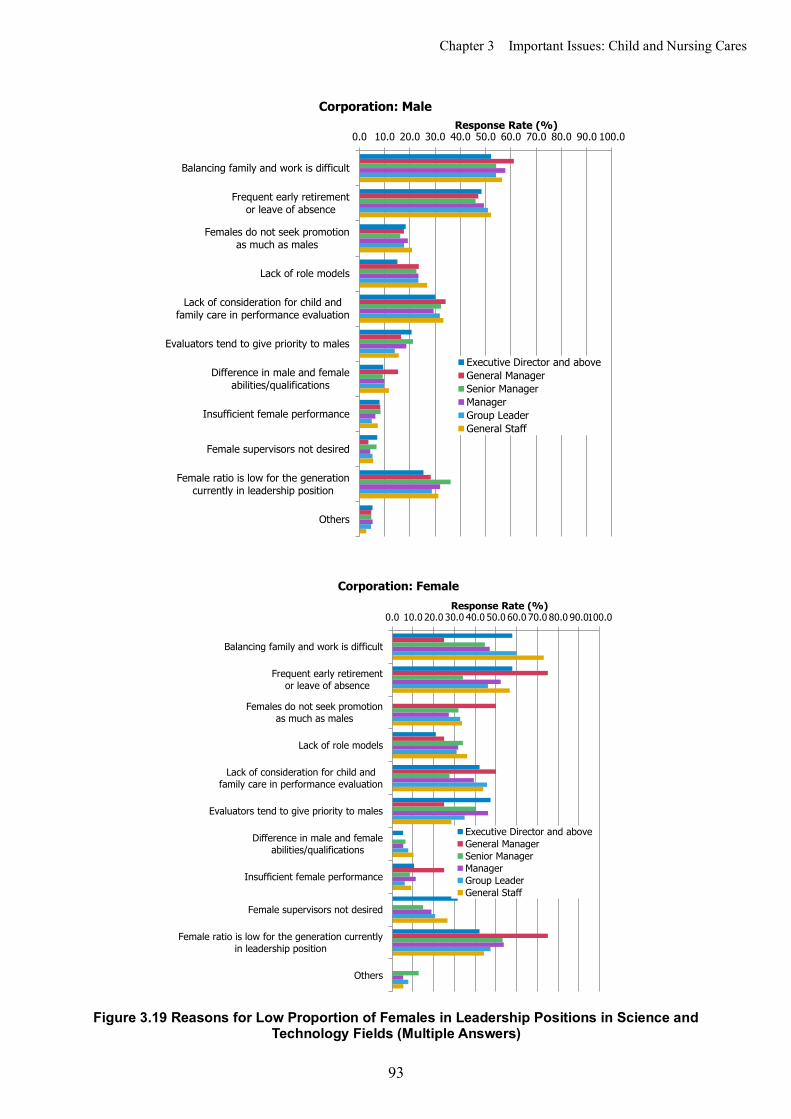
Chapter 3 Important Issues: Child and Nursing Cares
93
Figure 3.19 Reasons for Low Proportion of Females in Leadership Positions in Science and
Technology Fields (Multiple Answers)
0.0 10.0 20.0 30.0 40.0 50.0 60.0 70.0 80.0 90.0 100.0
Balancing family and work is difficult
Frequent early retirementor leave of absence
Females do not seek promotionas much as males
Lack of role models
Lack of consideration for child andfamily care in performance evaluation
Evaluators tend to give priority to males
Difference in male and femaleabilities/qualifications
Insufficient female performance
Female supervisors not desired
Female ratio is low for the generationcurrently in leadership position
Others
Response Rate (%)Corporation: Male
Executive Director and aboveGeneral ManagerSenior ManagerManagerGroup LeaderGeneral Staff
0.0 10.0 20.0 30.0 40.0 50.0 60.0 70.0 80.0 90.0100.0
Balancing family and work is difficult
Frequent early retirementor leave of absence
Females do not seek promotionas much as males
Lack of role models
Lack of consideration for child andfamily care in performance evaluation
Evaluators tend to give priority to males
Difference in male and femaleabilities/qualifications
Insufficient female performance
Female supervisors not desired
Female ratio is low for the generation currentlyin leadership position
Others
Response Rate (%)
Corporation: Female
Executive Director and aboveGeneral ManagerSenior ManagerManagerGroup LeaderGeneral Staff
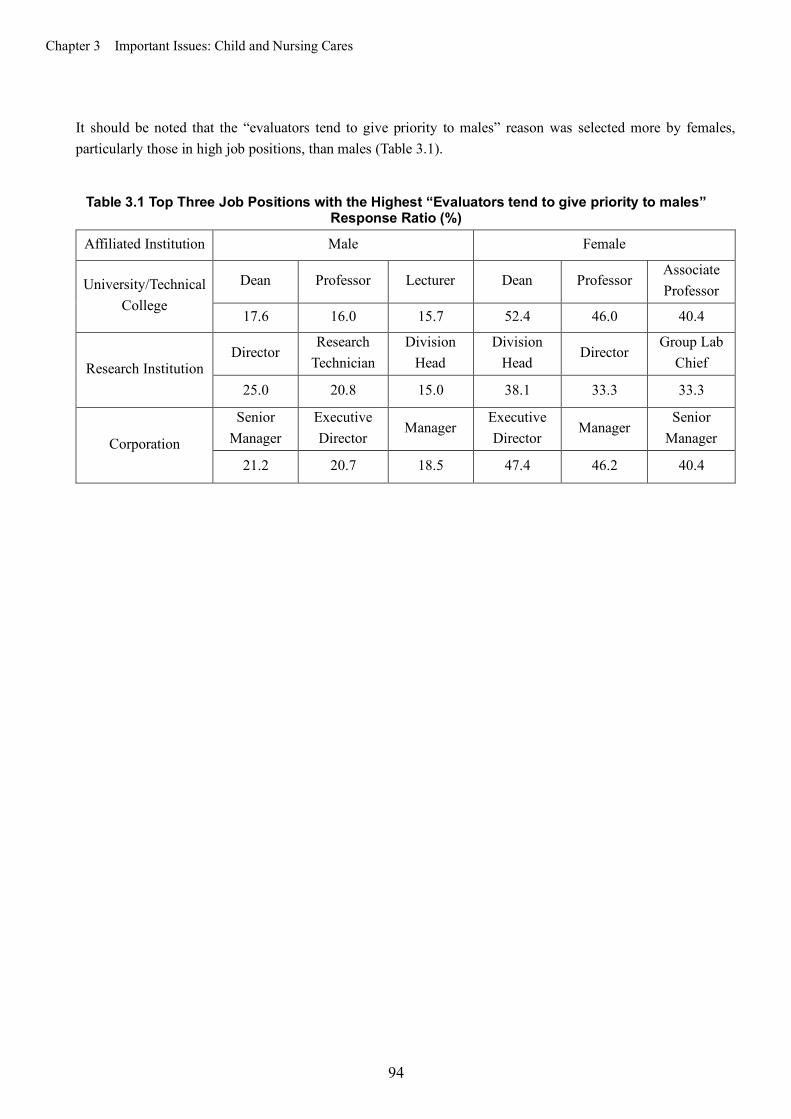
Chapter 3 Important Issues: Child and Nursing Cares
94
It should be noted that the “evaluators tend to give priority to males” reason was selected more by females, particularly those in high job positions, than males (Table 3.1).
Table 3.1 Top Three Job Positions with the Highest “Evaluators tend to give priority to males” Response Ratio (%)
Affiliated Institution Male Female
University/Technical College
Dean Professor Lecturer Dean Professor Associate Professor
17.6 16.0 15.7 52.4 46.0 40.4
Research Institution Director
Research Technician
Division Head
Division Head
Director Group Lab
Chief
25.0 20.8 15.0 38.1 33.3 33.3
Corporation
Senior Manager
Executive Director
Manager Executive Director
Manager Senior
Manager
21.2 20.7 18.5 47.4 46.2 40.4
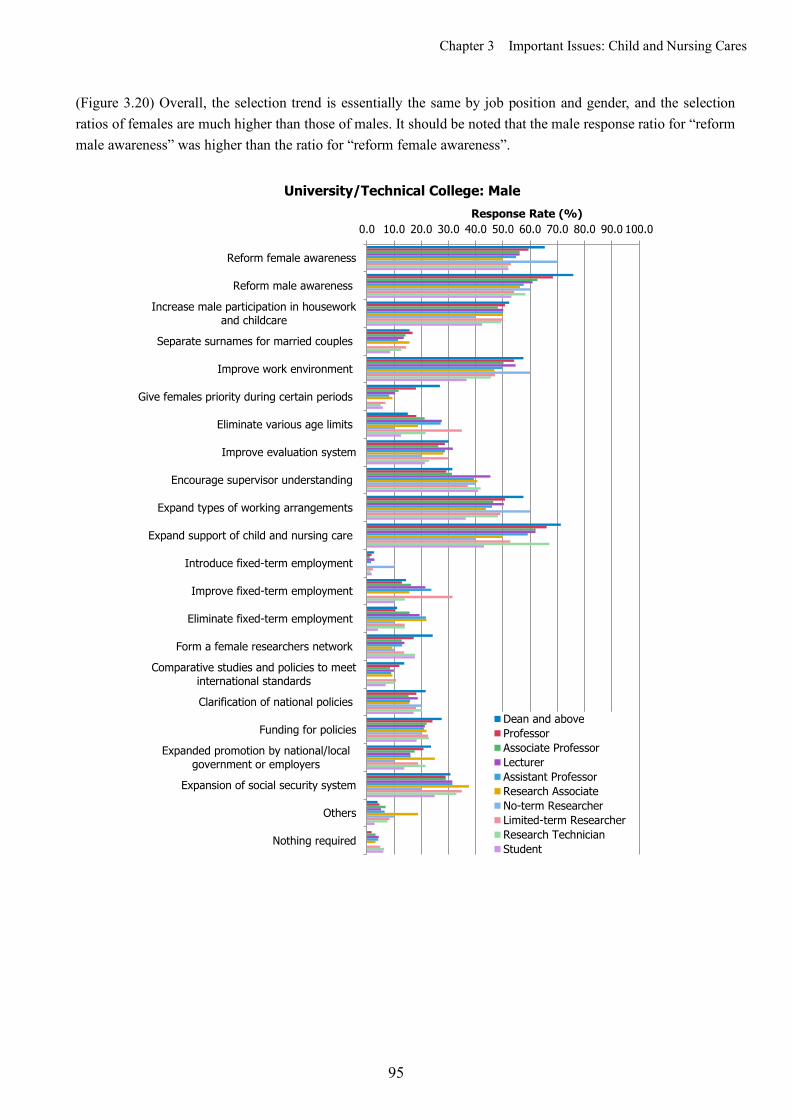
Chapter 3 Important Issues: Child and Nursing Cares
95
(Figure 3.20) Overall, the selection trend is essentially the same by job position and gender, and the selection ratios of females are much higher than those of males. It should be noted that the male response ratio for “reform male awareness” was higher than the ratio for “reform female awareness”.
0.0 10.0 20.0 30.0 40.0 50.0 60.0 70.0 80.0 90.0 100.0
Reform female awareness
Reform male awareness
Increase male participation in houseworkand childcare
Separate surnames for married couples
Improve work environment
Give females priority during certain periods
Eliminate various age limits
Improve evaluation system
Encourage supervisor understanding
Expand types of working arrangements
Expand support of child and nursing care
Introduce fixed-term employment
Improve fixed-term employment
Eliminate fixed-term employment
Form a female researchers network
Comparative studies and policies to meetinternational standards
Clarification of national policies
Funding for policies
Expanded promotion by national/localgovernment or employers
Expansion of social security system
Others
Nothing required
Response Rate (%)
University/Technical College: Male
Dean and aboveProfessorAssociate ProfessorLecturerAssistant ProfessorResearch AssociateNo-term ResearcherLimited-term ResearcherResearch TechnicianStudent
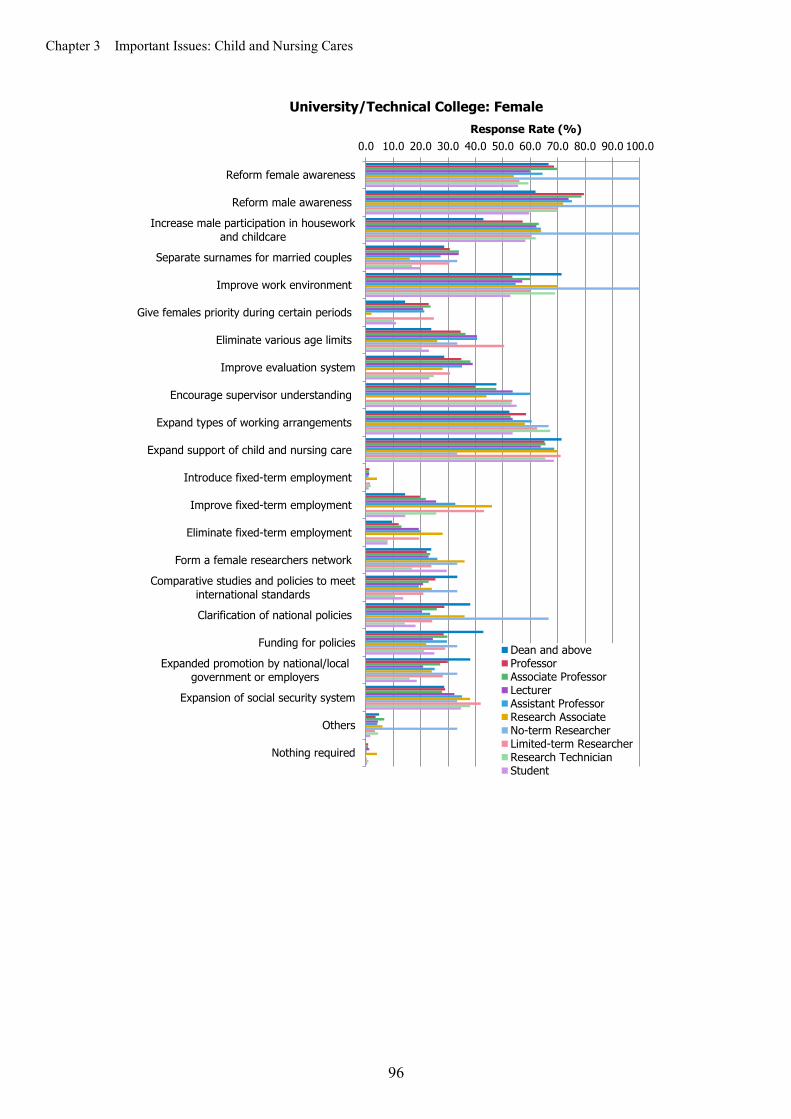
Chapter 3 Important Issues: Child and Nursing Cares
96
0.0 10.0 20.0 30.0 40.0 50.0 60.0 70.0 80.0 90.0 100.0
Reform female awareness
Reform male awareness
Increase male participation in houseworkand childcare
Separate surnames for married couples
Improve work environment
Give females priority during certain periods
Eliminate various age limits
Improve evaluation system
Encourage supervisor understanding
Expand types of working arrangements
Expand support of child and nursing care
Introduce fixed-term employment
Improve fixed-term employment
Eliminate fixed-term employment
Form a female researchers network
Comparative studies and policies to meetinternational standards
Clarification of national policies
Funding for policies
Expanded promotion by national/localgovernment or employers
Expansion of social security system
Others
Nothing required
Response Rate (%)
University/Technical College: Female
Dean and aboveProfessorAssociate ProfessorLecturerAssistant ProfessorResearch AssociateNo-term ResearcherLimited-term ResearcherResearch TechnicianStudent
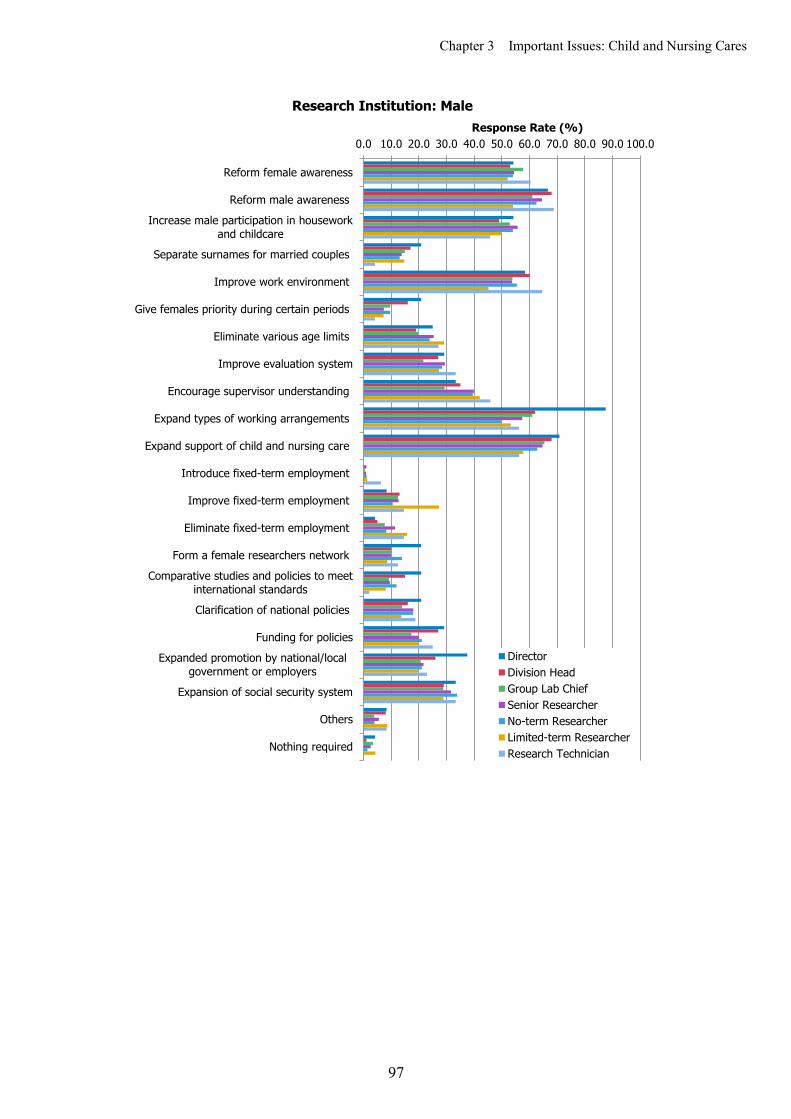
Chapter 3 Important Issues: Child and Nursing Cares
97
0.0 10.0 20.0 30.0 40.0 50.0 60.0 70.0 80.0 90.0 100.0
Reform female awareness
Reform male awareness
Increase male participation in houseworkand childcare
Separate surnames for married couples
Improve work environment
Give females priority during certain periods
Eliminate various age limits
Improve evaluation system
Encourage supervisor understanding
Expand types of working arrangements
Expand support of child and nursing care
Introduce fixed-term employment
Improve fixed-term employment
Eliminate fixed-term employment
Form a female researchers network
Comparative studies and policies to meetinternational standards
Clarification of national policies
Funding for policies
Expanded promotion by national/localgovernment or employers
Expansion of social security system
Others
Nothing required
Response Rate (%)
Research Institution: Male
DirectorDivision HeadGroup Lab ChiefSenior ResearcherNo-term ResearcherLimited-term ResearcherResearch Technician
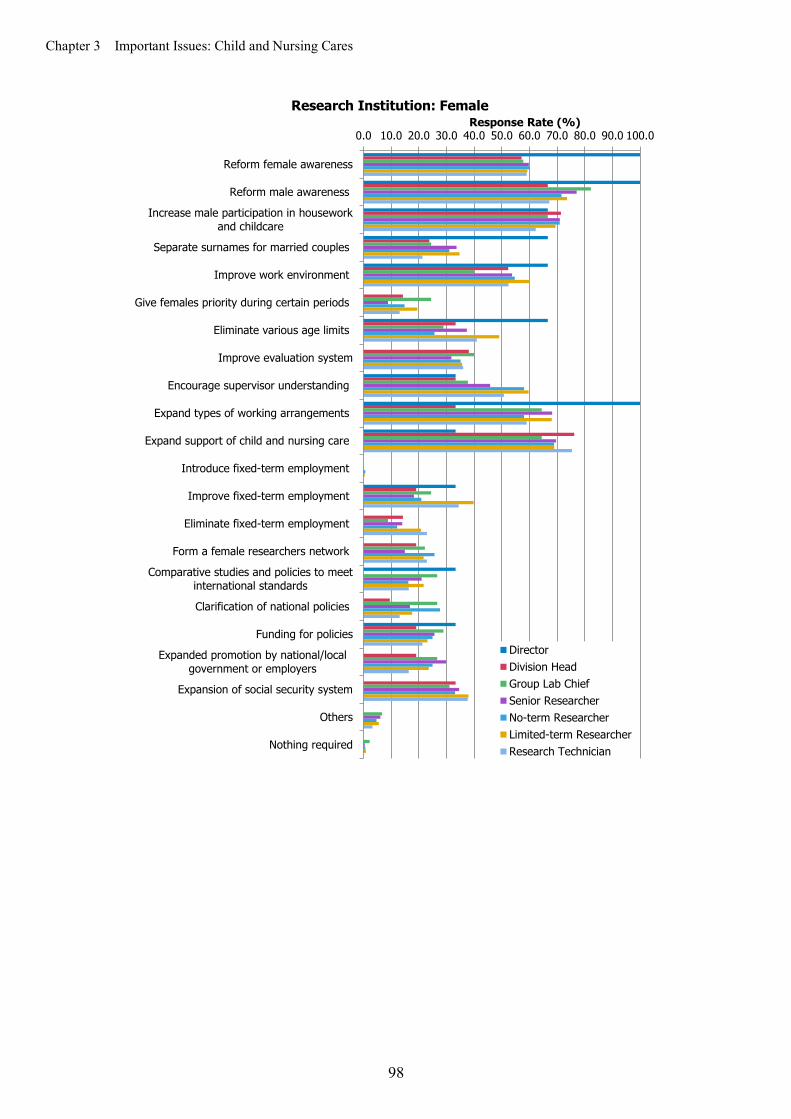
Chapter 3 Important Issues: Child and Nursing Cares
98
0.0 10.0 20.0 30.0 40.0 50.0 60.0 70.0 80.0 90.0 100.0
Reform female awareness
Reform male awareness
Increase male participation in houseworkand childcare
Separate surnames for married couples
Improve work environment
Give females priority during certain periods
Eliminate various age limits
Improve evaluation system
Encourage supervisor understanding
Expand types of working arrangements
Expand support of child and nursing care
Introduce fixed-term employment
Improve fixed-term employment
Eliminate fixed-term employment
Form a female researchers network
Comparative studies and policies to meetinternational standards
Clarification of national policies
Funding for policies
Expanded promotion by national/localgovernment or employers
Expansion of social security system
Others
Nothing required
Response Rate (%)Research Institution: Female
DirectorDivision HeadGroup Lab ChiefSenior ResearcherNo-term ResearcherLimited-term ResearcherResearch Technician
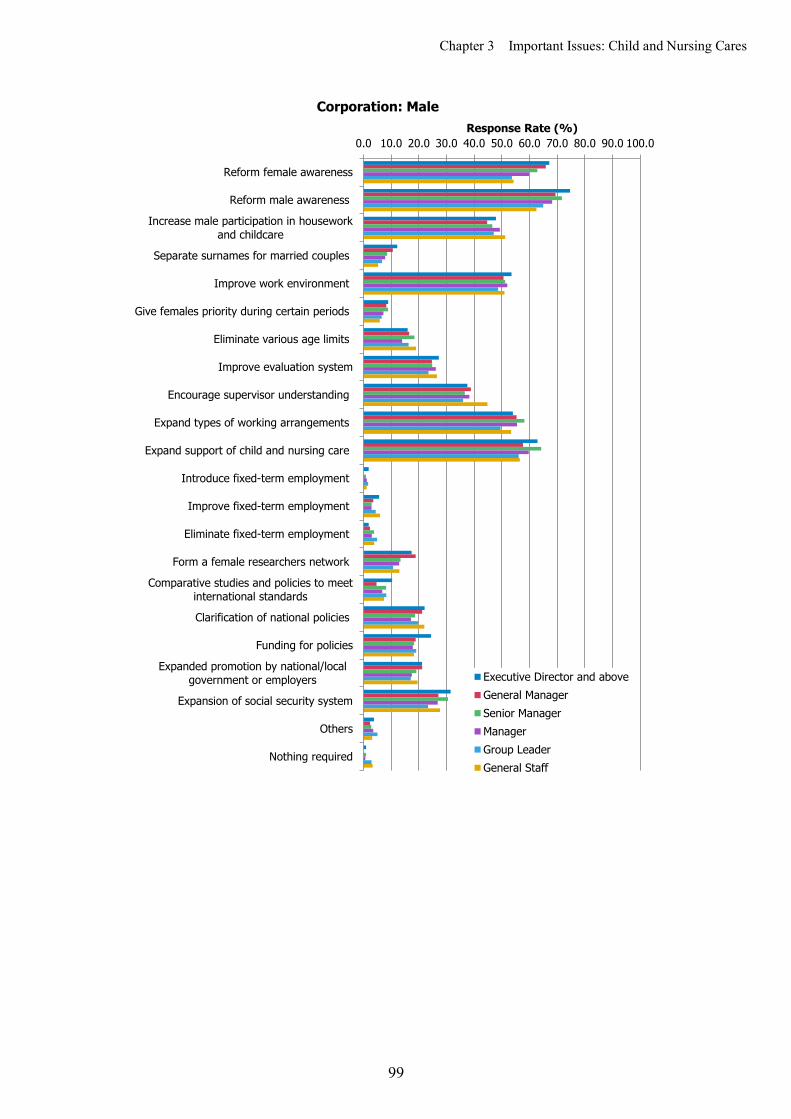
Chapter 3 Important Issues: Child and Nursing Cares
99
0.0 10.0 20.0 30.0 40.0 50.0 60.0 70.0 80.0 90.0 100.0
Reform female awareness
Reform male awareness
Increase male participation in houseworkand childcare
Separate surnames for married couples
Improve work environment
Give females priority during certain periods
Eliminate various age limits
Improve evaluation system
Encourage supervisor understanding
Expand types of working arrangements
Expand support of child and nursing care
Introduce fixed-term employment
Improve fixed-term employment
Eliminate fixed-term employment
Form a female researchers network
Comparative studies and policies to meetinternational standards
Clarification of national policies
Funding for policies
Expanded promotion by national/localgovernment or employers
Expansion of social security system
Others
Nothing required
Response Rate (%)
Corporation: Male
Executive Director and aboveGeneral ManagerSenior ManagerManagerGroup LeaderGeneral Staff

Chapter 3 Important Issues: Child and Nursing Cares
100
Figure 3.20 Requirements for Further Promoting Gender Equality (Multiple Answers)
0.0 10.0 20.0 30.0 40.0 50.0 60.0 70.0 80.0 90.0 100.0
Reform female awareness
Reform male awareness
Increase male participation in houseworkand childcare
Separate surnames for married couples
Improve work environment
Give females priority during certain periods
Eliminate various age limits
Improve evaluation system
Encourage supervisor understanding
Expand types of working arrangements
Expand support of child and nursing care
Introduce fixed-term employment
Improve fixed-term employment
Eliminate fixed-term employment
Form a female researchers network
Comparative studies and policies to meetinternational standards
Clarification of national policies
Funding for policies
Expanded promotion by national/localgovernment or employers
Expansion of social security system
Others
Nothing required
Response Rate (%)
Corporation: Female
Executive Director and aboveGeneral ManagerSenior ManagerManagerGroup LeaderGeneral Staff
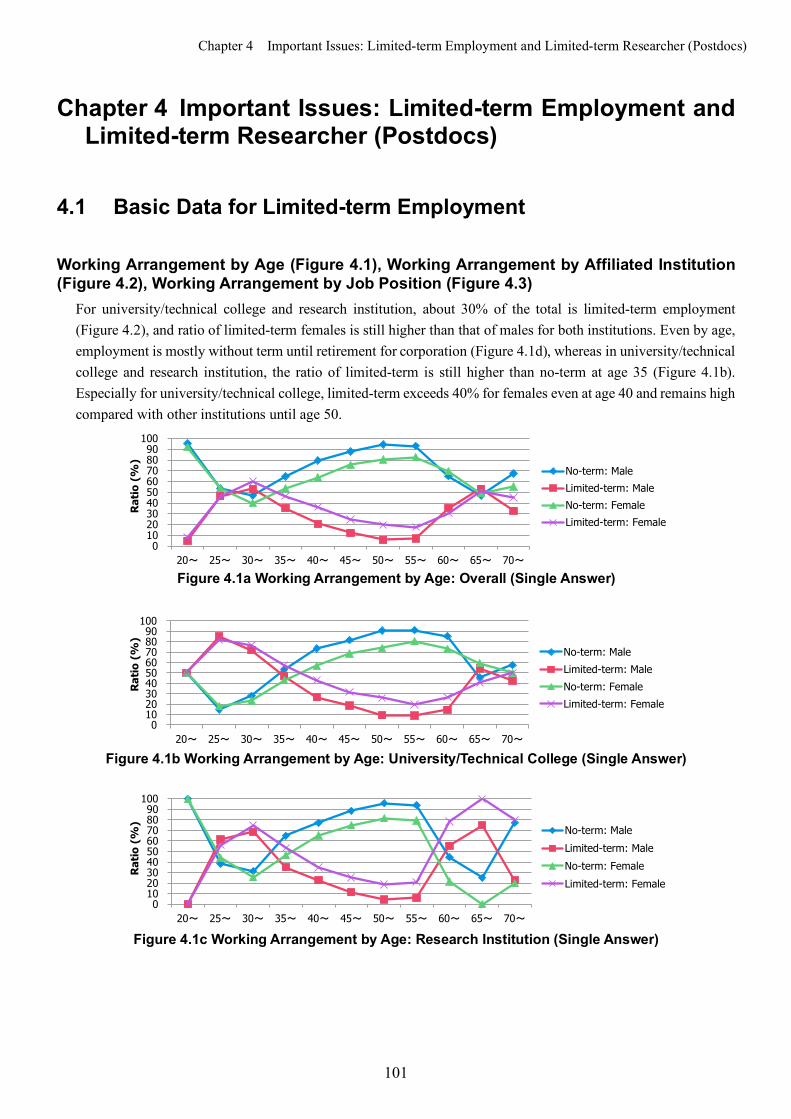
Chapter 4 Important Issues: Limited-term Employment and Limited-term Researcher (Postdocs)
101
Chapter 4 Important Issues: Limited-term Employment and Limited-term Researcher (Postdocs)
4.1 Basic Data for Limited-term Employment
Working Arrangement by Age (Figure 4.1), Working Arrangement by Affiliated Institution (Figure 4.2), Working Arrangement by Job Position (Figure 4.3)
For university/technical college and research institution, about 30% of the total is limited-term employment (Figure 4.2), and ratio of limited-term females is still higher than that of males for both institutions. Even by age, employment is mostly without term until retirement for corporation (Figure 4.1d), whereas in university/technical college and research institution, the ratio of limited-term is still higher than no-term at age 35 (Figure 4.1b). Especially for university/technical college, limited-term exceeds 40% for females even at age 40 and remains high compared with other institutions until age 50.
Figure 4.1a Working Arrangement by Age: Overall (Single Answer)
Figure 4.1b Working Arrangement by Age: University/Technical College (Single Answer)
Figure 4.1c Working Arrangement by Age: Research Institution (Single Answer)
0102030405060708090
100
20~ 25~ 30~ 35~ 40~ 45~ 50~ 55~ 60~ 65~ 70~
Ratio
(%
)
No-term: MaleLimited-term: MaleNo-term: FemaleLimited-term: Female
0102030405060708090
100
20~ 25~ 30~ 35~ 40~ 45~ 50~ 55~ 60~ 65~ 70~
Ratio
(%
)
No-term: MaleLimited-term: MaleNo-term: FemaleLimited-term: Female
0102030405060708090
100
20~ 25~ 30~ 35~ 40~ 45~ 50~ 55~ 60~ 65~ 70~
Ratio
(%
) No-term: MaleLimited-term: MaleNo-term: FemaleLimited-term: Female
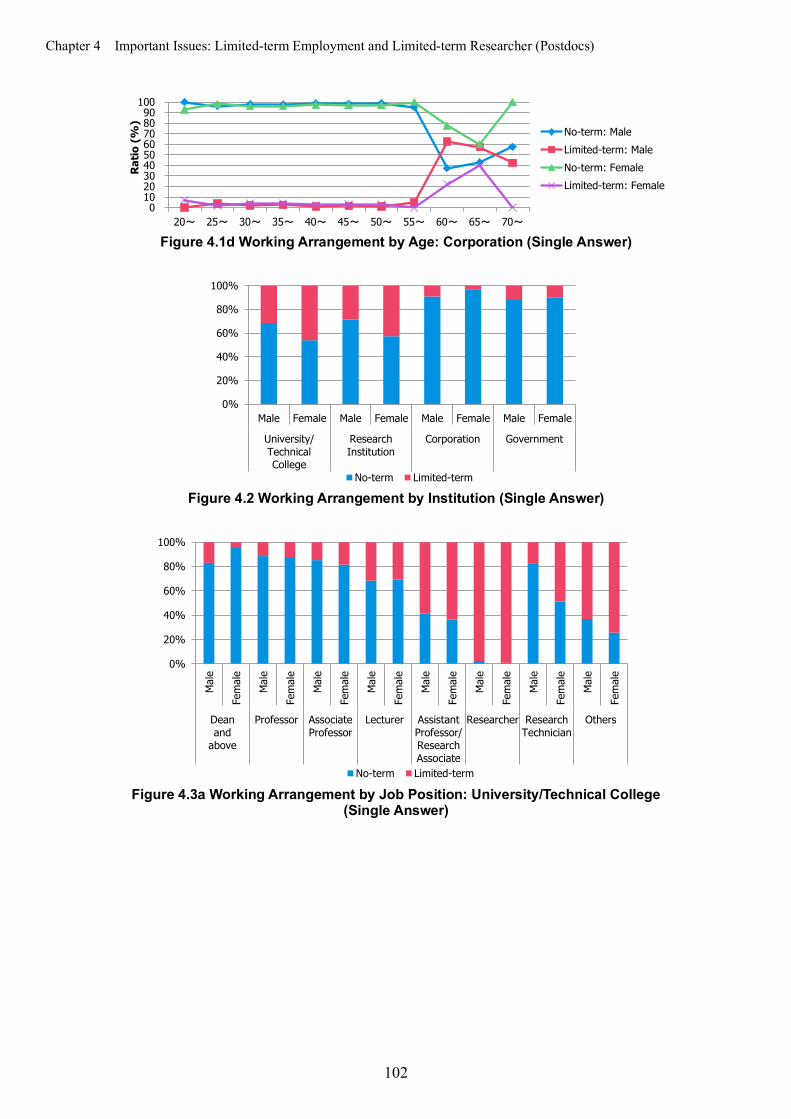
Chapter 4 Important Issues: Limited-term Employment and Limited-term Researcher (Postdocs)
102
Figure 4.1d Working Arrangement by Age: Corporation (Single Answer)
Figure 4.2 Working Arrangement by Institution (Single Answer)
Figure 4.3a Working Arrangement by Job Position: University/Technical College
(Single Answer)
0102030405060708090
100
20~ 25~ 30~ 35~ 40~ 45~ 50~ 55~ 60~ 65~ 70~
Ratio
(%
)No-term: MaleLimited-term: MaleNo-term: FemaleLimited-term: Female
0%
20%
40%
60%
80%
100%
Male Female Male Female Male Female Male Female
University/TechnicalCollege
ResearchInstitution
Corporation Government
No-term Limited-term
0%
20%
40%
60%
80%
100%
Male
Female
Male
Female
Male
Female
Male
Female
Male
Female
Male
Female
Male
Female
Male
Female
Deanandabove
Professor AssociateProfessor
Lecturer AssistantProfessor/ResearchAssociate
Researcher ResearchTechnician
Others
No-term Limited-term
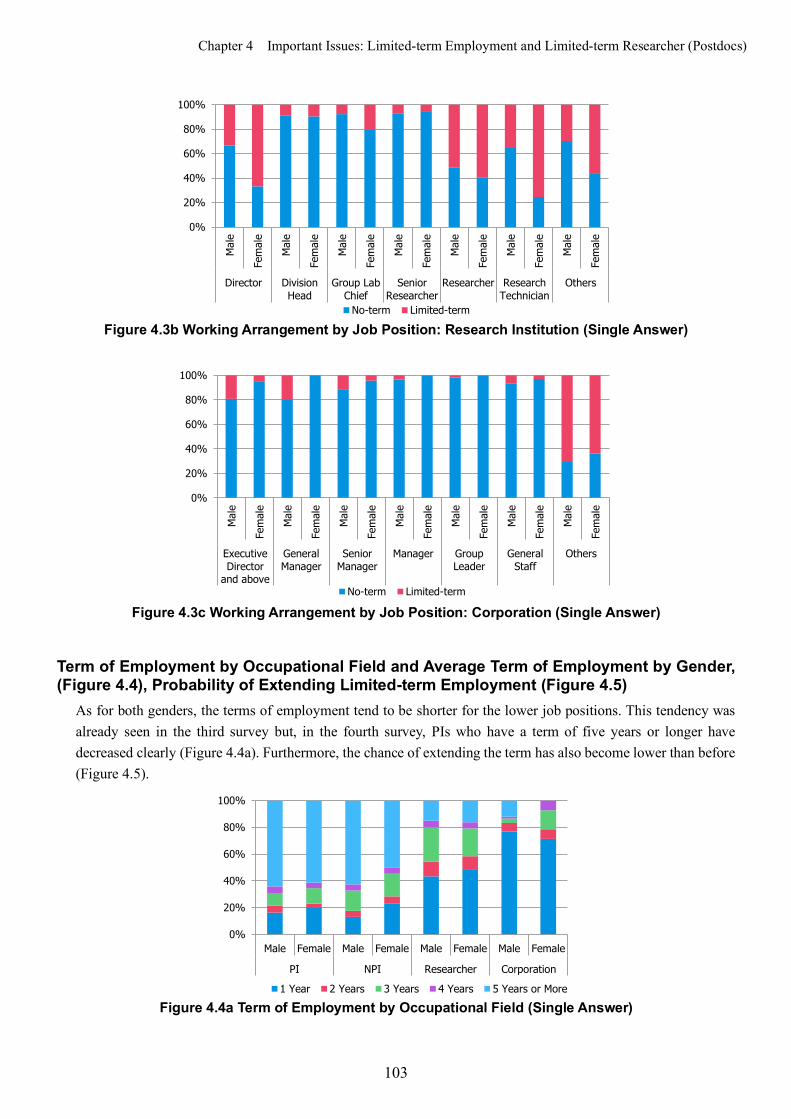
Chapter 4 Important Issues: Limited-term Employment and Limited-term Researcher (Postdocs)
103
Figure 4.3b Working Arrangement by Job Position: Research Institution (Single Answer)
Figure 4.3c Working Arrangement by Job Position: Corporation (Single Answer)
Term of Employment by Occupational Field and Average Term of Employment by Gender, (Figure 4.4), Probability of Extending Limited-term Employment (Figure 4.5)
As for both genders, the terms of employment tend to be shorter for the lower job positions. This tendency was already seen in the third survey but, in the fourth survey, PIs who have a term of five years or longer have decreased clearly (Figure 4.4a). Furthermore, the chance of extending the term has also become lower than before (Figure 4.5).
Figure 4.4a Term of Employment by Occupational Field (Single Answer)
0%
20%
40%
60%
80%
100%
Mal
e
Fem
ale
Mal
e
Fem
ale
Mal
e
Fem
ale
Mal
e
Fem
ale
Mal
e
Fem
ale
Mal
e
Fem
ale
Mal
e
Fem
ale
Director DivisionHead
Group LabChief
SeniorResearcher
Researcher ResearchTechnician
Others
No-term Limited-term
0%
20%
40%
60%
80%
100%
Mal
e
Fem
ale
Mal
e
Fem
ale
Mal
e
Fem
ale
Mal
e
Fem
ale
Mal
e
Fem
ale
Mal
e
Fem
ale
Mal
e
Fem
ale
ExecutiveDirector
and above
GeneralManager
SeniorManager
Manager GroupLeader
GeneralStaff
Others
No-term Limited-term
0%
20%
40%
60%
80%
100%
Male Female Male Female Male Female Male Female
PI NPI Researcher Corporation
1 Year 2 Years 3 Years 4 Years 5 Years or More
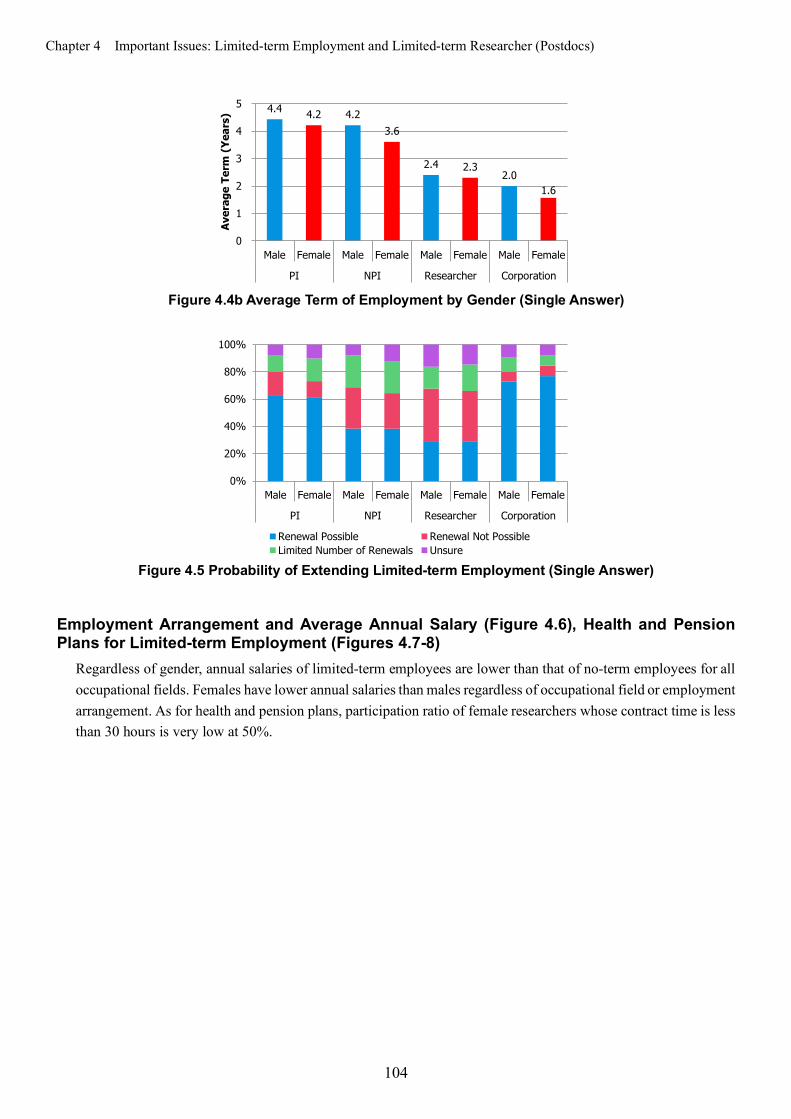
Chapter 4 Important Issues: Limited-term Employment and Limited-term Researcher (Postdocs)
104
Figure 4.4b Average Term of Employment by Gender (Single Answer)
Figure 4.5 Probability of Extending Limited-term Employment (Single Answer)
Employment Arrangement and Average Annual Salary (Figure 4.6), Health and Pension Plans for Limited-term Employment (Figures 4.7-8)
Regardless of gender, annual salaries of limited-term employees are lower than that of no-term employees for all occupational fields. Females have lower annual salaries than males regardless of occupational field or employment arrangement. As for health and pension plans, participation ratio of female researchers whose contract time is less than 30 hours is very low at 50%.
4.4 4.2 4.2 3.6
2.4 2.3 2.0
1.6
0
1
2
3
4
5
Male Female Male Female Male Female Male Female
PI NPI Researcher Corporation
Aver
age
Term
(Ye
ars)
0%
20%
40%
60%
80%
100%
Male Female Male Female Male Female Male Female
PI NPI Researcher Corporation
Renewal Possible Renewal Not PossibleLimited Number of Renewals Unsure
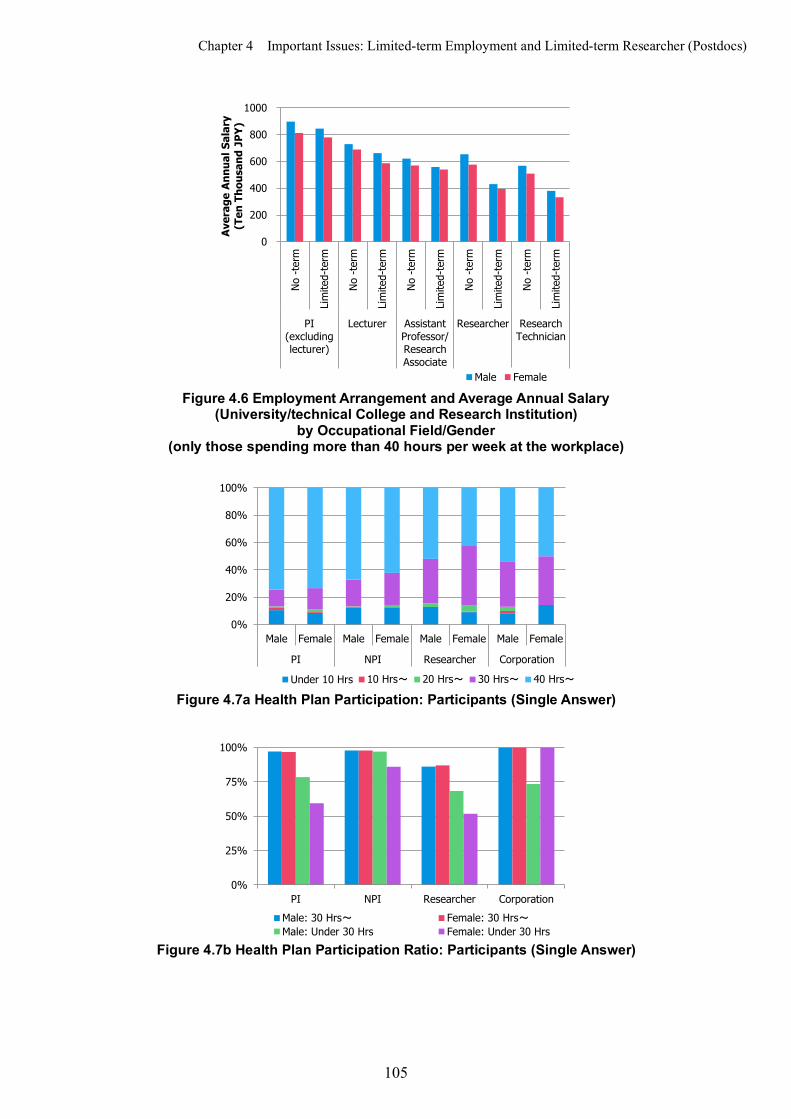
Chapter 4 Important Issues: Limited-term Employment and Limited-term Researcher (Postdocs)
105
Figure 4.6 Employment Arrangement and Average Annual Salary
(University/technical College and Research Institution) by Occupational Field/Gender
(only those spending more than 40 hours per week at the workplace)
Figure 4.7a Health Plan Participation: Participants (Single Answer)
Figure 4.7b Health Plan Participation Ratio: Participants (Single Answer)
0
200
400
600
800
1000
No -t
erm
Lim
ited-
term
No -t
erm
Lim
ited-
term
No -t
erm
Lim
ited-
term
No -t
erm
Lim
ited-
term
No -t
erm
Lim
ited-
term
PI(excludinglecturer)
Lecturer AssistantProfessor/ResearchAssociate
Researcher ResearchTechnician
Aver
age
Annu
al S
alar
y (T
en T
hous
and
JPY)
Male Female
0%
20%
40%
60%
80%
100%
Male Female Male Female Male Female Male Female
PI NPI Researcher Corporation
Under 10 Hrs 10 Hrs~ 20 Hrs~ 30 Hrs~ 40 Hrs~
0%
25%
50%
75%
100%
PI NPI Researcher CorporationMale: 30 Hrs~ Female: 30 Hrs~Male: Under 30 Hrs Female: Under 30 Hrs

Chapter 4 Important Issues: Limited-term Employment and Limited-term Researcher (Postdocs)
106
Figure 4.8a Welfare/Mutual Pension Plan Participation: Participants (Single Answer)
Figure 4.8b Welfare/Mutual Pension Plan Participation: Participation Ratio (Single Answer)
Limited-term Employment and Child Raising (Figure 4.9), Childcare Leave for Limited-term Employees (Figures 4.10-11)
Focusing on the 35 to 39 year age group considered as the child raising generation, nearly 50% of females have children regardless of whether their employment is limited-term or not. However, the ratio is lower for limited-term female researchers compared against other occupational fields. In many of the occupational fields, nearly 60% of males have children, but the ratio is less than 40% for limited-term male researchers, and the number of children they have is also very low. The ratio of those that take childcare leave decreases for both genders as job position becomes lower. Furthermore, the ratio of females that take leave is higher than males for all job positions, and females have a higher awareness of childcare leave programs than males.
Figure 4.9a Number of Children by Gender/Job Position (for males ages 35 to 39 only) (Single
Answer)
0%
20%
40%
60%
80%
100%
Male Female Male Female Male Female Male Female
PI NPI Researcher CorporationUnder 10 Hrs 10 Hrs~ 20 Hrs~ 30 Hrs~ 40 Hrs~
0%
25%
50%
75%
100%
PI NPI Researcher Corporation
Male: 30 Hrs~ Female: 30 Hrs~Male: Under 30 Hrs Female: Under 30 Hrs
1.14
0.91 0.82
1.31
0.55
1.03
0.0
0.2
0.4
0.6
0.8
1.0
1.2
1.4
0%
20%
40%
60%
80%
100%
PI No-termNPI
Limited-termNPI
No -termResearcher
Limited-termResearcher
Corporation
Aver
age
Num
ber
of C
hild
ren
0 1 2 3 4 5 or More Average
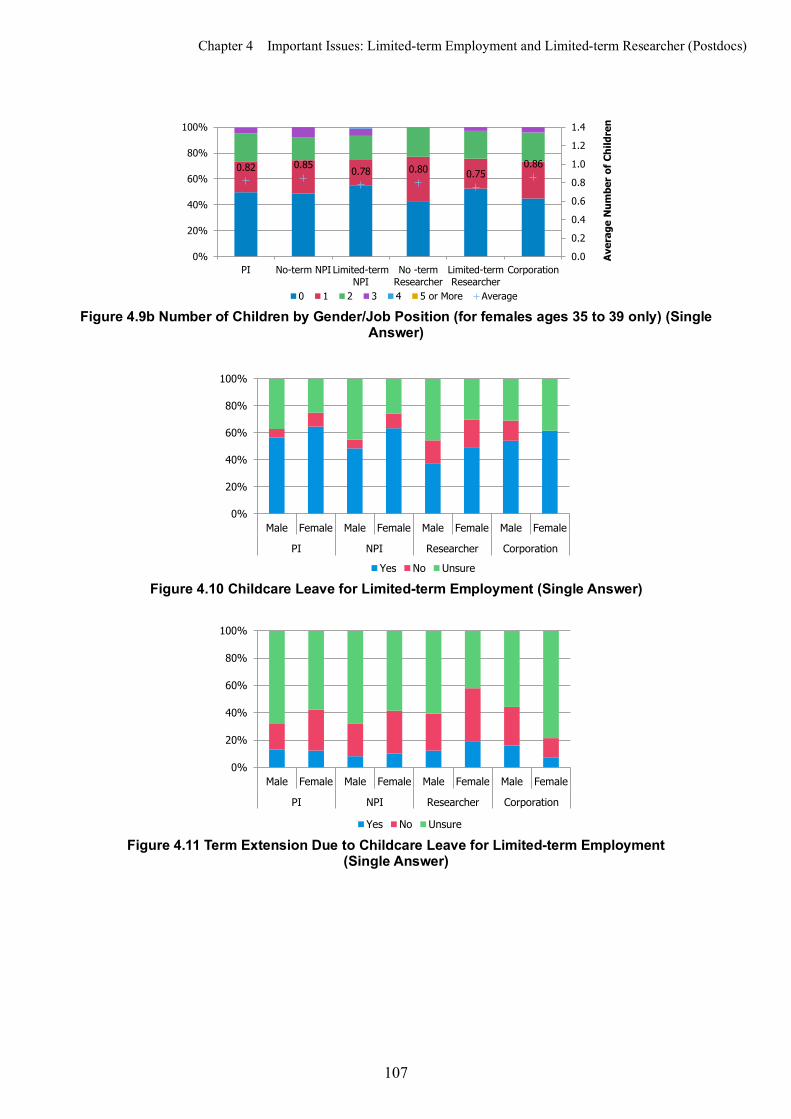
Chapter 4 Important Issues: Limited-term Employment and Limited-term Researcher (Postdocs)
107
Figure 4.9b Number of Children by Gender/Job Position (for females ages 35 to 39 only) (Single
Answer)
Figure 4.10 Childcare Leave for Limited-term Employment (Single Answer)
Figure 4.11 Term Extension Due to Childcare Leave for Limited-term Employment
(Single Answer)
0.82 0.85 0.78 0.80 0.75 0.86
0.0
0.2
0.4
0.6
0.8
1.0
1.2
1.4
0%
20%
40%
60%
80%
100%
PI No-term NPI Limited-termNPI
No -termResearcher
Limited-termResearcher
Corporation
Aver
age
Num
ber
of C
hild
ren
0 1 2 3 4 5 or More Average
0%
20%
40%
60%
80%
100%
Male Female Male Female Male Female Male Female
PI NPI Researcher Corporation
Yes No Unsure
0%
20%
40%
60%
80%
100%
Male Female Male Female Male Female Male Female
PI NPI Researcher Corporation
Yes No Unsure
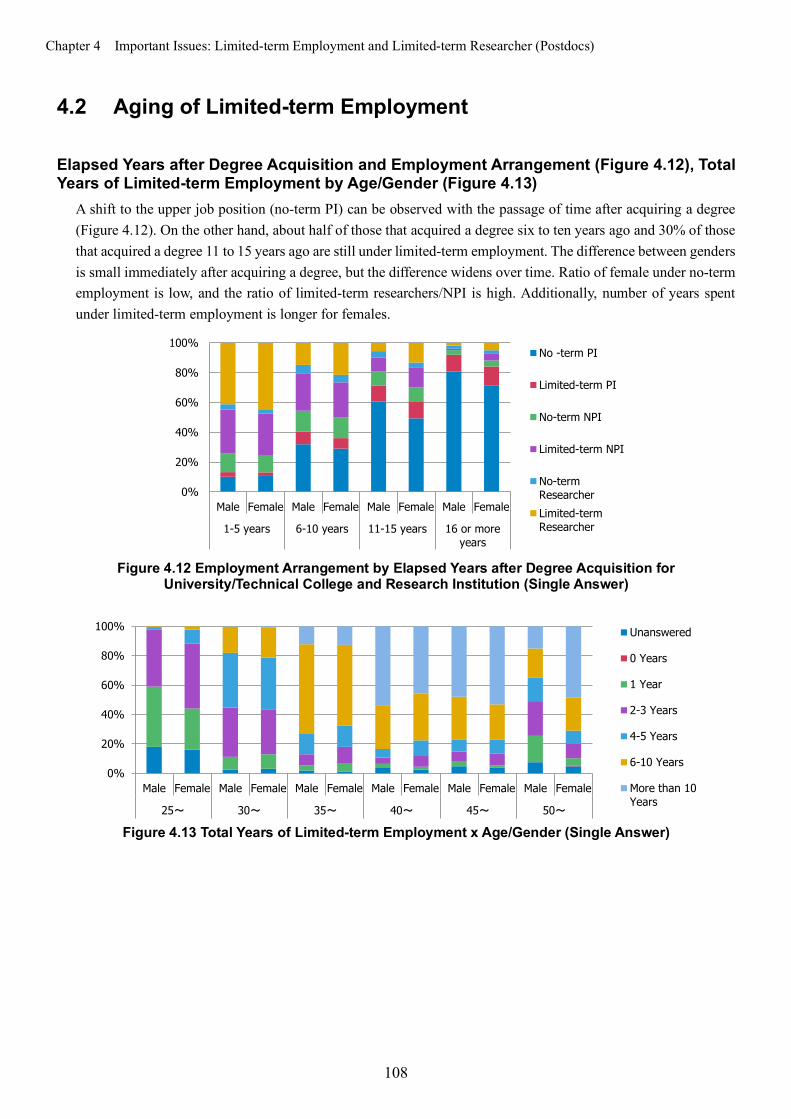
Chapter 4 Important Issues: Limited-term Employment and Limited-term Researcher (Postdocs)
108
4.2 Aging of Limited-term Employment
Elapsed Years after Degree Acquisition and Employment Arrangement (Figure 4.12), Total Years of Limited-term Employment by Age/Gender (Figure 4.13)
A shift to the upper job position (no-term PI) can be observed with the passage of time after acquiring a degree (Figure 4.12). On the other hand, about half of those that acquired a degree six to ten years ago and 30% of those that acquired a degree 11 to 15 years ago are still under limited-term employment. The difference between genders is small immediately after acquiring a degree, but the difference widens over time. Ratio of female under no-term employment is low, and the ratio of limited-term researchers/NPI is high. Additionally, number of years spent under limited-term employment is longer for females.
Figure 4.12 Employment Arrangement by Elapsed Years after Degree Acquisition for
University/Technical College and Research Institution (Single Answer)
Figure 4.13 Total Years of Limited-term Employment x Age/Gender (Single Answer)
0%
20%
40%
60%
80%
100%
Male Female Male Female Male Female Male Female
1-5 years 6-10 years 11-15 years 16 or moreyears
No -term PI
Limited-term PI
No-term NPI
Limited-term NPI
No-termResearcherLimited-termResearcher
0%
20%
40%
60%
80%
100%
Male Female Male Female Male Female Male Female Male Female Male Female
25~ 30~ 35~ 40~ 45~ 50~
Unanswered
0 Years
1 Year
2-3 Years
4-5 Years
6-10 Years
More than 10Years

Chapter 4 Important Issues: Limited-term Employment and Limited-term Researcher (Postdocs)
109
Job Position of Limited-term Employee and Desire for No-term Employment (Figure 4.14) For university and research institution, the ratios of respondents that do not want to be a no-term employee was less than 7% for all job positions other than PI, whereas for PI the ratio increases, especially with females, the ratio is about 30%.
Figure 4.14 Desire for No-term Employment x Current Job (Single Answer)
4.3 Employment Status of Limited-term Researcher/NPI
Male-Female Ratio of Limited-term Researchers (Figure 4.15) The female ratio of limited-term researchers increases with age. Even at age 60 and over, ratio of 20% is maintained. Limited-term researchers between the ages of 40 to 65 have increased significantly compared with the previous survey. Limited-term employment is aging suggesting an increase in the number of limited-term researchers that have never experience no-term employment.
Figure 4.15a Limited-term Researchers by Age Group and Ratio of Females (Single Answer)
0%
20%
40%
60%
80%
100%
Male Female Male Female Male Female Male Female Male Female Male Female Male Female Male Female Male Female
Professor AssociateProfessor
Lecturer LaboratoryPI
AssistantProfessor/ResearchAssociate
Researcher ResearchTechnician
CorporationManagement
CorporationGeneral
Staff
Desire no-term employment Do not desire no-term-employment Unsure
32.7% 36.2% 37.4%
49.2% 49.6%47.9%49.2%
61.3%70.0%
50.0%
88.9%
20.0%25.0%22.2%
0%
20%
40%
60%
80%
100%
0
70
140
210
280
350
27-2
9
30-3
2
33-3
5
36-3
8
39-4
1
42-4
4
45-4
7
48-5
0
51-5
3
54-5
6
57-5
9
60-6
2
63-6
5
66 o
rOv
er
Num
ber
of R
espo
nden
ts
MaleFemaleFemale Ratio

Chapter 4 Important Issues: Limited-term Employment and Limited-term Researcher (Postdocs)
110
Figure 4.15b Limited-term Researchers by Age Group and Ratio of Females (Single Answer)
(horizontal axis aligned with third survey)
Working Hours of Limited-term Researchers/NPI (Figures 4.16-19) Hours spent at the workplace exceeds the contracted hours for nearly half of the limited-term researchers and NPI of both genders. Average hours spent at the workplace is longer for limited-term than no-term for both researchers and NPI. Although limited-term NPI spends longer hours at the workplace than limited-term researchers, the portion of their time spent on research is smaller. When limited-term researchers shift to limited-term NPI such as specially appointed assistant professor and specially appointed lecturer, the hours spent at the workplace increases due to work commitments other than research. Meanwhile, limited-term researchers have the highest proportion of research hours during the time they spend at their university and research institution workplaces.
Figure 4.16 Contract Working Hours per Week of Limited-term Researcher (Single Answer)
32.7% 36.2% 37.4%49.2% 49.6%
47.9% 51.3%
0%
20%
40%
60%
80%
100%
050
100150200250300350400450
27-29 30-32 33-35 36-38 39-41 42-44 45-65
Num
ber
of L
imite
d-te
rm
Rese
arch
Res
pond
ents Female
MaleFemale Ratio
0%
10%
20%
30%
40%
50%
60%
70%
80%
90%
100%
Male Female
None40 Hrs~30 Hrs~20 Hrs~10 Hrs~Under 10 Hrs
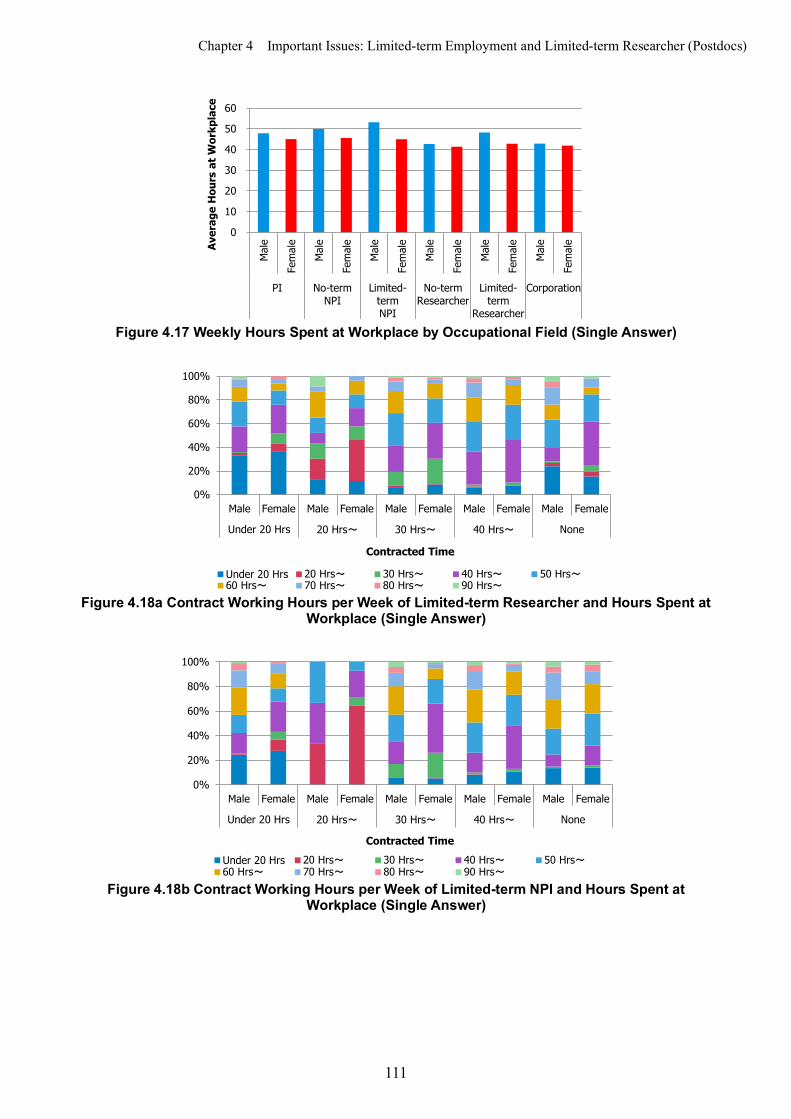
Chapter 4 Important Issues: Limited-term Employment and Limited-term Researcher (Postdocs)
111
Figure 4.17 Weekly Hours Spent at Workplace by Occupational Field (Single Answer)
Figure 4.18a Contract Working Hours per Week of Limited-term Researcher and Hours Spent at
Workplace (Single Answer)
Figure 4.18b Contract Working Hours per Week of Limited-term NPI and Hours Spent at
Workplace (Single Answer)
0
10
20
30
40
50
60
Male
Female
Male
Female
Male
Female
Male
Female
Male
Female
Male
Female
PI No-termNPI
Limited-termNPI
No-termResearcher
Limited-term
Researcher
Corporation
Aver
age
Hou
rs a
t Wor
kpla
ce
0%
20%
40%
60%
80%
100%
Male Female Male Female Male Female Male Female Male Female
Under 20 Hrs 20 Hrs~ 30 Hrs~ 40 Hrs~ None
Contracted Time
Under 20 Hrs 20 Hrs~ 30 Hrs~ 40 Hrs~ 50 Hrs~60 Hrs~ 70 Hrs~ 80 Hrs~ 90 Hrs~
0%
20%
40%
60%
80%
100%
Male Female Male Female Male Female Male Female Male Female
Under 20 Hrs 20 Hrs~ 30 Hrs~ 40 Hrs~ None
Contracted Time
Under 20 Hrs 20 Hrs~ 30 Hrs~ 40 Hrs~ 50 Hrs~60 Hrs~ 70 Hrs~ 80 Hrs~ 90 Hrs~
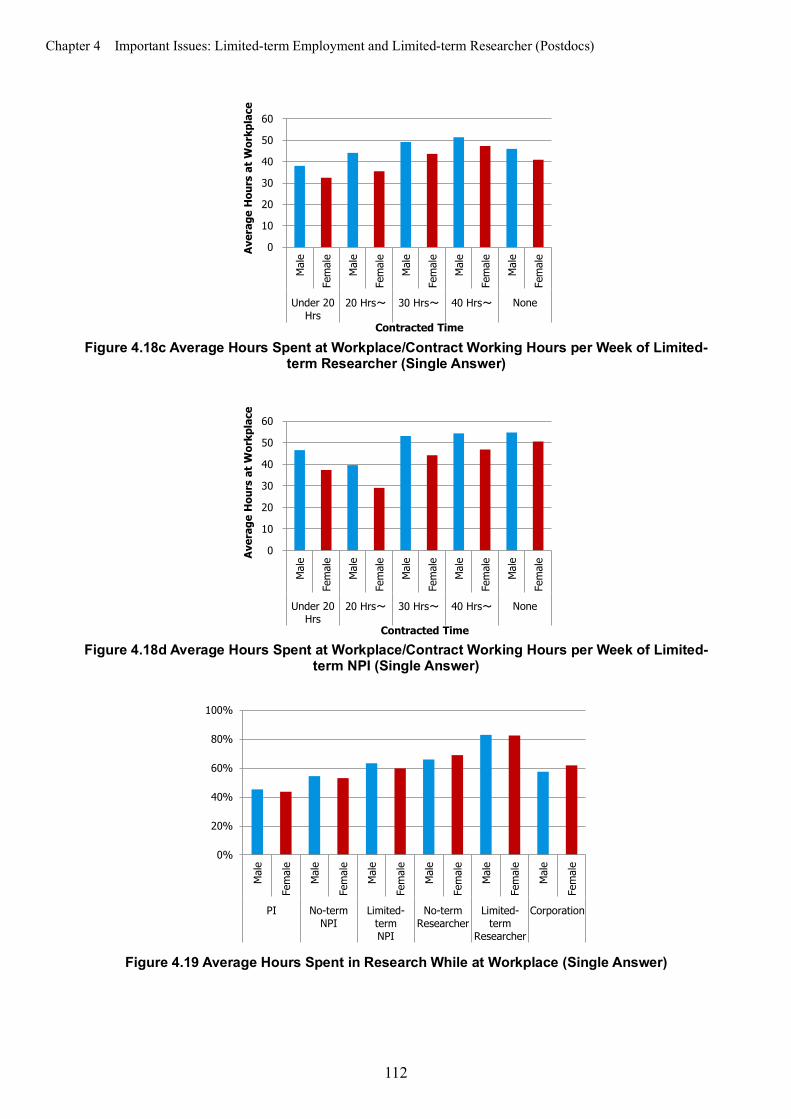
Chapter 4 Important Issues: Limited-term Employment and Limited-term Researcher (Postdocs)
112
Figure 4.18c Average Hours Spent at Workplace/Contract Working Hours per Week of Limited-
term Researcher (Single Answer)
Figure 4.18d Average Hours Spent at Workplace/Contract Working Hours per Week of Limited-
term NPI (Single Answer)
Figure 4.19 Average Hours Spent in Research While at Workplace (Single Answer)
0
10
20
30
40
50
60
Mal
e
Fem
ale
Mal
e
Fem
ale
Mal
e
Fem
ale
Mal
e
Fem
ale
Mal
e
Fem
ale
Under 20Hrs
20 Hrs~ 30 Hrs~ 40 Hrs~ None
Aver
age
Hou
rs a
t Wor
kpla
ce
Contracted Time
0
10
20
30
40
50
60
Mal
e
Fem
ale
Mal
e
Fem
ale
Mal
e
Fem
ale
Mal
e
Fem
ale
Mal
e
Fem
ale
Under 20Hrs
20 Hrs~ 30 Hrs~ 40 Hrs~ None
Aver
age
Hou
rs a
t Wor
kpla
ce
Contracted Time
0%
20%
40%
60%
80%
100%
Male
Female
Male
Female
Male
Female
Male
Female
Male
Female
Male
Female
PI No-termNPI
Limited-termNPI
No-termResearcher
Limited-term
Researcher
Corporation
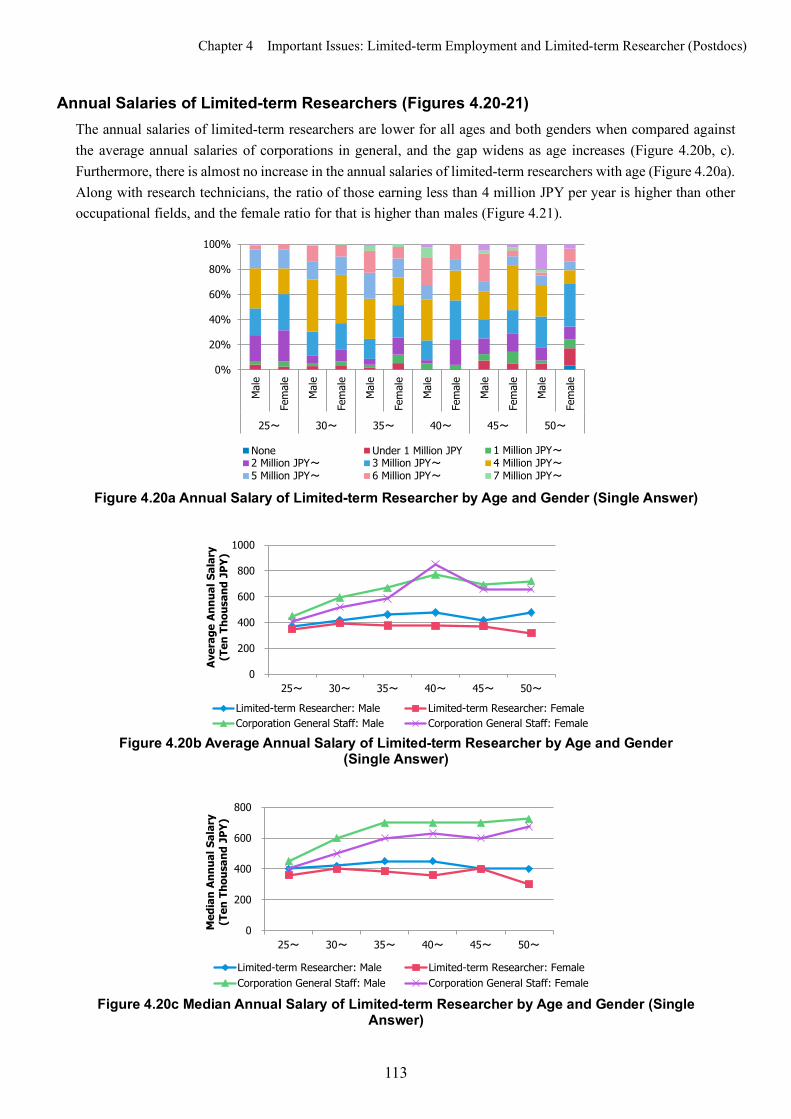
Chapter 4 Important Issues: Limited-term Employment and Limited-term Researcher (Postdocs)
113
Annual Salaries of Limited-term Researchers (Figures 4.20-21) The annual salaries of limited-term researchers are lower for all ages and both genders when compared against the average annual salaries of corporations in general, and the gap widens as age increases (Figure 4.20b, c). Furthermore, there is almost no increase in the annual salaries of limited-term researchers with age (Figure 4.20a). Along with research technicians, the ratio of those earning less than 4 million JPY per year is higher than other occupational fields, and the female ratio for that is higher than males (Figure 4.21).
Figure 4.20a Annual Salary of Limited-term Researcher by Age and Gender (Single Answer)
Figure 4.20b Average Annual Salary of Limited-term Researcher by Age and Gender
(Single Answer)
Figure 4.20c Median Annual Salary of Limited-term Researcher by Age and Gender (Single
Answer)
0%
20%
40%
60%
80%
100%M
ale
Fem
ale
Mal
e
Fem
ale
Mal
e
Fem
ale
Mal
e
Fem
ale
Mal
e
Fem
ale
Mal
e
Fem
ale
25~ 30~ 35~ 40~ 45~ 50~
None Under 1 Million JPY 1 Million JPY~2 Million JPY~ 3 Million JPY~ 4 Million JPY~5 Million JPY~ 6 Million JPY~ 7 Million JPY~
0
200
400
600
800
1000
25~ 30~ 35~ 40~ 45~ 50~
Aver
age
Annu
al S
alar
y (T
en T
hous
and
JPY)
Limited-term Researcher: Male Limited-term Researcher: FemaleCorporation General Staff: Male Corporation General Staff: Female
0
200
400
600
800
25~ 30~ 35~ 40~ 45~ 50~
Med
ian
Annu
al S
alar
y (T
en T
hous
and
JPY)
Limited-term Researcher: Male Limited-term Researcher: FemaleCorporation General Staff: Male Corporation General Staff: Female

Chapter 4 Important Issues: Limited-term Employment and Limited-term Researcher (Postdocs)
114
Figure 4.21 Annual Salary of Respondents with Doctoral Degree that Spend Over 40 Hours at
Workplace (Single Answer)
4.4 Tenure Track Ratio of Tenure Track Employment by Age (Figure 4.22), Elapsed Years after Degree Acquisition (Figure 4.23)
Ratio of respondents under tenure track employment is highest for those between the ages of 35 and 45 at 15-20% (Figure 4.22) and those who had their degree for six to ten years at about 20% (Figure 4.23). Moreover, females under tenure track employment is lower for many of the age groups.
Figure 4.22 Tenure Track Employment x Age (Single Answer)
0%
20%
40%
60%
80%
100%M
ale
Fem
ale
Mal
e
Fem
ale
Mal
e
Fem
ale
Mal
e
Fem
ale
Mal
e
Fem
ale
Mal
e
Fem
ale
Mal
e
Fem
ale
Mal
e
Fem
ale
Mal
e
Fem
ale
Mal
e
Fem
ale
Professor AssociateProfessor
Lecturer LaboratoryPI
AssistantProfessor/ResearchAssociate
No-termResearcher
Limited-term
Researcher
ResearchTechnician
CorporationManagement
CorporationGeneral
Staff
Under 3 Million JPY 3 Million~Under 4 Million JPY 4 Million JPY and Over
0%
20%
40%
60%
80%
100%
Male Female Male Female Male Female Male Female Male Female Male Female
25~ 30~ 35~ 40~ 45~ 50~
Tenure Track Employment Non-tenure Track Employment Unsure
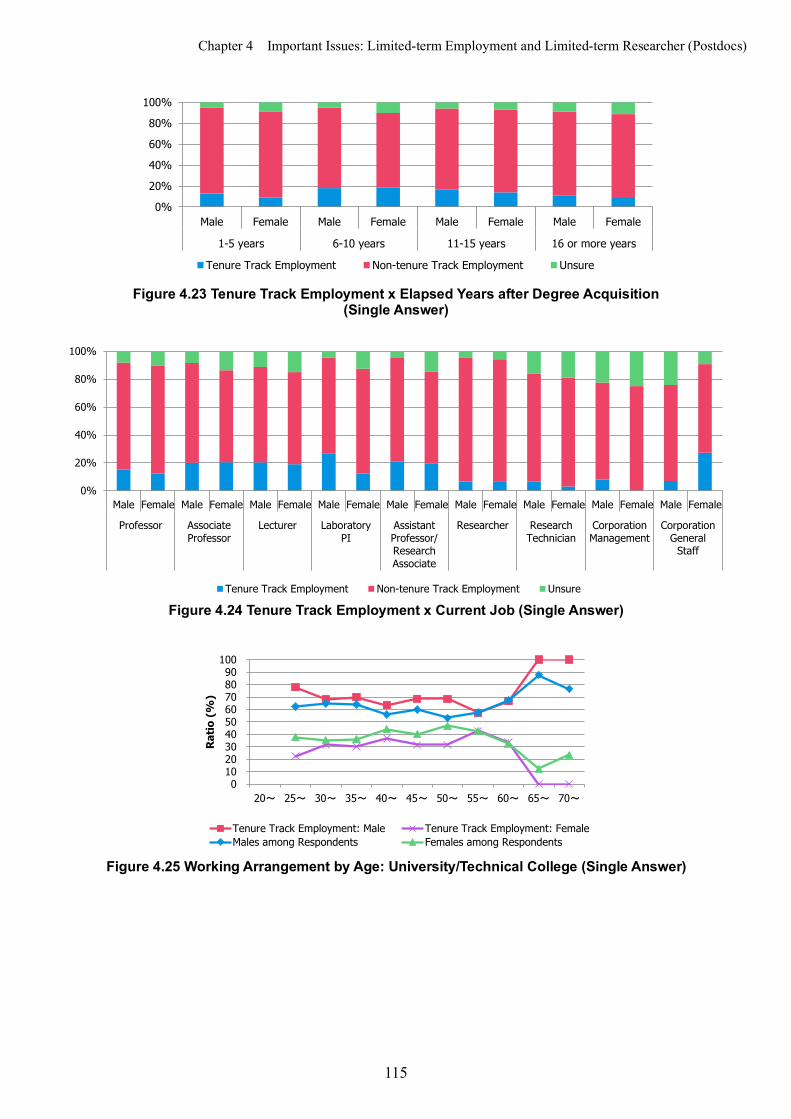
Chapter 4 Important Issues: Limited-term Employment and Limited-term Researcher (Postdocs)
115
Figure 4.23 Tenure Track Employment x Elapsed Years after Degree Acquisition
(Single Answer)
Figure 4.24 Tenure Track Employment x Current Job (Single Answer)
Figure 4.25 Working Arrangement by Age: University/Technical College (Single Answer)
0%
20%
40%
60%
80%
100%
Male Female Male Female Male Female Male Female
1-5 years 6-10 years 11-15 years 16 or more years
Tenure Track Employment Non-tenure Track Employment Unsure
0%
20%
40%
60%
80%
100%
Male Female Male Female Male Female Male Female Male Female Male Female Male Female Male Female Male Female
Professor AssociateProfessor
Lecturer LaboratoryPI
AssistantProfessor/ResearchAssociate
Researcher ResearchTechnician
CorporationManagement
CorporationGeneral
Staff
Tenure Track Employment Non-tenure Track Employment Unsure
0102030405060708090
100
20~ 25~ 30~ 35~ 40~ 45~ 50~ 55~ 60~ 65~ 70~
Ratio
(%
)
Tenure Track Employment: Male Tenure Track Employment: FemaleMales among Respondents Females among Respondents

Chapter 4 Important Issues: Limited-term Employment and Limited-term Researcher (Postdocs)
116
Figure 4.26 Contract Working Hours for Tenure and Non-tenure Employments
(Single Answer)
Figure 4.27a Annual Salary of Tenure Track Employee by Age and Gender (Single Answer)
Figure 4.27b Annual Salary of Non-tenure Track Employee by Age and Gender
(Single Answer)
0% 20% 40% 60% 80% 100%
Non-tenure Track Employee: Male
Non-tenure Track Employee: Female
Tenure Track Employee: Male
Tenure Track Employee: Female
Under 10 Hrs 10 Hrs~ 20 Hrs~ 30 Hrs~ 40 Hrs~ None
0%
20%
40%
60%
80%
100%
Mal
e
Fem
ale
Mal
e
Fem
ale
Mal
e
Fem
ale
Mal
e
Fem
ale
Mal
e
Fem
ale
Mal
e
Fem
ale
25~ 30~ 35~ 40~ 45~ 50~
None Under 1 Million JPY 1 Million JPY~2 Million JPY~ 3 Million JPY~ 4 Million JPY~5 Million JPY~ 6 Million JPY~ 7 Million JPY~8 Million JPY~
0%
20%
40%
60%
80%
100%
Mal
e
Fem
ale
Mal
e
Fem
ale
Mal
e
Fem
ale
Mal
e
Fem
ale
Mal
e
Fem
ale
Mal
e
Fem
ale
25~ 30~ 35~ 40~ 45~ 50~
None Under 1 Million JPY 1 Million JPY~2 Million JPY~ 3 Million JPY~ 4 Million JPY~5 Million JPY~ 6 Million JPY~ 7 Million JPY~8 Million JPY~
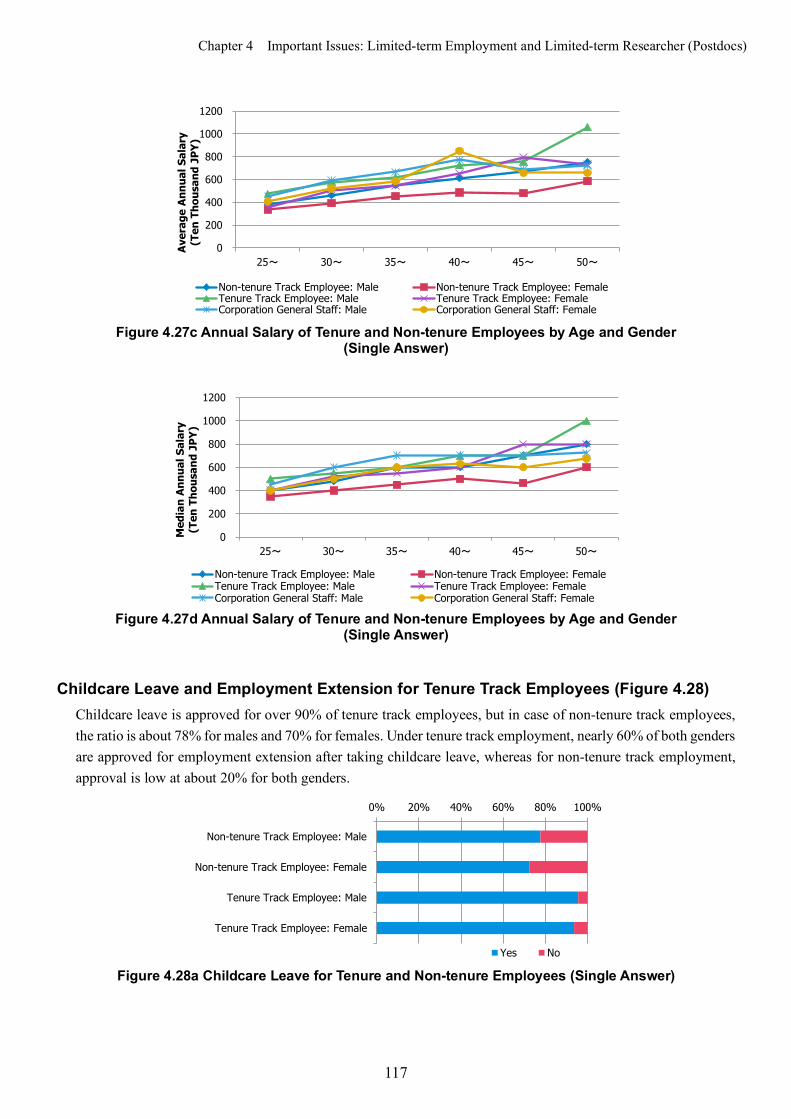
Chapter 4 Important Issues: Limited-term Employment and Limited-term Researcher (Postdocs)
117
Figure 4.27c Annual Salary of Tenure and Non-tenure Employees by Age and Gender
(Single Answer)
Figure 4.27d Annual Salary of Tenure and Non-tenure Employees by Age and Gender
(Single Answer)
Childcare Leave and Employment Extension for Tenure Track Employees (Figure 4.28) Childcare leave is approved for over 90% of tenure track employees, but in case of non-tenure track employees, the ratio is about 78% for males and 70% for females. Under tenure track employment, nearly 60% of both genders are approved for employment extension after taking childcare leave, whereas for non-tenure track employment, approval is low at about 20% for both genders.
Figure 4.28a Childcare Leave for Tenure and Non-tenure Employees (Single Answer)
0
200
400
600
800
1000
1200
25~ 30~ 35~ 40~ 45~ 50~
Aver
age
Annu
al S
alar
y (T
en T
hous
and
JPY)
Non-tenure Track Employee: Male Non-tenure Track Employee: FemaleTenure Track Employee: Male Tenure Track Employee: FemaleCorporation General Staff: Male Corporation General Staff: Female
0
200
400
600
800
1000
1200
25~ 30~ 35~ 40~ 45~ 50~
Med
ian
Annu
al S
alar
y (T
en T
hous
and
JPY)
Non-tenure Track Employee: Male Non-tenure Track Employee: FemaleTenure Track Employee: Male Tenure Track Employee: FemaleCorporation General Staff: Male Corporation General Staff: Female
0% 20% 40% 60% 80% 100%
Non-tenure Track Employee: Male
Non-tenure Track Employee: Female
Tenure Track Employee: Male
Tenure Track Employee: Female
Yes No
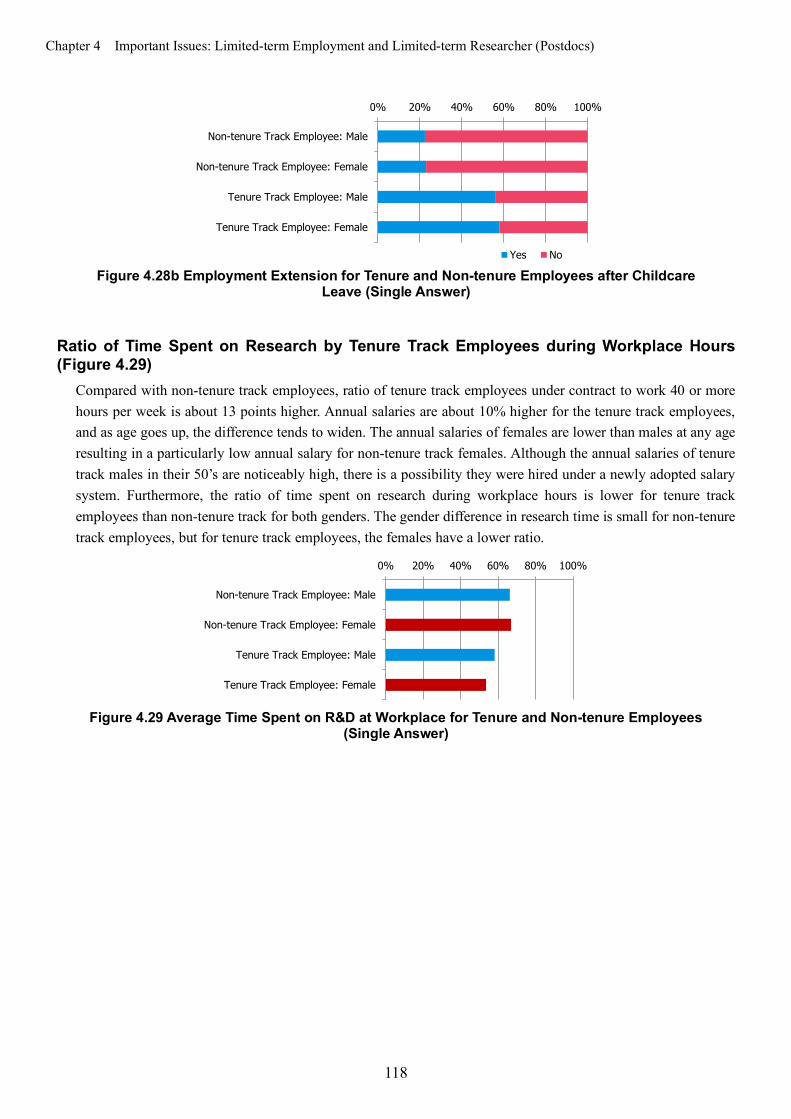
Chapter 4 Important Issues: Limited-term Employment and Limited-term Researcher (Postdocs)
118
Figure 4.28b Employment Extension for Tenure and Non-tenure Employees after Childcare
Leave (Single Answer)
Ratio of Time Spent on Research by Tenure Track Employees during Workplace Hours (Figure 4.29)
Compared with non-tenure track employees, ratio of tenure track employees under contract to work 40 or more hours per week is about 13 points higher. Annual salaries are about 10% higher for the tenure track employees, and as age goes up, the difference tends to widen. The annual salaries of females are lower than males at any age resulting in a particularly low annual salary for non-tenure track females. Although the annual salaries of tenure track males in their 50’s are noticeably high, there is a possibility they were hired under a newly adopted salary system. Furthermore, the ratio of time spent on research during workplace hours is lower for tenure track employees than non-tenure track for both genders. The gender difference in research time is small for non-tenure track employees, but for tenure track employees, the females have a lower ratio.
Figure 4.29 Average Time Spent on R&D at Workplace for Tenure and Non-tenure Employees
(Single Answer)
0% 20% 40% 60% 80% 100%
Non-tenure Track Employee: Male
Non-tenure Track Employee: Female
Tenure Track Employee: Male
Tenure Track Employee: Female
Yes No
0% 20% 40% 60% 80% 100%
Non-tenure Track Employee: Male
Non-tenure Track Employee: Female
Tenure Track Employee: Male
Tenure Track Employee: Female

Chapter 5 Important Issues: Program and Policy Awareness
119
Chapter 5 Important Issues: Program and Policy Awareness
5.1 Familiarity with Recent Laws and Policies Respondents were inquired as to their familiarity with the following recently enacted programs, policies and formulated basic plans.
- The Act on Promotion of Women’s Participation and Advancement in the Workplace (Effective April 1, 2016)
- 5th Science and Technology Basic Plan (Approved January 2016)
- Fourth Basic Plan for Gender Equality (Approved December 2015)
- Excellent Young Researchers Program (March 2016)
Figure 5.1 Awareness of Recent Laws/Policies by Age Group and Gender
(Single Answer per Item)
0%
20%
40%
60%
80%
Male Female Male Female Male Female Male Female Male Female
The Act on Promotion of Women’s Participation
and Advancement
in the Workplace
5th Scienceand Technology
Basic Plan
Fourth Basic Planfor Gender
Equality
ExcellentYoung
ResearchersProgram
Do not know
20~ 30~ 40~ 50~ 60~ 70~
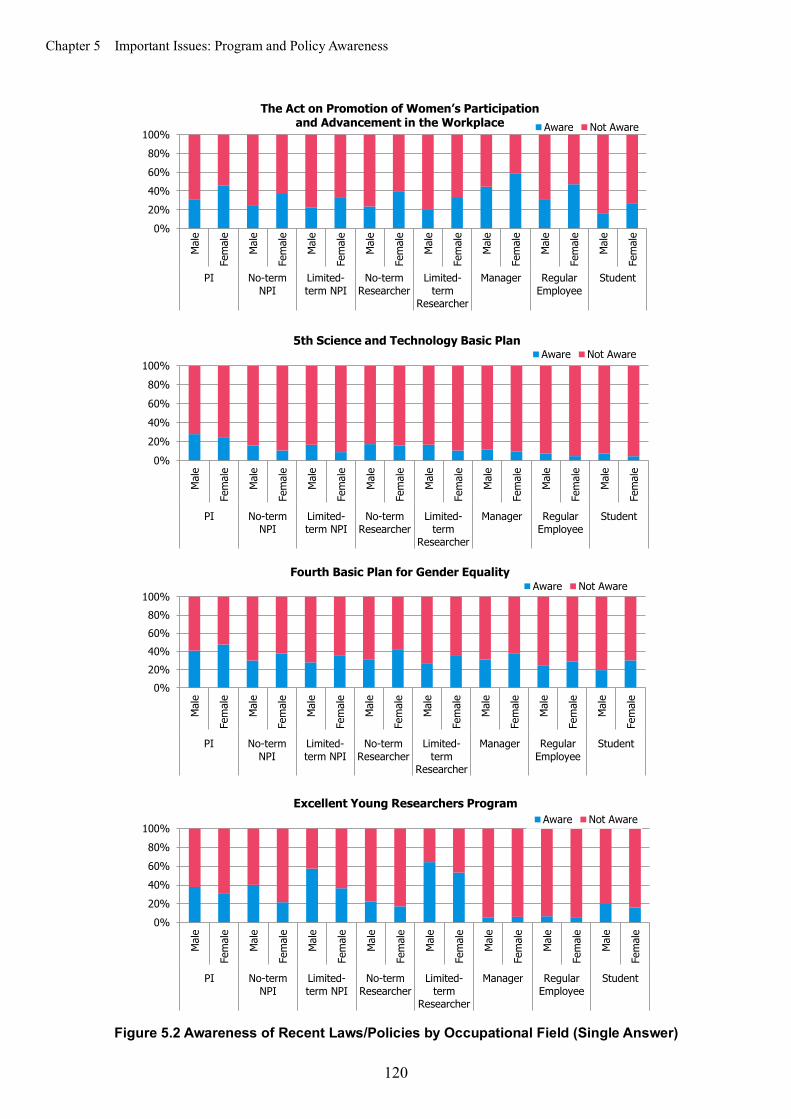
Chapter 5 Important Issues: Program and Policy Awareness
120
Figure 5.2 Awareness of Recent Laws/Policies by Occupational Field (Single Answer)
0%20%40%60%80%
100%
Mal
e
Fem
ale
Mal
e
Fem
ale
Mal
e
Fem
ale
Mal
e
Fem
ale
Mal
e
Fem
ale
Mal
e
Fem
ale
Mal
e
Fem
ale
Mal
e
Fem
ale
PI No-termNPI
Limited-term NPI
No-termResearcher
Limited-term
Researcher
Manager RegularEmployee
Student
The Act on Promotion of Women’s Participation and Advancement in the Workplace Aware Not Aware
0%20%40%60%80%
100%
Mal
e
Fem
ale
Mal
e
Fem
ale
Mal
e
Fem
ale
Mal
e
Fem
ale
Mal
e
Fem
ale
Mal
e
Fem
ale
Mal
e
Fem
ale
Mal
e
Fem
ale
PI No-termNPI
Limited-term NPI
No-termResearcher
Limited-term
Researcher
Manager RegularEmployee
Student
5th Science and Technology Basic PlanAware Not Aware
0%20%40%60%80%
100%
Mal
e
Fem
ale
Mal
e
Fem
ale
Mal
e
Fem
ale
Mal
e
Fem
ale
Mal
e
Fem
ale
Mal
e
Fem
ale
Mal
e
Fem
ale
Mal
e
Fem
ale
PI No-termNPI
Limited-term NPI
No-termResearcher
Limited-term
Researcher
Manager RegularEmployee
Student
Fourth Basic Plan for Gender EqualityAware Not Aware
0%20%40%60%80%
100%
Mal
e
Fem
ale
Mal
e
Fem
ale
Mal
e
Fem
ale
Mal
e
Fem
ale
Mal
e
Fem
ale
Mal
e
Fem
ale
Mal
e
Fem
ale
Mal
e
Fem
ale
PI No-termNPI
Limited-term NPI
No-termResearcher
Limited-term
Researcher
Manager RegularEmployee
Student
Excellent Young Researchers ProgramAware Not Aware

Chapter 5 Important Issues: Program and Policy Awareness
121
Figure 5.3 Awareness of Recent Laws/Policies by Job Position (Single Answer per Item)
0%
20%
40%
60%
80%
100%
The Act on Promotion of
Women’s Participation and Advancement in the Workplace
5th Science andTechnologyBasic Plan
Fourth BasicPlan for Gender
Equality
Excellent YoungResearchers
Program
Do not know
University/Technical CollegeDean and aboveProfessorAssociate ProfessorLecturerAssistant ProfessorResearch AssociateNo-term ResearcherLimited-term ResearcherResearch TechnicianOthers
0%
20%
40%
60%
80%
100%
The Act on Promotion of
Women’s Participation and Advancement in the Workplace
5th Science andTechnologyBasic Plan
Fourth BasicPlan for Gender
Equality
Excellent YoungResearchers
Program
Do not know
Research Institution
DirectorDivision HeadGroup Lab ChiefSenior ResearcherNo-term ResearcherLimited-term ResearcherResearch TechnicianOthers
0%
20%
40%
60%
80%
100%
The Act on Promotion of
Women’s Participation and Advancement in the Workplace
5th Science andTechnologyBasic Plan
Fourth BasicPlan for Gender
Equality
Excellent YoungResearchers
Program
Do not know
Corporation
Executive Director and aboveGeneral ManagerSenior ManagerManagerGroup LeaderGeneral StaffOthers

Chapter 5 Important Issues: Program and Policy Awareness
122
Figure 5.4 Awareness of Recent Laws/Policies Overall by Profession
(Single Answer per Item) (excludes students)
5.2 Support Programs Currently Underway for Female Researchers Respondents were inquired as to whether they are familiar with the following six support programs currently underway for female researchers and if they are meaningful.
① Restart Support after Childbirth/Childcare: Project of the Japan Society for the Promotion of Science to support “special researchers-RPD” and outstanding young researchers to smoothly return to the research arena after childbirth/childcare.
② Science Course Selection Support for Middle and High School Females: Project of the Japan Science and Technology Agency (JST) aimed at supporting middle and high school females select science career paths.
③ Initiative for Realizing Diversity in the Research Environment (Formerly Supporting Activities for Female Researchers): Project of the Ministry of Education, Culture, Sports, Science and Technology - Japan aimed at supporting environmental improvement so that female researchers can balance life events and research.
④ Childbirth and Childcare Consideration in Scientific Research Grants: i) Program enabling researchers with scientific research grants to resume research interrupted due to maternity/childcare leave. ii) Research subjects set up for researchers who are unable to apply for grants during the application period due to maternity/childcare leave. iii) Application age limit for research subjects relaxed taking into consideration maternity/childcare leave (from the previous 37 years old or under to 39 years old or under). These programs are also applicable to males who take childcare leave. The above is the work of the Japan Society for the Promotion of Science.
⑤ Strategic Basic Research Programs’ measures for considering childbirth and child-caring: Project of JST. It is “a program allowing researchers to interrupt and extend research at times of birth/childcare and supports the researchers’
0%
20%
40%
60%
The Act on Promotion of
Women’s Participation and Advancement in the Workplace
5th Science andTechnologyBasic Plan
Fourth BasicPlan for Gender
Equality
Excellent YoungResearchers
Program
Do not know
MathematicsElectronics and InformationPhysicsChemical and Material EngineeringLife science and BiologyCivil EngineeringMechanical EngineeringEarth and Planetary ScienceAgricultureMedicine, Dentistry and PharmacologyHealth and Nursing

Chapter 5 Important Issues: Program and Policy Awareness
123
comeback”.
⑥ Challenge Campaign (Riko-challe) - Science and Engineering Field Selection for Female Students: Project of the Gender Equality Bureau Cabinet Office to further accelerate the efforts for encouraging female high school students and others to select science and engineering career paths by providing information such as introduction of female researchers/engineers from various science and engineering fields.
0%
20%
40%
60%
80%
100%
Mal
e
Fem
ale
Mal
e
Fem
ale
Mal
e
Fem
ale
Mal
e
Fem
ale
Mal
e
Fem
ale
Mal
e
Fem
ale
Mal
e
Fem
ale
Mal
e
Fem
ale
PI No-term NPI Limited-termNPI
No-termResearcher
Limited-termResearcher
Manager RegularEmployee
Student
Restart Support after Childbirth/Childcare (RPD Program)
0%
20%
40%
60%
80%
100%
Mal
e
Fem
ale
Mal
e
Fem
ale
Mal
e
Fem
ale
Mal
e
Fem
ale
Mal
e
Fem
ale
Mal
e
Fem
ale
Mal
e
Fem
ale
Mal
e
Fem
ale
PI No-term NPI Limited-termNPI
No-termResearcher
Limited-termResearcher
Manager RegularEmployee
Student
Science Course Selection Support for Middle and High School Females
0%
20%
40%
60%
80%
100%
Mal
e
Fem
ale
Mal
e
Fem
ale
Mal
e
Fem
ale
Mal
e
Fem
ale
Mal
e
Fem
ale
Mal
e
Fem
ale
Mal
e
Fem
ale
Mal
e
Fem
ale
PI No-term NPI Limited-termNPI
No-termResearcher
Limited-termResearcher
Manager RegularEmployee
Student
Initiative for Realizing Diversity in the Research Environment
Meaningful Uncertain Not meaningful Unaware

Chapter 5 Important Issues: Program and Policy Awareness
124
Figure 5.5 Perception of Recent Policies by Occupational Field (Single Answer)
0%
20%
40%
60%
80%
100%
Mal
e
Fem
ale
Mal
e
Fem
ale
Mal
e
Fem
ale
Mal
e
Fem
ale
Mal
e
Fem
ale
Mal
e
Fem
ale
Mal
e
Fem
ale
Mal
e
Fem
ale
PI No-term NPI Limited-termNPI
No-termResearcher
Limited-termResearcher
Manager RegularEmployee
Student
Childbirth and Childcare Consideration in Scientific Research Grants
0%
20%
40%
60%
80%
100%
Mal
e
Fem
ale
Mal
e
Fem
ale
Mal
e
Fem
ale
Mal
e
Fem
ale
Mal
e
Fem
ale
Mal
e
Fem
ale
Mal
e
Fem
ale
Mal
e
Fem
ale
PI No-term NPI Limited-termNPI
No-termResearcher
Limited-termResearcher
Manager RegularEmployee
Student
JST Strategic Basic Research Programs’ Measures for Considering Childbirth and Child-caring
0%
20%
40%
60%
80%
100%
Mal
e
Fem
ale
Mal
e
Fem
ale
Mal
e
Fem
ale
Mal
e
Fem
ale
Mal
e
Fem
ale
Mal
e
Fem
ale
Mal
e
Fem
ale
Mal
e
Fem
ale
PI No-term NPI Limited-termNPI
No-termResearcher
Limited-termResearcher
Manager RegularEmployee
Student
Challenge Campaign – Science and Engineering Field Selection for Female Students
Meaningful Uncertain Not meaningful Unaware
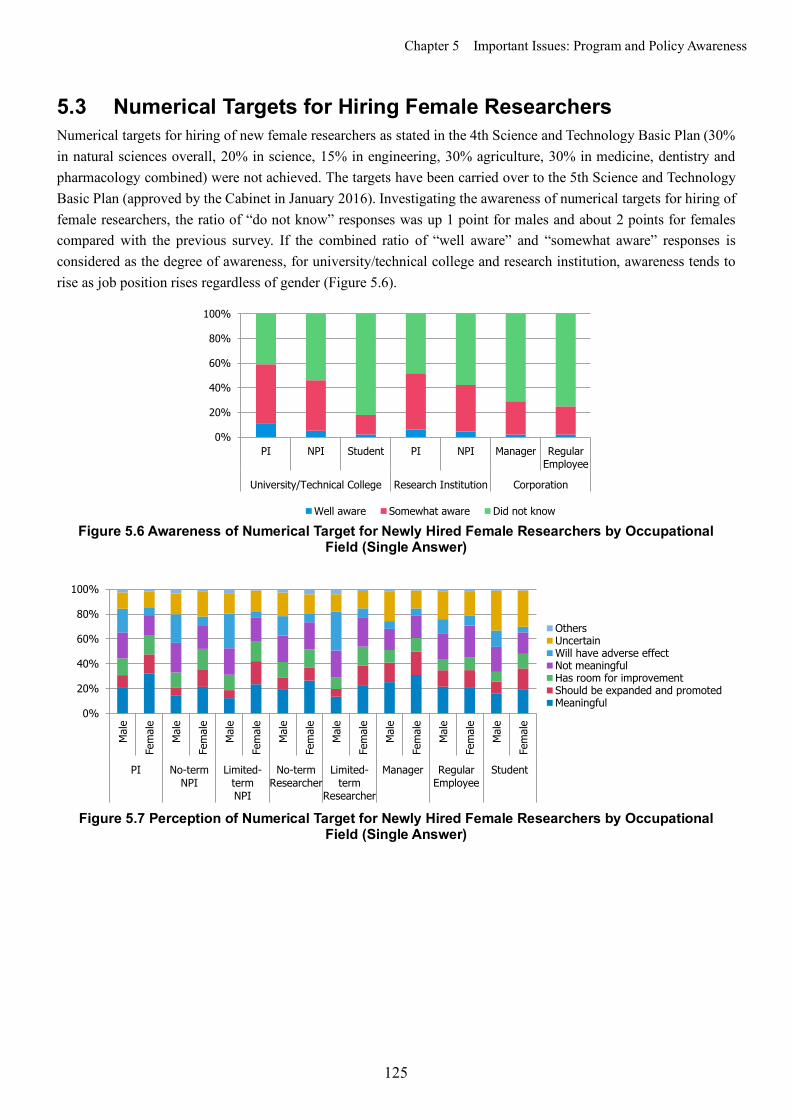
Chapter 5 Important Issues: Program and Policy Awareness
125
5.3 Numerical Targets for Hiring Female Researchers Numerical targets for hiring of new female researchers as stated in the 4th Science and Technology Basic Plan (30% in natural sciences overall, 20% in science, 15% in engineering, 30% agriculture, 30% in medicine, dentistry and pharmacology combined) were not achieved. The targets have been carried over to the 5th Science and Technology Basic Plan (approved by the Cabinet in January 2016). Investigating the awareness of numerical targets for hiring of female researchers, the ratio of “do not know” responses was up 1 point for males and about 2 points for females compared with the previous survey. If the combined ratio of “well aware” and “somewhat aware” responses is considered as the degree of awareness, for university/technical college and research institution, awareness tends to rise as job position rises regardless of gender (Figure 5.6).
Figure 5.6 Awareness of Numerical Target for Newly Hired Female Researchers by Occupational
Field (Single Answer)
Figure 5.7 Perception of Numerical Target for Newly Hired Female Researchers by Occupational
Field (Single Answer)
0%
20%
40%
60%
80%
100%
PI NPI Student PI NPI Manager RegularEmployee
University/Technical College Research Institution Corporation
Well aware Somewhat aware Did not know
0%
20%
40%
60%
80%
100%
Mal
e
Fem
ale
Mal
e
Fem
ale
Mal
e
Fem
ale
Mal
e
Fem
ale
Mal
e
Fem
ale
Mal
e
Fem
ale
Mal
e
Fem
ale
Mal
e
Fem
ale
PI No-termNPI
Limited-termNPI
No-termResearcher
Limited-term
Researcher
Manager RegularEmployee
Student
OthersUncertainWill have adverse effectNot meaningfulHas room for improvementShould be expanded and promotedMeaningful

Chapter 5 Important Issues: Program and Policy Awareness
126
Figure 5.8 Perception of Numerical Target for Newly Hired Female Researchers by Profession
(Single Answer) (excludes students)
Figure 5.9 Perception of Numerical Target for Newly Hired Female Researchers by Age Group
(Single Answer)
0%
20%
40%
60%
80%
100%M
ale
Fem
ale
Mal
e
Fem
ale
Mal
e
Fem
ale
Mal
e
Fem
ale
Mal
e
Fem
ale
Mal
e
Fem
ale
Mal
e
Fem
ale
Mal
e
Fem
ale
Mal
e
Fem
ale
Mal
e
Fem
ale
Mal
e
Fem
ale
Mal
e
Fem
ale
Mathematics Electronicsand
Information
Physics Chemicaland MaterialEngineering
Life scienceand
Biology
CivilEngineering
MechanicalEngineering
Earth andPlanetaryScience
Agriculture Medicine,Dentistry
andPharmacology
Health andNursing
Others
Meaningful Should be expanded and promoted Has room for improvement Not meaningful Will have adverse effect Uncertain Others
0%
20%
40%
60%
80%
100%
24 o
r Und
er
25~
30~
35~
40~
45~
50~
55~
60~
65~
70~
Male
0%
20%
40%
60%
80%
100%
24 o
r Und
er
25~
30~
35~
40~
45~
50~
55~
60~
65~
70~
Female
OthersUncertainWill have adverse effectNot meaningfulHas room for improvementMeaningfulShould be expanded and promoted
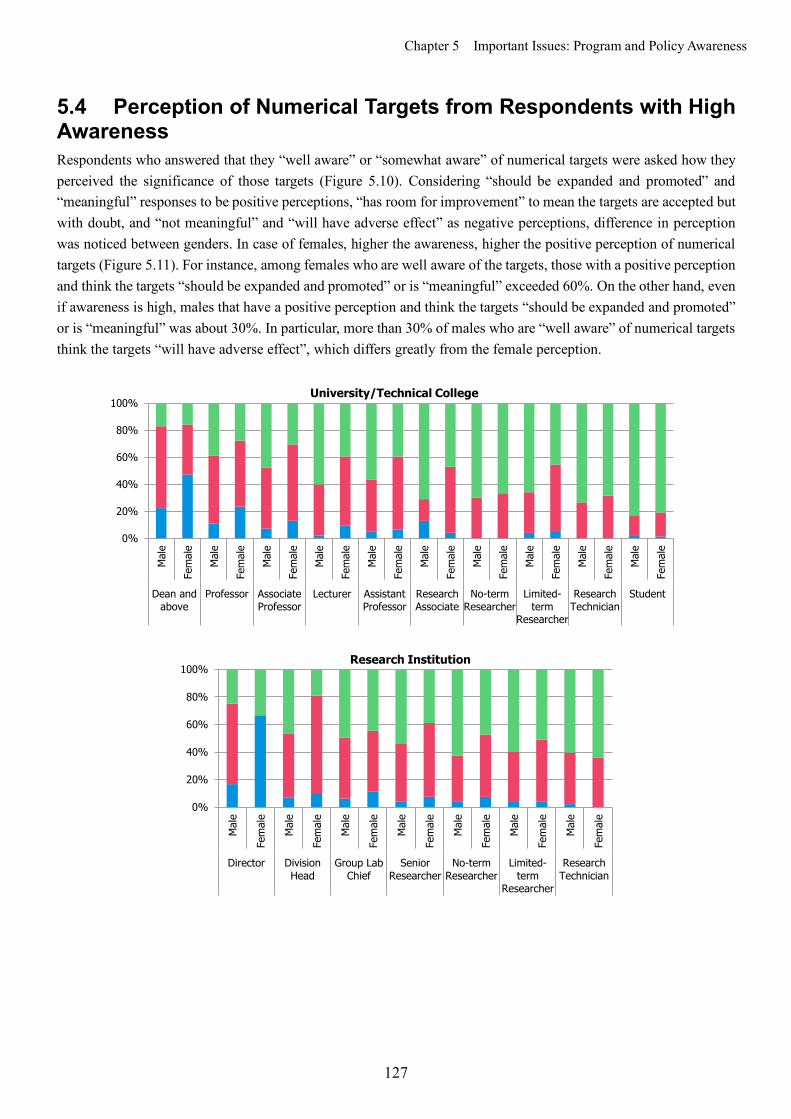
Chapter 5 Important Issues: Program and Policy Awareness
127
5.4 Perception of Numerical Targets from Respondents with High Awareness Respondents who answered that they “well aware” or “somewhat aware” of numerical targets were asked how they perceived the significance of those targets (Figure 5.10). Considering “should be expanded and promoted” and “meaningful” responses to be positive perceptions, “has room for improvement” to mean the targets are accepted but with doubt, and “not meaningful” and “will have adverse effect” as negative perceptions, difference in perception was noticed between genders. In case of females, higher the awareness, higher the positive perception of numerical targets (Figure 5.11). For instance, among females who are well aware of the targets, those with a positive perception and think the targets “should be expanded and promoted” or is “meaningful” exceeded 60%. On the other hand, even if awareness is high, males that have a positive perception and think the targets “should be expanded and promoted” or is “meaningful” was about 30%. In particular, more than 30% of males who are “well aware” of numerical targets think the targets “will have adverse effect”, which differs greatly from the female perception.
0%
20%
40%
60%
80%
100%
Mal
e
Fem
ale
Mal
e
Fem
ale
Mal
e
Fem
ale
Mal
e
Fem
ale
Mal
e
Fem
ale
Mal
e
Fem
ale
Mal
e
Fem
ale
Mal
e
Fem
ale
Mal
e
Fem
ale
Mal
e
Fem
ale
Dean andabove
Professor AssociateProfessor
Lecturer AssistantProfessor
ResearchAssociate
No-termResearcher
Limited-term
Researcher
ResearchTechnician
Student
University/Technical College
0%
20%
40%
60%
80%
100%
Mal
e
Fem
ale
Mal
e
Fem
ale
Mal
e
Fem
ale
Mal
e
Fem
ale
Mal
e
Fem
ale
Mal
e
Fem
ale
Mal
e
Fem
ale
Director DivisionHead
Group LabChief
SeniorResearcher
No-termResearcher
Limited-term
Researcher
ResearchTechnician
Research Institution

Chapter 5 Important Issues: Program and Policy Awareness
128
Figure 5.10 Awareness of Numerical Target by Job Position (Single Answer)
Figure 5.11 Awareness of Numerical Target and Perception on Significance (Single Answer)
(excludes "uncertain")
0%
20%
40%
60%
80%
100%
Mal
e
Fem
ale
Mal
e
Fem
ale
Mal
e
Fem
ale
Mal
e
Fem
ale
Mal
e
Fem
ale
Mal
e
Fem
ale
ExecutiveDirector
and above
GeneralManager
SeniorManager
Manager GroupLeader
GeneralStaff
Corporation
Well aware Somewhat aware Did not know
0%
20%
40%
60%
80%
100%
Well aware Somewhataware
Did notknow
Male
0%
20%
40%
60%
80%
100%
Wellaware
Somewhataware
Did notknow
Female
Others
Will have adverse effect
Not meaningful
Has room for improvement
Meaningful
Should be expanded andpromoted
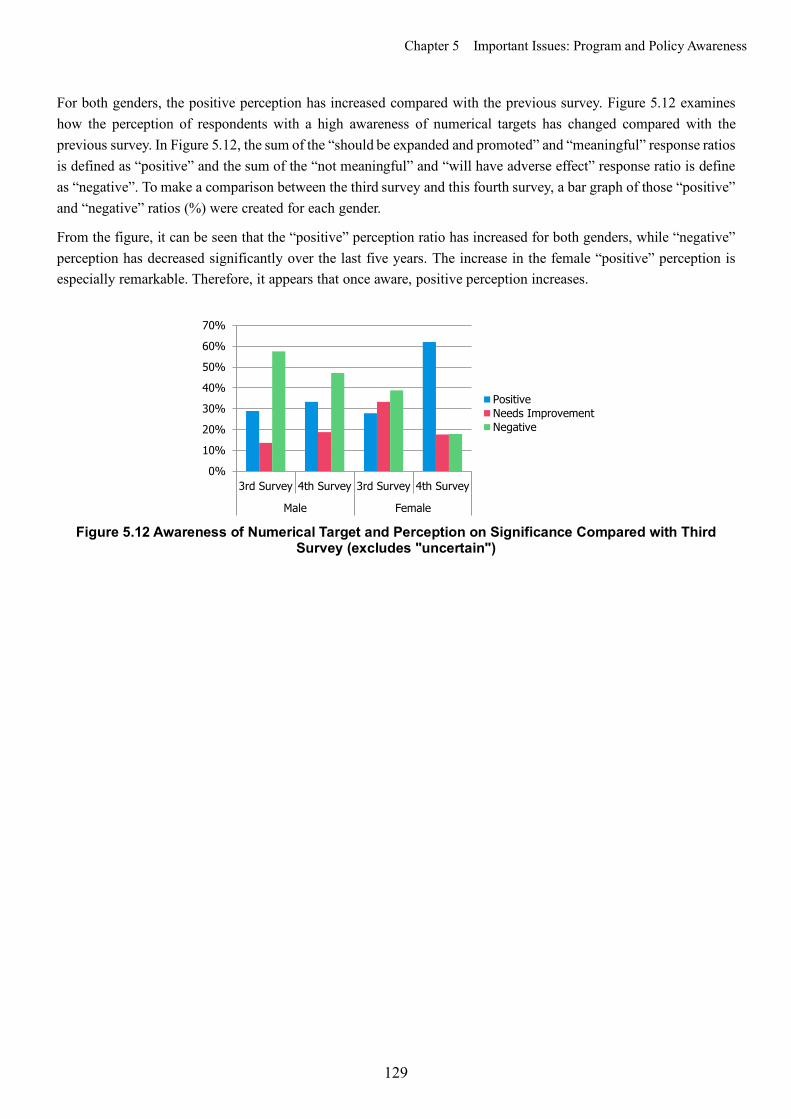
Chapter 5 Important Issues: Program and Policy Awareness
129
For both genders, the positive perception has increased compared with the previous survey. Figure 5.12 examines how the perception of respondents with a high awareness of numerical targets has changed compared with the previous survey. In Figure 5.12, the sum of the “should be expanded and promoted” and “meaningful” response ratios is defined as “positive” and the sum of the “not meaningful” and “will have adverse effect” response ratio is define as “negative”. To make a comparison between the third survey and this fourth survey, a bar graph of those “positive” and “negative” ratios (%) were created for each gender.
From the figure, it can be seen that the “positive” perception ratio has increased for both genders, while “negative” perception has decreased significantly over the last five years. The increase in the female “positive” perception is especially remarkable. Therefore, it appears that once aware, positive perception increases.
Figure 5.12 Awareness of Numerical Target and Perception on Significance Compared with Third
Survey (excludes "uncertain")
0%
10%
20%
30%
40%
50%
60%
70%
3rd Survey 4th Survey 3rd Survey 4th Survey
Male Female
PositiveNeeds ImprovementNegative
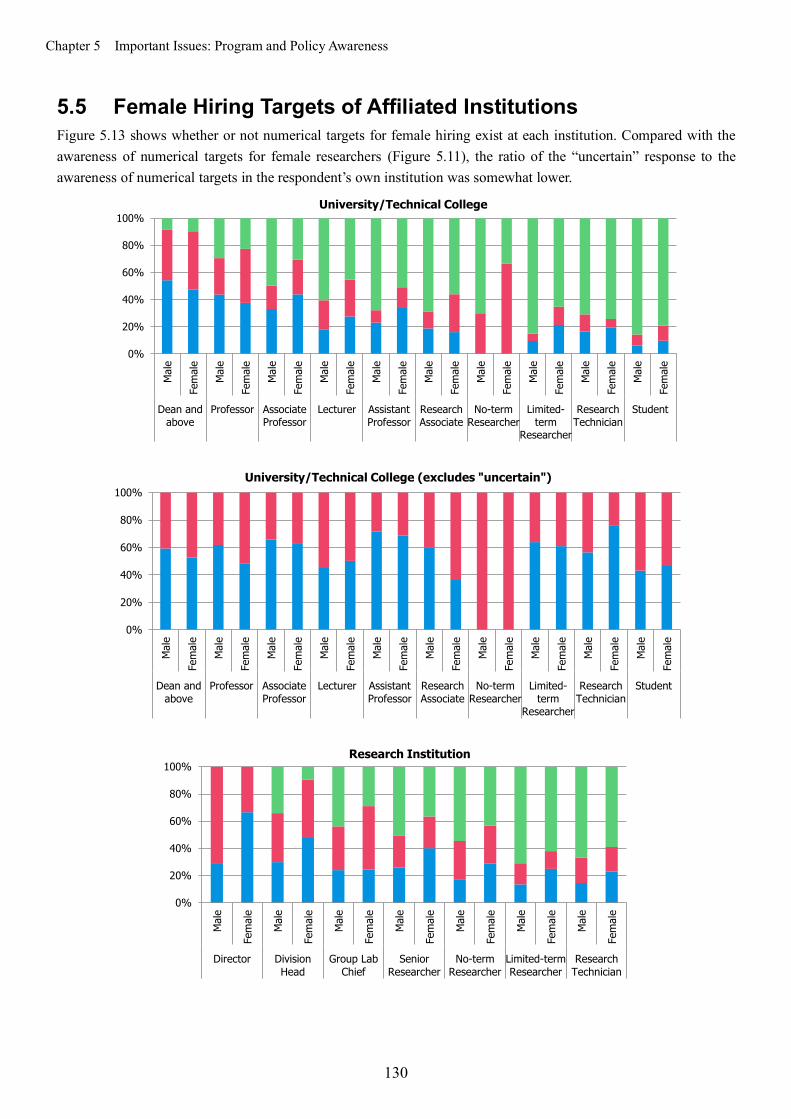
Chapter 5 Important Issues: Program and Policy Awareness
130
5.5 Female Hiring Targets of Affiliated Institutions Figure 5.13 shows whether or not numerical targets for female hiring exist at each institution. Compared with the awareness of numerical targets for female researchers (Figure 5.11), the ratio of the “uncertain” response to the awareness of numerical targets in the respondent’s own institution was somewhat lower.
0%
20%
40%
60%
80%
100%
Mal
e
Fem
ale
Mal
e
Fem
ale
Mal
e
Fem
ale
Mal
e
Fem
ale
Mal
e
Fem
ale
Mal
e
Fem
ale
Mal
e
Fem
ale
Mal
e
Fem
ale
Mal
e
Fem
ale
Mal
e
Fem
ale
Dean andabove
Professor AssociateProfessor
Lecturer AssistantProfessor
ResearchAssociate
No-termResearcher
Limited-term
Researcher
ResearchTechnician
Student
University/Technical College
0%
20%
40%
60%
80%
100%
Mal
e
Fem
ale
Mal
e
Fem
ale
Mal
e
Fem
ale
Mal
e
Fem
ale
Mal
e
Fem
ale
Mal
e
Fem
ale
Mal
e
Fem
ale
Mal
e
Fem
ale
Mal
e
Fem
ale
Mal
e
Fem
ale
Dean andabove
Professor AssociateProfessor
Lecturer AssistantProfessor
ResearchAssociate
No-termResearcher
Limited-term
Researcher
ResearchTechnician
Student
University/Technical College (excludes "uncertain")
0%
20%
40%
60%
80%
100%
Mal
e
Fem
ale
Mal
e
Fem
ale
Mal
e
Fem
ale
Mal
e
Fem
ale
Mal
e
Fem
ale
Mal
e
Fem
ale
Mal
e
Fem
ale
Director DivisionHead
Group LabChief
SeniorResearcher
No-termResearcher
Limited-termResearcher
ResearchTechnician
Research Institution
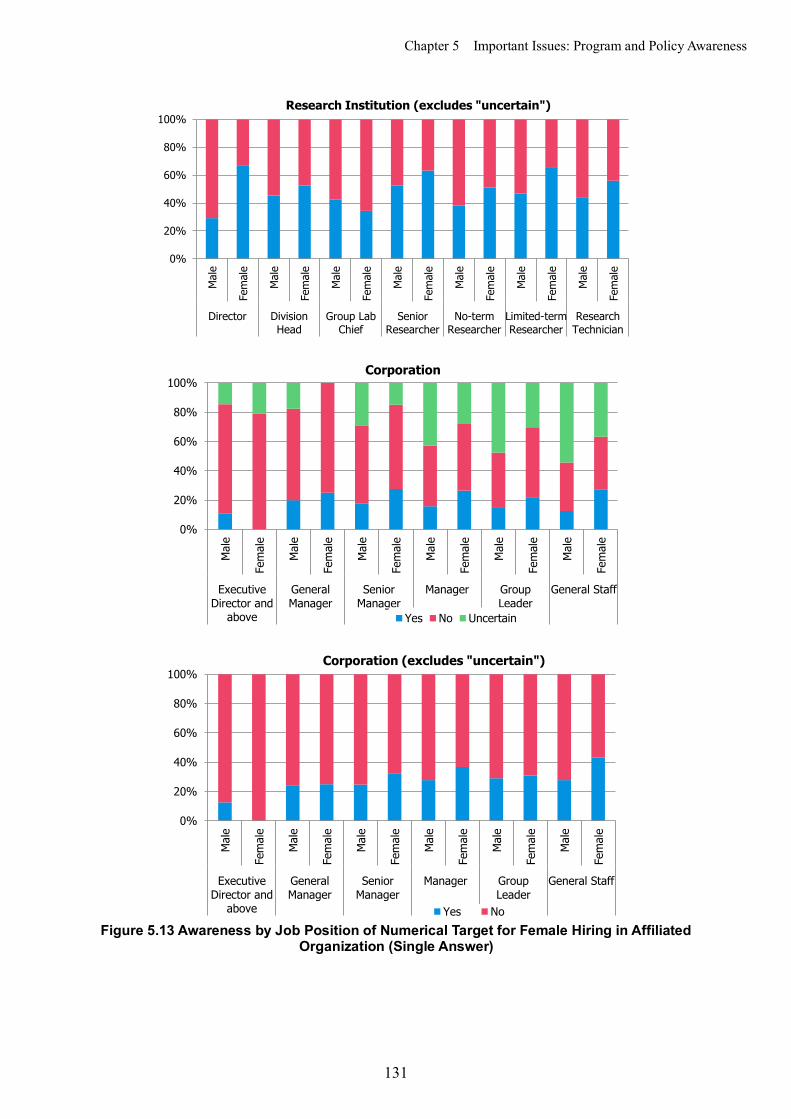
Chapter 5 Important Issues: Program and Policy Awareness
131
Figure 5.13 Awareness by Job Position of Numerical Target for Female Hiring in Affiliated
Organization (Single Answer)
0%
20%
40%
60%
80%
100%
Mal
e
Fem
ale
Mal
e
Fem
ale
Mal
e
Fem
ale
Mal
e
Fem
ale
Mal
e
Fem
ale
Mal
e
Fem
ale
Mal
e
Fem
ale
Director DivisionHead
Group LabChief
SeniorResearcher
No-termResearcher
Limited-termResearcher
ResearchTechnician
Research Institution (excludes "uncertain")
0%
20%
40%
60%
80%
100%
Mal
e
Fem
ale
Mal
e
Fem
ale
Mal
e
Fem
ale
Mal
e
Fem
ale
Mal
e
Fem
ale
Mal
e
Fem
ale
ExecutiveDirector and
above
GeneralManager
SeniorManager
Manager GroupLeader
General Staff
Corporation
Yes No Uncertain
0%
20%
40%
60%
80%
100%
Mal
e
Fem
ale
Mal
e
Fem
ale
Mal
e
Fem
ale
Mal
e
Fem
ale
Mal
e
Fem
ale
Mal
e
Fem
ale
ExecutiveDirector and
above
GeneralManager
SeniorManager
Manager GroupLeader
General Staff
Corporation (excludes "uncertain")
Yes No
Chapter 5 Important Issues: Program and Policy Awareness
132
There was a big change in the responses to the question of whether or not targets are publicized if they exist (Figure 5.14). Publication of the targets and the awareness of publication have both increased since the third survey.
0%
20%
40%
60%
80%
100%M
ale
Fem
ale
Mal
e
Fem
ale
Mal
e
Fem
ale
Mal
e
Fem
ale
Mal
e
Fem
ale
Mal
e
Fem
ale
Mal
e
Fem
ale
Mal
e
Fem
ale
Mal
e
Fem
ale
Mal
e
Fem
ale
Dean andabove
Professor AssociateProfessor
Lecturer AssistantProfessor
ResearchAssociate
No-termResearcher
Limited-term
Researcher
ResearchTechnician
Student
University/Technical College
0%
20%
40%
60%
80%
100%
Mal
e
Fem
ale
Mal
e
Fem
ale
Mal
e
Fem
ale
Mal
e
Fem
ale
Mal
e
Fem
ale
Mal
e
Fem
ale
Mal
e
Fem
ale
Mal
e
Fem
ale
Mal
e
Fem
ale
Mal
e
Fem
ale
Dean andabove
Professor AssociateProfessor
Lecturer AssistantProfessor
ResearchAssociate
No-termResearcher
Limited-term
Researcher
ResearchTechnician
Student
University/Technical College (excludes "uncertain")
0%
20%
40%
60%
80%
100%
Mal
e
Fem
ale
Mal
e
Fem
ale
Mal
e
Fem
ale
Mal
e
Fem
ale
Mal
e
Fem
ale
Mal
e
Fem
ale
Mal
e
Fem
ale
Director DivisionHead
Group LabChief
SeniorResearcher
No-termResearcher
Limited-termResearcher
ResearchTechnician
Research Institution
Chapter 5 Important Issues: Program and Policy Awareness
133
Figure 5.14 Awareness by Job Position of Publicized Numerical Target for Female Hiring in
Affiliated Organization (Single Answer)
0%
20%
40%
60%
80%
100%
Mal
e
Fem
ale
Mal
e
Fem
ale
Mal
e
Fem
ale
Mal
e
Fem
ale
Mal
e
Fem
ale
Mal
e
Fem
ale
Mal
e
Fem
ale
Director DivisionHead
Group LabChief
SeniorResearcher
No-termResearcher
Limited-termResearcher
ResearchTechnician
Research Institution (excludes "uncertain")
0%
20%
40%
60%
80%
100%
Mal
e
Fem
ale
Mal
e
Fem
ale
Mal
e
Fem
ale
Mal
e
Fem
ale
Mal
e
Fem
ale
Mal
e
Fem
ale
ExecutiveDirector and
above
GeneralManager
SeniorManager
Manager Group Leader General Staff
Corporation
Yes No Uncertain
0%
20%
40%
60%
80%
100%
Mal
e
Fem
ale
Mal
e
Fem
ale
Mal
e
Fem
ale
Mal
e
Fem
ale
Mal
e
Fem
ale
Mal
e
Fem
ale
ExecutiveDirector and
above
GeneralManager
SeniorManager
Manager Group Leader General Staff
Corporation (excludes "uncertain")
Yes No
Chapter 5 Important Issues: Program and Policy Awareness
134
Like the third survey, the “necessity” of numerical targets for the hiring of female researchers was examined according to job position (Figure 5.15). In order to make a comparison with the third survey, discussion is carried out mainly on the ratios that exclude “uncertain” responses. In the third survey, the “necessary” response was higher for females of all job positions. However, in the fourth survey, that response was often lower for corporation females compared with the others. Even after being carried over from the 4th to the 5th Science and Technology Basic Plan, the purpose of setting numerical targets for the hiring of female researchers is not well understood or known. It may be necessary to rethink why Japan has established numerical targets for female researchers at the national level and that the same targets have been reestablished five years later then devise new policies. There were many written comments with regard to numerical targets for female hiring (Figure 6.4), and those from male respondents were overwhelmingly high accounting for 85% of the comments. For descriptions of the comments, refer to 6.2 (iv) Numerical Targets for Hiring of Female Researchers.
0%
20%
40%
60%
80%
100%
Mal
e
Fem
ale
Mal
e
Fem
ale
Mal
e
Fem
ale
Mal
e
Fem
ale
Mal
e
Fem
ale
Mal
e
Fem
ale
Mal
e
Fem
ale
Mal
e
Fem
ale
Mal
e
Fem
ale
Mal
e
Fem
ale
Dean andabove
Professor AssociateProfessor
Lecturer AssistantProfessor
ResearchAssociate
No-termResearcher
Limited-term
Researcher
ResearchTechnician
Student
University/Technical College
0%
20%
40%
60%
80%
100%
Mal
e
Fem
ale
Mal
e
Fem
ale
Mal
e
Fem
ale
Mal
e
Fem
ale
Mal
e
Fem
ale
Mal
e
Fem
ale
Mal
e
Fem
ale
Mal
e
Fem
ale
Mal
e
Fem
ale
Mal
e
Fem
ale
Dean andabove
Professor AssociateProfessor
Lecturer AssistantProfessor
ResearchAssociate
No-termResearcher
Limited-term
Researcher
ResearchTechnician
Student
University/Technical College (excludes "uncertain")

Chapter 5 Important Issues: Program and Policy Awareness
135
0%
20%
40%
60%
80%
100%
Mal
e
Fem
ale
Mal
e
Fem
ale
Mal
e
Fem
ale
Mal
e
Fem
ale
Mal
e
Fem
ale
Mal
e
Fem
ale
Mal
e
Fem
ale
Director DivisionHead
Group LabChief
SeniorResearcher
No-termResearcher
Limited-termResearcher
ResearchTechnician
Research Institution
0%
20%
40%
60%
80%
100%
Mal
e
Fem
ale
Mal
e
Fem
ale
Mal
e
Fem
ale
Mal
e
Fem
ale
Mal
e
Fem
ale
Mal
e
Fem
ale
Mal
e
Fem
ale
Director DivisionHead
Group LabChief
SeniorResearcher
No-termResearcher
Limited-termResearcher
ResearchTechnician
Research Institution (excludes "uncertain")
0%
20%
40%
60%
80%
100%
Mal
e
Fem
ale
Mal
e
Fem
ale
Mal
e
Fem
ale
Mal
e
Fem
ale
Mal
e
Fem
ale
Mal
e
Fem
ale
ExecutiveDirector and
above
GeneralManager
SeniorManager
Manager GroupLeader
General Staff
Corporation
Necessary Unnecessary Uncertain
Chapter 5 Important Issues: Program and Policy Awareness
136
Figure 5.15 Perception by Job Position on Necessity of Numerical Target (Single Answer)
0%
20%
40%
60%
80%
100%
Mal
e
Fem
ale
Mal
e
Fem
ale
Mal
e
Fem
ale
Mal
e
Fem
ale
Mal
e
Fem
ale
Mal
e
Fem
ale
ExecutiveDirector and
above
GeneralManager
SeniorManager
Manager GroupLeader
General Staff
Corporation (excludes "uncertain")
Necessary Unnecessary

Chapter 6 Written Comments
137
Chapter 6 Written Comments The free written comments received during the 4th large-scale survey have been analyzed and the respondents characteristics along with the current situation, problems, perception and desires of the natural science researchers and engineers have been compiled in this chapter.
6.1 Respondents’ Characteristics Among the 4,571 written comments received, 1,379 (25%) were from females. Overall, 28% of total female respondents and 24% of total male respondents submitted comments (Figure 6.1.1). Most of the comments came from respondents in their 30’s and 40’s for both genders (Figure 6.2.1). The ratio of comments from females beyond age 35 was greater than that of males (Figure 6.2.2). Figures 6.3.1 and 6.3.2 show the number and ratio, respectively, of comments compiled by occupational field.
Figure 6.1.1 Total Responses
and Written Comments
Figure 6.2.1 Number of Written Comments by Age/Gender
Figure 6.2.2 Ratio of Written Comments by Age/Gender
02000400060008000
100001200014000
Male Female
Num
ber
of R
espo
nses Total Responses
Written Comments
0
100
200
300
400
500
600
24 andUnder
25~ 30~ 35~ 40~ 45~ 50~ 55~ 60~ 65~ 70~
Num
ber
of W
ritt
en
Com
men
ts
MaleFemale
0
10
20
30
40
50
60
24 andUnder
30~ 40~ 50~ 60~ 70~
MaleFemale
%

Chapter 6 Written Comments
138
Figure 6.3.1 Number of Written Comments by Occupational Field
Figure 6.3.2 Ratio of Written Comments from Females by Occupational Field
0 100 200 300 400 500 600
Dean and aboveProfessor
Associate ProfessorLecturer
Assistant ProfessorResearch Associate
No-term ResearcherLimited-term Researcher
Research TechnicianStudentDirector
Division HeadGroup Lab Chief
Senior ResearcherNo-term Researcher
Limited-term ResearcherResearch Technician
Executive Director and aboveGeneral ManagerSenior Manager
ManagerGroup LeaderGeneral Staff
Univ
ersit
y/Te
chni
cal C
olle
geRe
sear
ch In
stitu
tion
Corp
orat
ion
Number of Written Comments
MaleFemale
0% 10% 20% 30% 40% 50% 60% 70%
Dean and aboveProfessor
Associate ProfessorLecturer
Assistant ProfessorResearch Associate
No-term ResearcherLimited-term Researcher
Research TechnicianStudentDirector
Division HeadGroup Lab Chief
Senior ResearcherNo-term Researcher
Limited-term ResearcherResearch Technician
Executive Director and aboveGeneral ManagerSenior Manager
ManagerGroup LeaderGeneral Staff
Univ
ersit
y/Te
chni
cal C
olle
geRe
sear
ch In
stitu
tion
Corp
orat
ion
Male RatioFemale Ratio
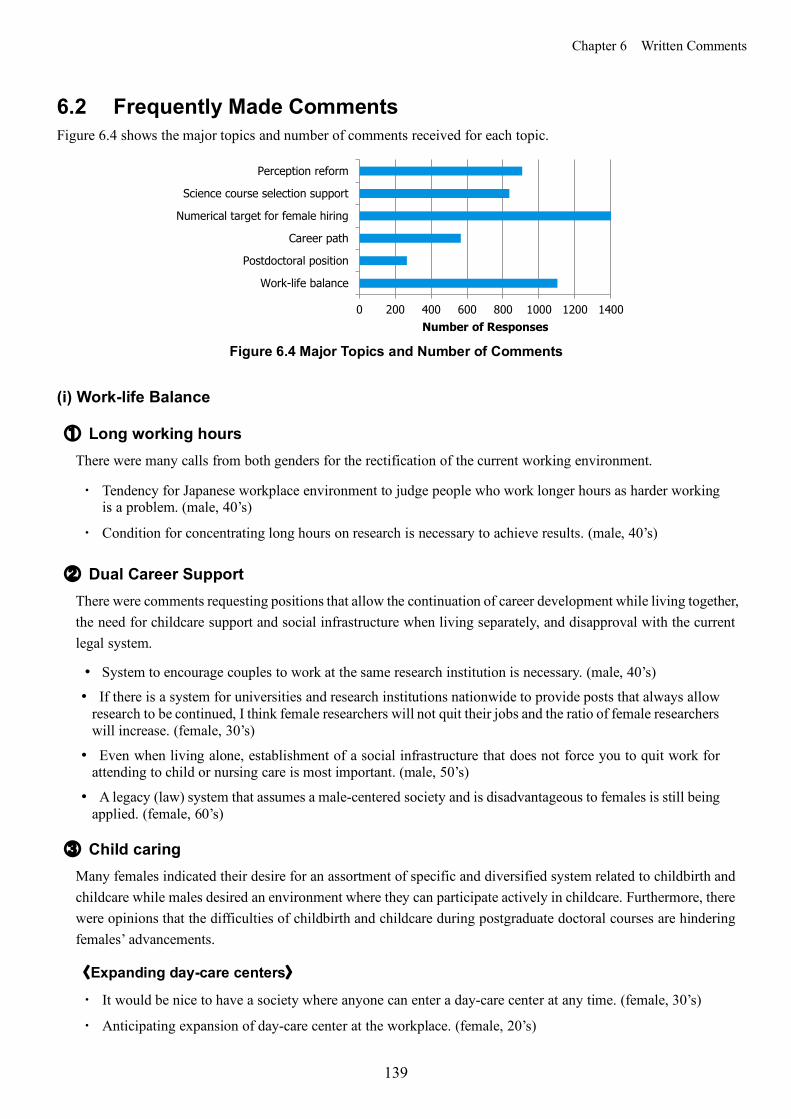
Chapter 6 Written Comments
139
6.2 Frequently Made Comments Figure 6.4 shows the major topics and number of comments received for each topic.
Figure 6.4 Major Topics and Number of Comments
(i) Work-life Balance ① Long working hours
There were many calls from both genders for the rectification of the current working environment.
・ Tendency for Japanese workplace environment to judge people who work longer hours as harder working is a problem. (male, 40’s)
・ Condition for concentrating long hours on research is necessary to achieve results. (male, 40’s)
② Dual Career Support There were comments requesting positions that allow the continuation of career development while living together, the need for childcare support and social infrastructure when living separately, and disapproval with the current legal system.
� System to encourage couples to work at the same research institution is necessary. (male, 40’s)
� If there is a system for universities and research institutions nationwide to provide posts that always allow research to be continued, I think female researchers will not quit their jobs and the ratio of female researchers will increase. (female, 30’s)
� Even when living alone, establishment of a social infrastructure that does not force you to quit work for attending to child or nursing care is most important. (male, 50’s)
� A legacy (law) system that assumes a male-centered society and is disadvantageous to females is still being applied. (female, 60’s)
③ Child caring
Many females indicated their desire for an assortment of specific and diversified system related to childbirth and childcare while males desired an environment where they can participate actively in childcare. Furthermore, there were opinions that the difficulties of childbirth and childcare during postgraduate doctoral courses are hindering females’ advancements.
〈Expanding day-care centers〉
・ It would be nice to have a society where anyone can enter a day-care center at any time. (female, 30’s)
・ Anticipating expansion of day-care center at the workplace. (female, 20’s)
0 200 400 600 800 1000 1200 1400
Work-life balance
Postdoctoral position
Career path
Numerical target for female hiring
Science course selection support
Perception reform
Number of Responses
Chapter 6 Written Comments
140
・ Not being able to place children in a day-care center when you are a doctoral student or postdoc is the fatal reason why a career ends. (female, 40's)
〈Allocation of assistant personnel during childcare leave〉
・ In the thirties, just when research work is coming on track, you are faced with taking leave for childbirth and reducing work for childcare. (female. 30’s)
・ In organizations that have duties to educate, such as universities, it is necessary to ensure adequate staffing. Currently, staffing is being reduced and the situation is going in the opposite direction. (male, 40’s)
〈Diversification of work system during childcare〉
・ In order to secure research time, it is necessary to have a system that exempts all miscellaneous duties for a certain period. (female, 40’s)
・ It is necessary to create a system that allows you to engage in some R&D work at home during childcare. (male, 50’s)
〈System improvement and consideration to allow males to participate in childcare〉
・ If both spouses work and share childcare, support and consideration is needed for not only the wife but also the husband. (male, 30’s)
・ Make it mandatory for companies to force males to take childcare leave, and penalize companies if males with a child under 10 years of age work more than 40 hours a week. (female, 40’s)
〈Inadequate childbirth/childcare system for doctoral graduate students and JSPS research fellows〉
・ The fact that there is almost no income until completion of the doctoral program is a barrier to furthering education. Is it not the role of the government to provide financial support (for doctoral students)? (female, 30’s)
・ It is necessary to create a system that supports childcare in various ways while in school. (male, 20’s)
・ We should improve the situation where JSPS research fellow is not in an employment relationship with either the JSPS or the receiving research institution. (female, 30’s)
・ JSPS (researcher) having to interrupt employment for childbirth and childcare is a problem. (female, 30’s)
〈Improvement of work support and evaluation method according to childcare situation〉
・ In the current application for Grants-in-Aid for Scientific Research, the period for which research was suspended due to nursing care, childbirth, illness, etc. cannot be specified, and it is judged solely on research achievements. (female, 30’s)
・ Cutoff date for many of the new grant applications geared toward researchers returning from childcare is April, and it was useless for me since I returned in June. (female, 40’s)
・ Since childbirth and childcare delays career advancement, I would like people to stop defining young scientific researchers by age. (female, 40’s)
・ Workplace atmosphere that makes it difficult to leave work early when a child is sick and lack of understanding from the older generation are problematic. (male, 30’s)
・ If you do not allow postdoctoral workers hired with research grants to do tasks other than research, career development will be biased, and it will be difficult to consider work-life balance. (female, 40’s)
④ Nursing care
Unlike childcare, there are many indeterminate factors in nursing care, and people that have experienced nursing care voiced their request to have that part incorporated into the support system.

Chapter 6 Written Comments
141
・ Service officials and executives know too little about the actual condition of nursing care. (male, 50’s)
・ Days taken for nursing care leave, requirements, etc. are insufficient compared to the actual situation. (female, 50’s)
・ Expansion of support and thorough understanding about nursing care is requested. (male, 40’s)
・ Eliminate age restrictions for subsidies. Would like all people to understand and tolerate the fact that childcare and nursing care slows down work over a long period. (female, 40’s)
(ii) Limited-term Researcher (Postdoc) Position About 70% of the comments related to limited-term researcher (postdoc) were from respondents in their 30’s and 40’s. Therefore, the opinions expressed in the comments are considered to represent the voices of the field.
① Impact of limited-term research work on life plan
There were many opinions from both genders that researchers who take on limited-term research jobs have difficulty planning their future, such as marriage and childbirth, and that there was a high probability of having to live separately from their spouse. Immediate action on these problems is desired.
〈Must childbirth/childcare be given up to get a no-term job?〉
・ Assistant professor on a five-year tenure track must give up childbirth and childcare to produce results. At least a 10-year term is required. (male, 30’s)
・ It is difficult to make plans for the future such as marriage and childbirth on a limited-term/postdoc work arrangement. (female, 40’s)
〈Living together with spouse is difficult〉
・ In order to achieve a balance between home and work, it is necessary to have a mechanism that provides both stable employment (no-term) and co-living condition for spouses. (female, 30’s)
・ The system that considers separate living as natural is not good. (female, 40’s)
〈Entering an authorized day-care center is difficult for limited-term researchers〉
・ Since contract renewal is not promised, reservation for entry into authorized day-care center cannot be obtained. Therefore, the use adjustment index of authorized day-care center becomes low, and entry into authorized day-care remains difficult. (male, 30’s)
② Age restriction on open recruitment
In many cases, an age restriction (or elapsed years after obtaining a doctoral degree) is placed on open recruitment of research positions. Apparently, this is a barrier for female researchers to obtain jobs if they have suspended research for childbirth and childcare.
・ Please do not apply an under-40 age restriction on open recruitment. (female, 40’s)
・ Under the tenure track system, a “young researcher” is uniformly defined as “within 40 years of age” without considering females’ childbirth and childcare. (male, 60’s)
・ It is necessary to have a mechanism that excludes time taken off from work for childbirth and childcare when evaluating performance. (male, 40’s)

Chapter 6 Written Comments
142
(iii) Career Path A variety of problems that hinder females’ career path was pointed out and urgent action is demanded to improve the problems.
① Recruitment and promotion of females
There were opinions that prejudice against females and time restrictions such as for meetings affected the promotion of females to managerial positions. On the other hand, there were opinions that it is also necessary to reform females’ perception when training them for managerial positions.
〈Prejudice against female researchers〉
・ When I was promoted or won an award, I was told it was because special consideration was given to females. (female, 30’s)
・ Some male researchers think female researchers are bothersome. (female, 40’s)
・ I wish see workshops incorporated into workplaces or university classes to make people realize male/female role assignments are unconsciously being made and different assessments are being made depending on gender. (female, 40’s)
〈Barriers against female managerial positions〉
・ Many of the meetings are held in the evening, so it is difficult for the parenting generation to juggle time. (female, 50’s)
・ Although the workplace is trying to employ and promote females, the females themselves have a strong sense of not wanting managerial positions. (male, 60’s)
・ I think if half of the managerial positions are appointed to females, the organizational thinking will not be male-biased. (female, 40’s)
② Age restriction
There were opinions that elimination of age restriction during recruitment and extension of the retirement age are effective measures in increasing the number of female applications.
・ Considering that the female’s work efficiency is reduced by half during childcare, it is necessary to provide an environment where they can work longer and to eliminate age restriction on the various types of employment. (female, 40’s)
③ Role model
It was made clear that many respondents feel the need for an appropriate role model.
・ Female researchers who are invited to speak as role models are not at all helpful because their situations are too different from those of female students and young female researchers who are suffering in the field. (female 40’s)
・ Female researchers in managerial positions who have made achievements while raising children are few. (male 30’s)
・ Senior researchers who are not rewarded for their hard work do not make good role models for the younger generation. (female 50’s)
④ Actively promoting females in academic societies, etc.
Opinions suggest actively appointing females is an effective way to promote female participation in the administration of academic societies.
Chapter 6 Written Comments
143
・ I think it is necessary for the government to instruct the head society members to set female quotas or give priority to females in such situations as selecting speakers for society conferences. (male 40’s)
・ I think that actively promoting females as chairpersons at annual conferences of each academic society will lead to a gradual increase in female officers such as councilors and directors. (male, 50’s)
⑤ Others There were calls for improvement to the government’s Management Expenses Grants and Excellent Young Researchers Program from the standpoint of supporting the career development of female researchers. There were many opinions that females still felt the inconvenience about the use of their maiden name.
〈Impact of reducing research expenses and labor costs〉
・ Under the current situation where management grants to national universities are reduced and fewer researchers are required to do the same amount of work as before, the burden on females raising children is extremely heavy. (female, 40’s)
・ The reduction of basic research expenses and labor costs is casting a dark shadow on the future of the academic community. An active involvement of the government is desired for securing human resources regardless of gender to support the future of science and technology. (male, 50’s)
〈Necessity of using maiden name〉
・ I heard that in some educational and research institutions the use of the name in the family registry is semi-compulsory within the organization. (male, 40’s)
・ I strongly desire the legal system and administration to be reformed so that organizations can positively recognize separate male and female surnames. (male, 40’s)
・ When acquiring a patent, maiden names is not recognized, so recognize separate surnames or at least allow maiden names to be recognized when acquiring patents. (female, 40’s)
〈Excellent Young Researchers Program〉
・ Although the number of female researchers has increased, the number of positions that support males and positions that do not offer promotions is increasing. The Excellent Young Researchers Program needs to be innovated, for example, creating a position for females who can make decisions (such as professors). (female, 40’s)
・ How about creating slots for females in the Excellent Young Researchers Program and other programs? (male, 60’s)
・ The Excellent Young Researchers Program based on the annual salary system goes against gender equality, as it makes employment of researchers more destabilizing and makes life planning difficult. (male, 50’s)
(iv) Numerical Target for Female Researcher Hiring
Eighty-five percent of males and 63% of females who responded to this measure stated dissenting opinions. On the other hand, 9% of males and more than 20% of females agreed with the measure. It is believed in the background there is a lack of understanding in the intention such as “utilization of excellent and diverse human resources” and “promotion of perception reform on gender equality” of the measure. There were also voices of concern about the intergenerational gap, in which the female ratio increased only for young recruits. The representative opinions are given below.
Chapter 6 Written Comments
144
① Agree with setting numerical targets ・ Society will not change with perception reform. I think the first and only effective way is to set numerical
targets and force the increase of high-ranking female professors and researchers as quickly as possible. (male, 60’s)
・ Introducing females into institutions that are filled with “professional male researchers” will never proceed if left to natural course. (female, 30’s)
・ I think we need to examine the necessary measures at the actual workplace while we first increase the ratio of females. (female, 30’s)
・ I think the university environment will change dramatically if the female ratio of executives, professors and above exceeds 30%. (female, 40’s)
・ I think it is important to set numerical targets for females in light of international standards. (female, 30’s) ② Disagree with setting numerical targets
・ I am worried that giving females preferential treatment will raise voices of unfairness, and the females may become targets of resentment. (female, 40’s)
・ People should be evaluated by a highly objective evaluation method based on ability and performance, regardless of gender. (male, 40’s)
・ At present, the younger generation is stuck with paying the price for the past. (male, 30’s)
・ Recruitment of young female personnel is increasing. Rather, the higher age group should be balanced. (male, 40’s)
(v) Supporting Science Course Selection for Middle and High School Students
Many respondents said that the ratio of female students in primary education should be increased first. The following are representative opinions.
<Promoting science courses to female students>
・ I think it is important to get students interested in science at elementary schools to increase the number of future researcher candidates. (male, 50’s)
・ I think it is important to have activities to get middle and high school students interested in science. (female, 30’s)
・ Activities are needed to make female middle and high school students feel that science researcher is an attractive occupation. (male, 40’s)
<Educational activities needed to direct human resources toward science and technology >
・ Propaganda is important to get children to think that girls are free to spread their wings just as well as boys. (male, 60’s)
・ I think girls’ interest and motivation will be enhanced by disseminating information and conducting education in a way that makes science and technology easy to understand. (female, 50’s)
(vi) Necessity of Perception Reform
Among the respondents that submitted comments, about 20% of females and 10% of males indicated a need for perception reform. There are cases where perceptions of workplace members, families and educators are hindering the participation of females in research and technical jobs. Issues concerning perception are considered solved for the first time through the combined efforts of policies, diverse human resource recruitment and education, and continued efforts are demanded in the future. The following are representative opinions.
Chapter 6 Written Comments
145
① Social bias
・ Females tend to be taught not to standout. (female, 40’s)
・ The major problem is the general notion that “girls are weak in science”. Being raised in such a society will make you feel inapt in that field. (female, 40’s)
・ Unless the social perception that housework, childcare and nursing care are duties of the female is changed, females will not be able to concentrate on work. (male, 40’s)
② Male bias
〈Emphasize female appearance/attitude and despise females with knowledge/skills〉
・ In the science and technology fields, what impedes gender equality is the underlying pervasive perception in society that emphasizes the appearance and attitude of females and despises females with specialized knowledge and skills. (male, 30’s)
・ The upper organization consisting of males only tends to raise females who are not capable, cute and obedient to higher positions and count them as part of the numerical target. (female, 40’s)
〈Bias view that female ability is inferior〉
・ Many males believe females’ scientific abilities are low and that Marie Curie is an exception. (male, 80’s)
・ Males who are 60 and older have a discriminatory sense against females, which they are not conscious of themselves. (male, 50’s)
・ A director-class member once said to me, “There is no way a female postdoc can achieve this kind of outcome. Someone else must have done it”. The current situation will not change unless the perception of the current executive-class (50’s and 60’s) improves. (female, 30’s)
〈Domination of males over females〉
・ Eliminating the idea of male over female from the thoughts of males is top priority. (female, 50’s)
・ Discriminating party (especially males) often does not know the actual situation of the discriminated party. (female, 50's)
〈Unconsciously giving preference to males〉
・ Promotes understanding that buildup of male preferential treatment such as a biased view that regards males as excellent, giving challenging tasks to males and praising males will make a big difference in the long run. (female, 40’s)
・ It is impossible to conduct research activities on par with males unless you eliminate subconscious notions such as, “You're female and you have children”. (female, 40’s)
・ Because there are fewer female evaluators, the evaluation tends to be biased (in favor of males). (female, 50’s)
③ Female bias ・ Many females think there is nothing they can do about the difficulties of furthering their careers or
challenging new fields once they have quit their regular jobs. (female, 50’s)
・ Many female employees have a strong sense that they are assistants to male employees. (male, 50’s)
・ Females themselves have a strong will of not wanting to be in managerial positions. (male, 60’s) ④ Education environment ・ Perception reform of elementary and middle school teachers. (female, 50’s).
Chapter 6 Written Comments
146
・ We need to reform the perception that females are inapt in the field of science. In order to do so, it is necessary to reform the education method in elementary, middle, and high schools and the perception of parents. (male, 40’s)
・ I feel that education is most important so as not to plant stereotypes of “the role of males and females” from childhood. (female, 50’s)
・ I think that education that more clearly conveys the significance of females’ activities in society is necessary beginning at primary and secondary education stages. (male, 50’s)
⑤ Home environment ・ I think one of the main reasons for the low number of females in the science and technology field is that
their parents are opposed to the field being “non-feminine” when making course or job selections. (female, 40’s)
・ It is necessary for parents to change their perception so as not to put gender discrimination in way when making course selections. (male, 60’s)
・ It is necessary to reform perception including early elderly people. Females receive the most pressure from their husbands’ parents. (male, 40’s)
(vii) Others
〈Education and research policies〉
・ In order to prevent the decline of Japan's science and technology fields, policies that fit with the life stage design of young researchers from the viewpoint of gender equality are necessary. (female, 40’s)
〈Need for networks〉
・ Industry-government-academia collaboration is essential. (female, 40’s)
・ Condition where individual choices can be made through the provision of wide range of information is necessary. (male, 30’s)
・ I want the opportunity to hear stories from people who will be role models and exchange information with people facing the same issues as myself. (female, 30’s)
・ I want information on the efforts of each research institute in order to create a situation where I think I can challenge my career even while I am child caring. (female, 30’s)
・ Because the number of females is small, there are no networks and no information available leaving me isolated. (female, 30’s)
〈Exchange across fields〉
・ Additional things will be visible if gender equality conditions in other fields such as humanity and social science are examined and compared against the science and technology fields. (female, 60’s)
・ We should be more socially open by actively communicating with other similar activities outside the science and technology fields. Differences other than gender should also be considered. (male, 40’s)
Survey Wrap-up
147
Survey Wrap-up
Chapter 1: Summary of Results
1.1 Basic Data
・ Total number of respondents: 13,162 males and 4,997 females. Majority of the respondents were between the ages of 35 to 54 with the peak age in the “40 to 44” range. The respondents’ affiliated institutions were 59% universities, 15% research institutions, 21% corporations and 2% government. The overall doctoral degree acquisition rate was 65%. Approximately 85% of the respondents were employed. About 80% of both genders had jobs in the research and education sectors.
1.2 Working Conditions
・ Ratio of respondents under no-term employment was higher than the ratio of respondents under limited-term employment for both genders. The ratio of limited-term employment was high in universities/technical colleges. Many of the respondents under limited-term employment are currently under terms lasting “10 years or less”, and the ratio of respondents that have worked under limited-term employment totaling more than 10 years was 20% overall. More than 40% of males and about 50% of females currently under no-term employment have experience working under limited-term employment.
・ More than 70% of males and females have experienced job change, relocation or leaving a job. About half of both genders have experienced relocation without changing their occupation. Five percent of males and 12% of females have experience leaving a job. The highest reason for job change, relocation or leaving a job was to “further my career” accounting for about half of the responses for both genders. “End of contract” response was mostly received from the younger respondents age 40 and under. Reasons frequently received from females were “marriage (8%)”, “caring for children (9%)” and “job relocation of family member (8%)”.
・ It is most common for respondents to work at the office from 40 to 60 hours per week, with males working somewhat longer. Working hours at the office and R&D hours have both decreased significantly compared to the previous survey. Working hours of females age 30 to 44, which overlap with the child-raising period, have decreased.
1.3 Work and Family
・ There is a gender difference in the ratio of respondents having spouses with the males having a higher ratio. There is no gender difference in the marital status up until the early 30’s, but a difference begins to occur in the late 30’s. More than half of the males’ spouses are unemployed. Ninety-eight percent of females’ spouses are employed, and many are affiliated with universities/technical colleges and research institutions.
・ About 30% of males and 50% of females have experience living separately from their spouses.
・ Two thirds of females have no children and more than half of males have children. The average number of children reaches two at age 60 for males, but the average for females remains approximately at one from the 40’s to the early 60’s.
・ As for work after childcare leave, males often continue the same work before the leave, but females experience delay in promotion and/or change of work or department due to employer instructions or their own requests.
・ About 30% of both males and females have a family member that requires nursing care. Awareness level of programs for taking nursing care leave was high.

Survey Wrap-up
148
1.4 Gender Equality
・ The most chosen reasons for the low proportion of female researchers were “balancing family and work is difficult” and “returning after child/nursing care leave is difficult”. Males tended to choose gender related reasons such as “difference in male and female abilities” and “difference in male and female qualifications” more than females. Additionally, the reasons given by both genders for the low proportion of females in leadership positions were “balancing family and work is difficult”, “frequent early retirement or leave of absence”, “female ratio is low for the generation currently in leadership position” and “lack of consideration for child and family care in performance evaluation”.
・ Both males and females believe “awareness reform” is necessary to promote gender equality. In particular, “reform male awareness” was cited by many of the respondents. Following from the third survey, respondents continue to call for “increase male participation in housework and childcare”, “expand support of child and nursing care”, “encourage supervisor understanding” and “expand types of working arrangements” bringing to our attention the need to further enhance the workplace environment.
Chapter 2: Important Issues: Gender Gap in Job Positions ・ There was no significant change in job position index trends of the affiliated institution compared to the
past surveys, and the job position index rose smoothly according to age for all institutions. The promotion curve by age for males tops that of females, and at about age 30, female promotions begin to lag. Although gender differences at universities/technical colleges and research institutions are larger than at corporations, the differences are improving compared to the past surveys.
Chapter 3: Important Issues: Child and Nursing Cares ・ There is no correlation between annual salary and the number of children for females, but for males, the
number of children increases in proportion to annual salary. There is a strong tendency for females to bear the time burden and males to bear the financial burden for children.
・ The percentage of those taking childcare leave is on the rise. The percentage of corporate females taking childcare leave has surpassed 95%. At universities/technical colleges, 30% have not taken childcare leave and at research institutions, the rate is 20%. The percentage of males taking childcare leave is still very low.
・ About 40% of males with preschool children did not take leave because “leave was unnecessary”. The remaining 60% needed to take leave, but could not, and more than half of those males cited “work environment” as the reason. The reason females at universities/technical colleges and research institutions were unable to take childcare leave was it would be “disadvantageous to their career development” due to “workplace environment”. Forty-five percent of corporate females stated that they “could not enter daycare as desired”, and there were many responses stating that the “leave was shortened than desired to enter daycare starting in April”. Furthermore, childcare leave program for limited-term employees is not fully developed.
・ The average number of children is more than 1.5 for males who have never lived separately from their spouses or who have lived six or more years apart. On the other hand, there was no significant difference in the number of children for females whether they had experience living separately or the length of separation. Except for corporations, the average length of separation was longer for females. About half of the males did not consider options to avoid separate living, but 61% of females sought options and half of those were able to avoid separate living. “Did not consider” response was largely received from respondents at corporations followed by those in government, and the response was especially large from males.
・ About 30% of respondents had a family member requiring nursing care and most of those respondents were in the age 60 to 65 range.
Survey Wrap-up
149
・ In balancing work and child/nursing care, “expanded child-care facilities and services” received the highest response from university/technical college males of all positions. On the other hand, “expanded nursing-care facilities and services” was the highest response from female deans and professors while “workplace atmosphere” was the highest with female lectures. In corporations, the highest response for both genders was divided according to job position. “Expanded child-care facilities and services” was the highest with executive directors/group leaders/general staffs while “expanded nursing-care facilities and services” was the highest with senior managers/managers.
Chapter 4: Important Issues: Limited-term Employment and Limited-term Researcher (Postdocs)
4.1 Basic Data for Limited-term Employment
・ Most of the respondents working at corporations are under no-term employment regardless of gender or age, but about 30% of respondents at universities/technical colleges and research institutions are under limited-term employment. At universities/technical colleges and research institutions, the percentage of males under limited-term employment is high until age 35, whereas for females, the percentage of limited-term employment remains high even after age 35. The percentage of females under limited-term employment at universities/technical colleges exceeds 40% even beyond age 40, and that percentage remains higher than other institutions until age 50. Annual salaries of limited-term employment are lower than that of no-term employment for all job positions. In comparison between genders, annual salaries of females are low regardless of occupation or employment type.
4.2 Aging of Limited-term Employment
・ As time passes after doctoral degree acquisition, the percentage of no-term PIs increases and there is a shift to a higher job position. However, half of those that acquired a doctoral degree six to ten years ago and 30% of those that acquired a doctoral degree 11 to 15 years ago still remain under limited-term employment. As the elapsed time after doctoral degree acquisition becomes longer, gender difference becomes more apparent. The ratio of PIs is lower and the ratio of limited-term researchers and NPIs is higher for females than males.
4.3 Employment Status of Limited-term Researcher/NPI
・ Female ratio of limited-term researchers is rising with age. Number of limited-term researchers aged 40 to 65 has increased significantly compared to the previous survey.
・ About half of the limited-term researchers and NPIs work more hours than the contracted hours.
・ The annual salaries of limited-term researchers are concentrated between 2 million and 5 million yen regardless of age, and 65% of the total falls in this range. The average annual salary by age is nearly flat at about 4 million yen for limited-term male researchers and about 3.5 million yen for limited-term female researchers. At age 30 to 39, the average annual salaries of limited-term researchers is about 2 million yen lower than that of corporations in general, and the difference widens as age increases.
4.4 Tenure Track
・ In the age distribution of tenure employment, those in the 35 to 45 year age group were the highest at just under 20% of the total. Males under tenure employment were slightly higher than females. Furthermore, for both genders, most of those under tenure employment have had their doctoral degrees for 6 to 10 years.
・ Ratio of tenure employees that work more than 40 hours a week was higher than the ratio of non-tenure employees and the portion of workplace hours spent on research is low for both males and females. Annual salaries of tenure employees are higher than salaries of non-tenure employees, but female salaries are lower than male salaries for all ages. Moreover, the difference in annual salaries between tenure and non-tenure employees widens as the age increases.
Survey Wrap-up
150
Chapter 5: Important Issues: Program and Policy Awareness
5.1 Familiarity with Recent Laws and Policies
・ The degree of law/policy familiarity from highest to lowest are “Fourth Basic Plan for Gender Equality (Approved December 2015)”, “The Act on Promotion of Women’s Participation and Advancement in the Workplace (Effective April 1, 2016)”, “Excellent Young Researchers Program (March 2016)” and “5th Science and Technology Basic Plan (Approved January 2016)” with “familiar” responses being 41%, 34%, 29%, 14%, respectively.
5.2 Support Programs Currently Underway for Female Researchers
・ Comparing the familiarity of each support program by affiliated institution, “① Restart Support after Childbirth/Childcare (RPD Program)”, “④ Childbirth and Childcare Consideration in Scientific Research Grants” and “⑤ Strategic Basic Research Programs’ measures for considering childbirth and child-caring” tend to have similarities in familiarity, and about 60% of PIs and NPIs at universities and research institutions thought the programs are “meaningful”. “③ Initiative for Realizing Diversity in the Research Environment” had the lowest number of “meaningful” responses and about half of the respondents were “unaware” of the program. “② Science Course Selection Support for Middle and High School Females” and “⑥ Challenge Campaign” had high ratios of “uncertain” and “not meaningful” responses regardless of affiliated institution. “Meaningful” responses were high with PIs and those in managerial positions.
5.3 Numerical Targets for Hiring Female Researchers
・ Numerical targets for hiring of new female researchers as stated in the “4th Science and Technology Basic Plan” (30% in natural sciences overall; 20% in science, 15% in engineering, 30% in agriculture, 30% in medicine, dentistry and pharmacology combined) were not achieved and have been carried over to the “5th Science and Technology Basic Plan”. The awareness of numerical targets at universities/technical colleges and research institutions increases for both males and females as job position rises. Regardless of gender, awareness does not reach 50% in any of the positions at corporations.
5.4 Perception of Numerical Targets from Respondents with High Awareness
・ In case of females, higher the awareness of numerical targets, higher the positive perception. Among the females that are well aware of the targets, over 60% think the targets “should be expanded and promoted” or is “meaningful”. On the other hand, even if awareness is high, males that think the targets “should be expanded and promoted” or is “meaningful” was about 30%. More than 30% of the males “well aware” of the targets think the targets “will have adverse effect”. Although positive perceptions are growing for both genders, about 14% of all female respondents and about 11% of all male respondents believe there is “room for improvement”.
5.5 Female Hiring Targets of Affiliated Institutions
・ Awareness of setting numerical targets for female hiring in one’s own institution is gradually increasing. Additionally, publication of the targets itself and the awareness of publication are both slightly up. Among university/technical college respondents who are in a position to make decisions on human resource affairs (deans and professors), 44% of males and 38% of females replied that a numerical target is set in their institution. The percentages were 30% of males and 50% of females for directors and division heads of research institutions. In case of corporations, those that replied there is no target setting were still high in all job positions.

Appendix 1 Questionnaire
151
Appendix 1 Questionnaire
Fourth Large-Scale Survey of Actual Conditions of Gender Equality in Scientific and Technological Professions
This year, EPMEWSE will celebrate its 14th year since it was established with the cooperation of natural science-related academic societies. In order to understand the current work/life environment surrounding researchers and engineers of natural science with regards to gender equality, three large-scale surveys (2003, 2007, 2012) were conducted with each receiving about 20,000 responses. The survey results have been cited frequently as valuable statistical evidence when discussing the various problems faced by female researchers and engineers. Furthermore, proposals based on the results have been seen in government policymaking and subsequently various other measures addressing gender equality are beginning to gain traction. This is the fourth time the survey is being conducted. With the number of participating academic societies (including observers) reaching 90, it is a large-scale survey targeting nearly 500,000 society members. The continuity of the survey is extremely important in clarifying the current reality as well as changes in the awareness of gender equality issues, verifying the effectiveness of government programs, and identifying new issues. We would greatly appreciate the active cooperation of as many scientists and engineers as possible in completing the questionnaire. For those that have taken part in the previous surveys, we would be thankful if you can again spare a moment of your time to participate.
Thank you.
Haruko Ogawa, Ph. D., 14th EPMEWSE Chair
Naomi Kitagawa, Ph. D., Questionnaire WG Chair
Japan Inter-Society Liaison Association Committee for Promoting Equal Participation of Men and Women in Science and Engineering (EPMEWSE) ----------------------------------
The questionnaire includes 42 questions and will require 20 to 30 minutes to complete. It is not possible to stop and save the questionnaire prior to completion. However, the answer session can be kept active for 10 hours as long as the Web browser remains open. Questions other than those labeled as “Required” can be skipped if you find them difficult to answer, but it is our hope that you would answer all questions.
Only respond to one questionnaire per person even if you are associated with several academic societies, and please check each of the societies you are affiliated with in Q5.
Upon answering the questionnaire, please acknowledge the following.
All responses collected are treated statistically and anonymously without identifying the respondents. Protection measures will be strictly exercised in handling the database prepared from the questionnaire responses to prevent information leakage. The data will only be used for the promotion of gender equality activities according to EPMEWSE established guidelines (http://www.djrenrakukai.org/doc_pdf/bylaw/enq3rd/enq_guideline141111.pdf). The copyright of the database along with analysis and tabulated results will belong to EPMEWSE. Additionally, if under prescribed procedures the committee decides it is appropriate, only the processed database (data
Appendix 1 Questionnaire
152
subjected to processing for making it difficult to identify specific individuals, corporations or other organizations) may be allowed for use other than by the committee. ----------------------------------
Q1. Age as of April 1, 2016. (Required) [ ] (Enter integer only)
Q2. Gender. (Required) □Male □Female
Q3. What is your highest academic degree? (Required) □Associate Degree □Bachelor’s □Master’s □Doctor’s □Others
Q4. Do you hold a doctoral degree? If yes, how long have you had the degree? (Required) Q4.1 □No (Go to Q5) □Yes (Course) □Yes (Non-course) □Yes (Both “Course” and “Non-course”)
(Note: “Course” doctorates are conferred upon those who complete graduate school courses, whereas “non-course” doctorates do not require enrollment in the graduate school.)
Q4.2 □1-5 years □6-10 years □10-15 years □16 or more years
Q5. To which academic societies do you belong? (Check all that apply) (Required) □Unassociated □Japanese Society of Breeding □The Genetics Society of Japan □Japanese Society for Biological Sciences in Space □The Japanese Society for Hygiene □The Institute of Image Information and Television Engineers □The Japanese Liquid Crystal Society □The Japanese Society for Horticultural Science □The Japan Society for Industrial and Applied Mathematics □The Japan Society of Applied Physics □The Japanese Association of Anatomists □The Chemical Society of Japan □The Society of Chemical Engineers, Japan □The Japan Scientists’ Association □Japan Association for Fire Science and Engineering □The Japan Society of Mechanical Engineers □The Institution of Professional Engineers, Japan □The Japanese Society of Fish Pathology □The Ichthyological Society of Japan □The Japan Institute of Metals and Materials □The Society of Instrument and Control Engineers □The Crystallographic Society of Japan □Atomic Energy Society of Japan □Architectural Institute of Japan □The Society of Polymer Science, Japan □Japan Society for Cell Biology

Appendix 1 Questionnaire
153
□Japan Society of Coordination Chemistry □The Japanese Society of Sericultural Science □Japanese Association for Oral Biology □The Magnetics Society of Japan □The Mass Spectrometry Society of Japan □Society of Automotive Engineers of Japan □The Japanese Geotechnical Society □The Japanese Society of Veterinary Science □The Society for the Study of Species Biology □The Botanical Society of Japan □The Japanese Society for Chemical Regulation of Plants □Japanese Society for Plant Cell and Molecular Biology □The Japanese Society of Plant Physiologists □The Phytopathological Society of Japan □The Society of Japanese Women Scientists □Japanese Women Engineers Forum □Society of Evolutionary Studies, Japan □The Japan Neuroscience Society □The Japanese Society for Neurochemistry □The Japanese Forest Society □The Japanese Society of Fisheries Science □Japanese Society for Aquaculture Research □The Mathematical Society of Japan □Japan Society for Symbolic and Algebraic Computation □The Japanese Biochemical Society □The Ecological Society of Japan □The Society of Eco-Engineering □The Biophysical Society of Japan □The Japan Society for Precision Engineering □The Physiological Society of Japan □The Japan Petroleum Institute □The Ceramic Society of Japan □Japan Society Histochemistry and Cytochemistry □Japanese Society of Physical Fitness and Sports Medicine □Protein Science Society of Japan □Society of Geomagnetism and Earth, Planetary and Space Sciences □Japan Geoscience Union □Japanese Society of Animal Science □The Japanese Society for Neutron Science □The Ornithological Society of Japan □The Database Society of Japan
Appendix 1 Questionnaire
154
□The Iron and Steel Institute of Japan □The Electrochemical Society of Japan □The Institute of Electronics, Information and Communication Engineers □The Astronomical Society of Japan □The Japanese Society of Carbohydrate Research □The Zoological Society of Japan □Japan Society of Civil Engineers □Japanese Society of Tropical Medicine □Japan Society for Bioscience, Biotechnology, and Agrochemistry □Bioimaging Society □Japanese Society for Bioinformatics □The Japanese Society of Developmental Biologists □The Society for Reproduction & Development □The Japan Society for Comparative Endocrinology □The Surface Science Society of Japan □The Physical Society of Japan □The Japan Society of Plasma Science and Nuclear Fusion Research □The Molecular Biology Society of Japan □The Japan Society for Analytical Chemistry □The Japanese Society for Synchrotron Radiation Research □The Japan Wood Research Society □The Japanese Society of Health and Human Ecology □Association of Wildlife and Human Society □The Japan Society of Fluid Mechanics □Others ( )
Q6. What is your current employment status? (Required) □Not working □Working □Student (If student, answer Q6.2 and then go to Q7. Student)
Q6.1 What is your area of specialization? Choose the closest one from the categories below (If you have left work, answer Q6.1 thru Q16 about your most recent occupation). (Required)
□Mathematics □Electronics and Information □Physics □Chemical and Material Engineering □Life science and Biology □Civil Engineering □Mechanical Engineering □Earth and Planetary Science □Agriculture □Medicine, Dentistry and Pharmacology □Health and Nursing □Others
Q6.2 What type of organization are you affiliated with? (If affiliated with multiple organizations, check the primary one) (Required)
□Corporation (Go to Q7. Corporation) □National university (Go to Q7. University) □Public university (municipal) (Go to Q7. University) □Private university (Go to Q7. University) □Technical College (Go to Q7. University) □Other educational institutions (Go to Q7. University) □Government (Go to Q7. Corporation) □Public research institution (including national research and development agencies) (Go to Q7. Research Institution) □Other research institution (Go to Q7. Research Institution) □Others (Go to Q8)
Q7. What is your current title (position)? (Check all that apply) (Required)
Appendix 1 Questionnaire
155
Corporation: □ General staff □Group leader or equivalent □ Manager or equivalent □ Senior manager or equivalent □General manager or equivalent □Executive director and above or equivalent □Others University/Technical College: □Researcher □Research technician □Research associate □Assistant professor □Lecturer □Associate professor □Professor □Executive (Dean and above or equivalent) □Others Research Institution: □Researcher □Research technician □Senior researcher □Group lab chief □Division head □Director □Others Student: □Associate degree student □Graduate student (non-degree) □Undergraduate student □Graduate student (master’s) □Graduate student (doctoral) □Research student □Others (If you are a student, go to Q17 regardless of choice)
Q8. Choose the category that best describes your current occupation. (Required) □Research / Education □Technical □Sales □Others
Q9. What is your annual salary including tax? [ ] JPY
Q10. What is your current employment status? □Limited-term (Including appointed, part-time, postdoc, contract employee, temporary staff) (Go to Q11) □No-term (Including regular employment, self-employment) (Go to Q12)
Q11.For those currently on limited-term employment, please answer the following.
Q11.1 How long is the term? [ ] years (Enter integer only) Q11.2 Is it a tenure track employment? (After completing the term, you are allowed undergo review
and switch to a no-term employment.) □Yes □No □Unsure
Q11.3 Can employment be renewed? □Yes □No □Only a limited number of times □Unsure
Q11.4 How many years have you worked as a limited-term employee (exclude leave of absence and turnover periods)? [ ] years (Enter integer only)
Q11.5 How many times did your affiliation change during your limited-term employment (exclude reorganization)? [ ] number of times
Q11.6 What is your weekly contract-working hours? [ ] hours (Enter integer only) Q11.7 Are you enrolled in your organization’s health (or short-term mutual aid) and pension (or long-
term mutual aid) plans? □Yes □No □Health plan only □Pension plan only □Unsure
Q11.8 Are you allowed to take childcare leave? □Yes □No □Unsure
Q11.9 After maternity/childcare leave, is your employment term extended according to the length of leave? □Yes □No □Unsure
Q11.10 Would you like to be employed in a no-term job? □Yes □No □Unsure (Go to Q13 regardless of choice)
Q12. For those currently on no-term employment, please answer the following. Q12.1 How long have you been with your current job? [ ] years (Enter integer only) Q12.2 How many total years did you spend as a limited-term employee before your current job
(exclude leave of absence and turnover periods)? [ ] years (Enter integer only)
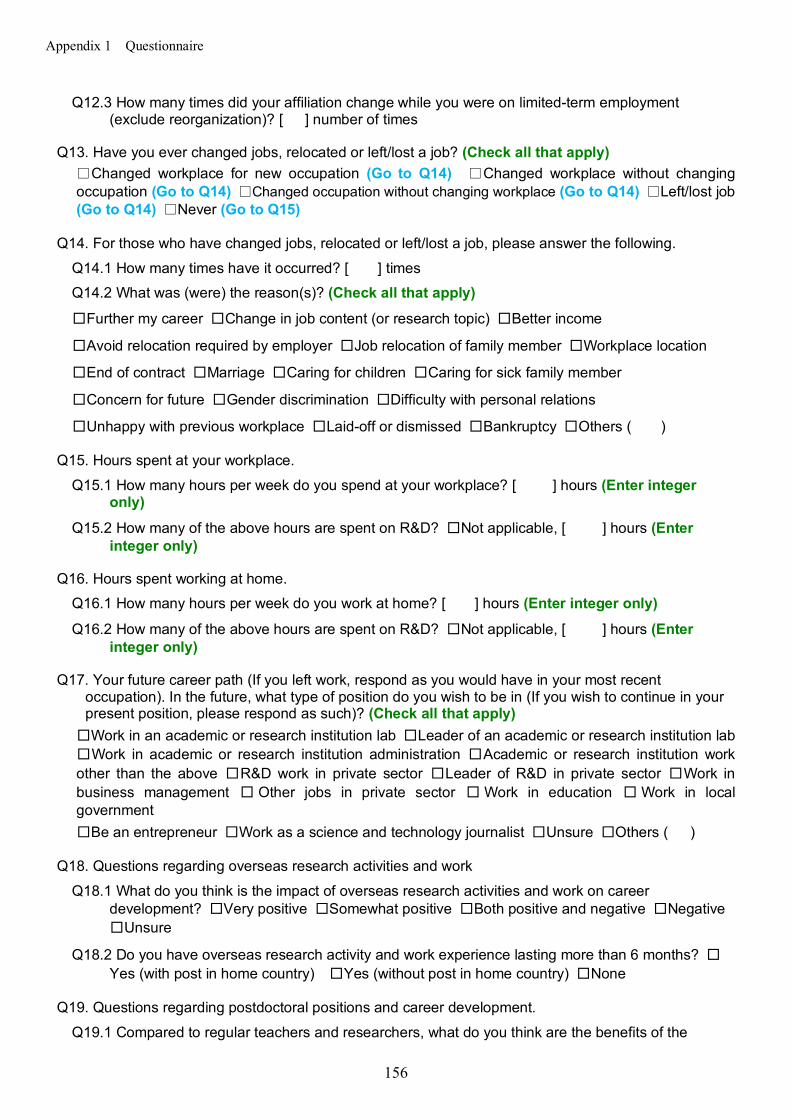
Appendix 1 Questionnaire
156
Q12.3 How many times did your affiliation change while you were on limited-term employment (exclude reorganization)? [ ] number of times
Q13. Have you ever changed jobs, relocated or left/lost a job? (Check all that apply) □Changed workplace for new occupation (Go to Q14) □Changed workplace without changing occupation (Go to Q14) □Changed occupation without changing workplace (Go to Q14) □Left/lost job (Go to Q14) □Never (Go to Q15)
Q14. For those who have changed jobs, relocated or left/lost a job, please answer the following. Q14.1 How many times have it occurred? [ ] times Q14.2 What was (were) the reason(s)? (Check all that apply) □Further my career □Change in job content (or research topic) □Better income
□Avoid relocation required by employer □Job relocation of family member □Workplace location
□End of contract □Marriage □Caring for children □Caring for sick family member
□Concern for future □Gender discrimination □Difficulty with personal relations
□Unhappy with previous workplace □Laid-off or dismissed □Bankruptcy □Others ( )
Q15. Hours spent at your workplace. Q15.1 How many hours per week do you spend at your workplace? [ ] hours (Enter integer
only) Q15.2 How many of the above hours are spent on R&D? □Not applicable, [ ] hours (Enter
integer only)
Q16. Hours spent working at home. Q16.1 How many hours per week do you work at home? [ ] hours (Enter integer only) Q16.2 How many of the above hours are spent on R&D? □Not applicable, [ ] hours (Enter
integer only)
Q17. Your future career path (If you left work, respond as you would have in your most recent occupation). In the future, what type of position do you wish to be in (If you wish to continue in your present position, please respond as such)? (Check all that apply)
□Work in an academic or research institution lab □Leader of an academic or research institution lab □Work in academic or research institution administration □Academic or research institution work other than the above □R&D work in private sector □Leader of R&D in private sector □Work in business management □ Other jobs in private sector □ Work in education □ Work in local government □Be an entrepreneur □Work as a science and technology journalist □Unsure □Others ( )
Q18. Questions regarding overseas research activities and work Q18.1 What do you think is the impact of overseas research activities and work on career
development? □Very positive □Somewhat positive □Both positive and negative □Negative □Unsure
Q18.2 Do you have overseas research activity and work experience lasting more than 6 months? □Yes (with post in home country) □Yes (without post in home country) □None
Q19. Questions regarding postdoctoral positions and career development. Q19.1 Compared to regular teachers and researchers, what do you think are the benefits of the
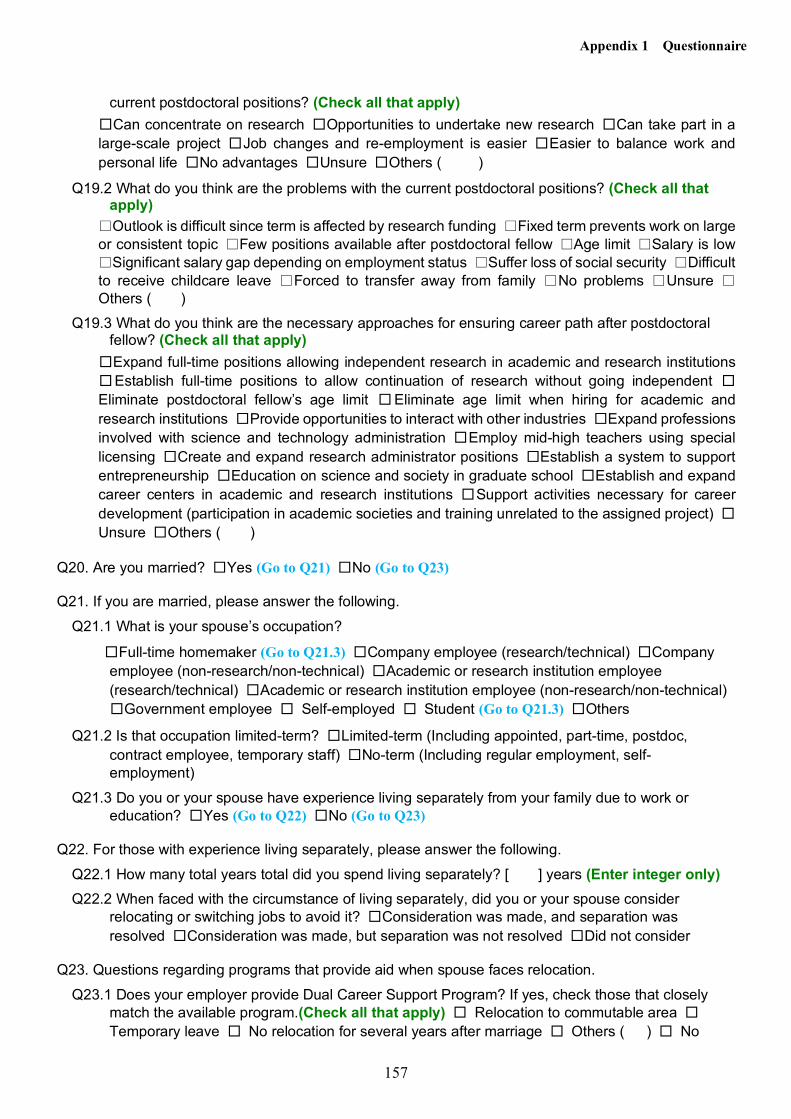
Appendix 1 Questionnaire
157
current postdoctoral positions? (Check all that apply) □Can concentrate on research □Opportunities to undertake new research □Can take part in a large-scale project □Job changes and re-employment is easier □Easier to balance work and personal life □No advantages □Unsure □Others ( )
Q19.2 What do you think are the problems with the current postdoctoral positions? (Check all that apply)
□Outlook is difficult since term is affected by research funding □Fixed term prevents work on large or consistent topic □Few positions available after postdoctoral fellow □Age limit □Salary is low □Significant salary gap depending on employment status □Suffer loss of social security □Difficult to receive childcare leave □Forced to transfer away from family □No problems □Unsure □Others ( )
Q19.3 What do you think are the necessary approaches for ensuring career path after postdoctoral fellow? (Check all that apply)
□Expand full-time positions allowing independent research in academic and research institutions □Establish full-time positions to allow continuation of research without going independent □Eliminate postdoctoral fellow’s age limit □Eliminate age limit when hiring for academic and research institutions □Provide opportunities to interact with other industries □Expand professions involved with science and technology administration □Employ mid-high teachers using special licensing □Create and expand research administrator positions □Establish a system to support entrepreneurship □Education on science and society in graduate school □Establish and expand career centers in academic and research institutions □Support activities necessary for career development (participation in academic societies and training unrelated to the assigned project) □Unsure □Others ( )
Q20. Are you married? □Yes (Go to Q21) □No (Go to Q23)
Q21. If you are married, please answer the following. Q21.1 What is your spouse’s occupation?
□Full-time homemaker (Go to Q21.3) □Company employee (research/technical) □Company employee (non-research/non-technical) □Academic or research institution employee (research/technical) □Academic or research institution employee (non-research/non-technical) □Government employee □ Self-employed □ Student (Go to Q21.3) □Others
Q21.2 Is that occupation limited-term? □Limited-term (Including appointed, part-time, postdoc, contract employee, temporary staff) □No-term (Including regular employment, self-employment)
Q21.3 Do you or your spouse have experience living separately from your family due to work or education? □Yes (Go to Q22) □No (Go to Q23)
Q22. For those with experience living separately, please answer the following. Q22.1 How many total years total did you spend living separately? [ ] years (Enter integer only) Q22.2 When faced with the circumstance of living separately, did you or your spouse consider
relocating or switching jobs to avoid it? □Consideration was made, and separation was resolved □Consideration was made, but separation was not resolved □Did not consider
Q23. Questions regarding programs that provide aid when spouse faces relocation. Q23.1 Does your employer provide Dual Career Support Program? If yes, check those that closely
match the available program.(Check all that apply) □ Relocation to commutable area □ Temporary leave □ No relocation for several years after marriage □ Others ( ) □ No

Appendix 1 Questionnaire
158
support program □Unsure
Q23.2 If your employer, the country or a public agency provides Dual Career Support Program, would you use the programs? □Yes □No (Reason(s) (Check all that apply):□Cannot relocate due to work matters □Cannot relocate due to family matters □Stability is highly questionable even after relocation □Others( ) □Unsure
Q24. Do you have children? □Yes (Go to Q25) □No (Go to Q32)
Q25. For those with children, please answer the following. Q25.1 How many children do you have? [ ]
Q25.2 What are their age groups? (Check all that apply) □Pre-school □Elementary school □Middle school □High school □College □Adult □Others ( )
Q25.3 Who was the primary caregiver (including secondary childcare) during working hours for your children before they entered elementary school? (Check all that apply)
□Self □Spouse □Family member living together □Family member not living together/friend □Day-care center □Babysitter □Others ( )
Q25.4 When your children were in elementary school, who was the primary caregiver (including secondary childcare) after school hours? (Check all that apply)
□Not applicable □Self □Spouse □Family member living together □Family member not living together/friend □After-school day-care center □Sitter □Cram school/enrichment lessons □Left home alone □Others ( )
Q25.5 Who is the main caregiver when going on business trips or attending academic society functions? (Check all that apply)
□Not applicable □Self □Spouse □Family member living together □Family member not living together/friend □Babysitter you hired □Childcare service provided by academic society □Others ( )
Q26. Tell us about your childcare leave. □Took leave as requested (Go to Q27) □Took leave, but not as requested (Go to Q27 then Q28) □Did not take leave (Go to Q28) □Others ( ) (Go to Q29)
Q27. For those who took childcare leave, please answer the following. Q27.1 How long was the leave (average per child excluding maternity leave)? About [ ] week(s) or
about [ ] month(s) (Fill in one or the other) (Enter integer only) Q27.2 What was your working condition after returning from childcare leave?
□Returned to same duties □Requested change of duties □Requested change of department □Assigned new duties □Assigned to new department □Promotion/advancement was delayed □Lost job □Retired □Others (If you took leave, but not as requested, go to Q28. If you took leave as requested, go to Q29)
Q28. If childcare leave was not as requested or childcare leave was not taken, what was the reason? (Check all that apply) □Leave was unnecessary □Did not wish to take leave □Home environment □Workplace environment □No provision for leave existed □Could not enter daycare as desired □Others ( )
Q29. Tell us about your spouse’s childcare leave. □Took leave as requested (Go to Q30) □Took leave, but not as requested (Go to Q30 then Q31) □Did not take leave (Go to Q31) □Others ( ) (Go to Q32)

Appendix 1 Questionnaire
159
Q30. For those whose spouse took childcare leave, please answer the following. How long was the leave (average per child excluding maternity leave)? About [ ] week(s) or about [ ] month(s) (Fill in one or the other) (Enter integer only) (If spouse took leave, but not as requested, go to Q31. If spouse took leave as requested, go to Q32)
Q31.If childcare leave was not as requested or childcare leave was not taken, what was the reason? (Check all that apply) □Leave was unnecessary □Did not wish to take leave □Home environment □Workplace environment □No provision for leave existed □Could not enter daycare as desired □Others ( )
Q32. What do you think is the ideal number of children to have? Q32.1 Ideal number: [ ] Q32.2 If the number of children you have (or plan to have) is less than ideal, what is the reason? (Check all that apply) □Not applicable □Financial □Health □Job stability □Balance between career an childcare □Spouse’s cooperation in child caring □Understanding of workplace □Social environment for children to grow □Others ( )
Q33. Tell us about nursing care.
Q33.1 Do currently or in the past have a family member that require(d) nursing care? □Yes □No
Q33.2 Are you aware of nursing-care leave program? □Yes (Go to Q33.3) □No (Go to Q34) □Unsure (Go to Q34)
Q33.3 If you answered yes above, does your or your spouse’s workplace have a nursing-care leave program? □Yes □No □Unsure
Q34. What do you think are required to maintain balance between work and child/nursing care? (Check all that apply)
【Awareness Reform】 □ Changes in "work as center" concept □ Changes in awareness of male and female roles □Workplace atmosphere □Understanding from supervisor □ Relationship with child and nursing care service providers 【Program Reform】 □Shorter working hours □Work support □ Variety of provisions for leave of absence □Alternate staffing while on leave □Provision for working at home while on leave □Work sharing □Flexible working hours □Improve employment system □Various ways of working and career paths 【Financial Support】 □Financial support for child and nursing care □Public subsidies for employer of person on leave □Financial support for long distance care (such as care allowance, transportation discount, etc.) 【Facility and Service Improvement】 □Expanded child-care facilities and services □Sick child care □Expanded after-school care for children □Expanded nursing-care facilities and services (including home) □Expanded municipal childrearing support □Unsure □Others ( )
Q35. What sort of environment and opportunities are necessary for furthering R&D? (Check all that apply)
□Not applicable □□R&D time □R&D assistant □R&D funds (including maintenance) □ Joint researcher □R&D freedom □Streamline or separate administrative and odd jobs □Opportunity to present results □Understanding from supervisor □Understanding from management □Environment for long-term research □Common purpose/communication within the research group □Appropriate evaluation of the performance and capabilities □Guidance from supervisors □Opportunity to educate
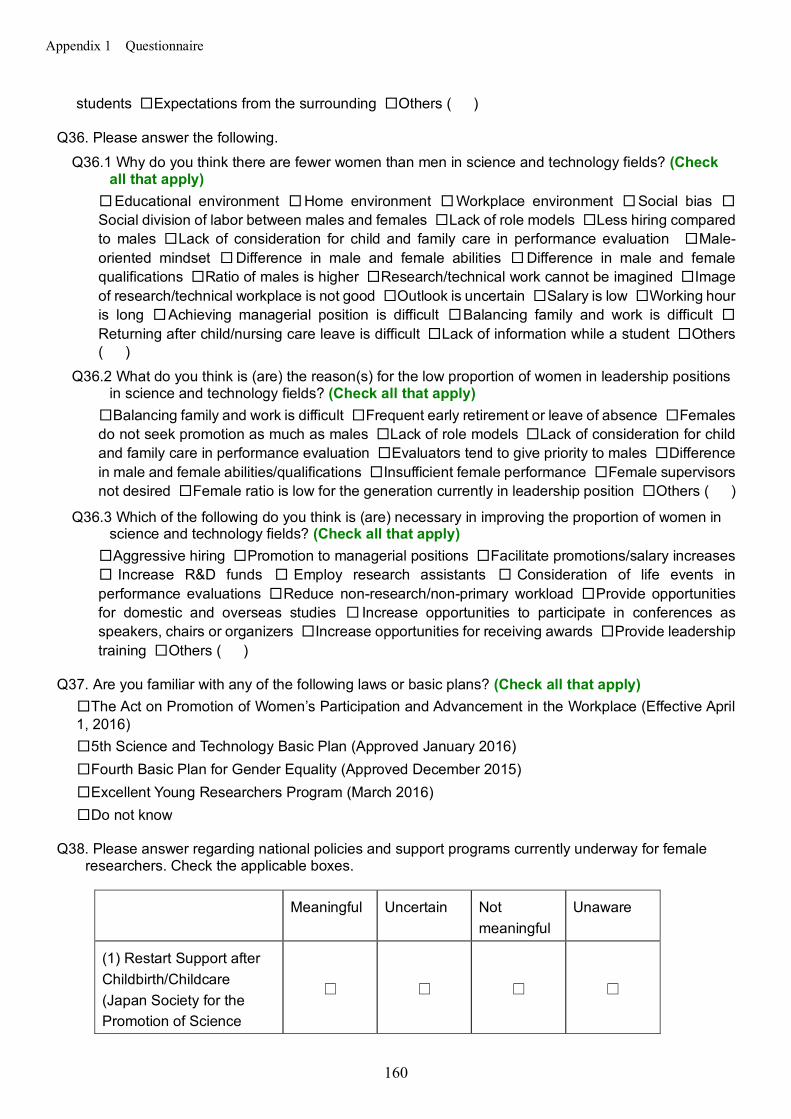
Appendix 1 Questionnaire
160
students □Expectations from the surrounding □Others ( )
Q36. Please answer the following. Q36.1 Why do you think there are fewer women than men in science and technology fields? (Check
all that apply) □Educational environment □Home environment □Workplace environment □Social bias □Social division of labor between males and females □Lack of role models □Less hiring compared to males □Lack of consideration for child and family care in performance evaluation □Male-oriented mindset □Difference in male and female abilities □Difference in male and female qualifications □Ratio of males is higher □Research/technical work cannot be imagined □Image of research/technical workplace is not good □Outlook is uncertain □Salary is low □Working hour is long □Achieving managerial position is difficult □Balancing family and work is difficult □Returning after child/nursing care leave is difficult □Lack of information while a student □Others ( )
Q36.2 What do you think is (are) the reason(s) for the low proportion of women in leadership positions in science and technology fields? (Check all that apply)
□Balancing family and work is difficult □Frequent early retirement or leave of absence □Females do not seek promotion as much as males □Lack of role models □Lack of consideration for child and family care in performance evaluation □Evaluators tend to give priority to males □Difference in male and female abilities/qualifications □Insufficient female performance □Female supervisors not desired □Female ratio is low for the generation currently in leadership position □Others ( )
Q36.3 Which of the following do you think is (are) necessary in improving the proportion of women in science and technology fields? (Check all that apply)
□Aggressive hiring □Promotion to managerial positions □Facilitate promotions/salary increases □ Increase R&D funds □ Employ research assistants □ Consideration of life events in performance evaluations □Reduce non-research/non-primary workload □Provide opportunities for domestic and overseas studies □ Increase opportunities to participate in conferences as speakers, chairs or organizers □Increase opportunities for receiving awards □Provide leadership training □Others ( )
Q37. Are you familiar with any of the following laws or basic plans? (Check all that apply) □The Act on Promotion of Women’s Participation and Advancement in the Workplace (Effective April 1, 2016) □5th Science and Technology Basic Plan (Approved January 2016) □Fourth Basic Plan for Gender Equality (Approved December 2015) □Excellent Young Researchers Program (March 2016) □Do not know
Q38. Please answer regarding national policies and support programs currently underway for female researchers. Check the applicable boxes.
Meaningful Uncertain Not meaningful
Unaware
(1) Restart Support after Childbirth/Childcare (Japan Society for the Promotion of Science
□ □ □ □
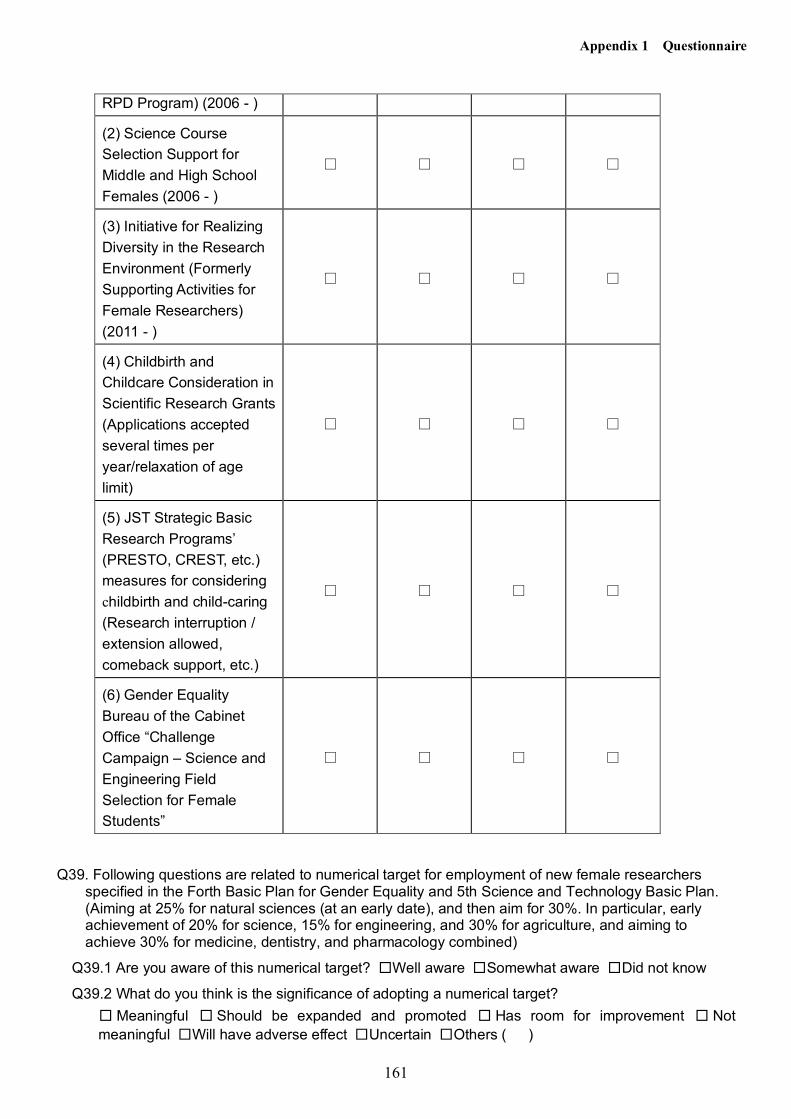
Appendix 1 Questionnaire
161
RPD Program) (2006 - )
(2) Science Course Selection Support for Middle and High School Females (2006 - )
□ □ □ □
(3) Initiative for Realizing Diversity in the Research Environment (Formerly Supporting Activities for Female Researchers) (2011 - )
□ □ □ □
(4) Childbirth and Childcare Consideration in Scientific Research Grants (Applications accepted several times per year/relaxation of age limit)
□ □ □ □
(5) JST Strategic Basic Research Programs’ (PRESTO, CREST, etc.) measures for considering childbirth and child-caring (Research interruption / extension allowed, comeback support, etc.)
□ □ □ □
(6) Gender Equality Bureau of the Cabinet Office “Challenge Campaign – Science and Engineering Field Selection for Female Students”
□ □ □ □
Q39. Following questions are related to numerical target for employment of new female researchers specified in the Forth Basic Plan for Gender Equality and 5th Science and Technology Basic Plan. (Aiming at 25% for natural sciences (at an early date), and then aim for 30%. In particular, early achievement of 20% for science, 15% for engineering, and 30% for agriculture, and aiming to achieve 30% for medicine, dentistry, and pharmacology combined)
Q39.1 Are you aware of this numerical target? □Well aware □Somewhat aware □Did not know
Q39.2 What do you think is the significance of adopting a numerical target? □ Meaningful □ Should be expanded and promoted □ Has room for improvement □ Not meaningful □Will have adverse effect □Uncertain □Others ( )

Appendix 1 Questionnaire
162
Q39.3 Is there a numerical target for employment of female researchers in your organization?
□Yes (Go to Q39.4) □No (Go to Q39.5) □Uncertain (Go to Q40)
Q39.4 If there is a numerical target, is it made public? □Yes □No □Uncertain
Q39.5 If there is no numerical target, do you think it is necessary to set a target? □Necessary □Unnecessary □Uncertain
Q40. Do you think the laws, basic plans and projects mentioned above, have helped progress gender equality in science and technology fields since the third questionnaire survey (November 2012)?
Q40.1 In your affiliated organization:
□Progressing gradually □No change □Progressing backwards □Uncertain
Q40.2 In you affiliated academic society:
□Progressing gradually □No change □Progressing backwards □Uncertain
Q40.3 In the world as a whole:
□Progressing gradually □No change □Progressing backwards □Uncertain
Q40.4 Do you feel an increase in the number of female researchers/engineers around you and an improvement in their promotion and treatment?
□Progressing gradually □No change □Progressing backwards □Uncertain
Q41. What do you think is required in the future to promote gender equality? (Check all that apply) □Reform female awareness □Reform male awareness □Increase male participation in housework and childcare □Separate surnames for married couples □Improve work environment □Give females priority during certain periods □Eliminate various age limits □Improve evaluation system □Encourage supervisor understanding □Expand types of working arrangements □Expand support of child and nursing care □Introduce fixed-term employment □Improve fixed-term employment □ Eliminate fixed-term employment □ Form a female researchers network □
Comparative studies and policies to meet international standards □Clarification of national policies □Funding for policies □Expanded promotion by national/local government or employers □Expansion of social security system □Others ( ) □Nothing required
Q42. Please feel free to describe, in 100 words or less, any opinions you have regarding gender equality in science and technology fields.
[ ]
This concludes the questionnaire. Thank you for your time and cooperation.
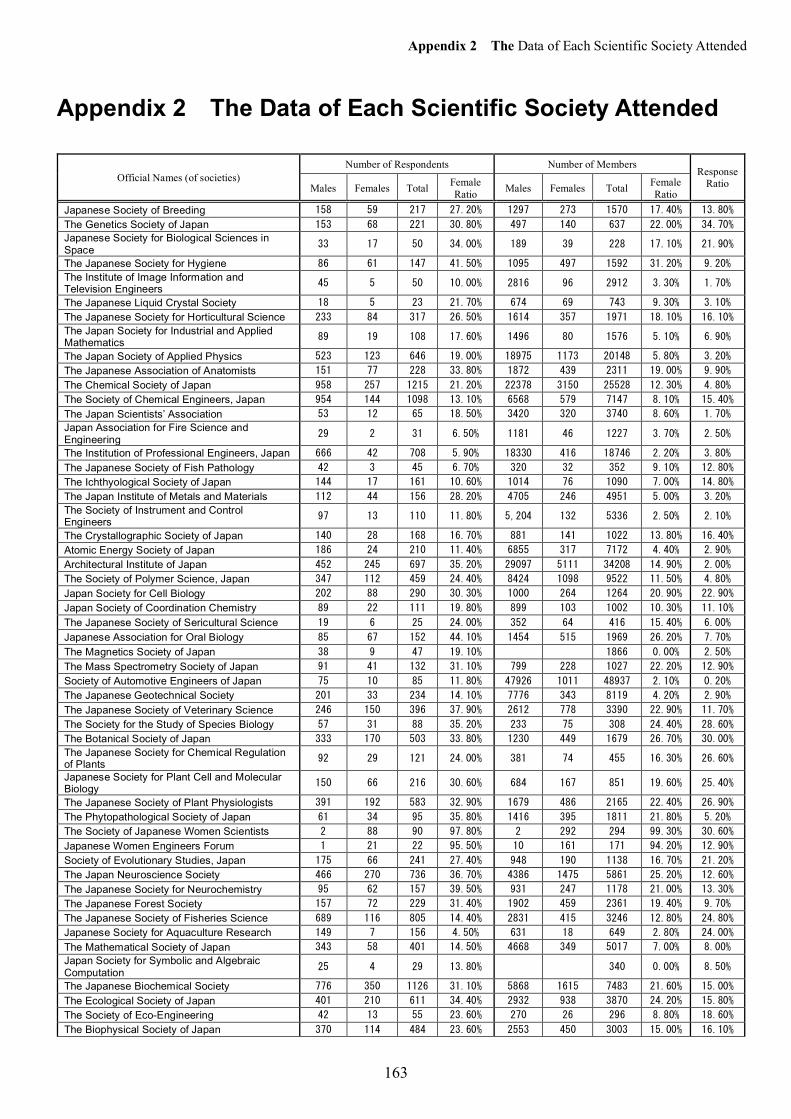
Appendix 2 The Data of Each Scientific Society Attended
163
Appendix 2 The Data of Each Scientific Society Attended
Official Names (of societies) Number of Respondents Number of Members
Response Ratio Males Females Total Female
Ratio Males Females Total Female Ratio
Japanese Society of Breeding 158 59 217 27.20% 1297 273 1570 17.40% 13.80%
The Genetics Society of Japan 153 68 221 30.80% 497 140 637 22.00% 34.70%
Japanese Society for Biological Sciences in Space 33 17 50 34.00% 189 39 228 17.10% 21.90%
The Japanese Society for Hygiene 86 61 147 41.50% 1095 497 1592 31.20% 9.20%
The Institute of Image Information and Television Engineers 45 5 50 10.00% 2816 96 2912 3.30% 1.70%
The Japanese Liquid Crystal Society 18 5 23 21.70% 674 69 743 9.30% 3.10%
The Japanese Society for Horticultural Science 233 84 317 26.50% 1614 357 1971 18.10% 16.10%
The Japan Society for Industrial and Applied Mathematics 89 19 108 17.60% 1496 80 1576 5.10% 6.90%
The Japan Society of Applied Physics 523 123 646 19.00% 18975 1173 20148 5.80% 3.20%
The Japanese Association of Anatomists 151 77 228 33.80% 1872 439 2311 19.00% 9.90%
The Chemical Society of Japan 958 257 1215 21.20% 22378 3150 25528 12.30% 4.80%
The Society of Chemical Engineers, Japan 954 144 1098 13.10% 6568 579 7147 8.10% 15.40%
The Japan Scientists’ Association 53 12 65 18.50% 3420 320 3740 8.60% 1.70%
Japan Association for Fire Science and Engineering 29 2 31 6.50% 1181 46 1227 3.70% 2.50%
The Institution of Professional Engineers, Japan 666 42 708 5.90% 18330 416 18746 2.20% 3.80%
The Japanese Society of Fish Pathology 42 3 45 6.70% 320 32 352 9.10% 12.80%
The Ichthyological Society of Japan 144 17 161 10.60% 1014 76 1090 7.00% 14.80%
The Japan Institute of Metals and Materials 112 44 156 28.20% 4705 246 4951 5.00% 3.20%
The Society of Instrument and Control Engineers 97 13 110 11.80% 5,204 132 5336 2.50% 2.10%
The Crystallographic Society of Japan 140 28 168 16.70% 881 141 1022 13.80% 16.40%
Atomic Energy Society of Japan 186 24 210 11.40% 6855 317 7172 4.40% 2.90%
Architectural Institute of Japan 452 245 697 35.20% 29097 5111 34208 14.90% 2.00%
The Society of Polymer Science, Japan 347 112 459 24.40% 8424 1098 9522 11.50% 4.80%
Japan Society for Cell Biology 202 88 290 30.30% 1000 264 1264 20.90% 22.90%
Japan Society of Coordination Chemistry 89 22 111 19.80% 899 103 1002 10.30% 11.10%
The Japanese Society of Sericultural Science 19 6 25 24.00% 352 64 416 15.40% 6.00%
Japanese Association for Oral Biology 85 67 152 44.10% 1454 515 1969 26.20% 7.70%
The Magnetics Society of Japan 38 9 47 19.10% 1866 0.00% 2.50%
The Mass Spectrometry Society of Japan 91 41 132 31.10% 799 228 1027 22.20% 12.90%
Society of Automotive Engineers of Japan 75 10 85 11.80% 47926 1011 48937 2.10% 0.20%
The Japanese Geotechnical Society 201 33 234 14.10% 7776 343 8119 4.20% 2.90%
The Japanese Society of Veterinary Science 246 150 396 37.90% 2612 778 3390 22.90% 11.70%
The Society for the Study of Species Biology 57 31 88 35.20% 233 75 308 24.40% 28.60%
The Botanical Society of Japan 333 170 503 33.80% 1230 449 1679 26.70% 30.00%
The Japanese Society for Chemical Regulation of Plants 92 29 121 24.00% 381 74 455 16.30% 26.60%
Japanese Society for Plant Cell and Molecular Biology 150 66 216 30.60% 684 167 851 19.60% 25.40%
The Japanese Society of Plant Physiologists 391 192 583 32.90% 1679 486 2165 22.40% 26.90%
The Phytopathological Society of Japan 61 34 95 35.80% 1416 395 1811 21.80% 5.20%
The Society of Japanese Women Scientists 2 88 90 97.80% 2 292 294 99.30% 30.60%
Japanese Women Engineers Forum 1 21 22 95.50% 10 161 171 94.20% 12.90%
Society of Evolutionary Studies, Japan 175 66 241 27.40% 948 190 1138 16.70% 21.20%
The Japan Neuroscience Society 466 270 736 36.70% 4386 1475 5861 25.20% 12.60%
The Japanese Society for Neurochemistry 95 62 157 39.50% 931 247 1178 21.00% 13.30%
The Japanese Forest Society 157 72 229 31.40% 1902 459 2361 19.40% 9.70%
The Japanese Society of Fisheries Science 689 116 805 14.40% 2831 415 3246 12.80% 24.80%
Japanese Society for Aquaculture Research 149 7 156 4.50% 631 18 649 2.80% 24.00%
The Mathematical Society of Japan 343 58 401 14.50% 4668 349 5017 7.00% 8.00%
Japan Society for Symbolic and Algebraic Computation 25 4 29 13.80% 340 0.00% 8.50%
The Japanese Biochemical Society 776 350 1126 31.10% 5868 1615 7483 21.60% 15.00%
The Ecological Society of Japan 401 210 611 34.40% 2932 938 3870 24.20% 15.80%
The Society of Eco-Engineering 42 13 55 23.60% 270 26 296 8.80% 18.60%
The Biophysical Society of Japan 370 114 484 23.60% 2553 450 3003 15.00% 16.10%
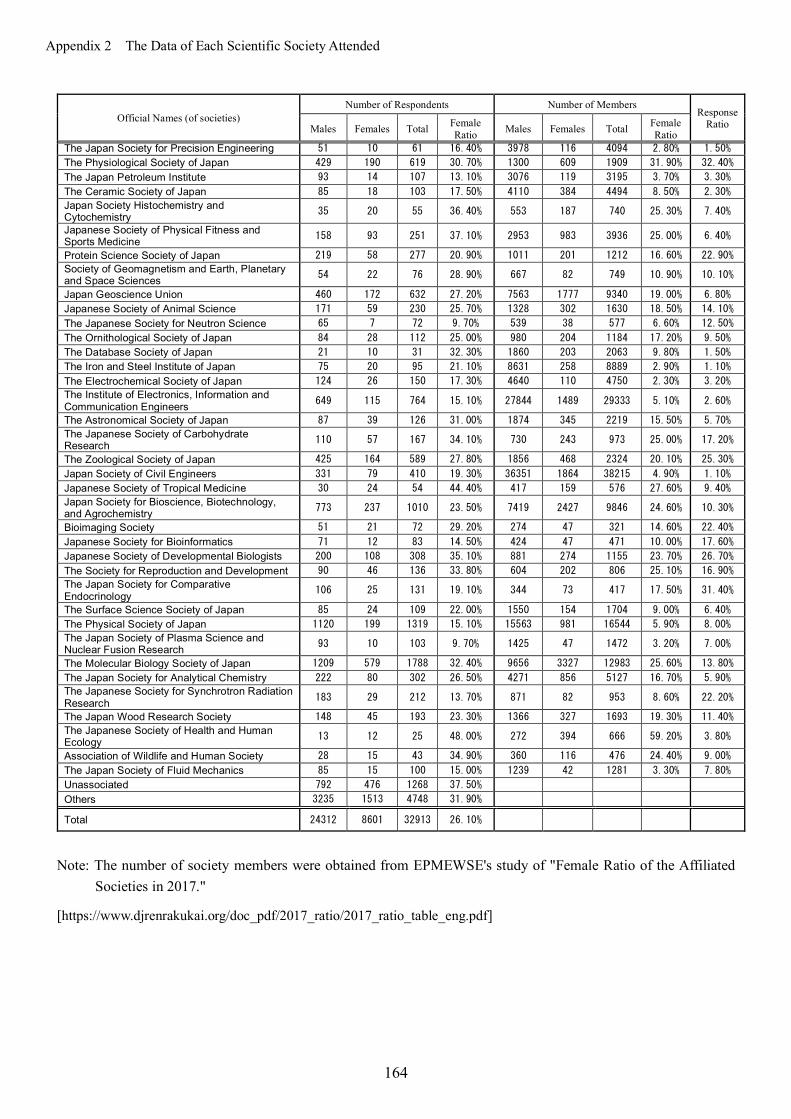
Appendix 2 The Data of Each Scientific Society Attended
164
Official Names (of societies) Number of Respondents Number of Members
Response Ratio Males Females Total Female
Ratio Males Females Total Female Ratio
The Japan Society for Precision Engineering 51 10 61 16.40% 3978 116 4094 2.80% 1.50%
The Physiological Society of Japan 429 190 619 30.70% 1300 609 1909 31.90% 32.40%
The Japan Petroleum Institute 93 14 107 13.10% 3076 119 3195 3.70% 3.30%
The Ceramic Society of Japan 85 18 103 17.50% 4110 384 4494 8.50% 2.30%
Japan Society Histochemistry and Cytochemistry 35 20 55 36.40% 553 187 740 25.30% 7.40%
Japanese Society of Physical Fitness and Sports Medicine 158 93 251 37.10% 2953 983 3936 25.00% 6.40%
Protein Science Society of Japan 219 58 277 20.90% 1011 201 1212 16.60% 22.90%
Society of Geomagnetism and Earth, Planetary and Space Sciences 54 22 76 28.90% 667 82 749 10.90% 10.10%
Japan Geoscience Union 460 172 632 27.20% 7563 1777 9340 19.00% 6.80%
Japanese Society of Animal Science 171 59 230 25.70% 1328 302 1630 18.50% 14.10%
The Japanese Society for Neutron Science 65 7 72 9.70% 539 38 577 6.60% 12.50%
The Ornithological Society of Japan 84 28 112 25.00% 980 204 1184 17.20% 9.50%
The Database Society of Japan 21 10 31 32.30% 1860 203 2063 9.80% 1.50%
The Iron and Steel Institute of Japan 75 20 95 21.10% 8631 258 8889 2.90% 1.10%
The Electrochemical Society of Japan 124 26 150 17.30% 4640 110 4750 2.30% 3.20%
The Institute of Electronics, Information and Communication Engineers 649 115 764 15.10% 27844 1489 29333 5.10% 2.60%
The Astronomical Society of Japan 87 39 126 31.00% 1874 345 2219 15.50% 5.70%
The Japanese Society of Carbohydrate Research 110 57 167 34.10% 730 243 973 25.00% 17.20%
The Zoological Society of Japan 425 164 589 27.80% 1856 468 2324 20.10% 25.30%
Japan Society of Civil Engineers 331 79 410 19.30% 36351 1864 38215 4.90% 1.10%
Japanese Society of Tropical Medicine 30 24 54 44.40% 417 159 576 27.60% 9.40%
Japan Society for Bioscience, Biotechnology, and Agrochemistry 773 237 1010 23.50% 7419 2427 9846 24.60% 10.30%
Bioimaging Society 51 21 72 29.20% 274 47 321 14.60% 22.40%
Japanese Society for Bioinformatics 71 12 83 14.50% 424 47 471 10.00% 17.60%
Japanese Society of Developmental Biologists 200 108 308 35.10% 881 274 1155 23.70% 26.70%
The Society for Reproduction and Development 90 46 136 33.80% 604 202 806 25.10% 16.90%
The Japan Society for Comparative Endocrinology 106 25 131 19.10% 344 73 417 17.50% 31.40%
The Surface Science Society of Japan 85 24 109 22.00% 1550 154 1704 9.00% 6.40%
The Physical Society of Japan 1120 199 1319 15.10% 15563 981 16544 5.90% 8.00%
The Japan Society of Plasma Science and Nuclear Fusion Research 93 10 103 9.70% 1425 47 1472 3.20% 7.00%
The Molecular Biology Society of Japan 1209 579 1788 32.40% 9656 3327 12983 25.60% 13.80%
The Japan Society for Analytical Chemistry 222 80 302 26.50% 4271 856 5127 16.70% 5.90%
The Japanese Society for Synchrotron Radiation Research 183 29 212 13.70% 871 82 953 8.60% 22.20%
The Japan Wood Research Society 148 45 193 23.30% 1366 327 1693 19.30% 11.40%
The Japanese Society of Health and Human Ecology 13 12 25 48.00% 272 394 666 59.20% 3.80%
Association of Wildlife and Human Society 28 15 43 34.90% 360 116 476 24.40% 9.00%
The Japan Society of Fluid Mechanics 85 15 100 15.00% 1239 42 1281 3.30% 7.80%
Unassociated 792 476 1268 37.50%
Others 3235 1513 4748 31.90%
Total 24312 8601 32913 26.10%
Note: The number of society members were obtained from EPMEWSE's study of "Female Ratio of the Affiliated
Societies in 2017."
[https://www.djrenrakukai.org/doc_pdf/2017_ratio/2017_ratio_table_eng.pdf]