Embed Size (px)
Citation preview

Note: Pursuant to Federal Law 11,638/07, the results presented herein reflect the adoption of International Financial Reporting Standards (IFRS) in 2010, with the 2009 results restated to ensure accurate comparisons. In addition, unless stated otherwise, Braskem’s consolidated results reflect, for all periods stated, the pro-forma consolidation of 100% of the results of Quattor Participações and Sunoco Chemicals, which were acquired in April 2010.
4Q10 and 2010 Results
EBITDA of R$4.1 billion in 2010, up 27% from 2009
HIGHLIGHTS:
� Braskem consolidated EBITDA stood at R$ 1.1 billion in the last quarter of the year
� Quattor’s crackers operated at capacity utilization rates above 90% in 4Q10, led by the Rio de Janeiro unit (former Riopol), which recorded an average utilization rate of 93%, making Quattor EBITDA reach R$361 million in 2010, for EBITDA margin of 20.2%.
� Braskem posted record-high production volume in October and December at its Polyethylene plants in the Triunfo Petrochemical Complex.
� New synergies resulted from Quattor acquisition were identified and are expected to total R$495 million in annual and recurring EBITDA to be fully captured by 2012. For 2011, R$377 million are estimated to be captured.
� Braskem's net debt/EBITDA1 ratio maintained its downward path to reach 2.43x, down 8% from 3Q10 and 32% in relation to 2009.
� The reestructuring of Braskem debt profile lengthened its average debt term to 12.5 years, with a cost of debt around 6.6% in dollar terms and 83.4% of CDI in Brazilian real.
� Braskem recorded net income of R$1.9 billion in 2010, and, based on this result, the Company’s management is proposing the distribution of R$666 million in dividends, or 40% of adjusted net income.
� On February 23, 2011 the Board of Directors of the Administrative Council of Economic Defense (CADE – Brazil’s Antitrust Authority) fully approved the acquisition of Quattor Participações S/A, Unipar Comercial e Distribuidora S.A. and Polibutenos S/A Indústrias Químicas.
1 EBITDA may be defined as earnings before the net financial result, income and social contribution taxes, depreciation, amortization and non-operating income. EBITDA is used by the Company’s management as a measure of performance, but does not represent cash flow for the periods presented and should not be considered a substitute for net income or an indicator of liquidity. The Company believes that in addition to serving as a measure of operating performance, EBITDA allows for comparisons with other companies. Note however that EBITDA is not a measure established in accordance with IFRS standards or U.S. Generally Accepted Accounting Principles (US GAAP), and may be defined and calculated differently by other companies.

EXECUTIVE SUMMARY:
The Brazilian economy maintained its robust growth pace in the last quarter of the year, with GDP in 2010 increasing by 7.5%, driven by industrial activity, which grew by 10.9% in the year, which represents the strongest growth rate of the last 24 years, according to the Brazilian Institute of Geography and Statistics (IBGE).
The positive economic indicators in the United States and the continued expansion of China’s economy sustained the optimism regarding the global economic recovery, despite the fiscal problems in European economies and the high unemployment rates in developed countries.
Despite the downcycle of the global petrochemical industry, with supply structurally exceeding demand, the fourth quarter was marked by continued price hikes. The main factors were: (i) the solid demand from emerging markets and the recovery in developed countries, even with the seasonal slowdown at the end of the year; (ii) the limited supply, due to unplanned shutdowns (USA, Asia and Europe), trade sanctions in Iran and low utilizations rates in the Middle East; and (iii) the high raw material prices. Resins2, basic petrochemical3 and naphtha4 prices increased by 12%, 5% and 20% from the prior quarter, respectively.
Braskem registered EBITDA of R$1.1 billion in the quarter, with EBITDA margin of 14.9%. The reduction in sales volume, which is typical during this time of year, was partially offset by the better prices, which followed the international market trend, and by the continued recovery in the capacity utilization rates of Quattor assets. In 2010, Braskem posted EBITDA of R$4.1 billion, up 27% from 2009.
In this context, Braskem posted a slight reduction in net debt to R$9.8 billion. The combination of EBITDA growth in the last 12 months (R$4.1 billion) and the reduction in net debt led to a decrease in financial leverage, as measured by the ratio of net debt to EBITDA LTM, from 2.64x in the third quarter to 2.43x in the fourth quarter, in line with the Company’s objective of reducing leverage and achieving an investment grade credit rating. In relation to December 2009, when the Company recorded a leverage of 3.59x, the decrease was 32%.
New opportunities have been identified, and the synergies from Quattor acquisition are expected to total R$495 million in annual and recurring EBITDA, to be fully captured by 2012. For 2011, a total of R$377 million is expected to be captured. The main gains are on the industrial front, which total R$234 million, due to initiatives such as the implementation of better planning at the 1st and 2nd generation plants and the adoption of a new asset maintenance plan. Other important synergies will be captured on the logistics and supply fronts, with better sales planning and the integrated purchasing of raw materials. Braskem will invest R$275 million to support the capture of these synergies, around 50% of which should be disbursed by the end of 2011.
Net income totaled R$1.9 billion in 2010, driven by EBITDA growth in the period, as mentioned above, and the recognition of the acquisition of Quattor and Sunoco Chemical assets at fair market value (in accordance with IFRS standards), providing a net positive impact of R$869 million; along with recognition of deferred income and social contribution taxes (IR/CSSL) over Quattor’s accrued losses and other IFRS adjustments in the amount of R$405 million.
2 PE, PP and PVC (base Asia and Europe) 3 Ethylene and propylene (base Europe)
4 Nafta ARA

PERFORMANCE:
� EBITDA
Braskem’s consolidated EBITDA in 4Q10 was R$1.074 billion, up 4% from the previous quarter. This increase is mainly due to the higher prices in Brazilian real, in line with international market trends, partially offset by the increase in raw material prices. In U.S. dollar, EBITDA in 4Q10 was US$633 million, up 7% from the prior quarter. EBITDA margin stood at 14.9%, up 0.8 p.p. from 3Q10, reflecting the recovery in resin-naphtha spreads. EBITDA margin excluding naphtha/condensate/oil resales was 16.4%.
This EBITDA reflects (i) the positive impact of R$37 million from PIS/COFINS tax credits, most of which involve fixed assets, due to the better calculations used to analyze these tax credits; and (ii) the nonrecurring expenses of R$29 million related to third-party services and extraordinary advertising expenses.
In relation to 4Q09, EBITDA increased by 37%, due to the higher sales volume of thermoplastic resins and the recovery of resin and basic petrochemicals prices, despite the appreciation in the Brazilian real between the two periods.
In 2010, Braskem’s consolidated EBITDA was R$4.1 billion, 27% higher than the R$3.2 billion registered in 2009, despite the downcycle of the petrochemical industry and the stronger local currency. The main drivers of this growth were: (i) the significant improvement in the operational efficiency of the Quattor assets; (ii) the increase of thermoplastic resins sales, following the growing demand in the Brazilian domestic market; (iii) higher resins and basic petrochemical prices, reflecting the better scenario of the global petrochemical industry, especially in the second half of 2010; and (iv) the capture of synergies in the amount of R$170 million. This amount was also affected by non-recurring expenses totaling R$244 million. In U.S. dollar terms, EBITDA in 2010 increased by 41% from 2009 to reach US$2.3 billion. EBITDA margin in 2010 was 14.6%, expanding 0.6 p.p. from 14.0% in 2009. EBITDA margin excluding the effects of naphtha/condensate/oil resales stood at 15.6% in 2010.
Note: Restatment of Net income and Ebitda detailed in Exhibit III.
3,181
4,055
2009 2010
EBITDA (R$ million)
+27%
786
1,036 1,074
4Q09 3Q10 4Q10
EBITDA (R$ million)
+37%
+4%
1,638
2,308
2009 2010
EBITDA (US$ million)
452
592 633
4Q09 3Q10 4Q10
EBITDA (US$ million)
+7%
+41%+40%

Operational, economic and financial factors impacting EBITDA performance:
� Polymers Performance
Impacted by the lower seasonal demand in the last quarter of the year, the Brazilian market of thermoplastic resins5 contracted by 5% from 3Q10 to 1,277 kton. Braskem’s sales volume in the quarter was 875 kton, down 6%, reflecting the slowdown in demand and the lower supply of resins, due to the scheduled maintenance shutdown at the cracker located in the state of Bahia, which impacted production at second-generation plants.
Despite the continuous recovery in capacity utilization rates at Quattor, PE sales volume in 4Q10 decreased by 11% in the domestic market, mainly due to the scheduled maintenance shutdown at the cracker in Bahia, as explained above. Meanwhile, PP sales fell by 2%, in line with historical seasonality.
Apparent consumption of PVC fell by 5.9% from 3Q10 to 269 kton, according to the Brazilian Chemical Manufacturers’ Association (Abiquim). On the other hand, Braskem’s PVC sales remained virtually stable in relation to the previous quarter, at 130 kton.
The 4Q10 imported volume stood at 334 kton, maintaining its market share in the Brazilian market at 26%.
Average resin prices in Brazilian real followed the international market trend, which increased by 12% over the previous quarter.
In annual basis, the Brazilian market of thermoplastic resins was 4.9 million tons in 2010, up 15% from 2009, benefitting from the positive performance of the Brazilian economy, which was led by sectors related to consumer goods and infrastructure. In this context, the PE, PP and PVC markets ended the year with production growth of 17%, 11% and 18%, respectively.
In this scenario, Braskem’s domestic sales of PE and PP increased 12% and 10%, respectively, impacted by the lower capacity utilization rates of the Quattor assets at the start of the year and by scheduled maintenance shutdown. Domestic PVC sales grew by 10%, restricted by the limited production capacity. Total sales volume of thermoplastic resins in the domestic market grew by 11% from 2009 to reach 3,413 kton.
Imports accounted for 26% of total market in virtually all quarters, focusing on customers seeking lower value-added and more commoditized products, and also due to: (i) the stronger Brazilian real; (ii) the solid growth in the PVC market; and (iii) the competitiveness gain of the US PE as a result of the lower ethane costs in that country.
Braskem’s exports in 4Q10, which include Braskem America, totaled 531 kton, down 7% from 3Q10. This result was due to the lower supply of PE and the contraction in PP sales volume at Braskem America, which was impacted by the seasonally lower demand in the U.S. market in the quarter. In 2010, Braskem’s resins exports totaled 2 million tons, down 11%, reflecting the reallocation of sales to the domestic market, which offered better profitability.
5 Demand was measured based on the Company's internal estimates, Abiquim data (PVC) and the Alice import system.
Performance (tons) Polymers 4Q10 3Q10 4Q09 Change% Change% 2010 2009 Change%
CONSOLIDATED (A) (B) (C ) (A)/(B) (A)/(C ) (D) (E) (D)/(E)
Sales - Domestic Market
PE's 424,769 475,227 387,195 (11) 10 1,674,825 1,491,181 12
PP 320,083 328,207 286,915 (2) 12 1,233,301 1,123,589 10
PVC 129,945 130,783 121,092 (1) 7 504,780 457,430 10
Total Resins 874,797 934,217 795,203 (6) 10 3,412,907 3,072,200 11
Sales - International Market
PE's 217,179 241,935 229,040 (10) (5) 823,328 939,714 (12)
PP 104,564 100,523 99,458 4 5 330,729 421,491 (22)
PP - Braskem America 209,453 227,954 221,239 (8) (5) 840,095 838,676 0
PVC 73 48 149 51 (51) 194 40,262 (100)
Total Resins 531,269 570,460 549,887 (7) (3) 1,994,346 2,240,143 (11)

Total thermoplastic resins production volume in 4Q10 was 1,397 kton, down 4% from the previous quarter. The higher operating efficiency at the Quattor plants, which posted an increase of 9% in second-generation production, partially offset the limited production at the plants located in Bahia state, which experienced the scheduled maintenance shutdown in the quarter.
In 2010, Braskem recorded production of 5.4 million tons, up 6% from 2009, due the higher operational efficiency, the gradual recovery in utilization rates at the Quattor assets and the joint efforts with Petrobras to normalize raw material supply. Another highlight was PE production in the state of Rio Grande do Sul, which registered records in October and December.
The utilization rates of Braskem’s main products are presented below:
* 4Q10: cracker scheduled maintenance shutdown at Camaçari complex
� Basic Petrochemicals Performance
In 4Q10, the international market of basic petrochemicals was marked by price increase in relation to 3Q10, driven by (i) higher raw material prices; (ii) the rigorous winter in the Northern hemisphere, which impacted capacity utilization rates; (iii) the higher-than-expected demand in developed countries; and (iv) the operational problems at naphtha-based crackers in Europe, which limited ethylene supply and the availability of byproducts.
Braskem recorded ethylene and propylene sales of 205 kton in 4Q10, down 13% from 3Q10, limited by the scheduled maintenance shutdown in one of the lines at the cracker located in Bahia state, which lasted 52 days and limited mainly propylene volumes directed to exports markets. Moreover, the average price of ethylene and propylene followed the international price trend, which posted increases of 5% from the previous quarter.
The shutdown also affected the production and supply of the cracker’s byproducts, and the same trend could be observed in the aromatics chain, with BTX sales volume declining 21% and butadiene sales reducing 13%. Average aromatic prices increased near 20%, while butadiene prices declined by around 9%.
Performance (tons) Polymers 4Q10 3Q10 4Q09 Change% Change% 2010 2009 Change%
CONSOLIDATED (A) (B) (C ) (A)/(B) (A)/(C ) (D) (E) (D)/(E)
Produção
PE's 639,180 676,819 597,376 (6) 7 2,536,776 2,369,726 7
PP 640,520 651,679 586,293 (2) 9 2,437,643 2,305,863 6
PVC 117,309 125,170 131,751 (6) (11) 475,559 479,077 (1)
Total Resins 1,397,008 1,453,668 1,315,420 (4) 6 5,449,978 5,154,666 6
83%91%
84% 78%88% 84% 81%
90% 89%100% 97% 91%
4Q09 3Q10 4Q10 4Q09 3Q10 4Q10 4Q09 3Q10 4Q10 4Q09 3Q10 4Q10
Ethylene Polyethylene Polypropylene PVC

Despite the continued recovery in the capacity utilization rate at Quattor assets, which reached 93%, the scheduled maintenance shutdown at the unit in the Bahia state led to a decline in the Company’s utilization rate in 4Q10 to 84%. Ethylene production in the quarter was 791 kton, down 8% from the previous quarter.
In 2010, the average capacity utilization rate of the Company’s petrochemical complexes was 87%, compared to 86% in 2009. Ethylene and propylene production volume came to 4,797 ktons, for growth of 6% on the previous year. Total ethylene and propylene sales followed this growth and increased by 6% in the period. In the case of the BTX, total sales posted growth of 5%. Another highlight was the sale of cumene, which increased 20%, driven by higher demand from the textile industry and by the capacity expansion at the cracker located in Mauá, in São Paulo state, which was concluded in 3Q09.
� Net Revenue
In 4Q10, Braskem posted net revenue of US$4.2 billion, in line with the previous quarter, reflecting higher prices, which partially offset the lower sales volume. In Brazilian real terms, net revenue was R$7.2 billion, down 2% from 3Q10.
Export revenue in the quarter was US$1.1 billion (26% of net revenue), down 13% from 3Q10. This performance is basically explained by the lower sales volume of PE, propylene and BTX due to the limited availability of these products, since part of these products come from the Camaçari complex, where one of the plants underwent a scheduled maintenance shutdown in the quarter, as already mentioned.
In relation to 4Q09, net revenue in U.S. dollar grew by 13%, due to (i) the higher prices of resins and basic petrochemicals, which followed the recovery in international prices, especially for PP, benzene and propylene, whose global prices rose by 24%, 29% and 26%, respectively; (ii) the growth in the Company's sales volume; and (iii) the
Performance (tons)
Basic Petrochemicals4Q10 3Q10 4Q09 Change% Change% 2010 2009 Change%
CONSOLIDATED (A) (B) (C ) (A)/(B) (A)/(C ) (A) (B) (A)/(B)
Sales - Domestic Market
Ethylene 112,287 125,576 129,516 (11) (13) 507,407 498,731 2
Propylene 60,361 63,668 65,467 (5) (8) 254,045 231,560 10
Cumene 75,294 72,032 63,721 5 18 288,890 239,806 20
BTX* 138,968 144,047 162,763 (4) (15) 604,148 604,708 (0)
Sales - International Market
Ethylene 3,774 6,079 - (38) - 9,853 - -
Propylene 28,688 41,197 53,118 (30) (46) 160,398 151,489 6
BTX* 99,349 158,556 101,756 (37) (2) 516,863 465,665 11
BTX* - Benzene, Toluene, Orthoxylene and Paraxylene
Performance (tons)
Basic Petrochemicals4Q10 3Q10 4Q09 Change% Change% 2010 2009 Change%
CONSOLIDATED (A) (B) (C ) (A)/(B) (A)/(C ) (A) (B) (A)/(B)
Production
Ethylene 791,333 861,717 785,218 (8) 1 3,276,626 3,086,103 6
Propylene 353,195 399,689 375,606 (12) (6) 1,520,142 1,429,812 6
Cumene 75,098 69,881 63,382 7 18 286,284 243,940 17
BTX* 292,447 346,678 316,890 (16) (8) 1,310,545 1,249,111 5
BTX* - Benzene, Toluene, Orthoxylene and Paraxylene
6,513 7,328 7,188
4Q09 3Q10 4Q10
Net Revenue (R$ million)
+10%
-2%
3,747 4,189 4,236
4Q09 3Q10 4Q10
Net Revenue (US$ million)
+13%
+1%
Exports 22% 30% 26%
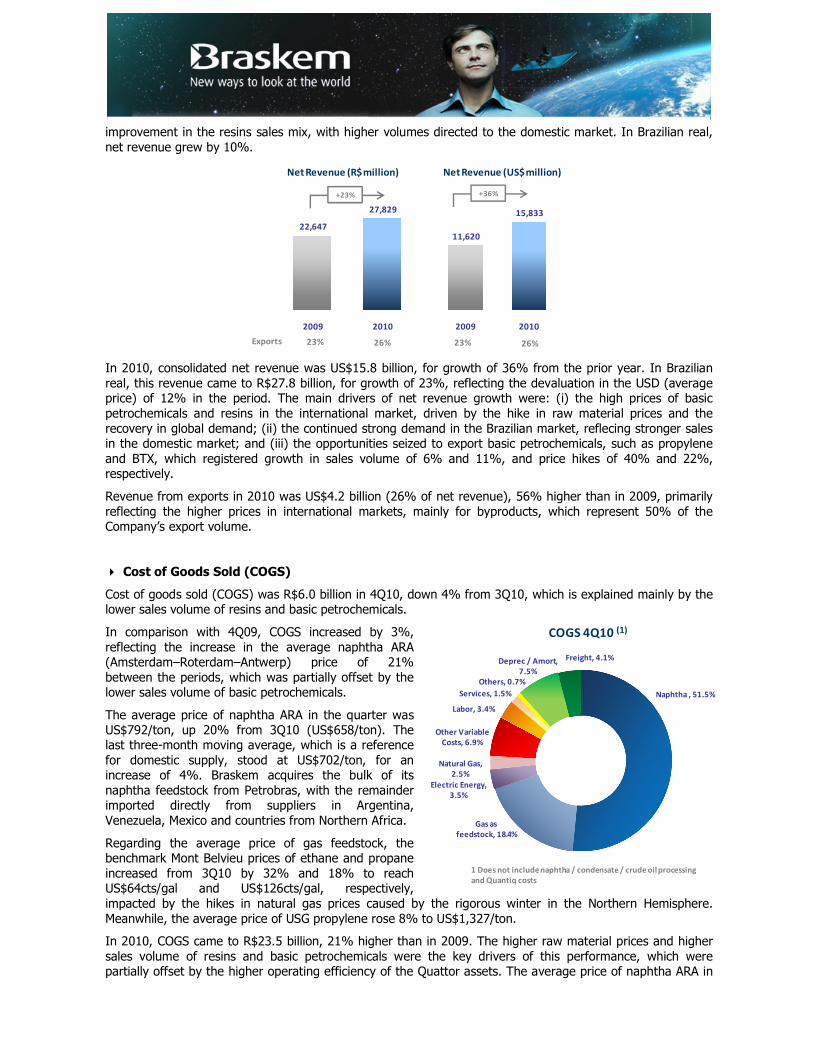
improvement in the resins sales mix, with higher volumes directed to the domestic market. In Brazilian real, net revenue grew by 10%.
In 2010, consolidated net revenue was US$15.8 billion, for growth of 36% from the prior year. In Brazilian real, this revenue came to R$27.8 billion, for growth of 23%, reflecting the devaluation in the USD (average price) of 12% in the period. The main drivers of net revenue growth were: (i) the high prices of basic petrochemicals and resins in the international market, driven by the hike in raw material prices and the recovery in global demand; (ii) the continued strong demand in the Brazilian market, reflecing stronger sales in the domestic market; and (iii) the opportunities seized to export basic petrochemicals, such as propylene and BTX, which registered growth in sales volume of 6% and 11%, and price hikes of 40% and 22%, respectively.
Revenue from exports in 2010 was US$4.2 billion (26% of net revenue), 56% higher than in 2009, primarily reflecting the higher prices in international markets, mainly for byproducts, which represent 50% of the Company’s export volume.
� Cost of Goods Sold (COGS)
Cost of goods sold (COGS) was R$6.0 billion in 4Q10, down 4% from 3Q10, which is explained mainly by the lower sales volume of resins and basic petrochemicals.
In comparison with 4Q09, COGS increased by 3%, reflecting the increase in the average naphtha ARA (Amsterdam–Roterdam–Antwerp) price of 21% between the periods, which was partially offset by the lower sales volume of basic petrochemicals.
The average price of naphtha ARA in the quarter was US$792/ton, up 20% from 3Q10 (US$658/ton). The last three-month moving average, which is a reference for domestic supply, stood at US$702/ton, for an increase of 4%. Braskem acquires the bulk of its naphtha feedstock from Petrobras, with the remainder imported directly from suppliers in Argentina, Venezuela, Mexico and countries from Northern Africa.
Regarding the average price of gas feedstock, the benchmark Mont Belvieu prices of ethane and propane increased from 3Q10 by 32% and 18% to reach US$64cts/gal and US$126cts/gal, respectively, impacted by the hikes in natural gas prices caused by the rigorous winter in the Northern Hemisphere. Meanwhile, the average price of USG propylene rose 8% to US$1,327/ton.
In 2010, COGS came to R$23.5 billion, 21% higher than in 2009. The higher raw material prices and higher sales volume of resins and basic petrochemicals were the key drivers of this performance, which were partially offset by the higher operating efficiency of the Quattor assets. The average price of naphtha ARA in
Exports 23% 26% 23% 26%
22,647
27,829
2009 2010
11,620
15,833
2009 2010
Net Revenue (US$ million)
+23% +36%
Net Revenue (R$ million)
Naphtha , 51.5%
Gas as
feedstock, 18.4%
Electric Energy,
3.5%
Natural Gas,
2.5%
Other Variable
Costs, 6.9%
Labor, 3.4%
Services, 1.5%
Others, 0.7%
Deprec / Amort,
7.5%
Freight, 4.1%
COGS 4Q10 (1)
1 Does not include naphtha / condensate / crude oil processing
and Quantiq costs
2010 was US$713/t, up 34% from 2009 average of US$534/t. Regarding the average price of gas feedstock, the benchmark Mont Belvieu prices of ethane and propane increased 25% and 38% between the periods, to US$60 cts/gal and US$116cts/gal, respectively. Meanwhile, the USG propylene price increased by 59% to US$1,346/ton in 2010, driven by the lower availability of this product in that market.
� Selling, General and Administrative Expenses
In 4Q10, Selling, General and Administrative (SG&A) expenses came to R$545 million, up R$84 million from 3Q10, primarily due to the nonrecurring negative impact of R$29 million detailed below. In relation to 4Q09, SG&A expenses were 16% higher, as also explained below.
Selling expenses in 4Q10 were R$209 million, for an increase of R$13 million from 3Q10, especially related to efforts to adjust IQ’s accounting practices to those used by Braskem, which had an impact of R$5 million in the fourth quarter, and by the nonrecurring expenses of R$7 million related to the retroactive payment of freight insurance for sales in the domestic market. In comparison with 4Q09, selling expenses decreased by R$8 million, essentially reflecting the improved credit approval process.
In 2010, Selling Expenses were R$806 million, up 9% from 2009, primarily impacted by nonrecurring expenses related to the adjustment in accounting criteria at Quattor and the termination of the export agreement with Riopol, which amounted to around R$88 million. Excluding these effects, selling expenses would have been R$20 million lower than in 2009.
General and Administrative Expenses totaled R$337 million in the quarter, up R$71 million from 3Q10, impacted by the nonrecurring expenses with advertising of around R$8 million and with third-party and technical consulting services of approximately R$14 million. In addition to the extraordinary expenses, G&A expenses in 4Q10 were impacted by the wage increases under the collective bargaining agreement and the adjustments made to the salary structure. In comparison with 4Q09, G&A expenses increased by R$67 million, due to the same reasons explained above.
In 2010, G&A expenses increased by R$206 million, basically impacted by the nonrecurring expenses of R$52 million with technical consulting services and other advisory services related to the Quattor and Braskem America transactions; the adjustment of Quattor’s accounting criteria to the standards used by Braskem, with an impact of R$62 million; and the expenses with advertising and third-party services of R$42 million. In addition to the nonrecurring expenses, this increase mainly reflected the adjustments to the salary structure, the wage increases under the collective labor agreement and the provisioning for profit sharing.
� Net Financial Result
In 4Q10, the net financial result was an expense of R$541 million, versus net financial income of R$183 million in 3Q10. This variation is essentially explained by the depreciation of 2% in the U.S. dollar against the Brazilian real, which had a positive impact of R$106 million in the quarter, in comparison with the depreciation of 6% in 3Q10, which generated a positive impact of R$638 million in that quarter.
Since Braskem holds net exposure to the U.S. dollar (more dollar-pegged liabilities than dollar-pegged assets), any shift in the path of the exchange rate has an impact on the accounting financial result. On December 31, 2010, this net exposure was composed as follows: 63% of debt and 76% of suppliers, which was partially offset by 43% of accounts receivable and 14% of cash. Given its heavily dollarized operational cash flow, the Company considers this exposure adequate. Practically 100% of the Company’s revenue is directly or indirectly pegged to the variation in the USD exchange rate, and most of its costs are also pegged to this currency.
It is important to note that foreign exchange variation has no direct impact on the Company's cash position in the short term. This amount represents foreign exchange accounting impacts, especially those on the Company’s debt, with any expenditure occurring when the debt matures, which has an average term of 12.5 years.
Excluding the effects from foreign exchange variation and monetary restatement on its balance-sheet accounts exposed to foreign currencies, the net financial result in 4Q10 was a net financial expense of R$583 million, up R$167 million from 3Q10. This amount includes nonrecurring expenses of roughly R$250 million, composed as follows: (i) R$208 million related to the expenses with the break funding cost of the operation related to the prepayment of Quattor’s debts; and (ii) R$43 million related to the revision of the charges incurred under the Special Installment Repayment Program (PAES), which was transfered to the Refis tax

amnesty program instituted by Federal Law 11,941/09 (for more information, see Note 20 – Taxes recoverable - in the 2010 Financial Statements).
On the same basis, the net financial result in 2010 was an expense of R$1,668 million, down R$336 million from 2009, reflecting the lower debt and the adjustment in the debt profile after the acquisitions made in 1Q10. This amount also includes nonrecurring expenses of R$462 million related to: (i) the impact of R$43 million from participating in the Refis tax renegotiation program in 4Q10, as previously mentioned; (ii) the R$90 million in expenses incurred as a result of the agreement reached with the trade union in the state of Bahia in 3Q10; and (iii) R$329 million in expenses with the prepayment of debt, mainly at Quattor, which reduced the average cost of debt at the end of the period to 6.6% in U.S. dollar and 83.4% of the CDI rate in Brazilian real.
The following table shows the composition of Braskem's net financial result on a quarterly and annual basis.
* Nonrecurring expenses are classified under the item Others
In order to protect its cash flow and reduce the volatility of its working capital and investment programs financing, Braskem adopts credit and risk management procedures in accordance with both its Financial Management Policy and Risk Management Policy. In December 2010, the Company had 6 derivative transactions aimed at hedging its assets and liabilities, with maturity, currency, rates and amounts which are perfectly fit to assets and liabilities under hedging. In any given scenario, possible negative or positive adjustments to these hedges will be offeset by negative or positive adjustments to assets and liabilities.
� Net Income
Braskem recorded net income of R$361 million in the last quarter of the year, reflecting the solid operational performance and partially impacted by the net financial expense of R$541 million explained above.
In 2010, net income came to R$1.889 billion, which represented a significant increase from the R$398 million posted in 2009. In addition to the solid operational performance in the period, as confirmed by the 27% growth in consolidated EBITDA, Braskem's net income was positively impacted by the recognition of R$405 million of deferred income and social contribution taxes (IR/CSSL) over Quattor’s accrued losses and other IFRS adjustments, and by the recognition of the assets of the Quattor Group and the PP assets of Sunoco Chemicals at market value, in accordance with IFRS, in the amount of approximately R$869 million (net of income tax and social contribution, realization of inventories and amortization of intangible assets).
Million of R$ 4Q10 3Q10 4Q09 2010 2009
Financial Expenses (585) 164 (946) (2,011) 639
Interest Expenses (244) (251) (193) (932) (878)
Monetary Variation (MV) (75) (70) (161) (441) (572)
Foreign Exchange Variation (FX) 148 737 279 431 3,501
IOF/Income Tax/Banking Expenses (6) (12) (6) (31) (33)
Net Interest on Fiscal Provisions (87) (57) (785) (268) (963)
Others* (323) (184) (81) (770) (416)
Financial Revenue 44 19 (35) 393 (373)
Interest 64 64 51 272 252
Monetary Variation (MV) 10 30 20 86 60
Foreign Exchange Variation (FX) (42) (99) (113) (25) (719)
Net Interest on Fiscal Credits 2 2 2 8 7
Others 9 21 5 52 27
Net Financial Result (541) 183 (981) (1,618) 266
Million of R$ 4Q10 3Q10 4Q09 2010 2009
Net Financial Result (541) 183 (981) (1,618) 266
Foreign Exchange Variation (FX) 106 638 166 405 2,782
Monetary Variation (MV) (65) (40) (140) (355) (511)
Net Financial Result Excluding FX and MV (583) (416) (1,006) (1,668) (2,005)

Dividends
The Company’s management is proposing to the Annual Shareholders’ Meeting to be held on April 29, 2011, the payment of dividends amounting to R$666 million, based on the adjusted net income of R$1.7 billion (see note 26 – Shareholders’ Net Equity – item (g) Net Income Allocation).
� Cash Flow
Braskem’s operating cash flow in 4Q10 was R$952 million, compared with operating cash flow of R$1,055 million in the previous quarter, a decrease of R$103 million. Working capital contributed with R$102 million in the quarter, influenced by the decrease of R$289 million in Accounts Receivable, due to the lower export volume; which were partially offset by the increase of R$158 million in Inventories, due to the higher prices in the period.
* The acquisitions of R$1.4 billion were supported by the capitalization of R$3.7 billion.
The line interest paid was once again impacted in the quarter by nonrecurring expenses with the prepayment of debt related to the debt management operations following the Quattor transaction.
Free Cash Flow (FCF) was positive R$143 million, a decrease from the 3Q10, impacted by the higher expenditure with investment activities in the last quarter of the year. In relation to 4Q09, free cash flow increased by R$916 million.
In 2010, the operating cash flow was R$3.8 billion, up R$1.8 billion from 2009. FCF was negative R$79 million in the year, compared with negative R$15 million in 2009. The main reason was the acquisition of the Quattor, Polibutenos, Unipar Comercial and Sunoco Chemicals assets for a combined total of R$1.4 billion in 2010, and the acquisition of the interest held by BNDESPar in Riopol, which were supported by the Company’s capital increase. The original amount of the acquisition of the 25% interest in Riopol is R$174.6 million, restated by the TJLP rate + 2.5% as of June 2008. The payment schedule is 15% in 2015, 35% in 2016 and 50% in 2017, with no change in the rate of restatement.
� Capital Structure and Liquidity
On December 31, 2010, Braskem's gross debt was US$7,639 million, down 4% from the balance on September 30, 2010.
In the same period, the balance of dollar-denominated cash and financial investments decreased by 16% to US$1,734 million. This reduction reflects the strategy to optimize cash carrying costs through access to a stand-by loan of US$350 million that does not include any restrictive covenants on withdrawals during times of Material Adverse Change (MAC Clause). Only prime banks with low default rates (credit default swap) and high credit ratings participated in the operation.
As a result, Braskem's consolidated net debt stood at US$5,905 million, practically in line with the balance at the close of 3Q10. When measured in Brazilian real, Braskem’s net debt declined by 1%, influenced by the USD depreciation of 2% in the period.
R$ Million 4Q10 3Q10 4Q09 2010 2009
Operating Cash Flow 952 1,055 (133) 3,814 1,976
Interest Paid (262) (253) (176) (961) (771)
Income Tax and Social Contribution (31) (5) (27) (59) (65)
Investments (516) (311) (437) (2,874) (1,154)
Free Cash Flow 143 485 (773) (79) (15)

The EBITDA growth in the last 12 months (R$4.1 billion), combined with stable net debt, led to a decrease in financial leverage, as measured by the ratio of net debt to EBITDA LTM, from 2.64x (last 12 months) in the third quarter to 2.43x in the fourth quarter, in line with the Company’s objective of reducing leverage. In U.S. dollar, the level of debt declined by 7%, for a net debt/EBITDA ratio of 2.56x.
On December 31, 2010, the average debt term was 12.5 years, lengthening from 8.7 years at the end of September 2010, which was mainly due to the issue, in October, of US$450 million in perpetual bonds with a coupon of 7.375% p.a.. A portion of the proceeds from this issue were used to exercise the call, in December 2010, of the US$150 million in perpetual bonds issued by Braskem in 2005, with coupon of 9.75% p.a. and a portion will also be used to pay, in April 2011, the US$200 million in perpetual bonds issued by Braskem in 2006, with coupon of 9.00% p.a., in line with the strategy announced by Braskem to adjust its debt profile.
Also with this objective, during 4Q10, Braskem prepaid R$565 million in contracts that Riopol had established with the Brazilian Development Bank (BNDES), effectively settling the project finance obligations established by these parties. Another important operation was the prepayment of Quattor's debt, as mentioned above. On December 31, 2010, the balance of USD-denominated debt corresponded to 63% of the total, following the higher volume of funding operations in this currency in the quarter and the higher concentration of payments of BRL-denominated debt. The debt restructuring in 2010 allowed the Company to regain a more balanced exposure to its creditors when compared to its proforma debt profile in December 2009, when banks accounted for more than 50% of the debt, as shown below.
The following charts show Braskem’s gross debt by category and indexer.
5,905
5,862
1,498
1,622
7,639
7,934
236
450
Dec 10
Sep 10
Dec 10
Sep 10
Dec 10
Sep 10
Net Debt
9,839
9,932
2,496
2,748
12,728
13,442
393
762
Dec 10
Sep 10
Dec 10
Sep 10
Dec 10
Sep 10
Gross Debt Gross Debt
Cash Cash
Net Debt
R$ million US$ million
3,510
2,889
2,072
1,734
invested in US$invested in R$
invested in US$invested in R$
2.64x 2.43x
Sep 10 Dec 10
Net Debt/ EBITDA
(R$ million)
-8%
2.76x 2.56x
Sep 10 Dec 10
Net Debt / EBITDA
(US$ million)
-7%
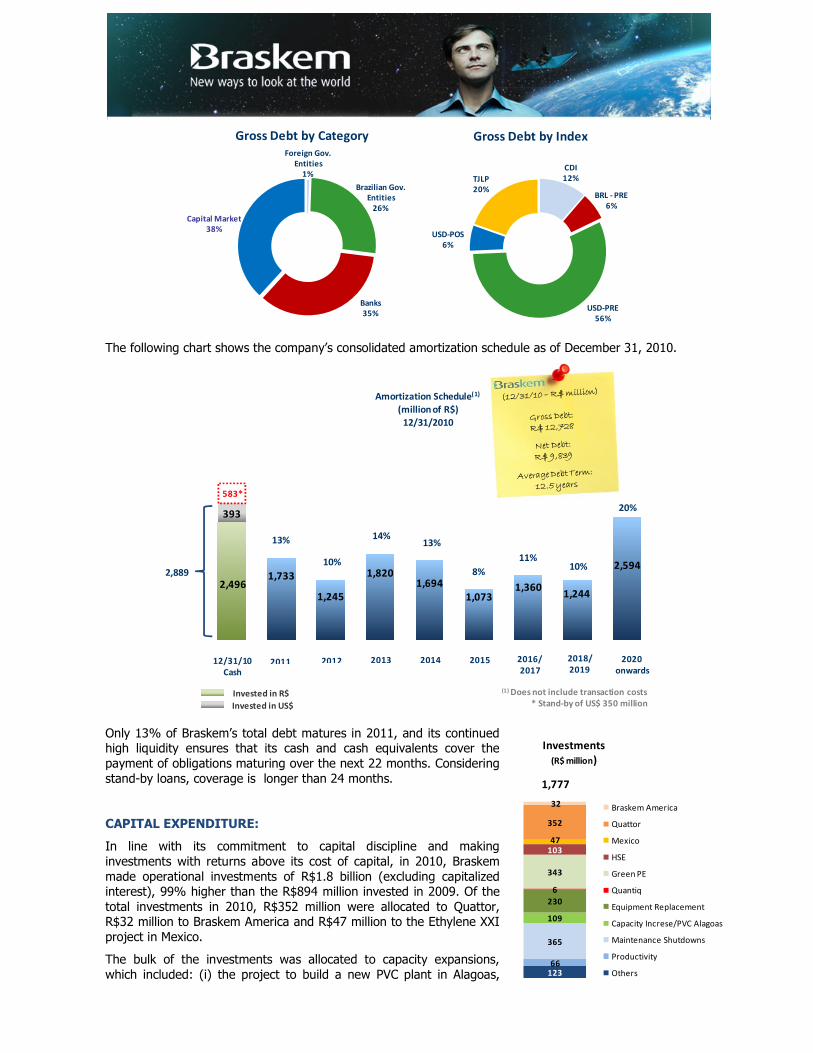
The following chart shows the company’s consolidated amortization schedule as of December 31, 2010.
Only 13% of Braskem’s total debt matures in 2011, and its continued high liquidity ensures that its cash and cash equivalents cover the payment of obligations maturing over the next 22 months. Considering stand-by loans, coverage is longer than 24 months.
CAPITAL EXPENDITURE:
In line with its commitment to capital discipline and making investments with returns above its cost of capital, in 2010, Braskem made operational investments of R$1.8 billion (excluding capitalized interest), 99% higher than the R$894 million invested in 2009. Of the total investments in 2010, R$352 million were allocated to Quattor, R$32 million to Braskem America and R$47 million to the Ethylene XXI project in Mexico.
The bulk of the investments was allocated to capacity expansions, which included: (i) the project to build a new PVC plant in Alagoas,
Foreign Gov.
Entities
1%
Brazilian Gov.
Entities
26%
Banks
35%
Capital Market
38%
Gross Debt by Category
CDI
12%
BRL - PRE
6%
USD-PRE
56%
USD-POS
6%
TJLP
20%
Gross Debt by Index
2,4961,733
1,245
1,8201,694
1,0731,360
1,244
2,594
393
583*
2011 2012 2013 2014 2015 2016/
2017
2018/
20192020
onwards12/31/10
Cash
13%
10%
14%13%
8%
11%10%
20%
2,889
Amortization Schedule(1)
(million of R$)
12/31/2010
(1) Does not include transaction costs
* Stand-by of US$ 350 millionInvested in US$
Invested in R$
12366
365
109
230
6
343
10347
352
32 Braskem America
Quattor
Mexico
HSE
Green PE
Quantiq
Equipment Replacement
Capacity Increse/PVC Alagoas
Maintenance Shutdowns
Productivity
Others
1,777
Investments
(R$ million)

with disbursement of R$86 million; and (ii) the construction and startup of the plant to produce 200 kton/year of Green Ethylene (Triunfo, Rio Grande do Sul), which required investment of R$343 million in 2010, not considering the amount of taxes recoverable. Considering that these taxes are deductible, investments in the year totaled R$290 million. This new plant led Braskem to become the world leader in biopolymer production, and was delivered on time and within budget.
In keeping with the objective of maintaining its plants operating at high levels of operating efficiency and reliability, Braskem also disbursed R$365 million for scheduled maintenance shutdowns.
In November 2010, the maintenance shutdown at the ethylene cracker in the state of Bahia, which lasted 52 days, required investment of R$190 million in the last quarter Braskem also invested R$103 million in the area of health, safety and the environment (HSE) during 2010.
For 2011, total investment is estimated at R$1.6 billion. The main investments are estimated to be allocated mainly to (i) scheduled maintenance shutdowns (approximately R$390 million); (ii) operational investments (R$660 million); and (iii) capacity expansions (around R$500 million).
QUATTOR:
On February 23, 2011, Brazil’s anti-trust authority, the Administrative Council of Economic Defense (CADE), approved without restrictions the acquisitions of Quattor Participações S.A., Unipar Comercial e Distribuidora S.A. and Polibutenos S.A. Indústrias Químicas. The approval of the transaction had already received favorable opinions from the Economic Oversight Department (SEAE) of the Ministry of Finance and from the Economic Law Department (SDE) of the Ministry of Justice.
As part of the transaction, Braskem, seeking to promote transparency in its commercial relations and boost the competitiveness of the production chain, assumed with CADE, under a regime of confidentiality, a commitment to:
(I) notify in advance the existence in the future of any resins import contracts that contain exclusivity clauses, in line with the draft bill to restructure Brazil's Antitrust System and with best international practices involving antitrust issues;
(II) submit semiannually a report to CADE consolidating its resins imports in the period;
(III) submit copies of the resins supply contracts signed with companies abroad for sale in the Brazilian market; and
(IV) submit a list of its resin purchase contracts that contain exclusivity clauses for sale in the international market.
� Monitoring Synergies
Braskem remains focused on improving the operational efficiency of the assets acquired, and various initiatives have been initiated to capture the synergies from the transaction.
New opportunities have been identified in 2010, amounting to R$495 million in annual and recurring EBITDA for 2012, and another R$377 million are expected to be captured in 2011. The bulk of these synergies is concentrated in initiatives in the industrial and logistics areas. Initiatives on the industrial front include refining the plan for the production and sale of various cracker streams, such as aromatics and butadiene; improving the production mix in second generation plants, reducing its number of grades; and centralizing the asset maintenance plan strategy, optimizing teams and better planning of the schedule maintenance shutdowns. On the logistics front, a highlight was the gains in
234
377
82
61
Industrial Logistics Supply EBITDA Synergies
R$ million
freight operations due to better planning for domestic and export markets, distribution and storage operations. On the supply front, the highlights were the integrated purchase of inputs and the renegotiation of third-party contracts. The Company plans to invest R$275 million to support the capture of these synergies, with 50% of which being disbursed before the end of 2011. In addition to operating synergies, there are synergies to be captured in the financial front amounting to R$490 million in net present value. The capture of these synergies are in course, having already provided a positive impact of R$150 million in 2010, and primarily involve fiscal gains and lower debt carrying costs.
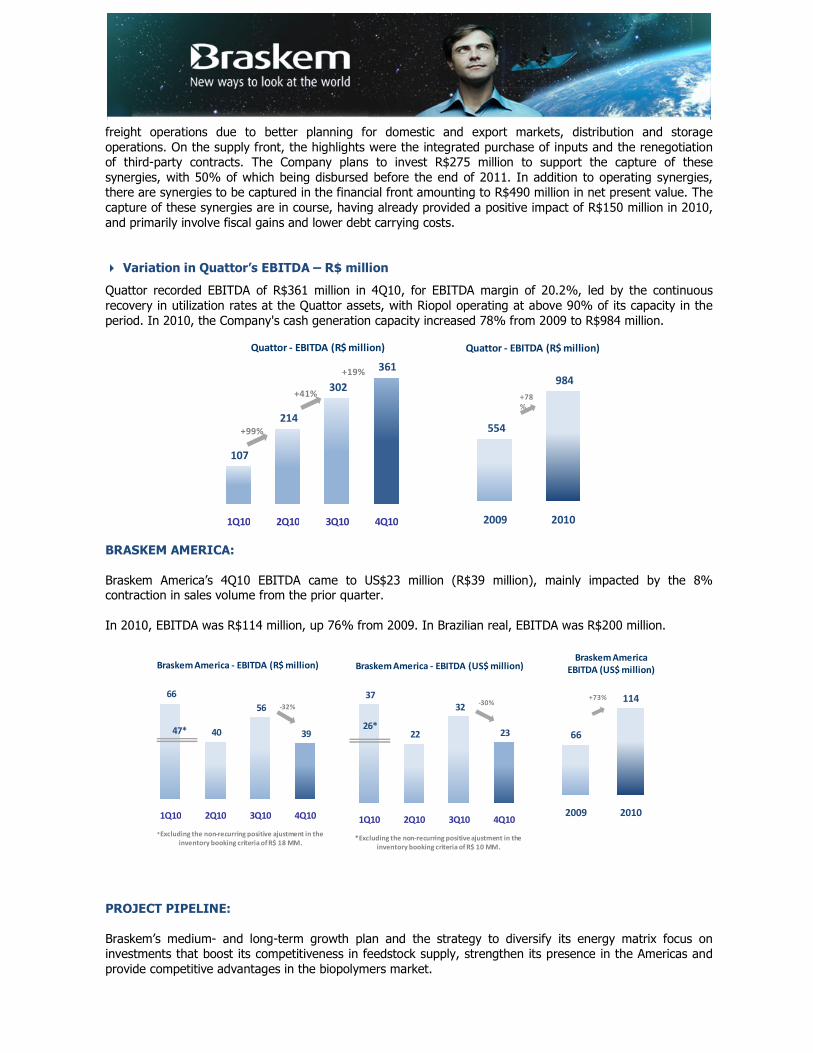
� Variation in Quattor’s EBITDA – R$ million
Quattor recorded EBITDA of R$361 million in 4Q10, for EBITDA margin of 20.2%, led by the continuous recovery in utilization rates at the Quattor assets, with Riopol operating at above 90% of its capacity in the period. In 2010, the Company's cash generation capacity increased 78% from 2009 to R$984 million.
BRASKEM AMERICA:
Braskem America’s 4Q10 EBITDA came to US$23 million (R$39 million), mainly impacted by the 8% contraction in sales volume from the prior quarter.
In 2010, EBITDA was R$114 million, up 76% from 2009. In Brazilian real, EBITDA was R$200 million.
PROJECT PIPELINE:
Braskem’s medium- and long-term growth plan and the strategy to diversify its energy matrix focus on investments that boost its competitiveness in feedstock supply, strengthen its presence in the Americas and provide competitive advantages in the biopolymers market.
107
214
302
361
1Q10 2Q10 3Q10 4Q10
Quattor - EBITDA (R$ million)
+99%
+41%
+19%
554
984
2009 2010
Quattor - EBITDA (R$ million)
+78
%
66
40
56
39
1Q10 2Q10 3Q10 4Q10
Braskem America - EBITDA (R$ million)
-32%
47*
*Excluding the non-recurring positive ajustment in the
inventory booking criteria of R$ 18 MM.
37
22
32
23
1Q10 2Q10 3Q10 4Q10
Braskem America - EBITDA (US$ million)
-30%
26*
*Excluding the non-recurring positive ajustment in the
inventory booking criteria of R$ 10 MM.
66
114
2009 2010
Braskem America
EBITDA (US$ million)
+73%
� PVC capacity expansion
A total of R$86 million was invested in 2010 in the project, to expand PVC capacity by 200 kton/year, with total investment of US$470 million and expected net present value of US$450 million, to become operational in May 2012. For 2011, additional investments of R$380 million are expected, already considering the tax incentives under the Special Incentives Regime for the Development of Oil Infrastructure in the North, Northeast and Midwest Regions (REPENEC6) and the Alagoas State Integrated Development Program (PRODESIN7). The objective is to meet the growing demand for PVC in Brazil.
To finance the project, in addition to the line of up to R$525 million already approved by the BNDES, with repayment in 9 years and 88% of which in real at a rate of TJLP+1.46%. Braskem also received approval for a financing line of R$200 million from BNB with repayment in 12 years at a rate of 8.5% p.a..
� Butadiene Project
Braskem plans to invest approximately R$300 million to build a new butadiene plant, using the crude C4 stream. With construction slated to begin in 2011, the project, which will be submitted to the Board of Directors for approval, provides for the installation of a new line with capacity of 100 kton/year. The new plant should increase Braskem’s butadiene supply by approximately 30% to 446 kton/year as of 2013. In 2010, butadiene prices increased by 50% from 2009, reflecting the growing global demand and limited supply.
� Mexico Project – Ethylene XXI
The integrated project in Mexico in which Braskem and IDESA are participating jointly with interests of 65% and 35%, respectively, calls for the production of polyethylene resins using ethane as feedstock and is based on an ethane supply agreement with PEMEX-Gás for the supply of 66,000 barrels/day for 20 years. The fixed investment is estimated at roughly US$2.5 billion, with the debt portion financed under a project-finance model (70% debt/30% equity). The conclusion of works and the startup of units is slated for January 2015.
In November 2010, Braskem announced a strategic partnership with Ineos for the use of technology at two out of its three polyethylene plants, which have combined high density polyethylene (HDPE) production capacity of 750 kton/year. In February 2011, Braskem announced a strategic partnership with Lyondell Basell for the use of Lupotech T technology at the low density polyethylene (LDPE) plant, which has capacity of 300 kton/year.
In 2010, the Mexican market consumed around 1.88 million tons of polyethylene, with imports accounting for 68% of the total supply. Therefore, this project is extremely attractive and of great importance to the development of the local petrochemical industry.
A highlight in the year was the hiring of Bank Sumitomo as the project's financial advisor and the receipt of formal statements from various financial institutions interested in supporting the project, whose amount exceeds US$5.0 billion.
The next steps in 2011 for this project include: (i) choosing the technology for the cracker; (ii) finalizing the project's engineering and construction agreement; and (iii) structuring the project finance, with construction to begin in 2012.
� Other MOUs in Latin America
Braskem also has similar projects in less advanced phases in Peru, Bolivia and Venezuela. In the case of Peru, Braskem, Petrobras and PetroPeru concluded, in 2010, the analysis phase and the technical design of the petrochemical complex project to be installed in southern Peru, with polyethylene production capacity estimated at approximately 1.0 million tons/year. In 2011, Braskem’s office in the city of Lima should be inaugurated to support the team involved in the project and the commercial team already working in the country.
6 REPENEC: incentives on taxes and contributions Social Integration Program (PIS/PASEP), Tax for Social Security Financing (COFINS)
and Excise Tax (IPI)
7 PRODESIN: tax incentive, VAT, awarded by the Integrated Development Program of Alagoas state
8 Source: Plastic Association (Mexico)
� Green Polypropylene Project
Braskem also advanced its strategy to become the global leader in sustainable chemicals and announced, in October 2010, a project to produce Green Polypropylene at K Fair, one of the most important events in the plastic industry. In 2011, the basic engineering studies will be concluded, and the plant, which will have minimum green propylene production capacity of 30 ktons/year, is expected to become operational in the second half of 2013. The project has not yet been approved by the Board of Directors.
� Innovation Pipeline - Product Development
Utec Fiber
In December 2010, Braskem and the Department of Science, Technology and Innovation of Bahia have signed two agreements and one protocol of intentions to encourage research on technological innovation.
The first project is UTEC® fiber, an ultra-high molecular weight polyethylene fiber developed with 100% local technology that represents a pioneering initiative in the world, with main application for oil platforms to explore the pre-salt discoveries and for military-grade bullet-proof vests.
UTEC® fiber is an important solution for anchor cables currently used by oil exploration platforms made of steel and/or polyester, since it can stretch while maintaining exceptional rigidity and high resistance and is ideal for exploration activities in deep water of between 2,000 and 3,000 meters, which means applications for the pre-salt deposits recently discovered in Brazil. In the area of national defense, UTEC® fiber is ideal for making bullet-proof vests and is perfect for tropical countries such as Brazil, as it allows perspiration and is lighter, different from existing imported models.
The project, which also enjoys support from FINEP, the research and project financing arm of the Ministry of Science and Technology, will receive investment of US$10 million. Production on an industrial scale is slated to begin in 2013 to supply the potential market, which is estimated at between 1,000 and 1,500 tons/year.
IFRS IMPACTS:
For the first time, Braskem is presenting its financial statements in accordance with International Financial Reporting Standards (IFRS). The main differences that impacted the quarterly results are explained below. For more details on balance-sheet reconciliations, see Note 4 to the 2010 Financial Statements – First-time adoption of IFRS.
a. Braskem’s consolidated financial statements were affected by the deconsolidation of Cetrel and the inclusion of the proportional investment in the jointly subsidiary with Refinaria de Petróleo Rio-Grandense (RPR), in which Braskem held a 33.20% interest on December 31, 2010.
b. Sales Freight, which was previously deducted from Gross Revenue, is now booked under Cost of Goods Sold.
Income Statement IRFS BRGAAP IRFS BRGAAP IRFS BRGAAP IRFS BRGAAP IRFS BRGAAP
CONSOLIDATED - Real 1Q10 1Q10 2Q10 2Q10 3Q10 3Q10 4Q10 4Q10 2010 2010
Gross Revenue 5,730 5,630 7,791 8,437 9,391 9,300 8,635 8,617 31,547 31,984
Net Revenue 4,716 4,466 6,263 6,516 7,328 7,276 7,188 6,715 25,495 24,973
Cost of Good Sold (3,922) (3,673) (5,269) (5,357) (6,228) (6,145) (5,992) (5,453) (21,412) (20,628)
GrossProfit 794 793 994 1,160 1,099 1,131 1,196 1,262 4,083 4,345
Selling Expenses (129) (116) (180) (188) (201) (186) (209) (193) (719) (684)
General and Administrative Expenses (177) (159) (245) (233) (287) (266) (340) (333) (1,049) (991)
Business Combination - - 975 - - - - - 975 -
Other operating income (expenses) (15) (13) (39) (34) (16) (15) (26) (47) (96) (109)
Investment in Subsidiary and Associated Companies 10 7 6 7 9 7 (4) (0) 20 20
Operating Profit before Financial Result 483 484 1,512 674 604 636 616 653 3,215 2,447
Net Financial Result (442) (645) (524) (575) 180 193 (541) (542) (1,328) (1,569)
Profit(Loss) before Tax and Social Contribution 40 (161) 988 99 784 828 75 112 1,887 878
Income Tax/Social Contribution (18) 37 (11) (65) (251) (265) 282 502 2 209
Net Profit (Loss) 23 (123) 978 34 532 563 356 613 1,889 1,088
Company's Shareholder 23 - 978 - 532 - 362 - 1,895 -
Non Controll ing Interest - - (2) 11 2 (10) (6) 5 (6) 6
Net Profit (Loss) 23 (123) 976 45 534 554 356 618 1,889 1,094
Earnings (Loss) per share (EPS) 0.04 (0.24) 1.22 0.06 0.67 0.69 0.44 0.77 2.36 1.37
c. In accordance with IFRS, the financial statements from 1997 and 1998 must be adjusted to reflect the adjustments for inflation in the periods. This led to higher depreciation, which impacted Cost of Goods Sold and SG&A.
d. The 2Q10 results were positively impacted by the combination of Braskem with the companies of the Quattor group and Sunoco Chemicals in the approximate amount of R$869 million (net of income and social contribution taxes, realization of inventories and amortization of intangible assets), since the amount paid for the assets acquired and the liabilities assumed recognized on the acquisition date was lower than the fair values of the assets acquired and the liabilities assumed. For more information, see Note 5 to the 2010 Financial Statements – Business combinations.
e. Investments in research, which were previously recognized as intangible assets, are now booked as expenses. As a result, we benefitted from a reversal of the amortization registered.
f. The combination of items (c), (d) and (e) above reduced the line deferred Income and Social Contribution Taxes.
OUTLOOK:
The scenario projected for 2011 is positive, with world GDP expected to grow 4.4% in the year, according to the IMF. The main positive drivers of this growth in the world economy are the stronger economic activity in the United States resulting from the new policies aming at boosting the economy adopted by the government and the continued positive outlook for emerging countries.
The fronts requiring closer attention include the slowing of the Chinese economy as a result of further monetary tightening by authorities to control inflation, the deterioration in issues related to sovereign debt in the Eurozone and the potential worsening of the social unrest in Arab countries.
Although the dynamics of the Brazilian economy have not decoupled from the global context, the country remains well positioned due to both its positive growth outlook (GDP growth of 4.5%) and financial solidity.
Braskem believes Brazil's thermoplastic resins market will grow by from 9% to 10% in 2011. In this scenario, Braskem’s strategy remains focused on strengthening its business, which includes: (i) partnerships with its clients and the sustainability of the Brazilian petrochemical chain; (ii) pursuing operational efficiency and cost reductions; and (iii) the policy to maintain its financial health.
The Company has two major scheduled maintenance shutdowns at its crackers slated for 2011: (i) at the end of May, operations at the Rio de Janeiro unit (former Riopol) will be halted for 30 days; and (ii) in October, one of the lines of the Triunfo petrochemical complex is scheduled to stop for 40 days. Production planning for the year should partially offset the maintenance shutdown periods, with capacity utilization at Braskem’s crackers remaining around 90%, which is above the estimated world capacity utilization rate (84%).
In commodity markets, political instability in Arab countries, where some of the world’s largest oil reserves are located, have negatively impacted oil production and increased price volatility, consequently driving naphtha and petrochemical prices higher worldwide. Although the global petrochemical industry is still recovering, oversupply is expected for 2011, due to the new production capacities that became operational in the previous year. On the other hand, various factors continue to mitigate the impact of these new production capacities, leading the industry’s profitability to continue to exceed expectations: (i) the scheduled maintenance shutdowns; (ii) the trade sanctions imposed to Iran; (iii) the lack of qualified labor, operational instability and unscheduled shutdowns at new players in the Middle East; (iv) the gas-supply problems associated with oil production in that region; and (v) the expectations of uncompetitive plants closures. For the medium and long terms, the growth in demand is expected to exceed that in supply, leading to a reversal in the petrochemical cycle.
In this scenario, Braskem maintains its commitment to sustainable growth and development, and will continue to act proactively to pursue the best opportunities, seeking to create value for shareholders and increase competitiveness throughout the entire petrochemical and plastics production chain, without losing its focus on financial discipline.

UPCOMING EVENTS:
IR TEAM:
Note: On December 31, 2010, the Brazilian real/U.S. dollar exchange rate was R$1.6662/US$1.00.
Luciana Ferreira Roberta Varella
IRO IR Manager
Tel. (55 11) 3576-9178 Tel: (55 11) 3576-9266
[email protected] [email protected]
Daniela Castro Marina Dalben Isabella Alves
IR Analyst IR Analyst IR Analyst
Tel: (55 11) 3576-9615 Tel: (55 11) 3576-9716 Tel: (55 11) 3576-9010
[email protected] [email protected] [email protected]
Additional information:
www.braskem.com.br/ir

EXHIBITS LIST
EXHIBIT I: Consolidated Income Statement – Pro forma 20
EXHIBIT II: Consolidated Income Statement – Real 20
EXHIBIT III: Restatement of the Result 21
EXHIBIT IV: Braskem, Quattor and Braskem America Income Statement 22
EXHIBIT V: Consolidated Balance Sheet 23
EXHIBIT VI: Braskem Balance Sheet 24
EXHIBIT VII: Quattor Balance Sheet 25
EXHIBIT VIII: Braskem America Balance Sheet 26
EXHIBIT IX: Consolidated Cash Flow Statement 27
EXHIBIT X: Consolidated Production Volume 28
EXHIBIT XI: Braskem Production Volume and Capacity Utilization Rate 29
EXHIBIT XII: Quattor and Braskem America Production Volume and Capacity Utilization Rate
30
EXHIBIT XIII: Consolidated Sales Volume – Domestic Market 31
EXHIBIT XIV: Braskem Sales Volume – Domestic Market 32
EXHIBIT XV: Quattor Sales Volume – Domestic Market 33
EXHIBIT XVI: Consolidated Sales Volume – Export Market 34
EXHIBIT XVII: Braskem Sales Volume – Export Market 35
EXHIBIT XVIII: Quattor and Braskem America Sales Volume – Export Market 36
EXHIBIT XIX: Consolidated Net Revenue 37
EXHIBIT XX: Braskem Net Revenue 38
EXHIBIT XXI: Quattor and Braskem America Net Revenue 39
Braskem, a world-class Brazilian petrochemical company, is the leader in the thermoplastic resins segment in the Americas and the third-largest Brazilian industrial company owned by the private sector. The company operates 31 industrial plants across Brazil and 3 in the United states, and has annual production capacity of 15 million tons of
chemical and petrochemical products.
DISCLAIMER
This press release contains forward-looking statements. These forward-looking statements are not historical data, but rather reflect the targets and expectations of Braskem’s management. Words such as "anticipate",
"wish", "expect", "foresee", "intend", "plan", "predict", "project", "aim" and similar terms seek to identify statements that necessarily involve known and unknown risks. Braskem does not undertake any
responsibility for transactions or investment decisions based on the information contained in this document.
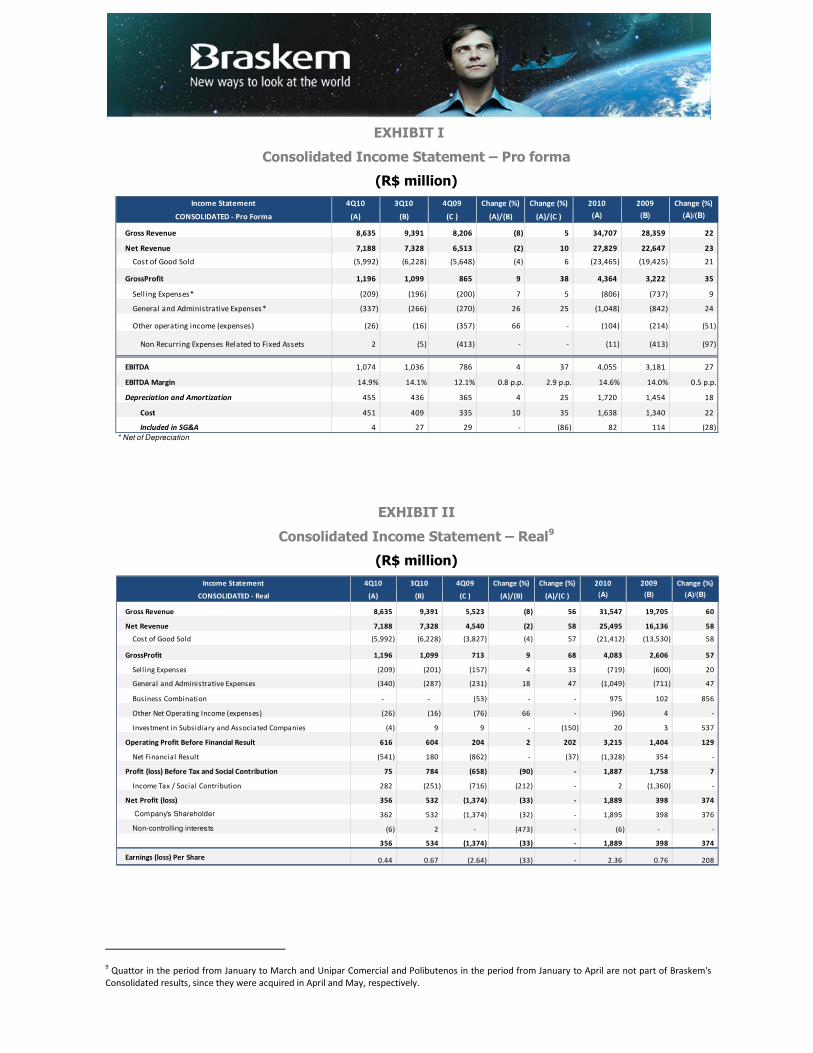
EXHIBIT I
Consolidated Income Statement – Pro forma
(R$ million)
EXHIBIT II
Consolidated Income Statement – Real9
(R$ million)
9 Quattor in the period from January to March and Unipar Comercial and Polibutenos in the period from January to April are not part of Braskem's
Consolidated results, since they were acquired in April and May, respectively.
Income Statement 4Q10 3Q10 4Q09 Change (%) Change (%) 2010 2009 Change (%)
CONSOLIDATED - Pro Forma (A) (B) (C ) (A)/(B) (A)/(C ) (A) (B) (A)/(B)
Gross Revenue 8,635 9,391 8,206 (8) 5 34,707 28,359 22
Net Revenue 7,188 7,328 6,513 (2) 10 27,829 22,647 23
Cost of Good Sold (5,992) (6,228) (5,648) (4) 6 (23,465) (19,425) 21
GrossProfit 1,196 1,099 865 9 38 4,364 3,222 35
Sell ing Expenses* (209) (196) (200) 7 5 (806) (737) 9
General and Administrative Expenses* (337) (266) (270) 26 25 (1,048) (842) 24
Other operating income (expenses) (26) (16) (357) 66 - (104) (214) (51)
Non Recurring Expenses Related to Fixed Assets 2 (5) (413) - - (11) (413) (97)
EBITDA 1,074 1,036 786 4 37 4,055 3,181 27
EBITDA Margin 14.9% 14.1% 12.1% 0.8 p.p. 2.9 p.p. 14.6% 14.0% 0.5 p.p.
Depreciation and Amortization 455 436 365 4 25 1,720 1,454 18
Cost 451 409 335 10 35 1,638 1,340 22
Included in SG&A 4 27 29 - (86) 82 114 (28)
* Net of Depreciation
Income Statement 4Q10 3Q10 4Q09 Change (%) Change (%) 2010 2009 Change (%)
CONSOLIDATED - Real (A) (B) (C ) (A)/(B) (A)/(C ) (A) (B) (A)/(B)
Gross Revenue 8,635 9,391 5,523 (8) 56 31,547 19,705 60
Net Revenue 7,188 7,328 4,540 (2) 58 25,495 16,136 58
Cost of Good Sold (5,992) (6,228) (3,827) (4) 57 (21,412) (13,530) 58
GrossProfit 1,196 1,099 713 9 68 4,083 2,606 57
Selling Expenses (209) (201) (157) 4 33 (719) (600) 20
General and Administrative Expenses (340) (287) (231) 18 47 (1,049) (711) 47
Business Combination - - (53) - - 975 102 856
Other Net Operating Income (expenses) (26) (16) (76) 66 - (96) 4 -
Investment in Subsidiary and Associated Companies (4) 9 9 - (150) 20 3 537
Operating Profit Before Financial Result 616 604 204 2 202 3,215 1,404 129
Net Financial Result (541) 180 (862) - (37) (1,328) 354 -
Profit (loss) Before Tax and Social Contribution 75 784 (658) (90) - 1,887 1,758 7
Income Tax / Social Contribution 282 (251) (716) (212) - 2 (1,360) -
Net Profit (loss) 356 532 (1,374) (33) - 1,889 398 374
Company's Shareholder 362 532 (1,374) (32) - 1,895 398 376
Non-controlling interests (6) 2 - (473) - (6) - -
356 534 (1,374) (33) - 1,889 398 374
Earnings (loss) Per Share 0.44 0.67 (2.64) (33) - 2.36 0.76 208

EXHIBIT III
Restatement of the Result
(R$ million)
4Q10 3Q10 4Q09 Change
(%)
Change
(%)
2010 2009 Change
(%)(A) (B) (C ) (A)/(B) (A)/(C ) (D) (E) (D)/(E)
Pro Forma EBITDA 1,074 1,036 786 4 37 4,055 3,181 27
Depreciation included in CoGS and SG&A (451) (409) (335) 10 35 (1,638) (1,340) 22
Pro Forma EBITDA Impact Elimination - - (99) - - (178) (440) (59)
Non-recurring expenses related to fixed assets considered
in other net operating income (expenses)2 (5) (103) - - (20) (103) (81)
Business combination - - (53) - - 975 102 856
Investment in subsidiaries and associated companies - 9 9 - - 20 3 537
Financial Result (802) 180 (862) - - (1,328) 354 -
Income Tax and Social Contribution - (251) (716) - - 2 (1,360) -
Net Income 356 532 (1,374) (33) - 1,889 398 374
EBITDA Restatement
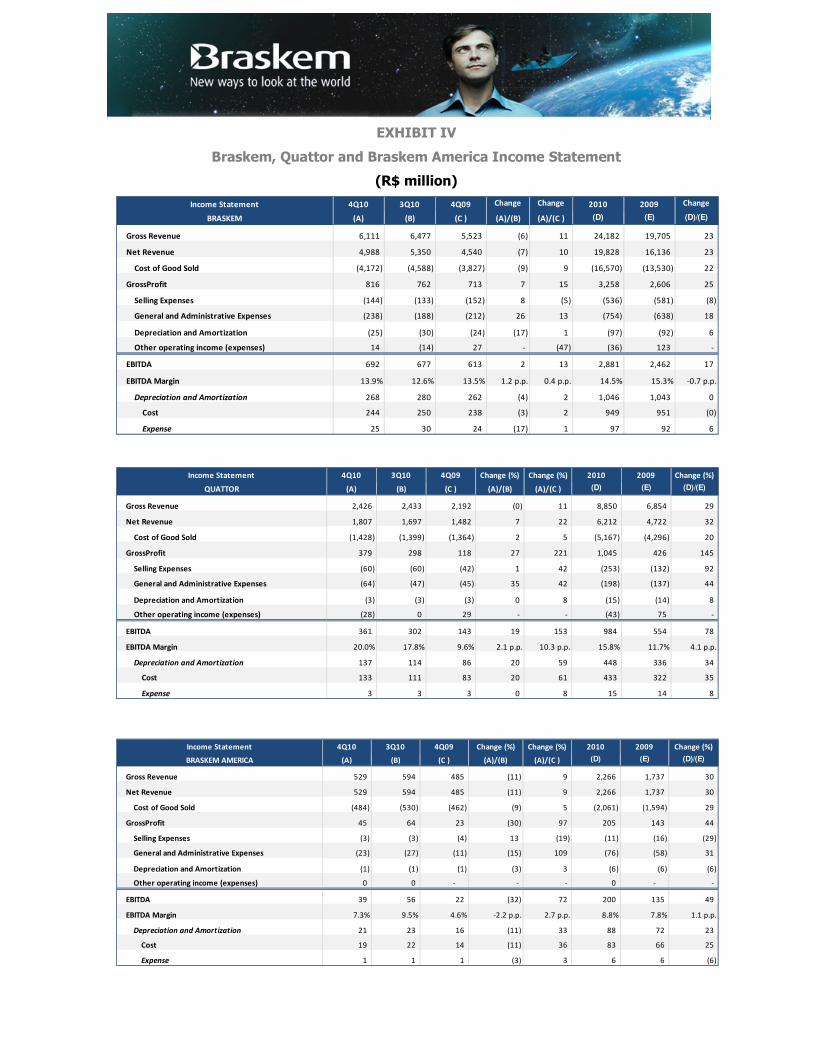
EXHIBIT IV
Braskem, Quattor and Braskem America Income Statement
(R$ million)
Income Statement 4Q10 3Q10 4Q09 Change
(%)
Change
(%)2010 2009 Change
(%)BRASKEM (A) (B) (C ) (A)/(B) (A)/(C ) (D) (E) (D)/(E)
Gross Revenue 6,111 6,477 5,523 (6) 11 24,182 19,705 23
Net Revenue 4,988 5,350 4,540 (7) 10 19,828 16,136 23
Cost of Good Sold (4,172) (4,588) (3,827) (9) 9 (16,570) (13,530) 22
GrossProfit 816 762 713 7 15 3,258 2,606 25
Selling Expenses (144) (133) (152) 8 (5) (536) (581) (8)
General and Administrative Expenses (238) (188) (212) 26 13 (754) (638) 18
Depreciation and Amortization (25) (30) (24) (17) 1 (97) (92) 6
Other operating income (expenses) 14 (14) 27 - (47) (36) 123 -
EBITDA 692 677 613 2 13 2,881 2,462 17
EBITDA Margin 13.9% 12.6% 13.5% 1.2 p.p. 0.4 p.p. 14.5% 15.3% -0.7 p.p.
Depreciation and Amortization 268 280 262 (4) 2 1,046 1,043 0
Cost 244 250 238 (3) 2 949 951 (0)
Expense 25 30 24 (17) 1 97 92 6
Income Statement 4Q10 3Q10 4Q09 Change (%) Change (%) 2010 2009 Change (%)
QUATTOR (A) (B) (C ) (A)/(B) (A)/(C ) (D) (E) (D)/(E)
Gross Revenue 2,426 2,433 2,192 (0) 11 8,850 6,854 29
Net Revenue 1,807 1,697 1,482 7 22 6,212 4,722 32
Cost of Good Sold (1,428) (1,399) (1,364) 2 5 (5,167) (4,296) 20
GrossProfit 379 298 118 27 221 1,045 426 145
Selling Expenses (60) (60) (42) 1 42 (253) (132) 92
General and Administrative Expenses (64) (47) (45) 35 42 (198) (137) 44
Depreciation and Amortization (3) (3) (3) 0 8 (15) (14) 8
Other operating income (expenses) (28) 0 29 - - (43) 75 -
EBITDA 361 302 143 19 153 984 554 78
EBITDA Margin 20.0% 17.8% 9.6% 2.1 p.p. 10.3 p.p. 15.8% 11.7% 4.1 p.p.
Depreciation and Amortization 137 114 86 20 59 448 336 34
Cost 133 111 83 20 61 433 322 35
Expense 3 3 3 0 8 15 14 8
Income Statement 4Q10 3Q10 4Q09 Change (%) Change (%) 2010 2009 Change (%)
BRASKEM AMERICA (A) (B) (C ) (A)/(B) (A)/(C ) (D) (E) (D)/(E)
Gross Revenue 529 594 485 (11) 9 2,266 1,737 30
Net Revenue 529 594 485 (11) 9 2,266 1,737 30
Cost of Good Sold (484) (530) (462) (9) 5 (2,061) (1,594) 29
GrossProfit 45 64 23 (30) 97 205 143 44
Selling Expenses (3) (3) (4) 13 (19) (11) (16) (29)
General and Administrative Expenses (23) (27) (11) (15) 109 (76) (58) 31
Depreciation and Amortization (1) (1) (1) (3) 3 (6) (6) (6)
Other operating income (expenses) 0 0 - - - 0 - -
EBITDA 39 56 22 (32) 72 200 135 49
EBITDA Margin 7.3% 9.5% 4.6% -2.2 p.p. 2.7 p.p. 8.8% 7.8% 1.1 p.p.
Depreciation and Amortization 21 23 16 (11) 33 88 72 23
Cost 19 22 14 (11) 36 83 66 25
Expense 1 1 1 (3) 3 6 6 (6)
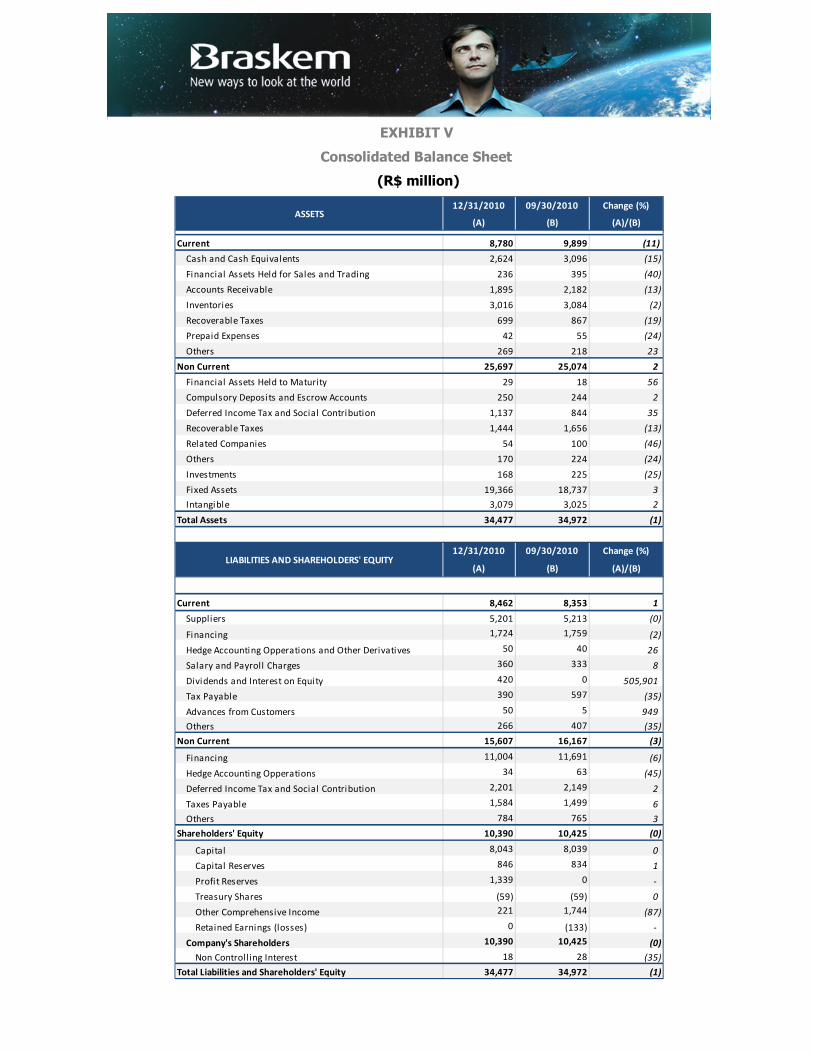
EXHIBIT V
Consolidated Balance Sheet
(R$ million)
12/31/2010 09/30/2010 Change (%)
(A) (B) (A)/(B)
Current 8,780 9,899 (11)
Cash and Cash Equivalents 2,624 3,096 (15)
Financial Assets Held for Sales and Trading 236 395 (40)
Accounts Receivable 1,895 2,182 (13)
Inventories 3,016 3,084 (2)
Recoverable Taxes 699 867 (19)
Prepaid Expenses 42 55 (24)
Others 269 218 23
Non Current 25,697 25,074 2
Financial Assets Held to Maturity 29 18 56
Compulsory Deposits and Escrow Accounts 250 244 2
Deferred Income Tax and Social Contribution 1,137 844 35
Recoverable Taxes 1,444 1,656 (13)
Related Companies 54 100 (46)
Others 170 224 (24)
Investments 168 225 (25)
Fixed Assets 19,366 18,737 3
Intangible 3,079 3,025 2
Total Assets 34,477 34,972 (1)
12/31/2010 09/30/2010 Change (%)
(A) (B) (A)/(B)
Current 8,462 8,353 1
Suppliers 5,201 5,213 (0)
Financing 1,724 1,759 (2)
Hedge Accounting Opperations and Other Derivatives 50 40 26
Salary and Payroll Charges 360 333 8
Dividends and Interest on Equity 420 0 505,901
Tax Payable 390 597 (35)
Advances from Customers 50 5 949
Others 266 407 (35)
Non Current 15,607 16,167 (3)
Financing 11,004 11,691 (6)
Hedge Accounting Opperations 34 63 (45)
Deferred Income Tax and Social Contribution 2,201 2,149 2
Taxes Payable 1,584 1,499 6
Others 784 765 3
Shareholders' Equity 10,390 10,425 (0)
Capital 8,043 8,039 0
Capital Reserves 846 834 1
Profit Reserves 1,339 0 -
Treasury Shares (59) (59) 0
Other Comprehensive Income 221 1,744 (87)
Retained Earnings (losses) 0 (133) -
Company's Shareholders 10,390 10,425 (0)
Non Controlling Interest 18 28 (35)
Total Liabilities and Shareholders' Equity 34,477 34,972 (1)
ASSETS
LIABILITIES AND SHAREHOLDERS' EQUITY

EXHIBIT VI
Braskem Balance Sheet
(R$ million)
12/31/2010 09/30/2010 Change (%)
(A) (B) (A)/(B)
Current 6,647 7,490 (11)
Cash and Cash Equivalents 2,461 2,848 (14)
Financial Assets Held for Sales and Trading 238 358 (34)
Accounts Receivable 1,177 1,233 (5)
Inventories 2,036 2,263 (10)
Recoverable Taxes 425 498 (15)
Associated Companies 112 102 9
Prepaid Expenses 29 39 (24)
Others 169 150 13
Non Current 25,014 23,575 6
Financial Assets Held to Maturity 29 18 56
Compulsory Deposits and Escrow Accounts 229 225 2
Deferred Income Tax and Social Contribution 444 479 (7)
Recoverable Taxes 1,102 1,206 (9)
Related Companies 2,476 2,309 7
Others 158 96 64
Investments 6,974 6,231 12
Fixed Assets 11,314 10,679 6
Intangible 2,287 2,330 (2)
Total Assets 31,660 31,064 2
12/31/2010 09/30/2010 Change (%)
(A) (B) (A)/(B)
Current 7,128 7,164 (1)
Suppliers 4,874 4,914 (1)
Financing 1,460 1,345 9
Hedge Accounting Opperations and Other Derivatives 36 40 (8)
Salary and Payroll Charges 266 242 10
Dividends and Interest on Equity 2 1 31
Tax Payable 255 336 (24)
Advances from Customers 46 43 8
Others 188 243 (23)
Non Current 13,678 13,242 3
Financing 9,673 9,514 2
Hedge Accounting Opperations 34 63 (45)
Deferred Income Tax and Social Contribution 1,856 1,836 1
Taxes Payable 1,450 1,308 11
Others 663 522 27
Shareholders' Equity 10,854 10,658 2
Capital 8,043 8,039 0
Capital Reserves 846 846 -
Treasury Shares (10) (10) 0
Other Comprehensive Income 2,117 1,781 19
Retained Earnings (losses) (141) 2 -
Company's Shareholders 10,854 10,658 2
Total Liabilities and Shareholders' Equity 31,660 31,064 2
ASSETS
LIABILITIES AND SHAREHOLDERS' EQUITY
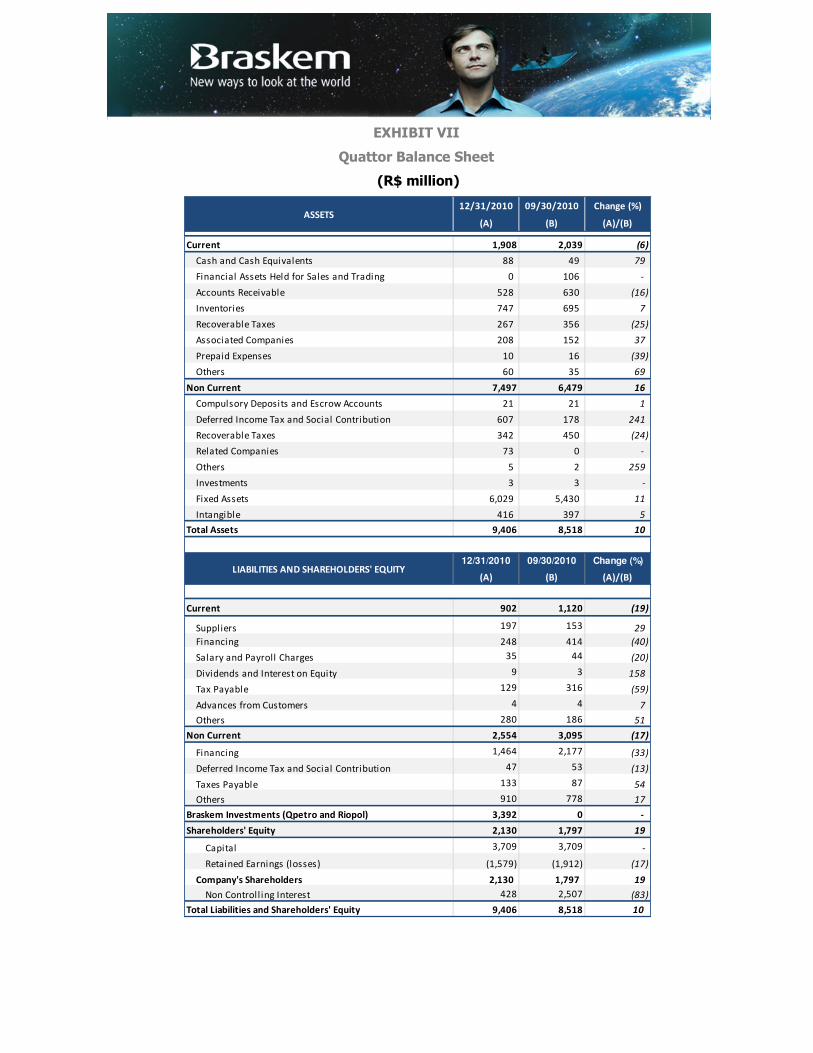
EXHIBIT VII
Quattor Balance Sheet
(R$ million)
12/31/2010 09/30/2010 Change (%)
(A) (B) (A)/(B)
Current 1,908 2,039 (6)
Cash and Cash Equivalents 88 49 79
Financial Assets Held for Sales and Trading 0 106 -
Accounts Receivable 528 630 (16)
Inventories 747 695 7
Recoverable Taxes 267 356 (25)
Associated Companies 208 152 37
Prepaid Expenses 10 16 (39)
Others 60 35 69
Non Current 7,497 6,479 16
Compulsory Deposits and Escrow Accounts 21 21 1
Deferred Income Tax and Social Contribution 607 178 241
Recoverable Taxes 342 450 (24)
Related Companies 73 0 -
Others 5 2 259
Investments 3 3 -
Fixed Assets 6,029 5,430 11
Intangible 416 397 5
Total Assets 9,406 8,518 10
12/31/2010 09/30/2010 Change (%)
(A) (B) (A)/(B)
Current 902 1,120 (19)
Suppliers 197 153 29
Financing 248 414 (40)
Salary and Payroll Charges 35 44 (20)
Dividends and Interest on Equity 9 3 158
Tax Payable 129 316 (59)
Advances from Customers 4 4 7
Others 280 186 51
Non Current 2,554 3,095 (17)
Financing 1,464 2,177 (33)
Deferred Income Tax and Social Contribution 47 53 (13)
Taxes Payable 133 87 54
Others 910 778 17
Braskem Investments (Qpetro and Riopol) 3,392 0 -
Shareholders' Equity 2,130 1,797 19
Capital 3,709 3,709 -
Retained Earnings (losses) (1,579) (1,912) (17)
Company's Shareholders 2,130 1,797 19
Non Controll ing Interest 428 2,507 (83)
Total Liabilities and Shareholders' Equity 9,406 8,518 10
ASSETS
LIABILITIES AND SHAREHOLDERS' EQUITY

EXHIBIT VIII
Braskem America Balance Sheet
(R$ million)
12/31/2010 09/30/2010 Change (%)
(A) (B) (A)/(B)
Current 470 522 (10)
Cash and Cash Equivalents 31 63 (50)
Accounts Receivable 216 260 (17)
Inventories 215 198 9
Others 7 0 2,059
Non Current 835 850 (2)
Others 8.162 9.624 (15)
Fixed Assets 577 584 (1)
Intangible 250 256 (2)
Total Assets 1,304 1,372 (5)
12/31/2010 09/30/2010 Change (%)
(A) (B) (A)/(B)
Current 251 318 (21)
Suppliers 148 180 (18)
Financing 17 0 -
Salary and Payroll Charges 19 16 18
Tax Payable 5 4 26
Others 64 119 (47)
Non Current 315 318 (1)
Deferred Income Tax and Social Contribution 298 300 (1)
Others 17 18 (5)
Shareholders' Equity 738 735 0
Capital 623 623 -
Other Comprehensive Income (45) (34) 34
Retained Earnings (losses) 161 146 10
Company's Shareholders 738 735 0
Total Liabilities and Shareholders' Equity 1,304 1,372 (5)
ASSETS
LIABILITIES AND SHAREHOLDERS' EQUITY
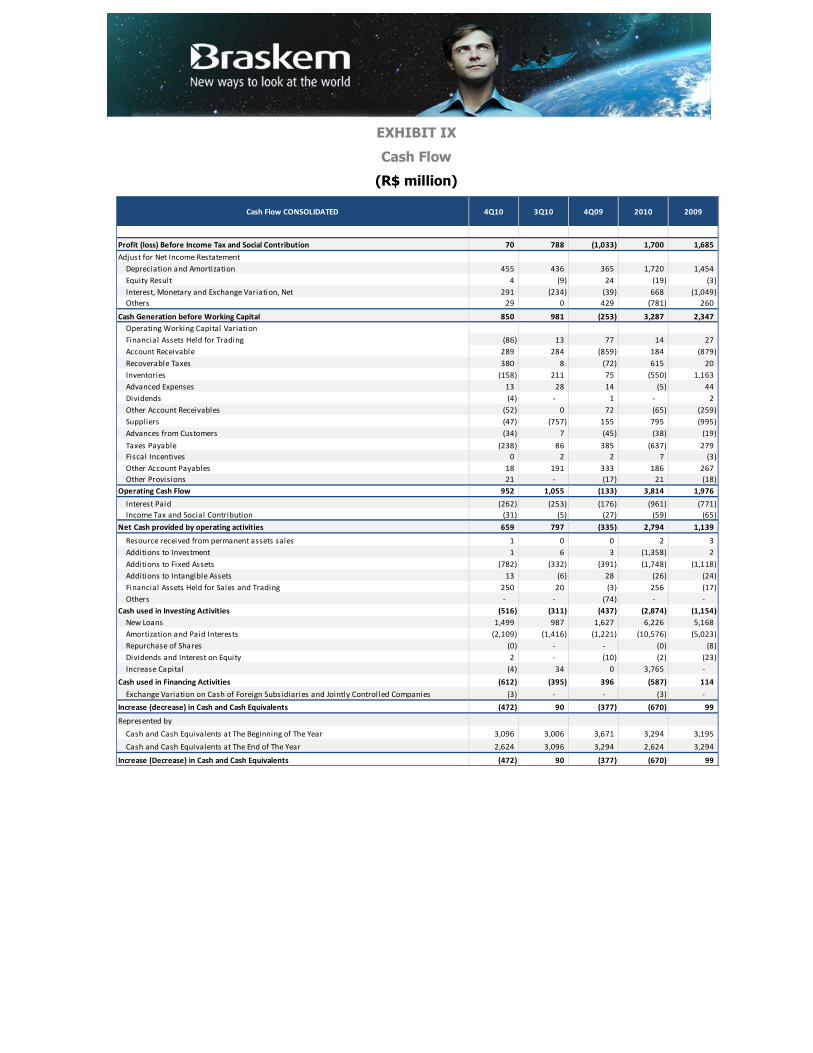
EXHIBIT IX
Cash Flow
(R$ million)
Cash Flow CONSOLIDATED 4Q10 3Q10 4Q09 2010 2009
Profit (loss) Before Income Tax and Social Contribution 70 788 (1,033) 1,700 1,685
Adjust for Net Income Restatement
Depreciation and Amortization 455 436 365 1,720 1,454
Equity Result 4 (9) 24 (19) (3)
Interest, Monetary and Exchange Variation, Net 291 (234) (39) 668 (1,049)
Others 29 0 429 (781) 260
Cash Generation before Working Capital 850 981 (253) 3,287 2,347
Operating Working Capital Variation
Financial Assets Held for Trading (86) 13 77 14 27
Account Receivable 289 284 (859) 184 (879)
Recoverable Taxes 380 8 (72) 615 20
Inventories (158) 211 75 (550) 1,163
Advanced Expenses 13 28 14 (5) 44
Dividends (4) - 1 - 2
Other Account Receivables (52) 0 72 (65) (259)
Suppl iers (47) (757) 155 795 (995)
Advances from Customers (34) 7 (45) (38) (19)
Taxes Payable (238) 86 385 (637) 279
Fiscal Incentives 0 2 2 7 (3)
Other Account Payables 18 191 333 186 267
Other Provisions 21 - (17) 21 (18)
Operating Cash Flow 952 1,055 (133) 3,814 1,976
Interest Paid (262) (253) (176) (961) (771)
Income Tax and Social Contribution (31) (5) (27) (59) (65)
Net Cash provided by operating activities 659 797 (335) 2,794 1,139
Resource received from permanent assets sales 1 0 0 2 3
Additions to Investment 1 6 3 (1,358) 2
Additions to Fixed Assets (782) (332) (391) (1,748) (1,118)
Additions to Intangible Assets 13 (6) 28 (26) (24)
Financial Assets Held for Sales and Trading 250 20 (3) 256 (17)
Others - - (74) - -
Cash used in Investing Activities (516) (311) (437) (2,874) (1,154)
New Loans 1,499 987 1,627 6,226 5,168
Amortization and Paid Interests (2,109) (1,416) (1,221) (10,576) (5,023)
Repurchase of Shares (0) - - (0) (8)
Dividends and Interest on Equity 2 - (10) (2) (23)
Increase Capital (4) 34 0 3,765 -
Cash used in Financing Activities (612) (395) 396 (587) 114
Exchange Variation on Cash of Foreign Subsidiaries and Jointly Control led Companies (3) - - (3) -
Increase (decrease) in Cash and Cash Equivalents (472) 90 (377) (670) 99
Represented by
Cash and Cash Equivalents at The Beginning of The Year 3,096 3,006 3,671 3,294 3,195
Cash and Cash Equivalents at The End of The Year 2,624 3,096 3,294 2,624 3,294
Increase (Decrease) in Cash and Cash Equivalents (472) 90 (377) (670) 99
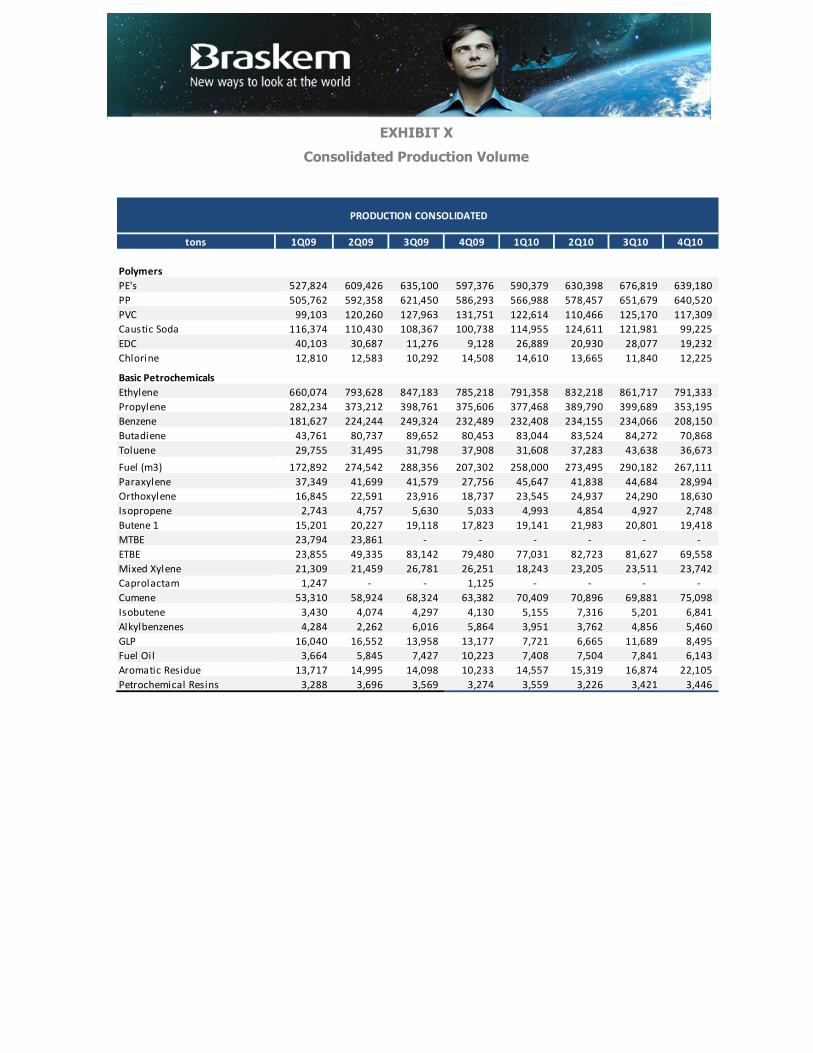
EXHIBIT X
Consolidated Production Volume
tons 1Q09 2Q09 3Q09 4Q09 1Q10 2Q10 3Q10 4Q10
Polymers
PE's 527,824 609,426 635,100 597,376 590,379 630,398 676,819 639,180
PP 505,762 592,358 621,450 586,293 566,988 578,457 651,679 640,520
PVC 99,103 120,260 127,963 131,751 122,614 110,466 125,170 117,309
Caustic Soda 116,374 110,430 108,367 100,738 114,955 124,611 121,981 99,225
EDC 40,103 30,687 11,276 9,128 26,889 20,930 28,077 19,232
Chlorine 12,810 12,583 10,292 14,508 14,610 13,665 11,840 12,225
Basic Petrochemicals
Ethylene 660,074 793,628 847,183 785,218 791,358 832,218 861,717 791,333
Propylene 282,234 373,212 398,761 375,606 377,468 389,790 399,689 353,195
Benzene 181,627 224,244 249,324 232,489 232,408 234,155 234,066 208,150
Butadiene 43,761 80,737 89,652 80,453 83,044 83,524 84,272 70,868
Toluene 29,755 31,495 31,798 37,908 31,608 37,283 43,638 36,673
Fuel (m3) 172,892 274,542 288,356 207,302 258,000 273,495 290,182 267,111
Paraxylene 37,349 41,699 41,579 27,756 45,647 41,838 44,684 28,994
Orthoxylene 16,845 22,591 23,916 18,737 23,545 24,937 24,290 18,630
Isopropene 2,743 4,757 5,630 5,033 4,993 4,854 4,927 2,748
Butene 1 15,201 20,227 19,118 17,823 19,141 21,983 20,801 19,418
MTBE 23,794 23,861 - - - - - -
ETBE 23,855 49,335 83,142 79,480 77,031 82,723 81,627 69,558
Mixed Xylene 21,309 21,459 26,781 26,251 18,243 23,205 23,511 23,742
Caprolactam 1,247 - - 1,125 - - - -
Cumene 53,310 58,924 68,324 63,382 70,409 70,896 69,881 75,098
Isobutene 3,430 4,074 4,297 4,130 5,155 7,316 5,201 6,841
Alkylbenzenes 4,284 2,262 6,016 5,864 3,951 3,762 4,856 5,460
GLP 16,040 16,552 13,958 13,177 7,721 6,665 11,689 8,495
Fuel Oi l 3,664 5,845 7,427 10,223 7,408 7,504 7,841 6,143
Aromatic Residue 13,717 14,995 14,098 10,233 14,557 15,319 16,874 22,105
Petrochemical Resins 3,288 3,696 3,569 3,274 3,559 3,226 3,421 3,446
PRODUCTION CONSOLIDATED

EXHIBIT XI
Braskem Production Volume and Capacity Utilization Rate
tons 1Q09 2Q09 3Q09 4Q09 1Q10 2Q10 3Q10 4Q10
Polymers
PE's 357,694 459,500 471,434 451,843 417,100 433,245 457,359 401,615
PP 178,877 227,733 257,904 235,455 224,544 217,331 260,749 260,105
PVC 99,103 120,260 127,963 131,751 122,614 110,466 125,170 117,309
Caustic Soda 116,374 110,430 108,367 100,738 114,955 124,611 121,981 99,225
EDC 40,103 30,687 11,276 9,128 26,889 20,930 28,077 19,232
Chlorine 12,810 12,583 10,292 14,508 14,610 13,665 11,840 12,225
Basic Petrochemicals
Ethylene 454,369 588,998 620,193 592,402 566,800 580,439 587,784 502,506
Propylene 216,137 297,865 315,866 303,611 293,062 298,372 302,813 256,973
Benzene 129,037 165,770 187,051 177,424 173,228 171,614 171,671 139,504
Butadiene 36,311 66,375 70,294 63,561 63,906 64,059 65,057 50,104
Toluene 25,335 25,191 26,870 34,526 27,268 24,385 29,073 27,343
Fuel (m3) 116,052 200,734 214,156 150,784 194,667 206,245 222,683 195,297
Paraxylene 37,349 41,699 41,579 27,756 45,647 41,838 44,684 28,994
Orthoxylene 12,053 14,896 15,022 11,303 17,569 15,594 15,168 10,879
Isopropene 2,743 4,757 5,630 5,033 4,993 4,854 4,927 2,748
Butene 1 15,201 20,227 19,118 17,823 19,141 21,983 20,801 19,418
MTBE 23,794 23,861 - - - - - -
ETBE 23,855 49,335 83,142 79,480 77,031 82,723 81,627 69,558
Mixed Xylene 16,270 14,237 19,182 18,121 11,832 14,851 18,702 15,313
Caprolactam 1,247 - - 1,125 - - - -
PRODUCTION BRASKEM
Utilization Rate (%)
BRASKEM
4Q10
(A)
3Q10
(B)
4Q09
(C)
Change
(A)/(B)
Change
(A)/(C)
Ethylene 79% 92% 93% -13.4 p.p. -14.1 p.p.
PE´s 80% 91% 90% -11.1 p.p. -10.0 p.p.
PP 99% 99% 90% -0.2 p.p. 9.4 p.p.
PVC 91% 97% 99% -6.1 p.p. -7.7 p.p.

EXHIBIT XII
Quattor and Braskem America Production Volume and Capacity Utilization Rate
tons 1Q09 2Q09 3Q09 4Q09 1Q10 2Q10 3Q10 4Q10
Polymers
PE's 170,131 149,926 163,666 145,533 173,279 197,153 219,460 237,564
PP 134,533 148,645 170,838 131,547 164,007 142,291 157,165 171,429
Petroquímicos Básicos
Ethylene 205,704 204,630 226,991 192,815 224,557 251,778 273,933 288,827
Propylene 66,097 75,347 82,895 71,995 84,406 91,418 96,877 96,222
Benzene 52,590 58,474 62,273 55,065 59,180 62,540 62,395 68,646
Cumene 53,310 58,924 68,324 63,382 70,409 70,896 69,881 75,098
Butadiene 7,450 14,362 19,358 16,892 19,139 19,465 19,215 20,764
Isobutene 3,430 4,074 4,297 4,130 5,155 7,316 5,201 6,841
Toluene 4,420 6,304 4,928 3,382 4,340 12,899 14,566 9,330
Fuel (m3) 56,840 73,808 74,200 56,517 63,332 67,250 67,499 71,814
Alkylbenzenes 4,284 2,262 6,016 5,864 3,951 3,762 4,856 5,460
Mixed Xylene 5,039 7,222 7,599 8,130 6,411 8,354 4,809 8,430
Orthoxylene 4,792 7,695 8,894 7,434 5,976 9,342 9,122 7,751
GLP 16,040 16,552 13,958 13,177 7,721 6,665 11,689 8,495
Fuel Oil 3,664 5,845 7,427 10,223 7,408 7,504 7,841 6,143
Aromatic Residue 13,717 14,995 14,098 10,233 14,557 15,319 16,874 22,105
Petrochemical Resins 3,288 3,696 3,569 3,274 3,559 3,226 3,421 3,446
PRODUCTION QUATTOR
Utilization Rate (%)
QUATTOR
4Q10
(A)
3Q10
(B)
4Q09
(C)
Change
(A)/(B)
Change
(A)/(C)
Ethylene 94% 89% 63% 4.8 p.p. 31.2 p.p.
PE´s 91% 84% 56% 6.9 p.p. 35.1 p.p.
PP 78% 71% 60% 6.5 p.p. 18.1 p.p.
tons 1Q09 2Q09 3Q09 4Q09 1Q10 2Q10 3Q10 4Q10
Polymers
PP 192,352 215,979 192,708 219,291 178,437 218,834 233,765 208,986
PRODUCTION BRASKEM AMERICA
Utilization Rate (%)
BRASKEM AMERICA
4Q10
(A)
3Q10
(B)
4Q09
(C)
Change
(A)/(B)
Change
(A)/(C)
PP 87% 98% 92% -10.4 p.p. -4.3 p.p.
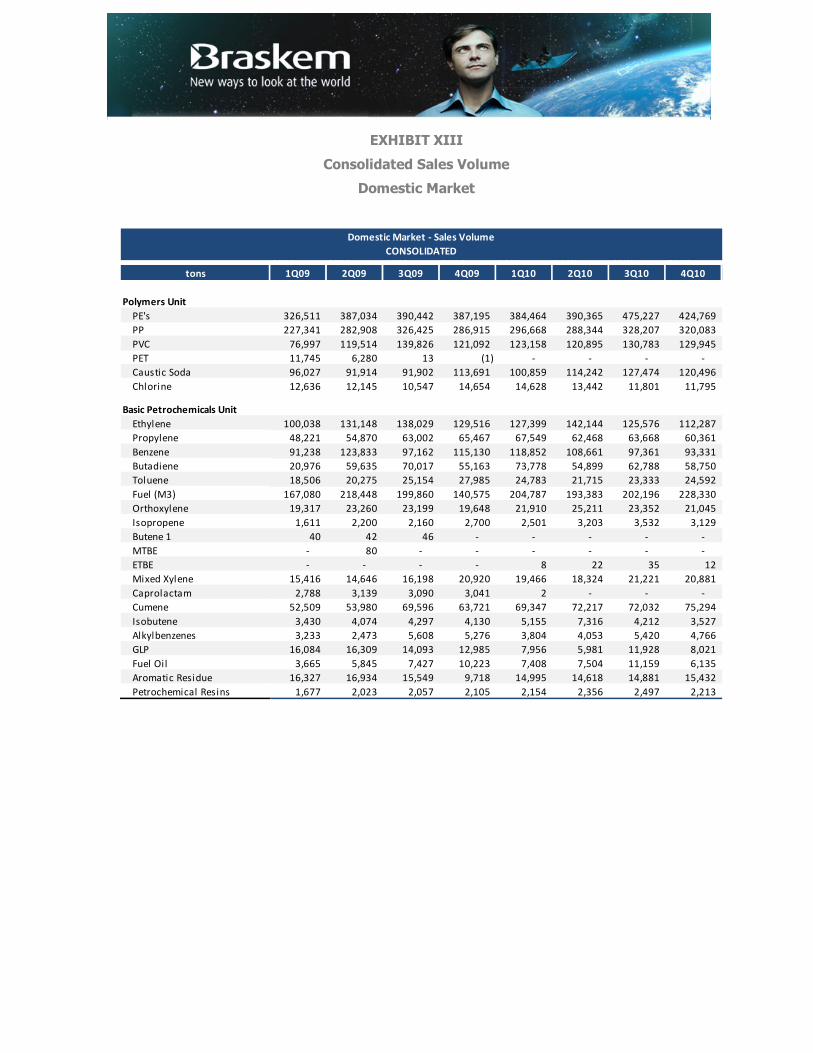
EXHIBIT XIII
Consolidated Sales Volume
Domestic Market
1t09 2t09 3T09 4T09 1T10 2T10 3T10 4T10
tons 1Q09 2Q09 3Q09 4Q09 1Q10 2Q10 3Q10 4Q10
Polymers Unit
PE's 326,511 387,034 390,442 387,195 384,464 390,365 475,227 424,769
PP 227,341 282,908 326,425 286,915 296,668 288,344 328,207 320,083
PVC 76,997 119,514 139,826 121,092 123,158 120,895 130,783 129,945
PET 11,745 6,280 13 (1) - - - -
Caustic Soda 96,027 91,914 91,902 113,691 100,859 114,242 127,474 120,496
Chlorine 12,636 12,145 10,547 14,654 14,628 13,442 11,801 11,795
Basic Petrochemicals Unit
Ethylene 100,038 131,148 138,029 129,516 127,399 142,144 125,576 112,287
Propylene 48,221 54,870 63,002 65,467 67,549 62,468 63,668 60,361
Benzene 91,238 123,833 97,162 115,130 118,852 108,661 97,361 93,331
Butadiene 20,976 59,635 70,017 55,163 73,778 54,899 62,788 58,750
Toluene 18,506 20,275 25,154 27,985 24,783 21,715 23,333 24,592
Fuel (M3) 167,080 218,448 199,860 140,575 204,787 193,383 202,196 228,330
Orthoxylene 19,317 23,260 23,199 19,648 21,910 25,211 23,352 21,045
Isopropene 1,611 2,200 2,160 2,700 2,501 3,203 3,532 3,129
Butene 1 40 42 46 - - - - -
MTBE - 80 - - - - - -
ETBE - - - - 8 22 35 12
Mixed Xylene 15,416 14,646 16,198 20,920 19,466 18,324 21,221 20,881
Caprolactam 2,788 3,139 3,090 3,041 2 - - -
Cumene 52,509 53,980 69,596 63,721 69,347 72,217 72,032 75,294
Isobutene 3,430 4,074 4,297 4,130 5,155 7,316 4,212 3,527
Alkylbenzenes 3,233 2,473 5,608 5,276 3,804 4,053 5,420 4,766
GLP 16,084 16,309 14,093 12,985 7,956 5,981 11,928 8,021
Fuel Oil 3,665 5,845 7,427 10,223 7,408 7,504 11,159 6,135
Aromatic Residue 16,327 16,934 15,549 9,718 14,995 14,618 14,881 15,432
Petrochemical Resins 1,677 2,023 2,057 2,105 2,154 2,356 2,497 2,213
Domestic Market - Sales Volume
CONSOLIDATED
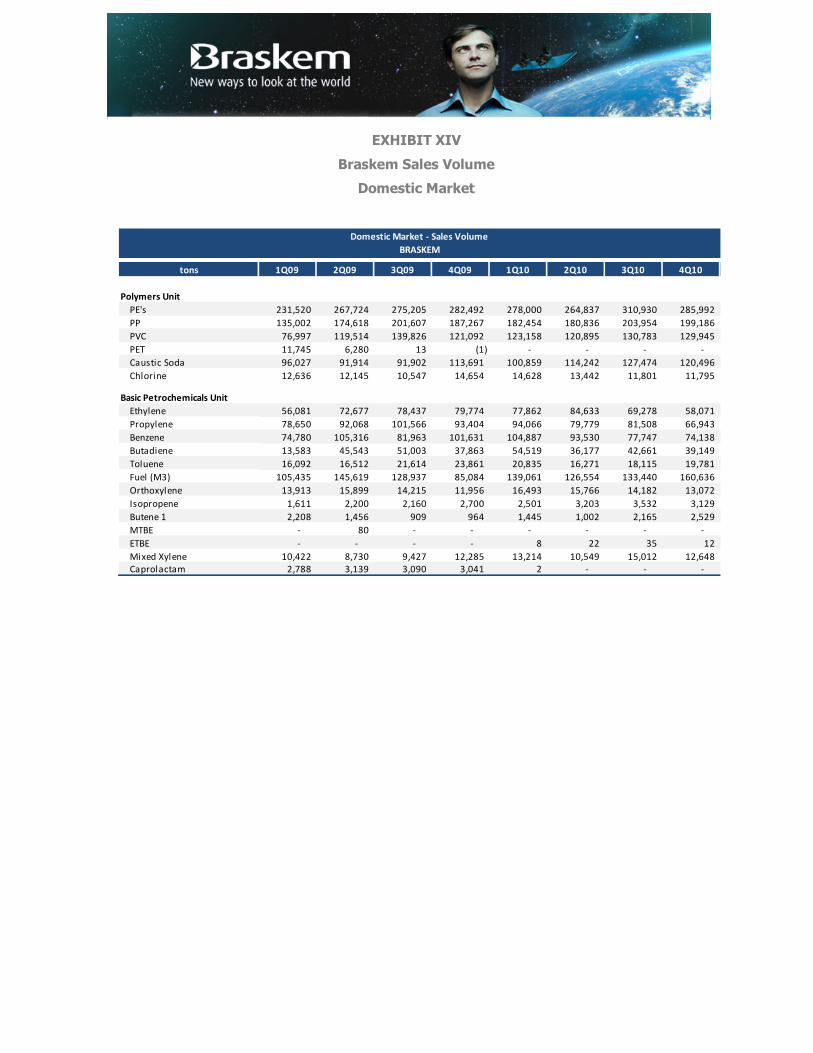
EXHIBIT XIV
Braskem Sales Volume
Domestic Market
1t09 2t09 3T09 4T09 1T10 2T10 3T10 4T10
tons 1Q09 2Q09 3Q09 4Q09 1Q10 2Q10 3Q10 4Q10
Polymers Unit
PE's 231,520 267,724 275,205 282,492 278,000 264,837 310,930 285,992
PP 135,002 174,618 201,607 187,267 182,454 180,836 203,954 199,186
PVC 76,997 119,514 139,826 121,092 123,158 120,895 130,783 129,945
PET 11,745 6,280 13 (1) - - - -
Caustic Soda 96,027 91,914 91,902 113,691 100,859 114,242 127,474 120,496
Chlorine 12,636 12,145 10,547 14,654 14,628 13,442 11,801 11,795
Basic Petrochemicals Unit
Ethylene 56,081 72,677 78,437 79,774 77,862 84,633 69,278 58,071
Propylene 78,650 92,068 101,566 93,404 94,066 79,779 81,508 66,943
Benzene 74,780 105,316 81,963 101,631 104,887 93,530 77,747 74,138
Butadiene 13,583 45,543 51,003 37,863 54,519 36,177 42,661 39,149
Toluene 16,092 16,512 21,614 23,861 20,835 16,271 18,115 19,781
Fuel (M3) 105,435 145,619 128,937 85,084 139,061 126,554 133,440 160,636
Orthoxylene 13,913 15,899 14,215 11,956 16,493 15,766 14,182 13,072
Isopropene 1,611 2,200 2,160 2,700 2,501 3,203 3,532 3,129
Butene 1 2,208 1,456 909 964 1,445 1,002 2,165 2,529
MTBE - 80 - - - - - -
ETBE - - - - 8 22 35 12
Mixed Xylene 10,422 8,730 9,427 12,285 13,214 10,549 15,012 12,648
Caprolactam 2,788 3,139 3,090 3,041 2 - - -
Domestic Market - Sales Volume
BRASKEM
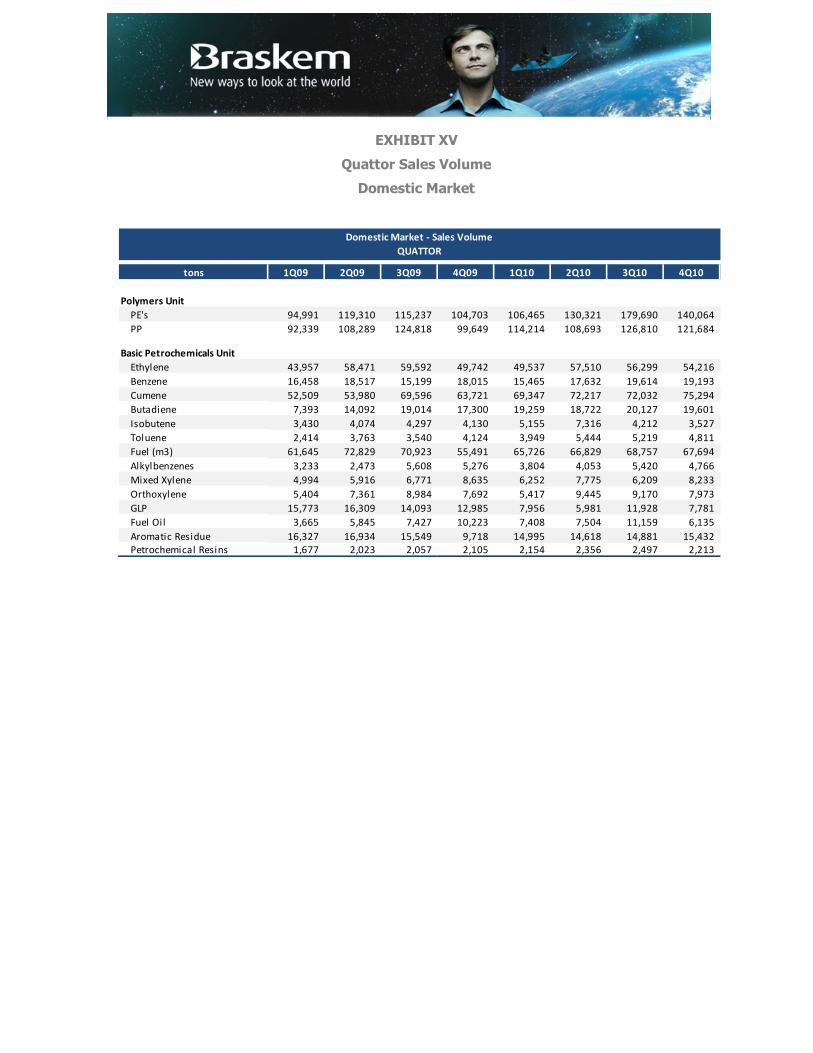
EXHIBIT XV
Quattor Sales Volume
Domestic Market
tons 1Q09 2Q09 3Q09 4Q09 1Q10 2Q10 3Q10 4Q10
Polymers Unit
PE's 94,991 119,310 115,237 104,703 106,465 130,321 179,690 140,064
PP 92,339 108,289 124,818 99,649 114,214 108,693 126,810 121,684
Basic Petrochemicals Unit
Ethylene 43,957 58,471 59,592 49,742 49,537 57,510 56,299 54,216
Benzene 16,458 18,517 15,199 18,015 15,465 17,632 19,614 19,193
Cumene 52,509 53,980 69,596 63,721 69,347 72,217 72,032 75,294
Butadiene 7,393 14,092 19,014 17,300 19,259 18,722 20,127 19,601
Isobutene 3,430 4,074 4,297 4,130 5,155 7,316 4,212 3,527
Toluene 2,414 3,763 3,540 4,124 3,949 5,444 5,219 4,811
Fuel (m3) 61,645 72,829 70,923 55,491 65,726 66,829 68,757 67,694
Alkylbenzenes 3,233 2,473 5,608 5,276 3,804 4,053 5,420 4,766
Mixed Xylene 4,994 5,916 6,771 8,635 6,252 7,775 6,209 8,233
Orthoxylene 5,404 7,361 8,984 7,692 5,417 9,445 9,170 7,973
GLP 15,773 16,309 14,093 12,985 7,956 5,981 11,928 7,781
Fuel Oil 3,665 5,845 7,427 10,223 7,408 7,504 11,159 6,135
Aromatic Residue 16,327 16,934 15,549 9,718 14,995 14,618 14,881 15,432
Petrochemical Resins 1,677 2,023 2,057 2,105 2,154 2,356 2,497 2,213
Domestic Market - Sales Volume
QUATTOR

EXHIBIT XVI
Consolidated Sales Volume
Export Market and North America
tons 1Q09 2Q09 3Q09 4Q09 1Q10 2Q10 3Q10 4Q10
Polymers Unit
PE's 244,808 261,762 204,104 229,040 186,982 177,232 241,935 217,179
PP 322,029 322,543 294,898 320,697 267,055 261,276 328,477 314,017
PVC 25,813 14,000 300 149 - 73 48 73
PET 275 14,549 - - - - - -
Caustic Soda - 7,480 - - 1,003 4,898 - -
EDC 38,601 39,697 13,000 - 26,026 24,302 25,908 12,986
Basic Petrochemicals Unit
Ethylene - - - - - - 6,079 3,774
Propylene 16,895 47,898 33,577 53,118 37,257 53,256 41,197 28,688
Benzene 57,585 51,440 100,306 66,365 75,566 75,193 81,850 61,288
Butadiene 20,292 22,946 21,618 22,939 13,617 23,742 23,692 16,840
Toluene 13,364 12,193 9,533 9,659 3,324 9,649 30,801 6,779
Fuel (M3) 9,318 27,954 35,083 16,151 9,246 28,992 17,424 987
Paraxylene 36,101 46,948 36,439 25,732 47,988 47,238 45,905 31,282
Isopropene 840 2,518 3,355 1,683 2,359 1,681 1,600 48
Butene 1 5,920 7,858 9,520 9,524 6,732 14,413 7,345 6,119
MTBE 18,691 31,949 764 - - - - -
ETBE 23,223 46,139 70,793 95,464 62,749 80,302 81,709 70,073
Mixed Xylene 4,883 4,226 17,461 2,469 318 4,067 3,370 4,906
Caprolactam 72 1,056 - - - - - -
Isobutene - - - - - - - 3,001
Petrochemical Resins 716 1,138 1,522 1,902 1,998 1,639 987 787
Export Market - Sales Volume
CONSOLIDATED

EXHIBIT XVII
Braskem Sales Volume
Export Market
tons 1Q09 2Q09 3Q09 4Q09 1Q10 2Q10 3Q10 4Q10
Polymers Unit
PE's 167,666 207,424 170,270 175,022 166,152 134,906 184,939 143,658
PP 67,924 49,912 56,509 54,018 42,429 28,338 61,814 60,102
PVC 25,813 14,000 300 149 - 73 48 73
PET 275 14,549 - - - - - -
Caustic Soda - 7,480 - - 1,003 4,898 - -
EDC 38,601 39,697 13,000 - 26,026 24,302 25,908 12,986
Basic Petrochemicals Unit
Ethylene - - - - - - 6,079 3,774
Propylene 16,895 47,898 33,577 53,118 37,257 53,256 41,197 28,688
Benzene 57,585 51,440 97,434 66,365 75,566 75,193 81,850 61,288
Butadiene 20,292 22,946 21,618 22,939 13,617 23,742 23,692 16,840
Toluene 13,364 9,064 7,568 9,659 3,324 9,649 15,873 2,273
Fuel (M3) 9,318 26,738 33,972 16,151 9,246 28,992 17,424 987
Paraxylene 36,101 46,948 36,439 25,732 47,988 47,238 45,905 31,282
Isopropene 840 2,518 3,355 1,683 2,359 1,681 1,600 48
Butene 1 5,920 7,858 9,520 9,524 6,732 14,413 7,345 6,119
MTBE 18,691 31,949 764 - - - - -
ETBE 23,223 46,139 70,793 95,464 62,749 80,302 81,709 70,073
Mixed Xylene 4,883 4,226 14,713 2,469 318 4,067 3,370 4,906
Caprolactam 72 1,056 - - - - - -
Export Market - Sales Volume
BRASKEM

EXHIBIT XVIII
Quattor and Braskem America Sales Volume – Export Market
tons 1Q09 2Q09 3Q09 4Q09 1Q10 2Q10 3Q10 4Q10
Polymers Unit
PE's 77,141 54,338 33,834 54,018 20,830 42,326 56,996 73,522
PP 49,758 54,423 43,508 45,440 24,379 30,497 38,709 44,462
Basic Petrochemicals Unit
Benzene - - 2,872 - - - - -
Isobutene - - - - - - - 3,001
Toluene - 3,129 1,965 - - - 14,929 4,507
Fuel (m3) - 1,216 1,111 - - - - -
Mixed Xylene - - 2,748 - - - - -
Petrochemical Resins 716 1,138 1,522 1,902 1,998 1,639 987 787
Export Market - Sales Volume
QUATTOR
tons 1Q09 2Q09 3Q09 4Q09 1Q10 2Q10 3Q10 4Q10
Polymers Unit
PP 204,348 218,208 194,882 221,239 200,247 202,441 227,954 209,453
North America - Sales Volume
BRASKEM AMERICA
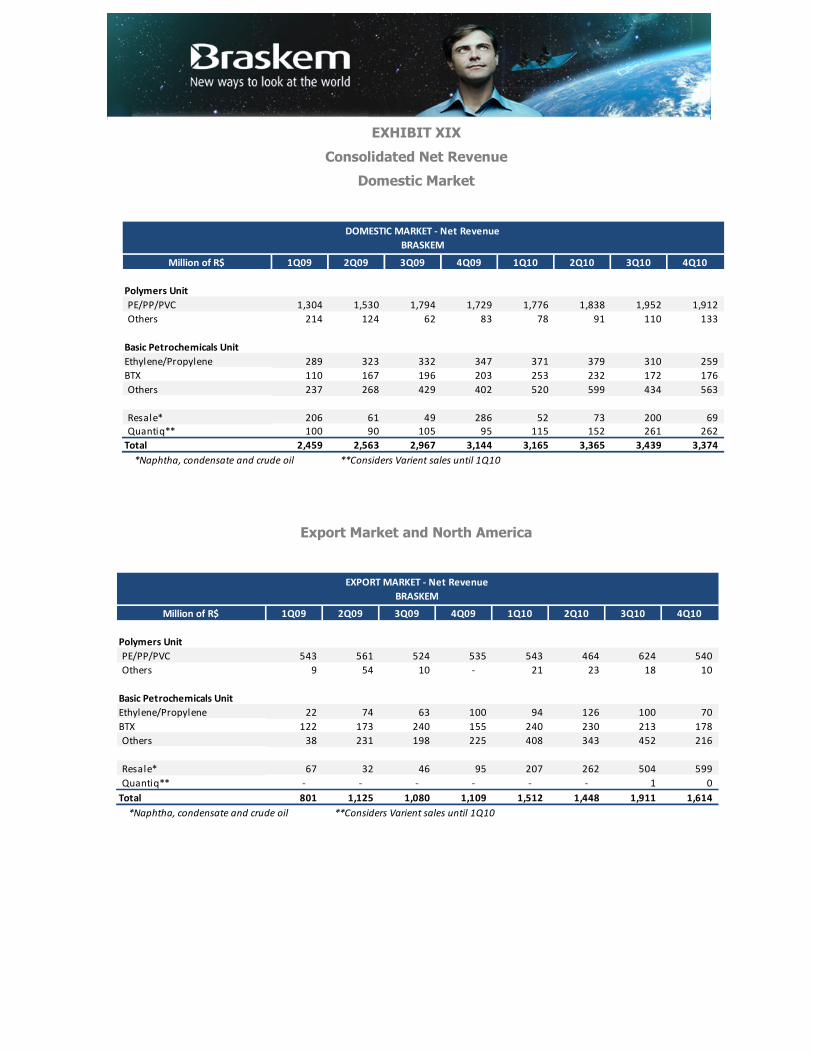
EXHIBIT XIX
Consolidated Net Revenue
Domestic Market
Export Market and North America
Million of R$ 1Q09 2Q09 3Q09 4Q09 1Q10 2Q10 3Q10 4Q10
Polymers Unit
PE/PP/PVC 1,304 1,530 1,794 1,729 1,776 1,838 1,952 1,912
Others 214 124 62 83 78 91 110 133
Basic Petrochemicals Unit
Ethylene/Propylene 289 323 332 347 371 379 310 259
BTX 110 167 196 203 253 232 172 176
Others 237 268 429 402 520 599 434 563
Resale* 206 61 49 286 52 73 200 69
Quantiq** 100 90 105 95 115 152 261 262
Total 2,459 2,563 2,967 3,144 3,165 3,365 3,439 3,374
*Naphtha, condensate and crude oil **Considers Varient sales until 1Q10
DOMESTIC MARKET - Net Revenue
BRASKEM
Million of R$ 1Q09 2Q09 3Q09 4Q09 1Q10 2Q10 3Q10 4Q10
Polymers Unit
PE/PP/PVC 543 561 524 535 543 464 624 540
Others 9 54 10 - 21 23 18 10
Basic Petrochemicals Unit
Ethylene/Propylene 22 74 63 100 94 126 100 70
BTX 122 173 240 155 240 230 213 178
Others 38 231 198 225 408 343 452 216
Resale* 67 32 46 95 207 262 504 599
Quantiq** - - - - - - 1 0
Total 801 1,125 1,080 1,109 1,512 1,448 1,911 1,614
*Naphtha, condensate and crude oil **Considers Varient sales until 1Q10
EXPORT MARKET - Net Revenue
BRASKEM

EXHIBIT XX
Braskem Net Revenue
Domestic Market
Export Market
Million of R$ 1Q09 2Q09 3Q09 4Q09 1Q10 2Q10 3Q10 4Q10
Polymers Unit
PE/PP/PVC 1,304 1,530 1,794 1,729 1,776 1,838 1,952 1,912
Others 214 124 62 83 78 91 110 133
Basic Petrochemicals Unit
Ethylene/Propylene 289 323 332 347 371 379 310 259
BTX 110 167 196 203 253 232 172 176
Others 237 268 429 402 520 599 434 563
Resale* 206 61 49 286 52 73 200 69
Quantiq** 100 90 105 95 115 152 261 262
Total 2,459 2,563 2,967 3,144 3,165 3,365 3,439 3,374
*Naphtha, condensate and crude oil
DOMESTIC MARKET - Net Revenue
BRASKEM
Million of R$ 1Q09 2Q09 3Q09 4Q09 1Q10 2Q10 3Q10 4Q10
Polymers Unit
PE/PP/PVC 543 561 524 535 543 464 624 540
Others 9 54 10 - 21 23 18 10
Basic Petrochemicals Unit
Ethylene/Propylene 22 74 63 100 94 126 100 70
BTX 122 173 240 155 240 230 213 178
Others 38 231 198 225 408 343 452 216
Resale* 67 32 46 95 207 262 504 599
Quantiq** - - - - - - 1 0
Total 801 1,125 1,080 1,109 1,512 1,448 1,911 1,614
*Naphtha, condensate and crude oil
EXPORT MARKET - Net Revenue
BRASKEM
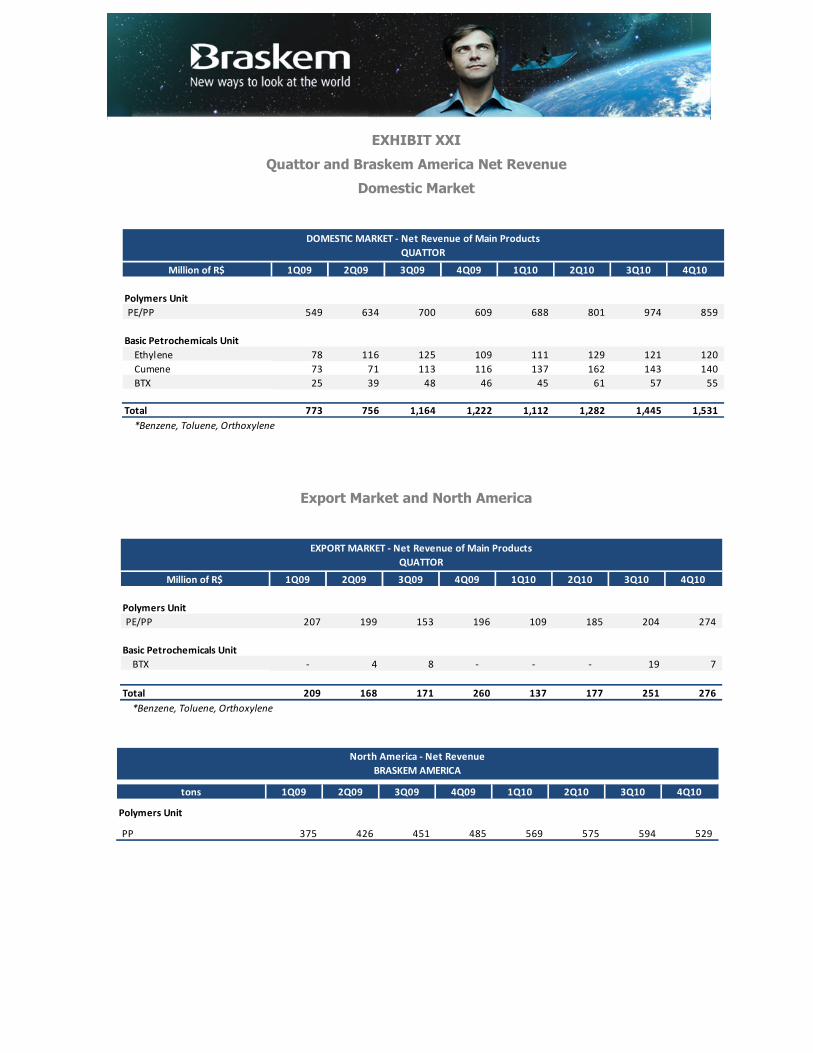
EXHIBIT XXI
Quattor and Braskem America Net Revenue
Domestic Market
Export Market and North America
Million of R$ 1Q09 2Q09 3Q09 4Q09 1Q10 2Q10 3Q10 4Q10
Polymers Unit
PE/PP 549 634 700 609 688 801 974 859
Basic Petrochemicals Unit
Ethylene 78 116 125 109 111 129 121 120
Cumene 73 71 113 116 137 162 143 140
BTX 25 39 48 46 45 61 57 55
Total 773 756 1,164 1,222 1,112 1,282 1,445 1,531
*Benzene, Toluene, Orthoxylene
DOMESTIC MARKET - Net Revenue of Main Products
QUATTOR
Million of R$ 1Q09 2Q09 3Q09 4Q09 1Q10 2Q10 3Q10 4Q10
Polymers Unit
PE/PP 207 199 153 196 109 185 204 274
Basic Petrochemicals Unit
BTX - 4 8 - - - 19 7
Total 209 168 171 260 137 177 251 276
*Benzene, Toluene, Orthoxylene
EXPORT MARKET - Net Revenue of Main Products
QUATTOR
tons 1Q09 2Q09 3Q09 4Q09 1Q10 2Q10 3Q10 4Q10
Polymers Unit
PP 375 426 451 485 569 575 594 529
North America - Net Revenue
BRASKEM AMERICA