Embed Size (px)
Citation preview
4Q FY 2017
The following document contains Lutronic’s proprietary information and is not intended to be used in any other manner other than expressly written. All business and financial data contained herein are in compliance with Korean IFRS. Any forecast within is not individually confirmed. These are forward-looking statements that relate to the Company’s estimated business and financial performance, with expressions using ‘ forecast’, ‘assessment’, ‘plan’, or ‘expectation’(‘E’). Forward-looking information and/or any interpretation may be affected by business environments and thus includes inherent differences that may vary from the final results. In addition, all forward-looking information is based on current market condition and the Company’s direction at present, and is subject to changes without further notice, according to changes in business environment or realignment of strategy. The Company, its affiliates, advisors or representatives shall not be held responsible for any damages from use of information herein, including gross negligence or otherwise. This material cannot be used as evidence for responsibilities relating to the result of investment performance of the investor.
2
DISCLAIMER
COMPANY OVERVIEW
3
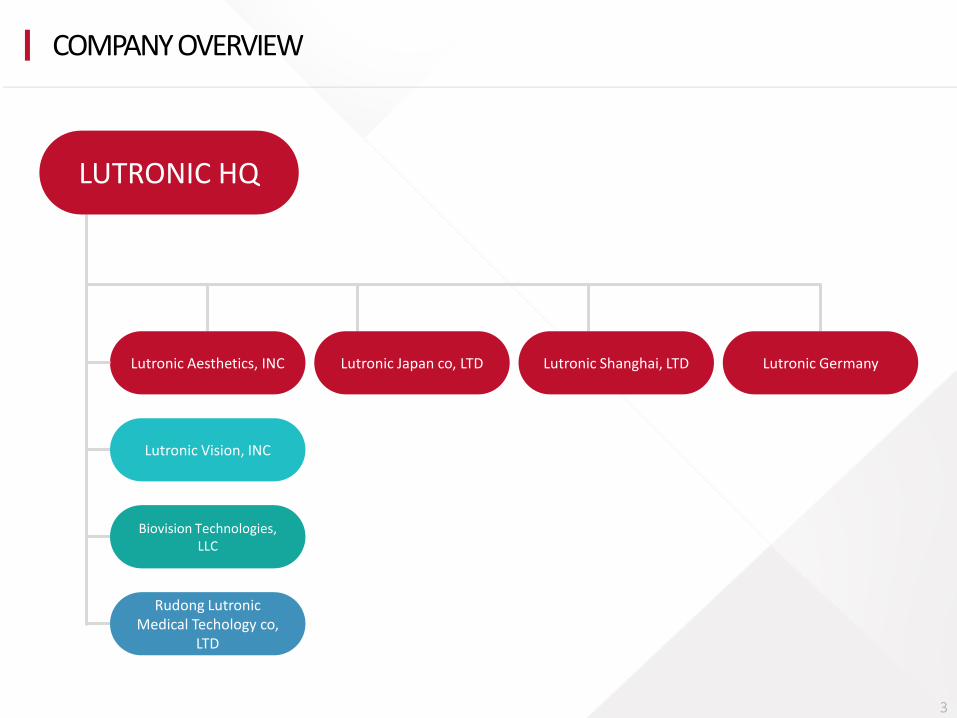
LUTRONIC HQ
Lutronic Vision, INC
Biovision Technologies, LLC
Rudong Lutronic Medical Techology co,
LTD
Lutronic Aesthetics, INC Lutronic Japan co, LTD Lutronic Shanghai, LTD Lutronic Germany
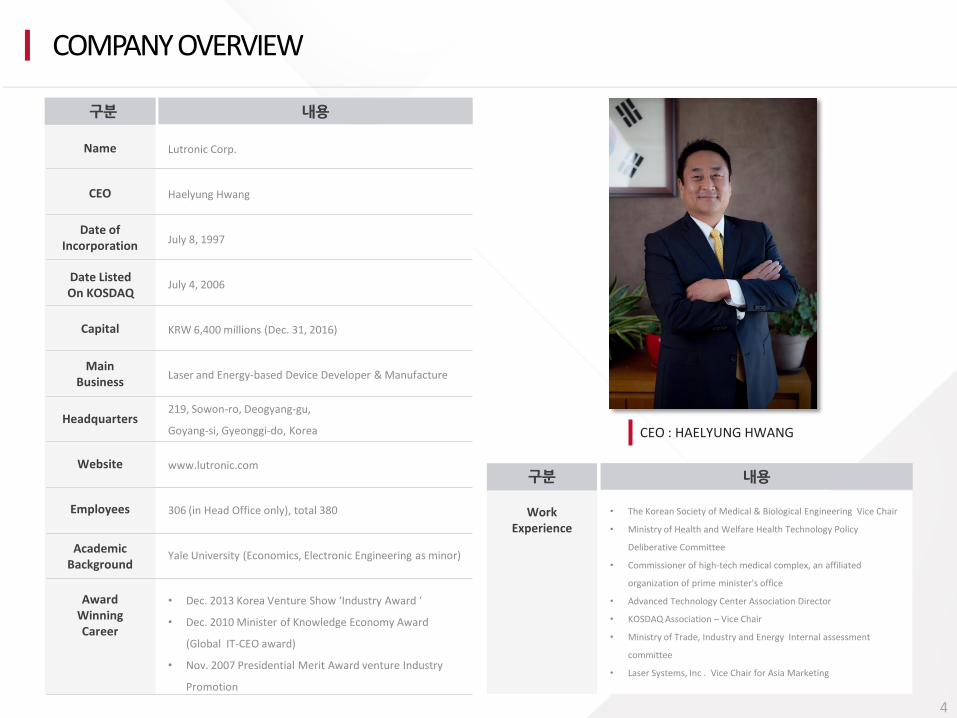
CEO : HAELYUNG HWANG
내용
Lutronic Corp.
구분
Name
CEO
Date of Incorporation
Date Listed On KOSDAQ
Capital
Main Business
Headquarters
Website
Employees
Academic Background
Award Winning Career
• Dec. 2013 Korea Venture Show ‘Industry Award ‘
• Dec. 2010 Minister of Knowledge Economy Award
(Global IT-CEO award)
• Nov. 2007 Presidential Merit Award venture Industry
Promotion
Haelyung Hwang
July 8, 1997
July 4, 2006
KRW 6,400 millions (Dec. 31, 2016)
Laser and Energy-based Device Developer & Manufacture
219, Sowon-ro, Deogyang-gu,
Goyang-si, Gyeonggi-do, Korea
www.lutronic.com
306 (in Head Office only), total 380
Yale University (Economics, Electronic Engineering as minor)
내용 구분
Work Experience
• The Korean Society of Medical & Biological Engineering Vice Chair
• Ministry of Health and Welfare Health Technology Policy
Deliberative Committee
• Commissioner of high-tech medical complex, an affiliated
organization of prime minister's office
• Advanced Technology Center Association Director
• KOSDAQ Association – Vice Chair
• Ministry of Trade, Industry and Energy Internal assessment
committee
• Laser Systems, Inc . Vice Chair for Asia Marketing
COMPANY OVERVIEW
4
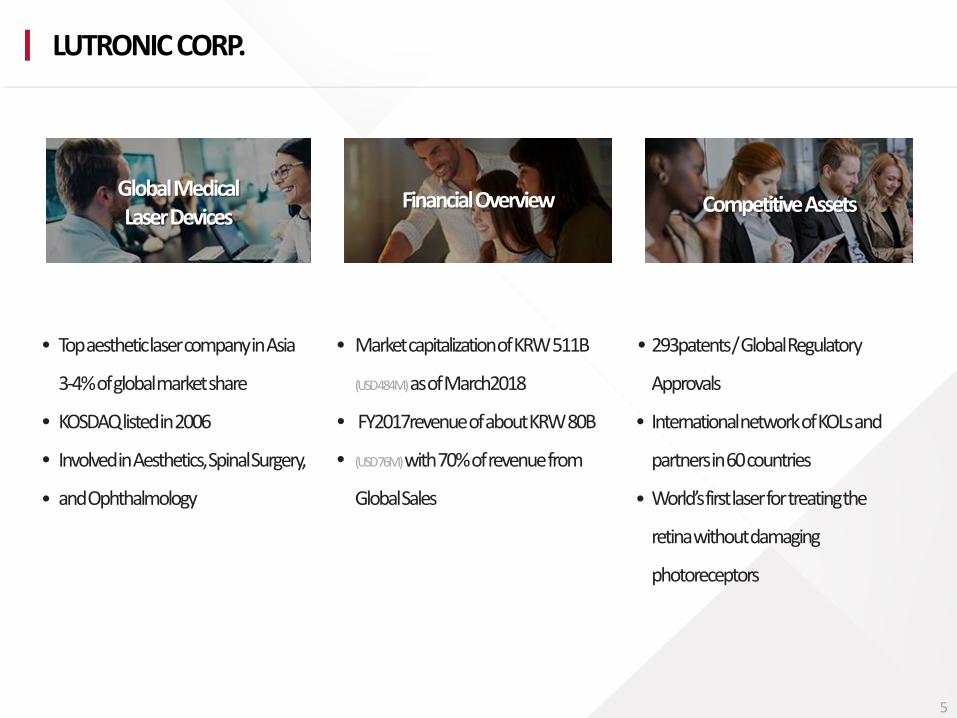
Global Medical Laser Devices
Financial Overview Competitive Assets
Top aesthetic laser company in Asia
3-4% of global market share
KOSDAQ listed in 2006
Involved in Aesthetics, Spinal Surgery,
and Ophthalmology
Market capitalization of KRW 511B
(USD 484M) as of March2018
FY2017revenue of about KRW 80B
(USD 76M) with 70% of revenue from
Global Sales
293patents / Global Regulatory
Approvals
International network of KOLs and
partners in 60 countries
World’s first laser for treating the
retina without damaging
photoreceptors
LUTRONIC CORP.
5
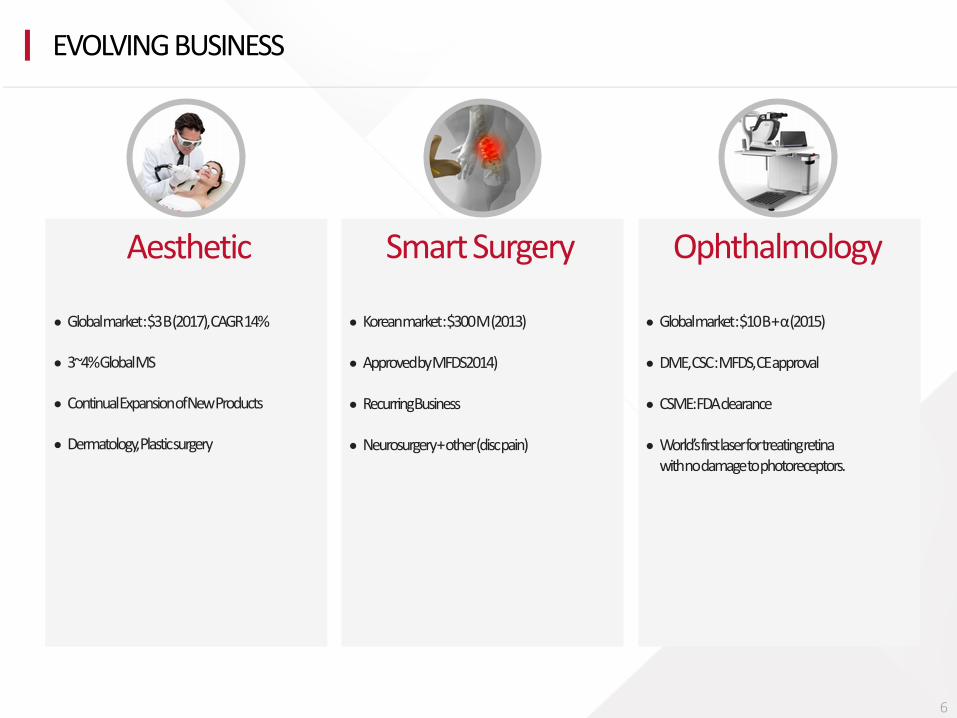
EVOLVING BUSINESS
Ophthalmology Smart Surgery Aesthetic
Global market : $3 B (2017), CAGR 14%
3~4% Global MS
Continual Expansion of New Products
Dermatology, Plastic surgery
Korean market : $300 M (2013)
Approved by MFDS2014)
Recurring Business
Neurosurgery + other (disc pain)
Global market : $10 B + α (2015)
DME, CSC : MFDS, CE approval
CSME: FDA clearance
World’s first laser for treating retina with no damage to photoreceptors.
6
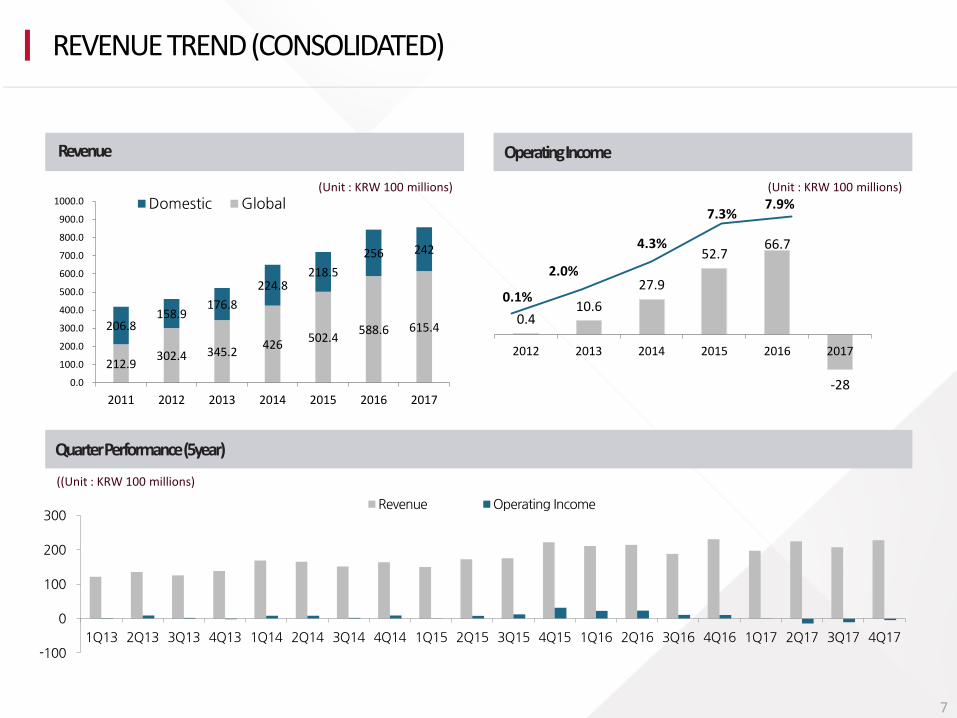
212.9 302.4 345.2
426 502.4
588.6 615.4 206.8 158.9
176.8
224.8 218.5
256 242
0.0
100.0
200.0
300.0
400.0
500.0
600.0
700.0
800.0
900.0
1000.0
2011 2012 2013 2014 2015 2016 2017
Domestic Global
0.4 10.6
27.9
52.7 66.7
-28
2012 2013 2014 2015 2016 2017
0.1%
2.0%
4.3%
7.3% 7.9%
Revenue Operating Income
(Unit : KRW 100 millions) (Unit : KRW 100 millions)
Quarter Performance (5year)
((Unit : KRW 100 millions)
REVENUE TREND (CONSOLIDATED)
7
-100
0
100
200
300
1Q13 2Q13 3Q13 4Q13 1Q14 2Q14 3Q14 4Q14 1Q15 2Q15 3Q15 4Q15 1Q16 2Q16 3Q16 4Q16 1Q17 2Q17 3Q17 4Q17
Revenue Operating Income
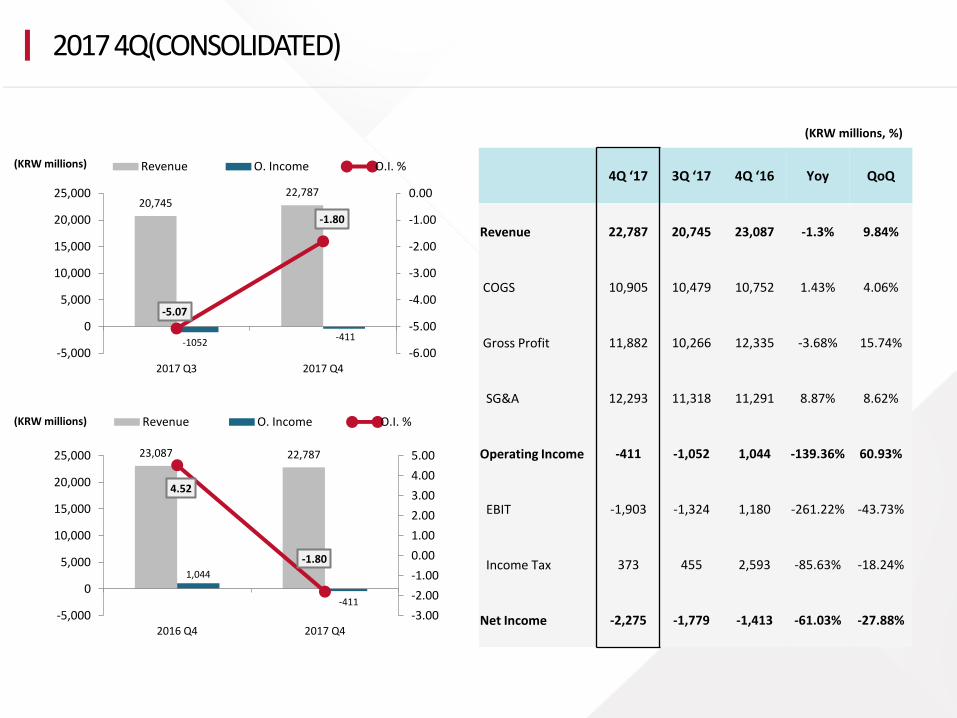
2017 4Q(CONSOLIDATED)
4Q ‘17 3Q ‘17 4Q ‘16 Yoy QoQ
Revenue 22,787 20,745 23,087 -1.3% 9.84%
COGS 10,905 10,479 10,752 1.43% 4.06%
Gross Profit 11,882 10,266 12,335 -3.68% 15.74%
SG&A 12,293 11,318 11,291 8.87% 8.62%
Operating Income -411 -1,052 1,044 -139.36% 60.93%
EBIT -1,903 -1,324 1,180 -261.22% -43.73%
Income Tax 373 455 2,593 -85.63% -18.24%
Net Income -2,275 -1,779 -1,413 -61.03% -27.88%
20,745 22,787
-1052 -411
-5.07
-1.80
-6.00
-5.00
-4.00
-3.00
-2.00
-1.00
0.00
-5,000
0
5,000
10,000
15,000
20,000
25,000
2017 Q3 2017 Q4
Revenue O. Income O.I. % (KRW millions)
23,087 22,787
1,044
-411
4.52
-1.80
-3.00
-2.00
-1.00
0.00
1.00
2.00
3.00
4.00
5.00
-5,000
0
5,000
10,000
15,000
20,000
25,000
2016 Q4 2017 Q4
Revenue O. Income O.I. %
(KRW millions, %)
(KRW millions)
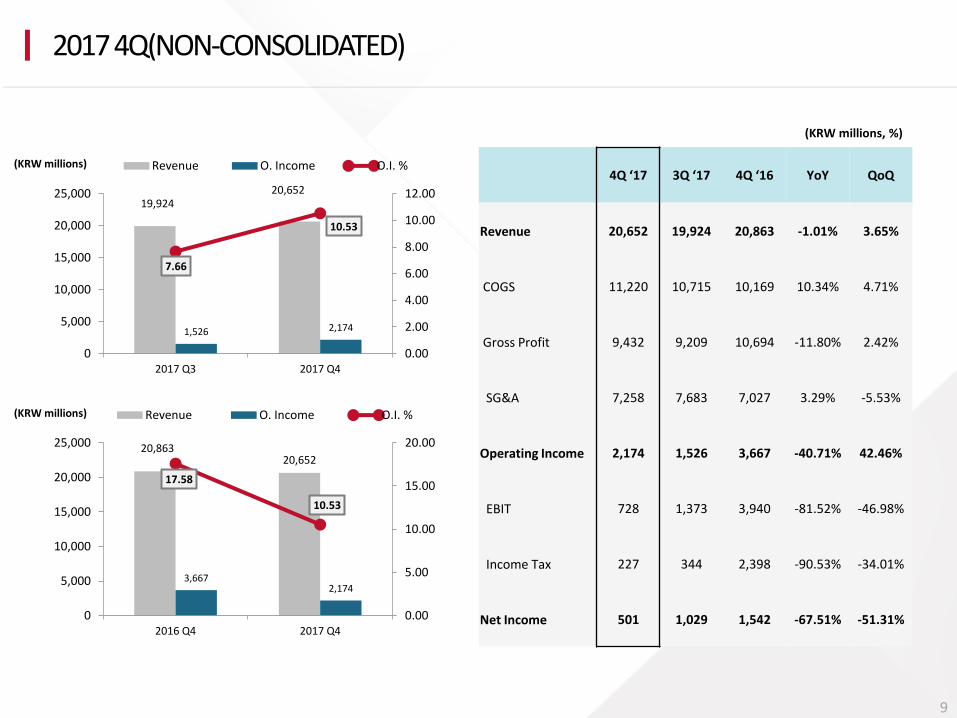
2017 4Q(NON-CONSOLIDATED)
9
19,924 20,652
1,526 2,174
7.66
10.53
0.00
2.00
4.00
6.00
8.00
10.00
12.00
0
5,000
10,000
15,000
20,000
25,000
2017 Q3 2017 Q4
Revenue O. Income O.I. % 4Q ‘17 3Q ‘17 4Q ‘16 YoY QoQ
Revenue 20,652 19,924 20,863 -1.01% 3.65%
COGS 11,220 10,715 10,169 10.34% 4.71%
Gross Profit 9,432 9,209 10,694 -11.80% 2.42%
SG&A 7,258 7,683 7,027 3.29% -5.53%
Operating Income 2,174 1,526 3,667 -40.71% 42.46%
EBIT 728 1,373 3,940 -81.52% -46.98%
Income Tax 227 344 2,398 -90.53% -34.01%
Net Income 501 1,029 1,542 -67.51% -51.31%
20,863 20,652
3,667 2,174
17.58
10.53
0.00
5.00
10.00
15.00
20.00
0
5,000
10,000
15,000
20,000
25,000
2016 Q4 2017 Q4
Revenue O. Income O.I. %
(KRW millions)
(KRW millions)
(KRW millions, %)
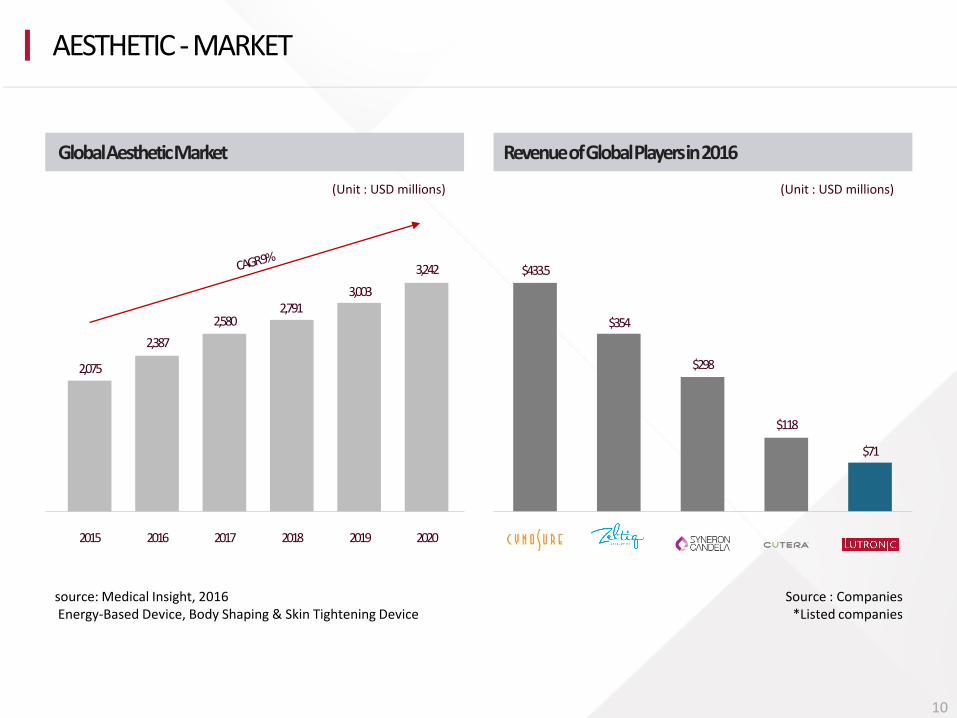
Global Aesthetic Market Revenue of Global Players in 2016
2,075
2,387
2,580 2,791
3,003
3,242
(Unit : USD millions)
$433.5
$354
$298
$118
$71
2015 2016 2017 2018 2019 2020
source: Medical Insight, 2016 Energy-Based Device, Body Shaping & Skin Tightening Device
Source : Companies *Listed companies
AESTHETIC - MARKET
10
(Unit : USD millions)
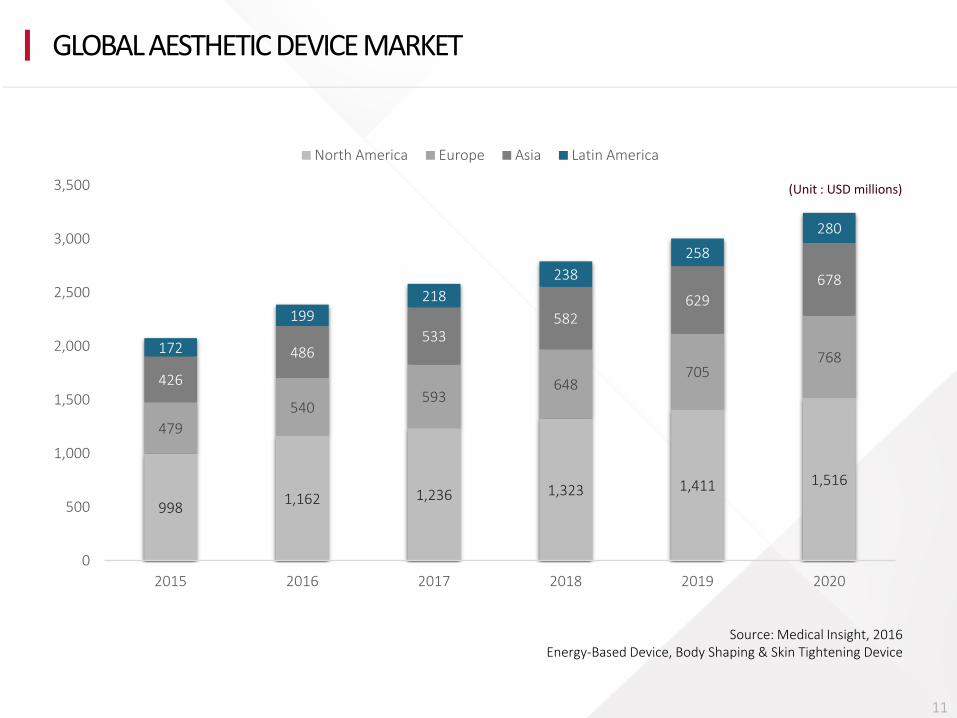
998 1,162 1,236 1,323 1,411 1,516
479
540 593
648 705
768
426
486 533
582 629
678
172
199 218
238
258
280
0
500
1,000
1,500
2,000
2,500
3,000
3,500
2015 2016 2017 2018 2019 2020
North America Europe Asia Latin America
Source: Medical Insight, 2016 Energy-Based Device, Body Shaping & Skin Tightening Device
GLOBAL AESTHETIC DEVICE MARKET
11
(Unit : USD millions)
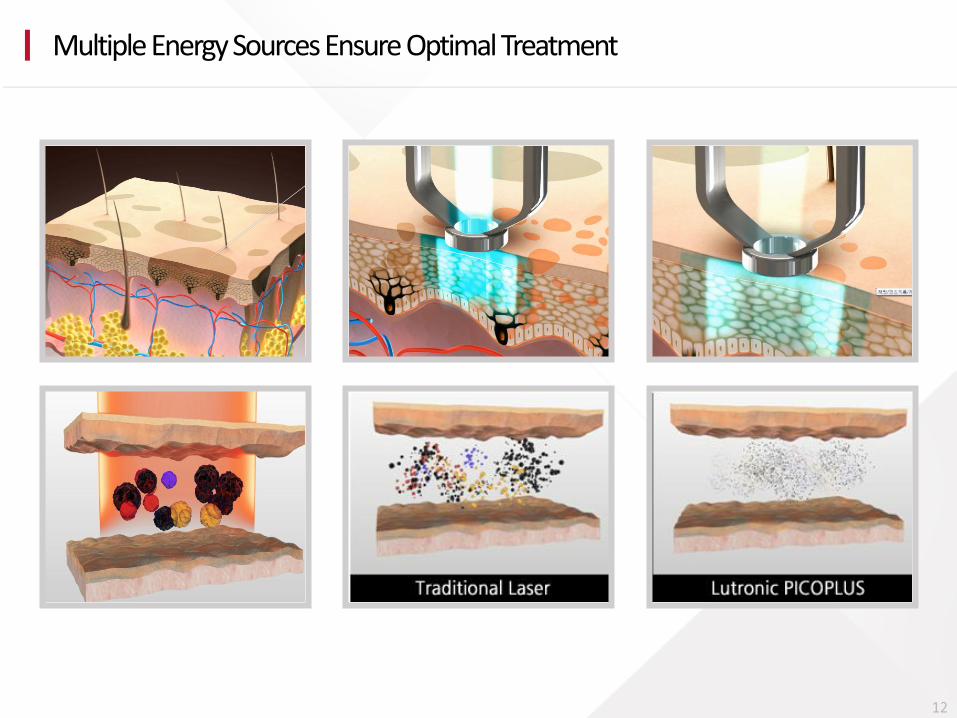
Multiple Energy Sources Ensure Optimal Treatment
12
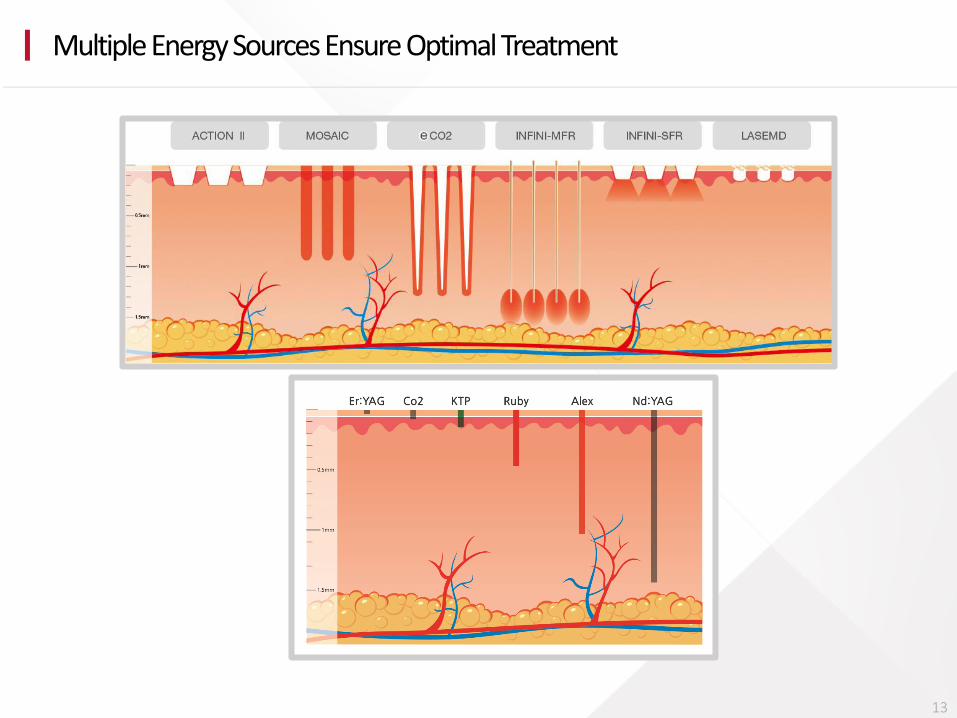
Multiple Energy Sources Ensure Optimal Treatment
13
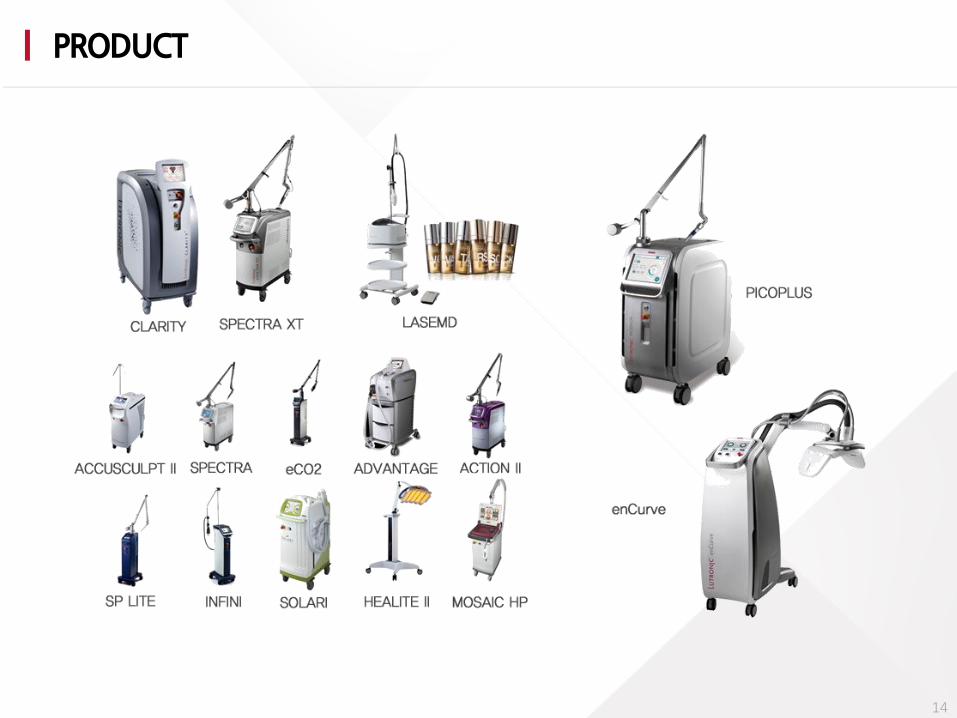
PRODUCT
14
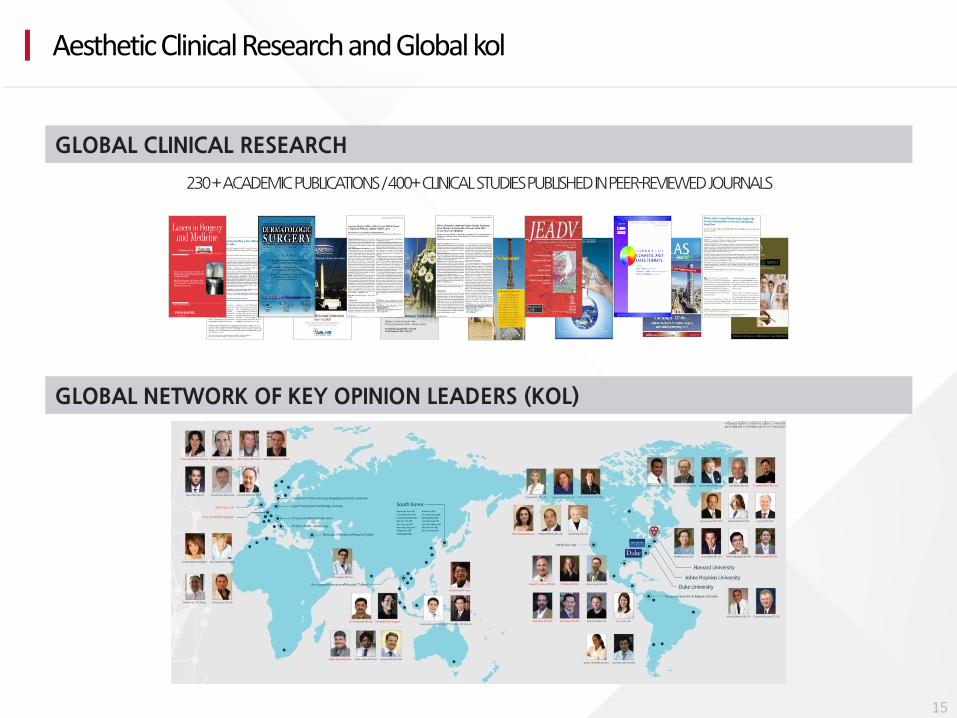
GLOBAL CLINICAL RESEARCH
GLOBAL NETWORK OF KEY OPINION LEADERS (KOL)
230 + ACADEMIC PUBLICATIONS / 400+ CLINICAL STUDIES PUBLISHED IN PEER-REVIEWED JOURNALS
Aesthetic Clinical Research and Global kol
15
0
2000
4000
6000
8000
10000
12000
2013 2015 2017
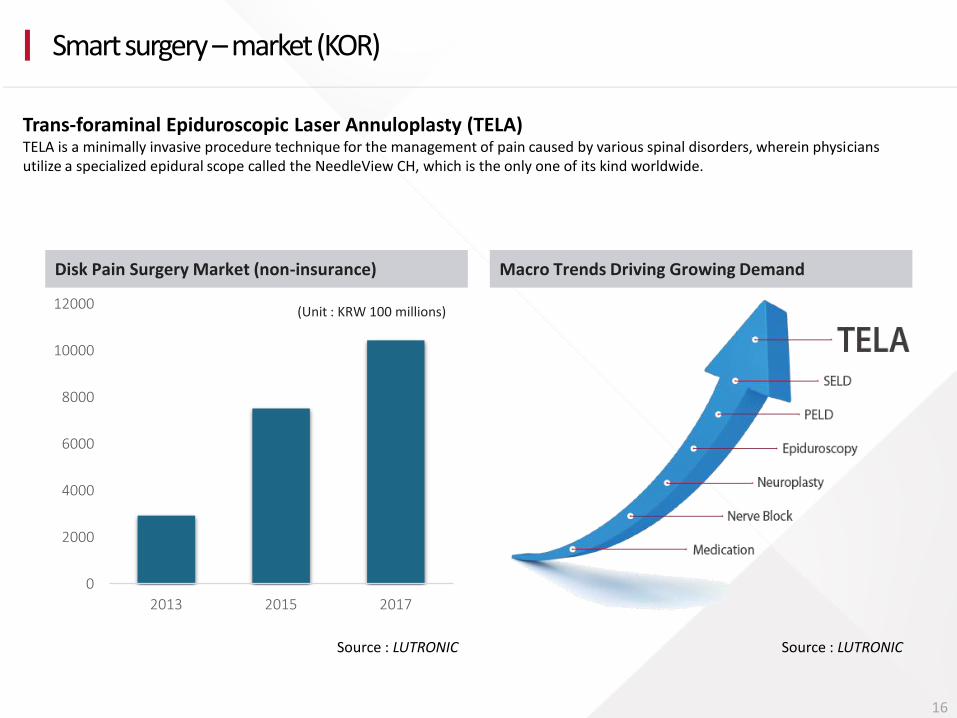
Disk Pain Surgery Market (non-insurance) Macro Trends Driving Growing Demand
(Unit : KRW 100 millions)
Source : LUTRONIC
Smart surgery – market (KOR)
16
Source : LUTRONIC
Trans-foraminal Epiduroscopic Laser Annuloplasty (TELA) TELA is a minimally invasive procedure technique for the management of pain caused by various spinal disorders, wherein physicians utilize a specialized epidural scope called the NeedleView CH, which is the only one of its kind worldwide.
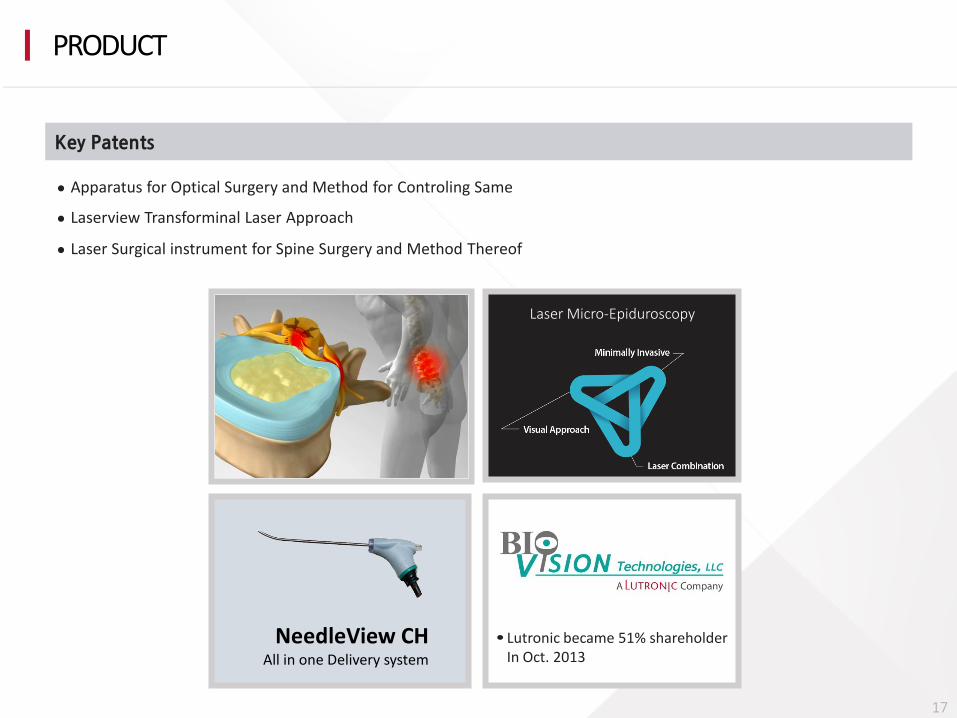
Key Patents
Apparatus for Optical Surgery and Method for Controling Same
Laserview Transforminal Laser Approach
Laser Surgical instrument for Spine Surgery and Method Thereof
NeedleView CH All in one Delivery system
Laser Micro-Epiduroscopy
Lutronic became 51% shareholder In Oct. 2013
PRODUCT
17
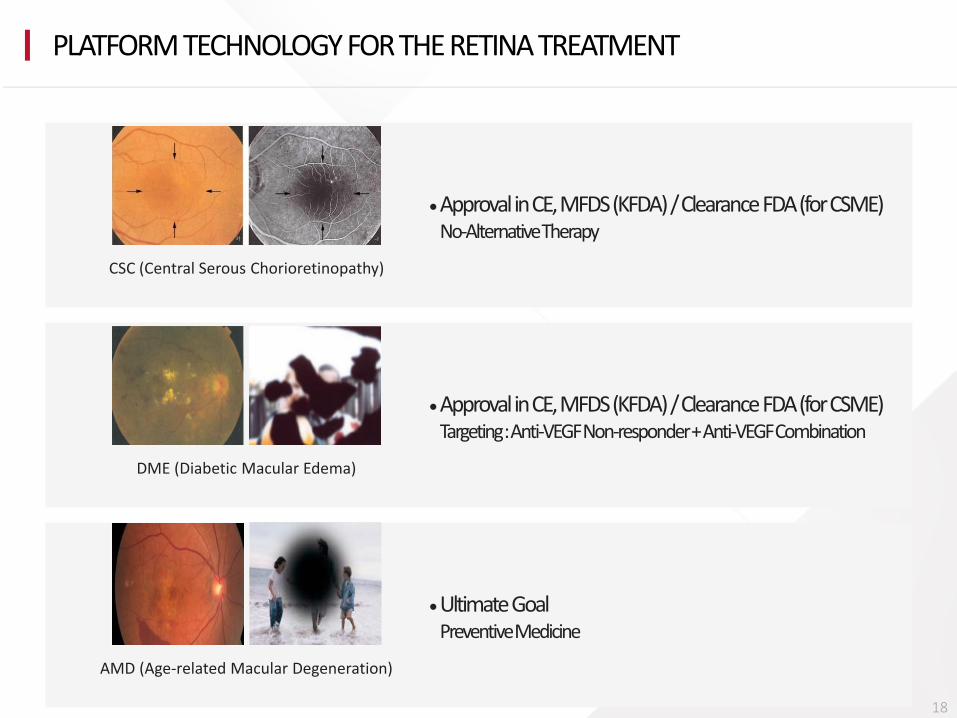
CSC (Central Serous Chorioretinopathy)
Approval in CE, MFDS (KFDA) / Clearance FDA (for CSME) No-Alternative Therapy
AMD (Age-related Macular Degeneration)
Ultimate Goal Preventive Medicine
DME (Diabetic Macular Edema)
Approval in CE, MFDS (KFDA) / Clearance FDA (for CSME) Targeting : Anti-VEGF Non-responder + Anti-VEGF Combination
PLATFORM TECHNOLOGY FOR THE RETINA TREATMENT
18
Iris
Pupil
Cornea
Lens
Retina
Optic Nerve
Blind Spot
Ciliary
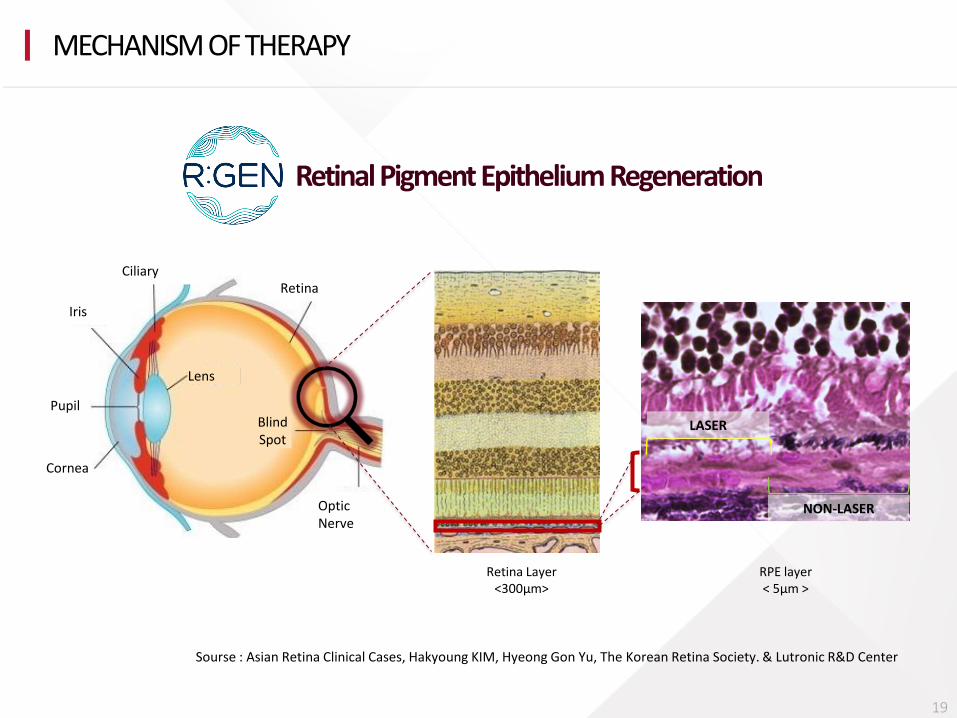
LASER
NON-LASER
RPE layer < 5µm >
Retina Layer <300µm>
Retinal Pigment Epithelium Regeneration
Sourse : Asian Retina Clinical Cases, Hakyoung KIM, Hyeong Gon Yu, The Korean Retina Society. & Lutronic R&D Center
MECHANISM OF THERAPY
19
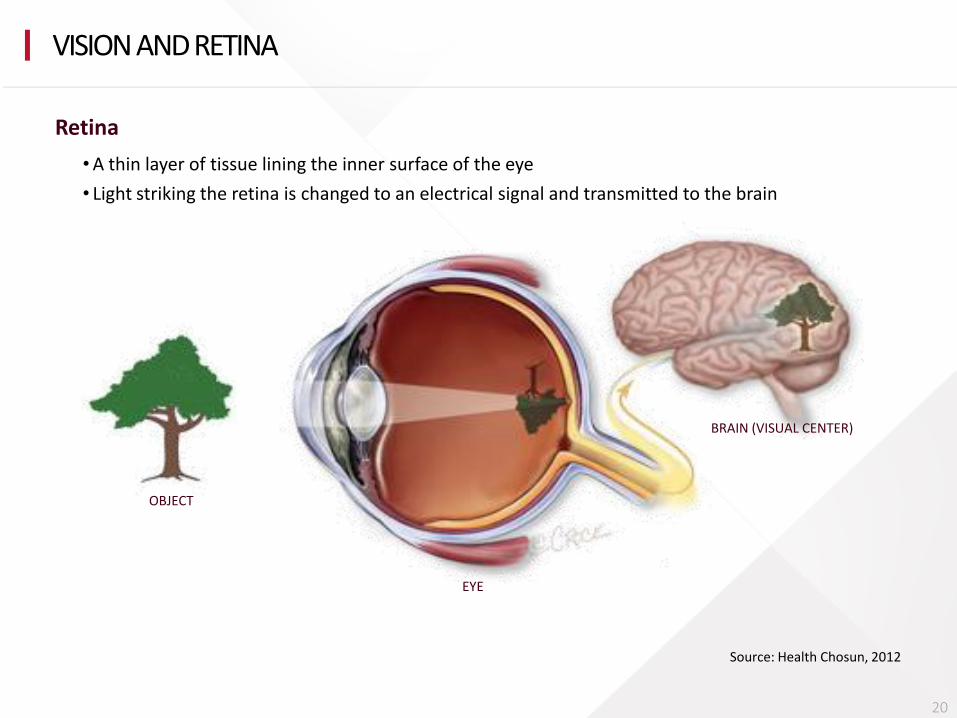
OBJECT
EYE
BRAIN (VISUAL CENTER)
Source: Health Chosun, 2012
Retina
VISION AND RETINA
20
•A thin layer of tissue lining the inner surface of the eye
• Light striking the retina is changed to an electrical signal and transmitted to the brain
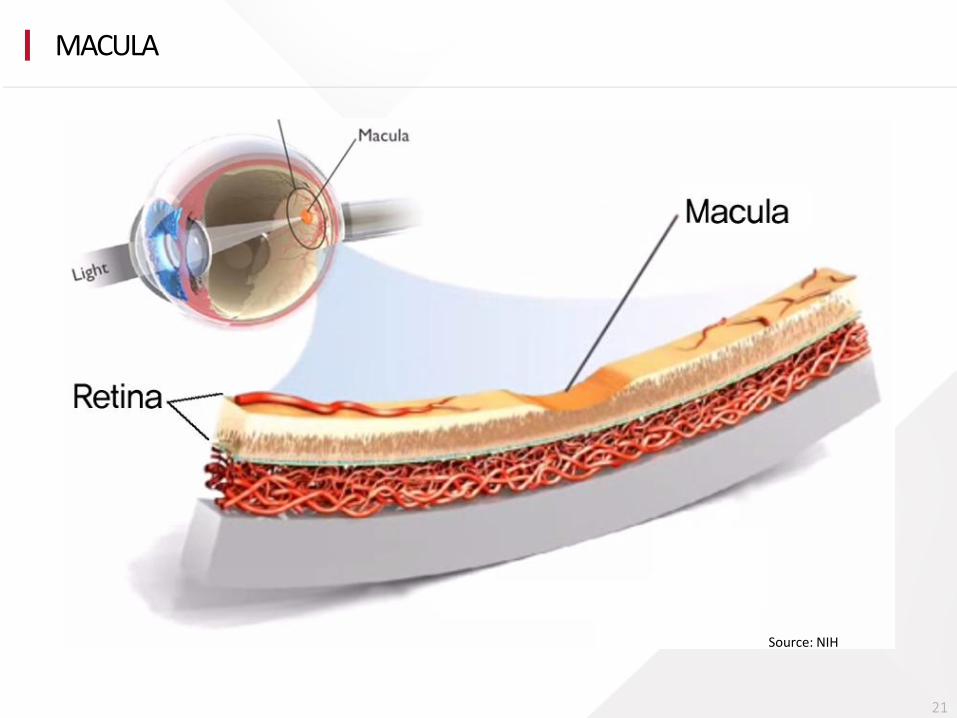
MACULA
21
Source: NIH
Photoreceptors
Retinal Pigment Epithelial Cells
Bruch’s Membrane
Choroid
MACULA
22
Source: LUTRONIC. NIH
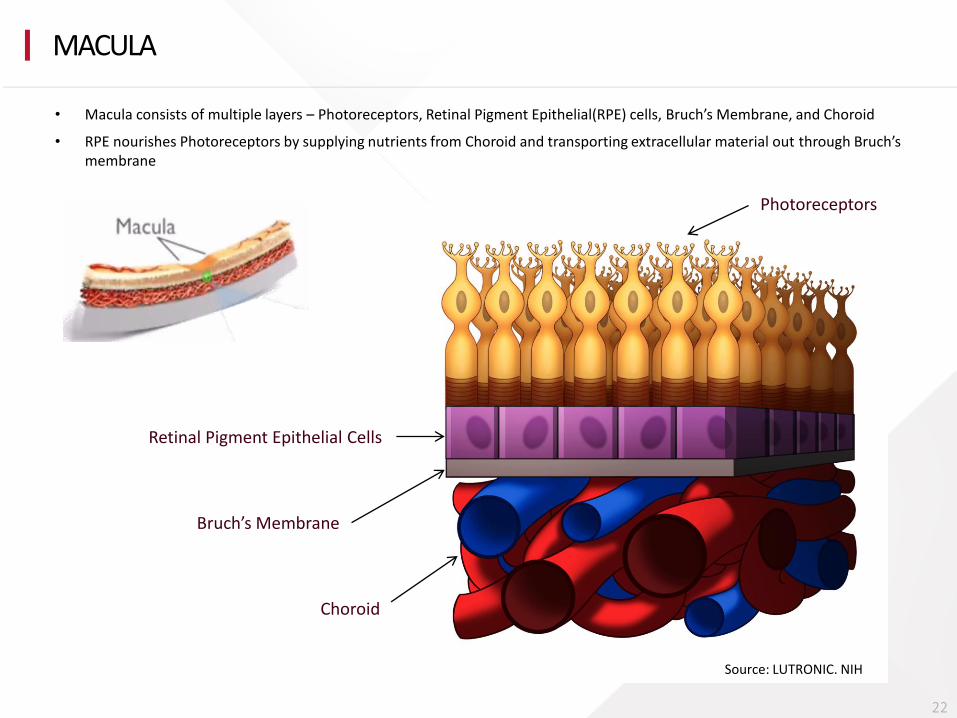
• Macula consists of multiple layers – Photoreceptors, Retinal Pigment Epithelial(RPE) cells, Bruch’s Membrane, and Choroid
• RPE nourishes Photoreceptors by supplying nutrients from Choroid and transporting extracellular material out through Bruch’s membrane
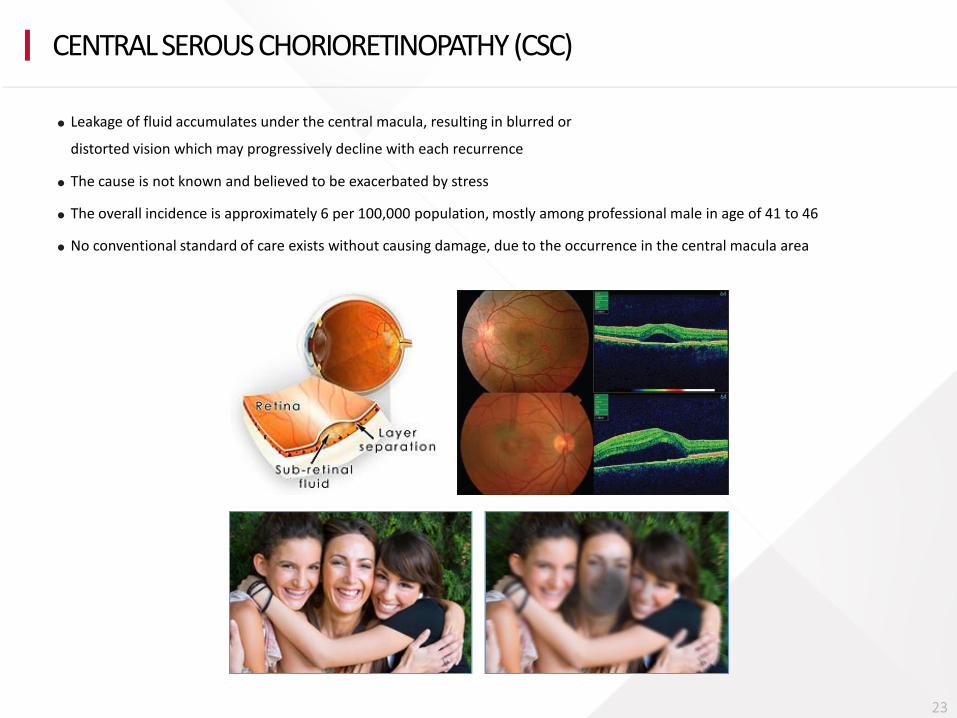
Leakage of fluid accumulates under the central macula, resulting in blurred or
distorted vision which may progressively decline with each recurrence
CENTRAL SEROUS CHORIORETINOPATHY (CSC)
23
The cause is not known and believed to be exacerbated by stress
The overall incidence is approximately 6 per 100,000 population, mostly among professional male in age of 41 to 46
No conventional standard of care exists without causing damage, due to the occurrence in the central macula area
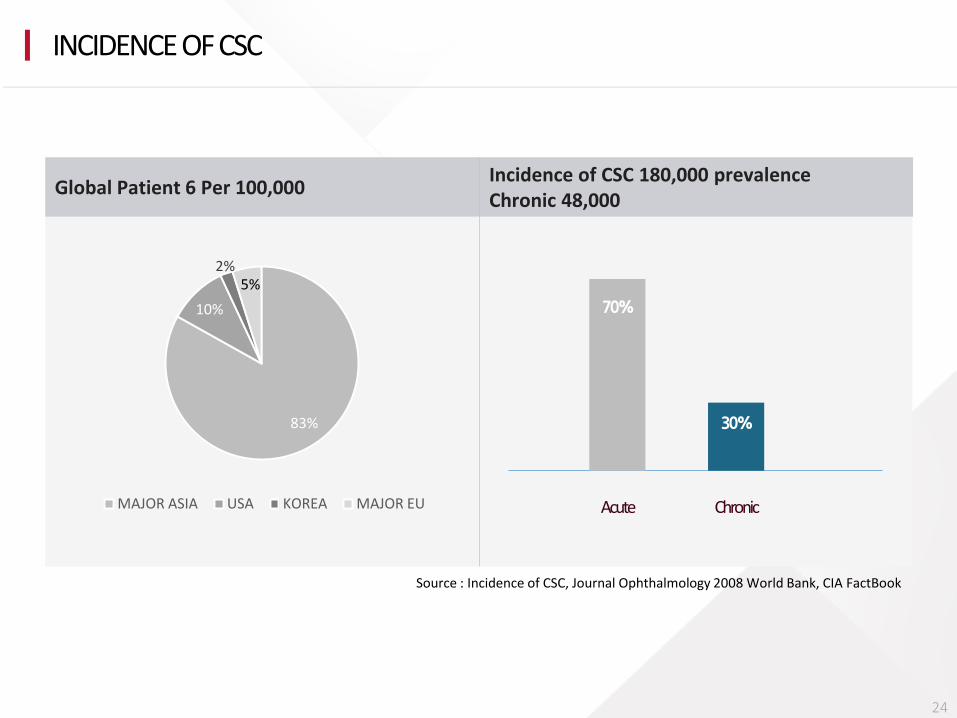
83%
10%
2% 5%
MAJOR ASIA USA KOREA MAJOR EU
70%
30%
Acute Chronic
Global Patient 6 Per 100,000 Incidence of CSC 180,000 prevalence Chronic 48,000
Source : Incidence of CSC, Journal Ophthalmology 2008 World Bank, CIA FactBook
INCIDENCE OF CSC
24
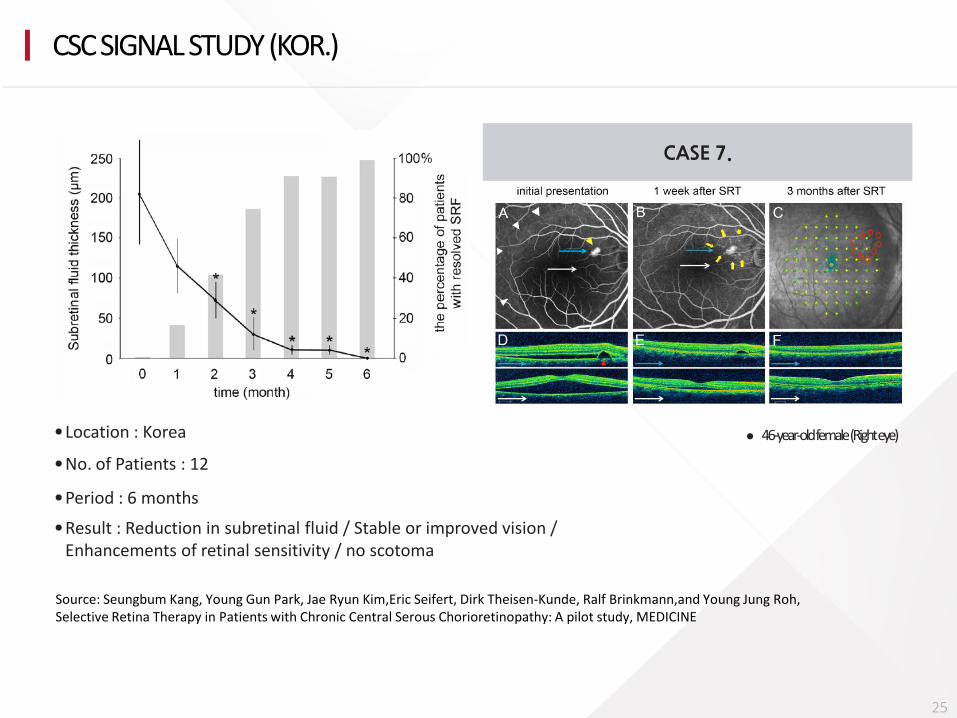
Location : Korea
No. of Patients : 12
Period : 6 months
Result : Reduction in subretinal fluid / Stable or improved vision / Enhancements of retinal sensitivity / no scotoma
CASE 7.
46-year-old female (Right eye)
Source: Seungbum Kang, Young Gun Park, Jae Ryun Kim,Eric Seifert, Dirk Theisen-Kunde, Ralf Brinkmann,and Young Jung Roh, Selective Retina Therapy in Patients with Chronic Central Serous Chorioretinopathy: A pilot study, MEDICINE
CSC SIGNAL STUDY (KOR.)
25
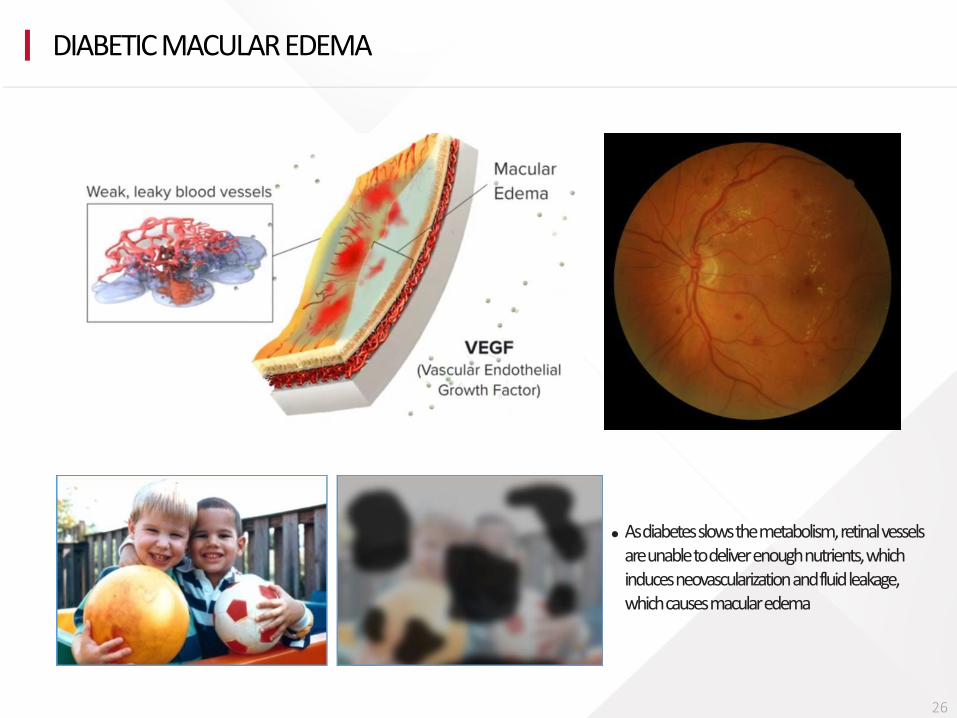
As diabetes slows the metabolism, retinal vessels are unable to deliver enough nutrients, which induces neovascularization and fluid leakage, which causes macular edema
DIABETIC MACULAR EDEMA
26
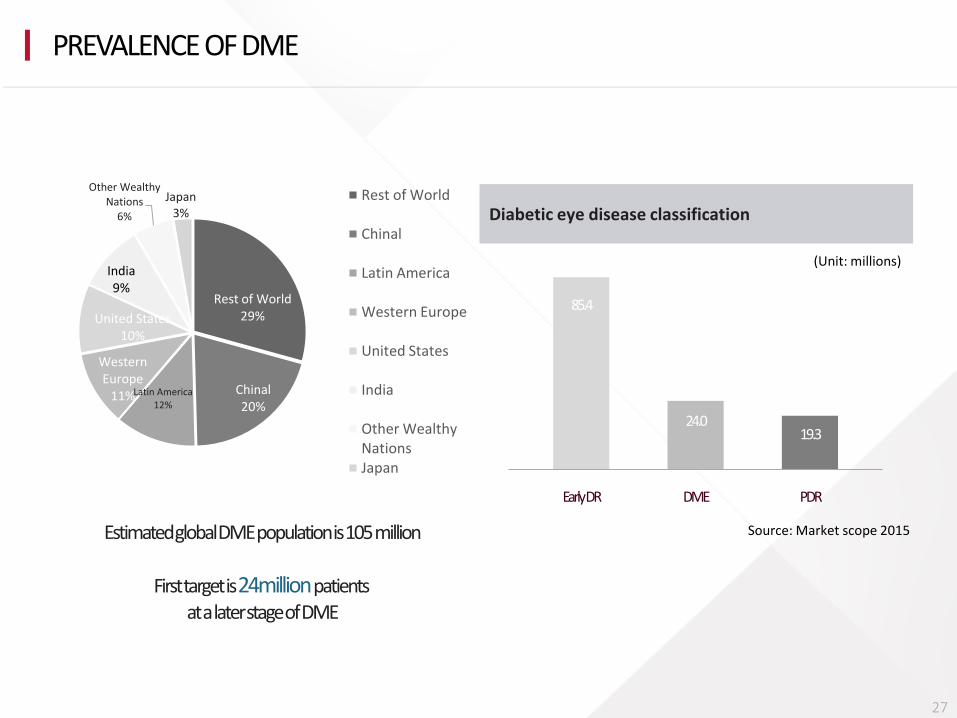
Rest of World 29%
Chinal 20%
Latin America 12%
Western Europe
11%
United States 10%
India 9%
Other Wealthy Nations
6%
Japan 3%
Rest of World
Chinal
Latin America
Western Europe
United States
India
Other Wealthy Nations Japan
Estimated global DME population is 105 million
First target is 24million patients at a later stage of DME
Early DR DME
Diabetic eye disease classification
85.4
24.0 19.3
PDR
Source: Market scope 2015
PREVALENCE OF DME
27
(Unit: millions)
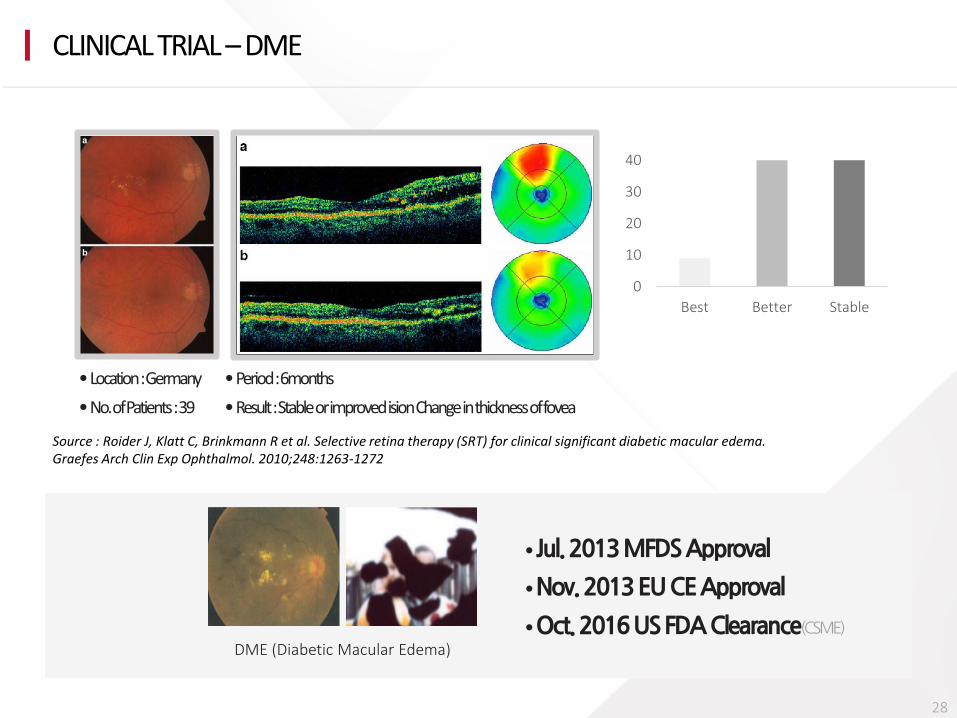
Location : Germany
No. of Patients : 39
Source : Roider J, Klatt C, Brinkmann R et al. Selective retina therapy (SRT) for clinical significant diabetic macular edema. Graefes Arch Clin Exp Ophthalmol. 2010;248:1263-1272
DME (Diabetic Macular Edema)
Jul. 2013 MFDS Approval
Nov. 2013 EU CE Approval
Oct. 2016 US FDA Clearance(CSME)
CLINICAL TRIAL – DME
28
0
10
20
30
40
Best Better Stable
Period : 6months
Result : Stable or improved ision Change in thickness of fovea
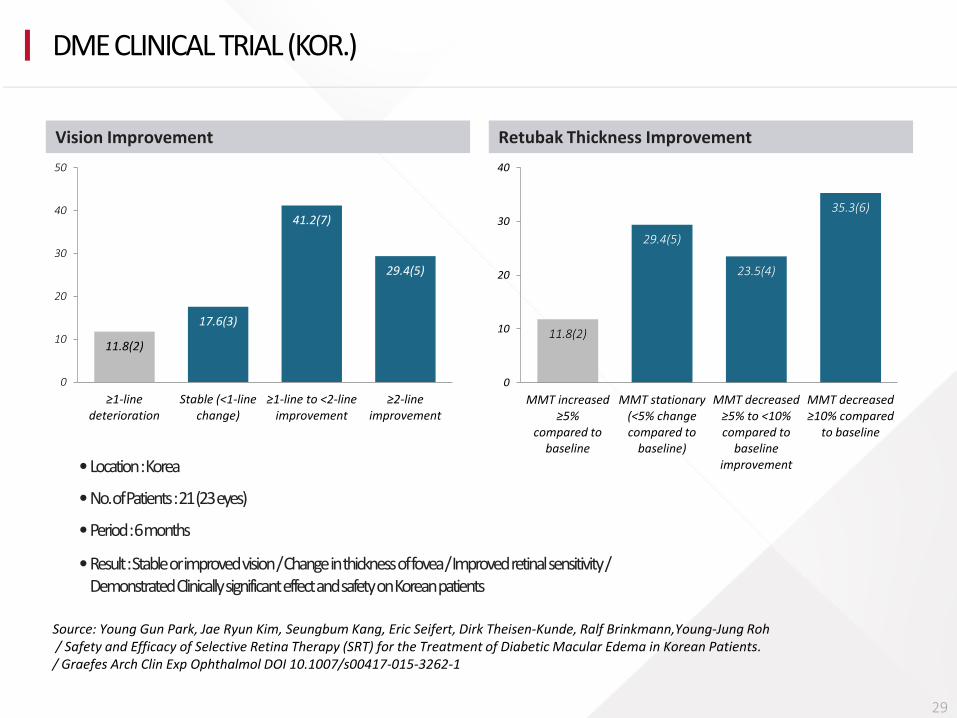
11.8(2)
17.6(3)
41.2(7)
29.4(5)
0
10
20
30
40
50
≥1-line deterioration
Stable (<1-line change)
≥1-line to <2-line improvement
≥2-line improvement
11.8(2)
29.4(5)
23.5(4)
35.3(6)
0
10
20
30
40
MMT increased ≥5%
compared to baseline
MMT stationary (<5% change compared to
baseline)
MMT decreased ≥5% to <10% compared to
baseline improvement
MMT decreased ≥10% compared
to baseline
Retubak Thickness Improvement Vision Improvement
Location : Korea
No. of Patients : 21 (23 eyes)
Period : 6 months
Source: Young Gun Park, Jae Ryun Kim, Seungbum Kang, Eric Seifert, Dirk Theisen-Kunde, Ralf Brinkmann,Young-Jung Roh / Safety and Efficacy of Selective Retina Therapy (SRT) for the Treatment of Diabetic Macular Edema in Korean Patients. / Graefes Arch Clin Exp Ophthalmol DOI 10.1007/s00417-015-3262-1
DME CLINICAL TRIAL (KOR.)
29
Result : Stable or improved vision / Change in thickness of fovea / Improved retinal sensitivity / Demonstrated Clinically significant effect and safety on Korean patients
DRY-AMD) WET-AMD)
Drusen
AGE-RELATED MACULAR DEGENERATION
30
10% 90%
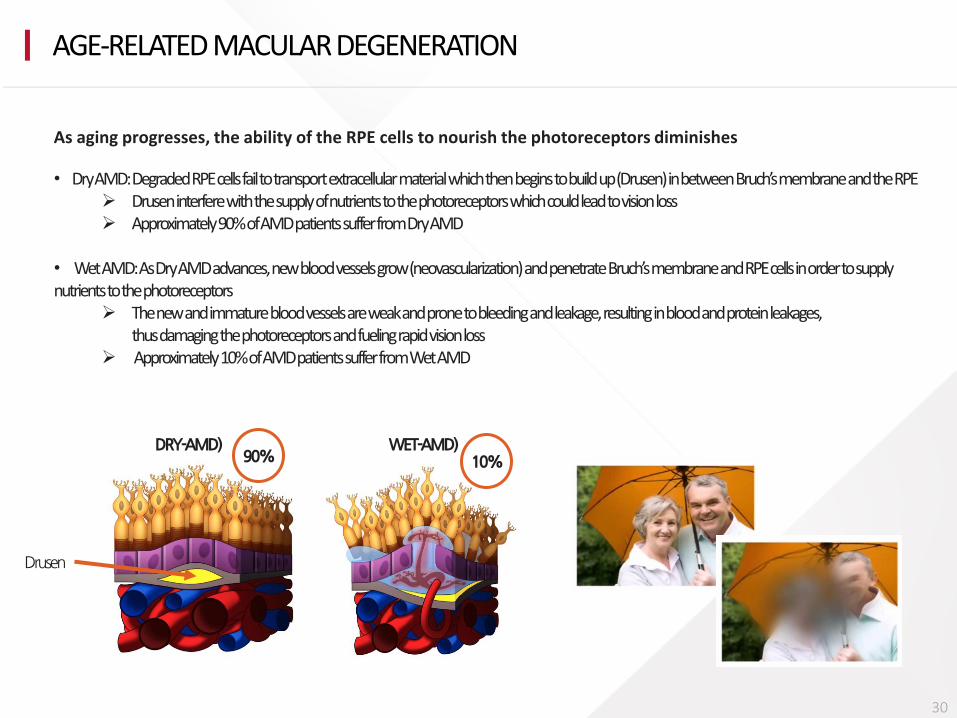
As aging progresses, the ability of the RPE cells to nourish the photoreceptors diminishes
• Dry AMD: Degraded RPE cells fail to transport extracellular material which then begins to build up (Drusen) in between Bruch’s membrane and the RPE Drusen interfere with the supply of nutrients to the photoreceptors which could lead to vision loss Approximately 90% of AMD patients suffer from Dry AMD
• Wet AMD: As Dry AMD advances, new blood vessels grow (neovascularization) and penetrate Bruch’s membrane and RPE cells in order to supply nutrients to the photoreceptors
The new and immature blood vessels are weak and prone to bleeding and leakage, resulting in blood and protein leakages, thus damaging the photoreceptors and fueling rapid vision loss Approximately 10% of AMD patients suffer from Wet AMD
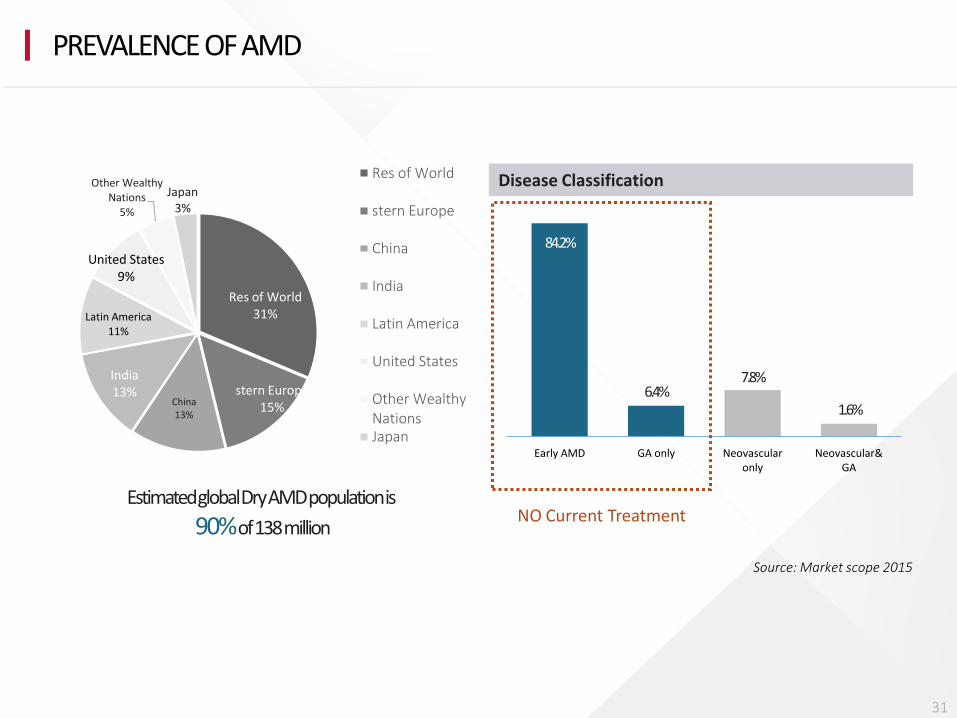
Res of World 31%
stern Europe 15% China
13%
India 13%
Latin America 11%
United States 9%
Other Wealthy Nations
5%
Japan 3%
Res of World
stern Europe
China
India
Latin America
United States
Other Wealthy Nations Japan
Estimated global Dry AMD population is
90% of 138 million
Disease Classification
84.2%
6.4% 7.8%
1.6%
Early AMD GA only Neovascular only
Neovascular& GA
NO Current Treatment
Source: Market scope 2015
PREVALENCE OF AMD
31
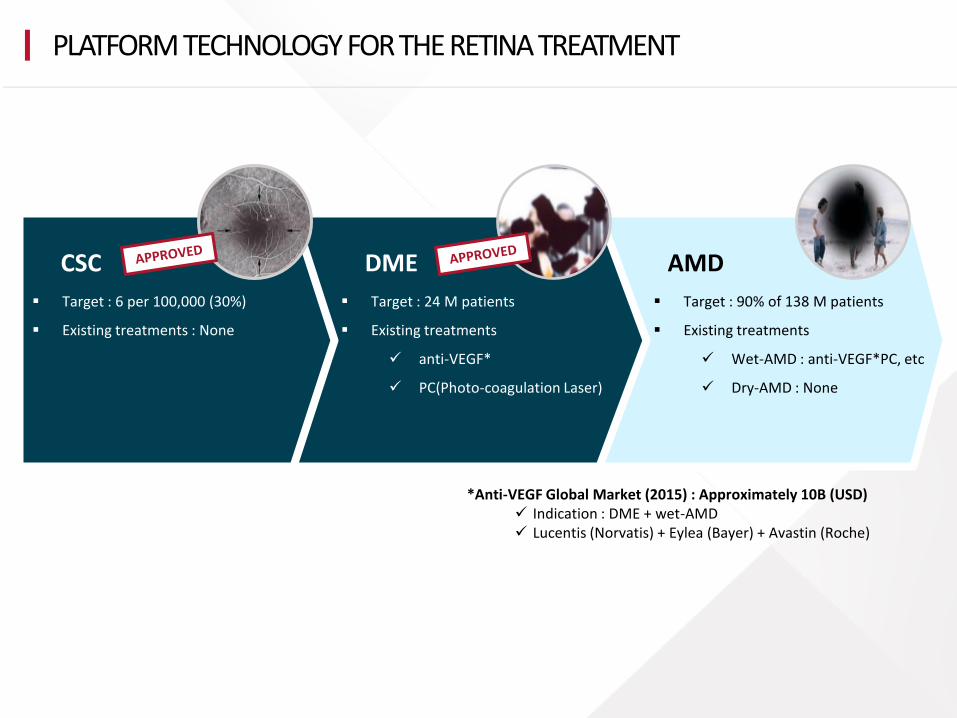
PLATFORM TECHNOLOGY FOR THE RETINA TREATMENT
CSC DME AMD
Target : 6 per 100,000 (30%)
Existing treatments : None
Target : 90% of 138 M patients
Existing treatments
Wet-AMD : anti-VEGF*PC, etc
Dry-AMD : None
Target : 24 M patients
Existing treatments
anti-VEGF*
PC(Photo-coagulation Laser)
*Anti-VEGF Global Market (2015) : Approximately 10B (USD) Indication : DME + wet-AMD Lucentis (Norvatis) + Eylea (Bayer) + Avastin (Roche)
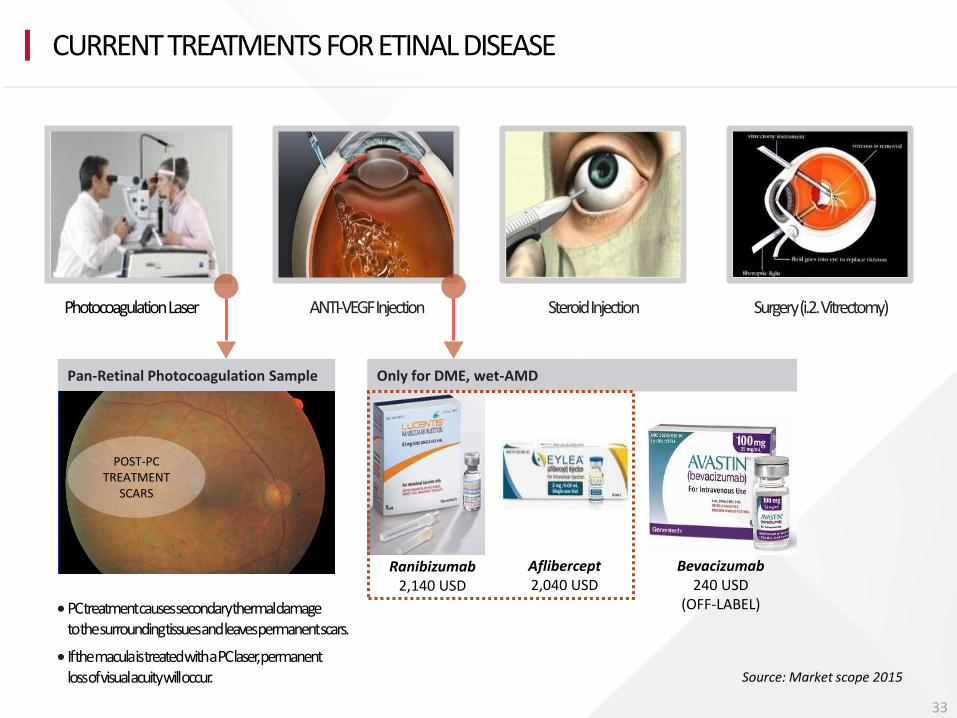
Pan-Retinal Photocoagulation Sample Only for DME, wet-AMD
POST-PC TREATMENT
SCARS
Ranibizumab 2,140 USD
Aflibercept 2,040 USD
Bevacizumab 240 USD
(OFF-LABEL) PC treatment causes secondary thermal damage to the surrounding tissues and leaves permanent scars.
Source: Market scope 2015
Photocoagulation Laser ANTI-VEGF Injection Steroid Injection Surgery (i.2. Vitrectomy)
CURRENT TREATMENTS FOR ETINAL DISEASE
33
If the macula is treated with a PC laser, permanent loss of visual acuity will occur.
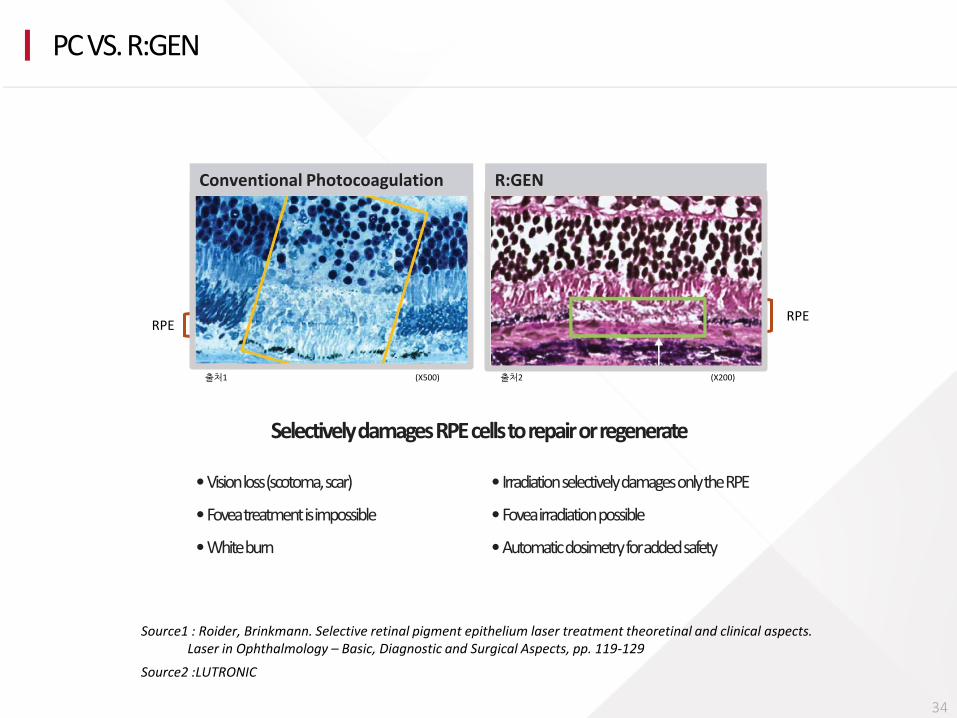
RPE RPE
Conventional Photocoagulation R:GEN
출처1 (X500) 출처2 (X200)
Selectively damages RPE cells to repair or regenerate
Vision loss (scotoma, scar)
Fovea treatment is impossible
White burn
Irradiation selectively damages only the RPE
Fovea irradiation possible
Automatic dosimetry for added safety
Source1 : Roider, Brinkmann. Selective retinal pigment epithelium laser treatment theoretinal and clinical aspects. Laser in Ophthalmology – Basic, Diagnostic and Surgical Aspects, pp. 119-129
Source2 :LUTRONIC
PC VS. R:GEN
34
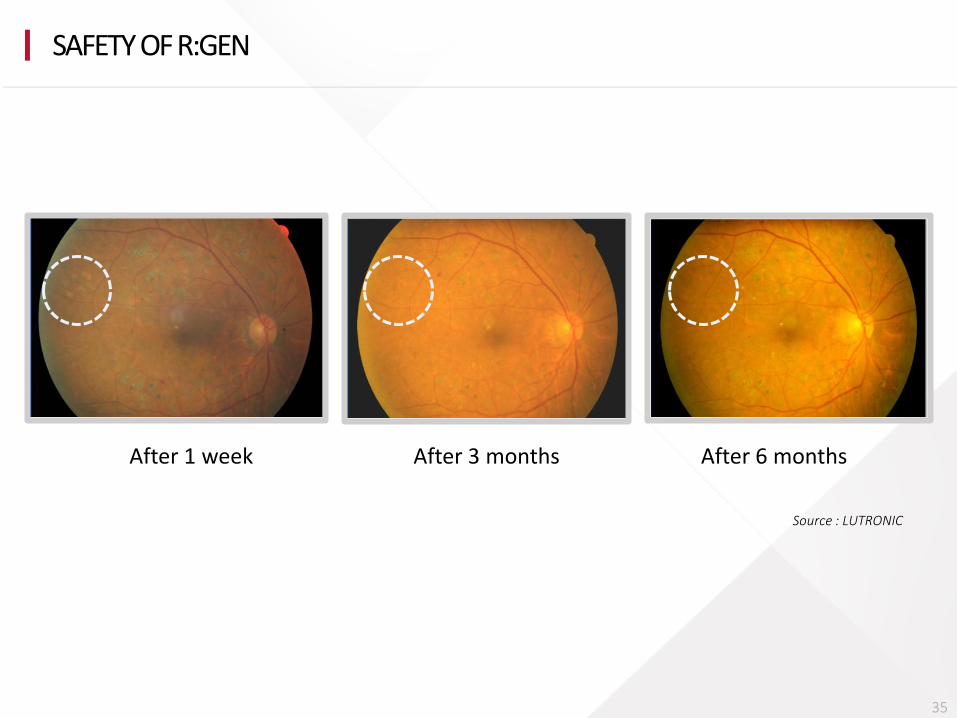
After 1 week After 3 months After 6 months
Source : LUTRONIC
SAFETY OF R:GEN
35
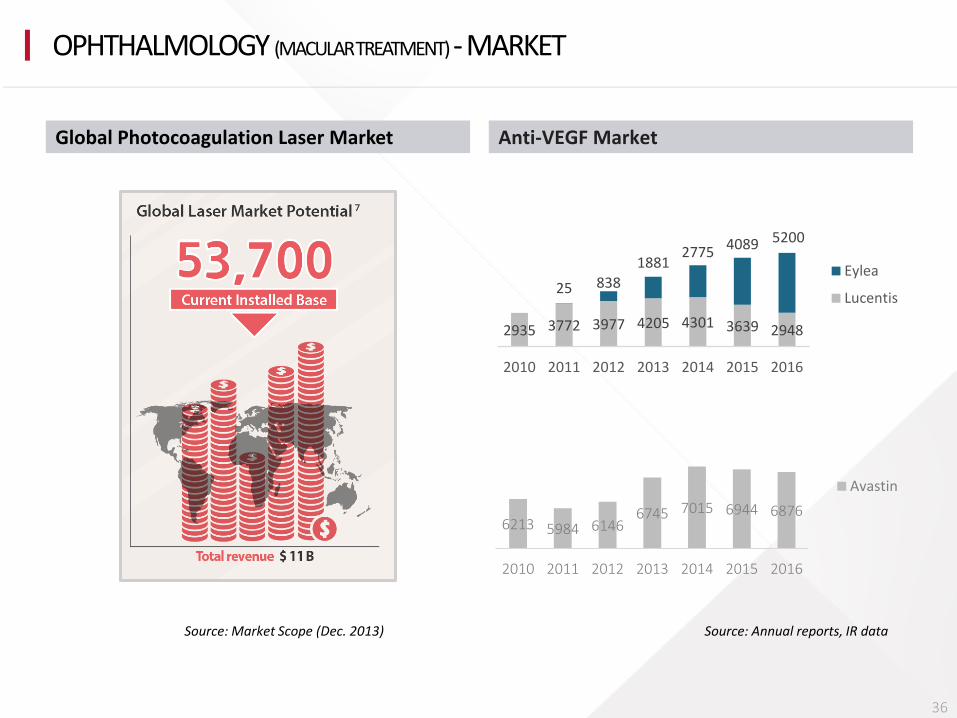
Anti-VEGF Market Global Photocoagulation Laser Market
2935 3772 3977 4205 4301 3639 2948
25 838
1881 2775 4089 5200
2010 2011 2012 2013 2014 2015 2016
Eylea
Lucentis
6213 5984 6146 6745 7015 6944 6876
2010 2011 2012 2013 2014 2015 2016
Avastin
OPHTHALMOLOGY (MACULAR TREATMENT) - MARKET
36
Source: Annual reports, IR data Source: Market Scope (Dec. 2013)
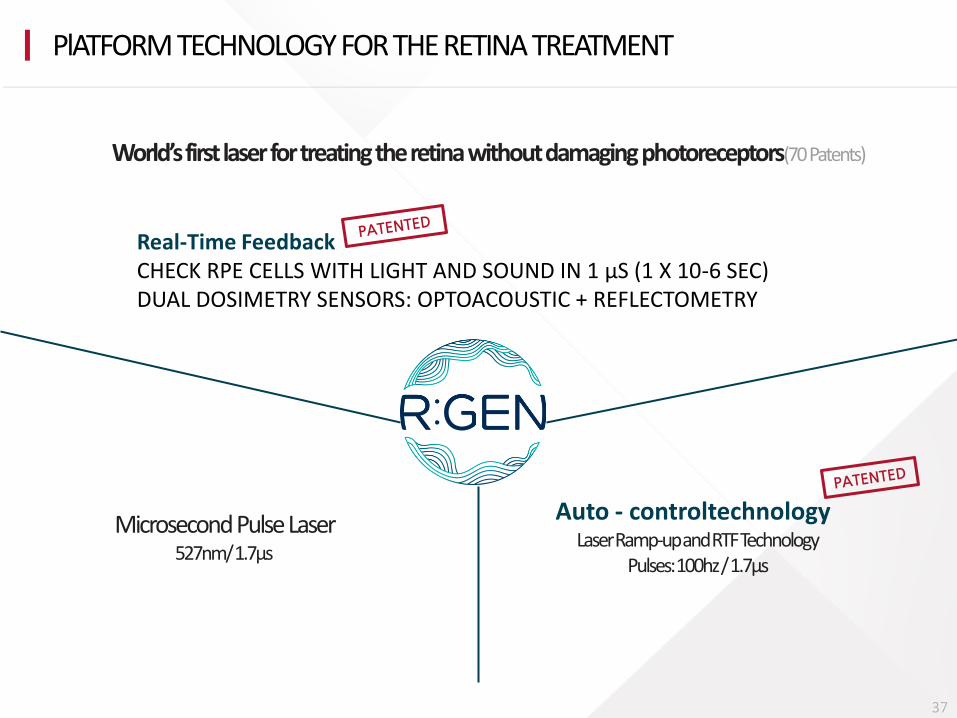
Microsecond Pulse Laser 527nm/ 1.7µs
PlATFORM TECHNOLOGY FOR THE RETINA TREATMENT
37
Auto - controltechnology Laser Ramp-up and RTF Technology
Pulses: 100hz / 1.7µs
Real-Time Feedback CHECK RPE CELLS WITH LIGHT AND SOUND IN 1 µS (1 X 10⁻⁶ SEC) DUAL DOSIMETRY SENSORS: OPTOACOUSTIC + REFLECTOMETRY
World’s first laser for treating the retina without damaging photoreceptors(70 Patents)
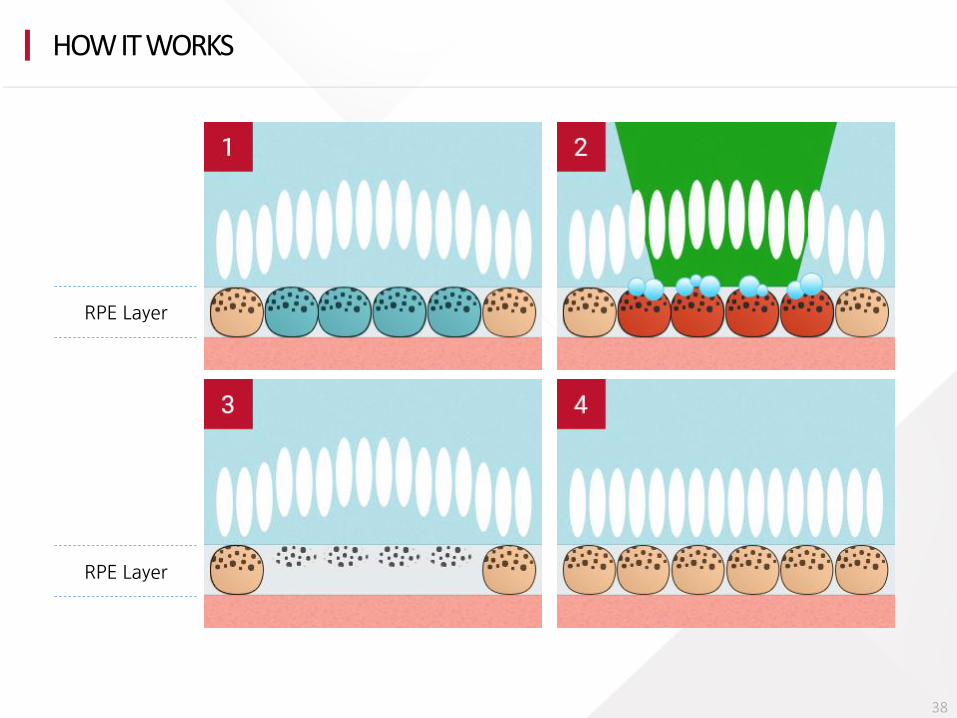
HOW IT WORKS
RPE Layer
RPE Layer
38
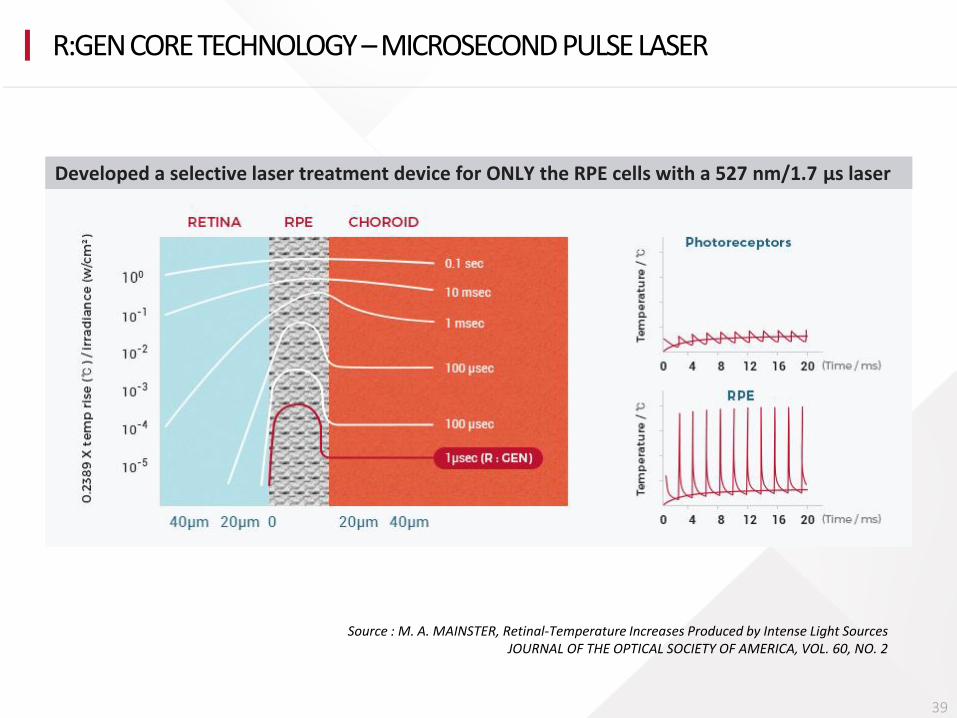
R:GEN CORE TECHNOLOGY – MICROSECOND PULSE LASER
Developed a selective laser treatment device for ONLY the RPE cells with a 527 nm/1.7 μs laser
Source : M. A. MAINSTER, Retinal-Temperature Increases Produced by Intense Light Sources JOURNAL OF THE OPTICAL SOCIETY OF AMERICA, VOL. 60, NO. 2
39
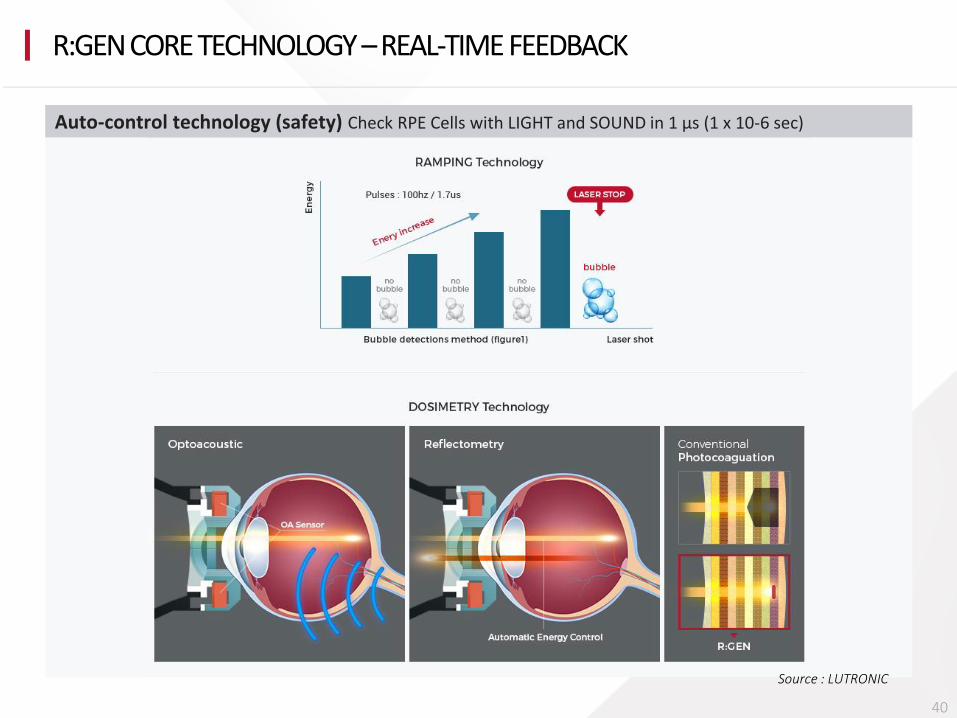
R:GEN CORE TECHNOLOGY – REAL-TIME FEEDBACK
Auto-control technology (safety) Check RPE Cells with LIGHT and SOUND in 1 µs (1 x 10⁻⁶ sec)
Source : LUTRONIC
40
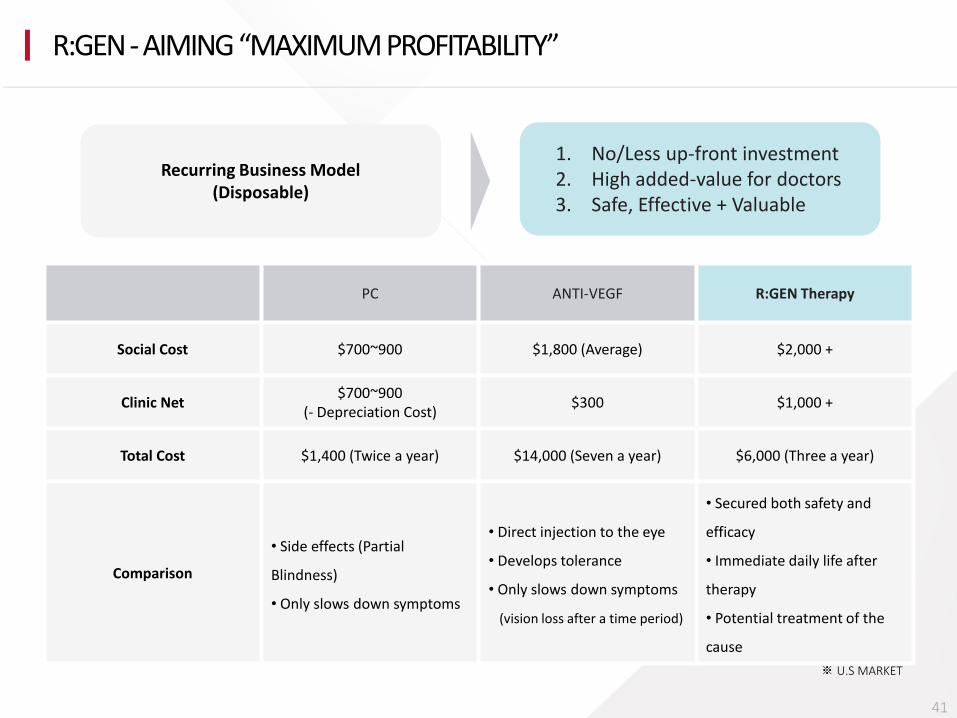
R:GEN - AIMING “MAXIMUM PROFITABILITY”
Recurring Business Model (Disposable)
1. No/Less up-front investment 2. High added-value for doctors 3. Safe, Effective + Valuable
※ U.S MARKET
41
PC ANTI-VEGF R:GEN Therapy
Social Cost $700~900 $1,800 (Average) $2,000 +
Clinic Net $700~900
(- Depreciation Cost) $300 $1,000 +
Total Cost $1,400 (Twice a year) $14,000 (Seven a year) $6,000 (Three a year)
Comparison
• Side effects (Partial
Blindness)
• Only slows down symptoms
• Direct injection to the eye
• Develops tolerance
• Only slows down symptoms
(vision loss after a time period)
• Secured both safety and
efficacy
• Immediate daily life after
therapy
• Potential treatment of the
cause
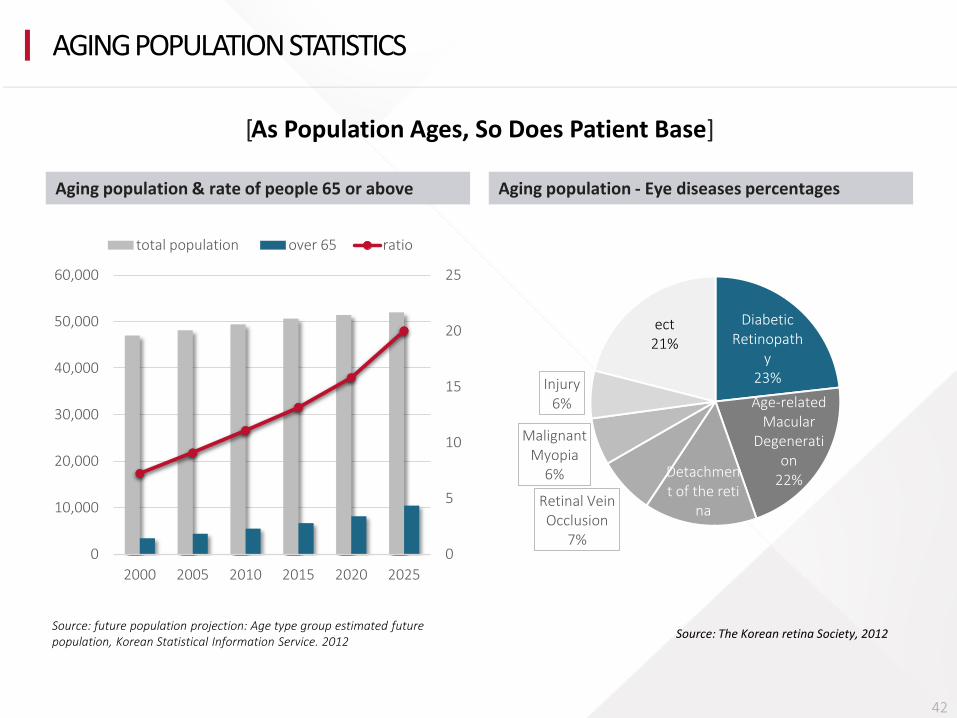
AGING POPULATION STATISTICS
Aging population - Eye diseases percentages Aging population & rate of people 65 or above
0
5
10
15
20
25
0
10,000
20,000
30,000
40,000
50,000
60,000
2000 2005 2010 2015 2020 2025
total population over 65 ratio
Diabetic Retinopath
y 23%
Age-related Macular
Degeneration
22% Detachment of the reti
na 15%
Retinal Vein Occlusion
7%
Malignant Myopia
6%
Injury 6%
ect 21%
Source: The Korean retina Society, 2012 Source: future population projection: Age type group estimated future population, Korean Statistical Information Service. 2012
[As Population Ages, So Does Patient Base]
42

APPENDIX
43
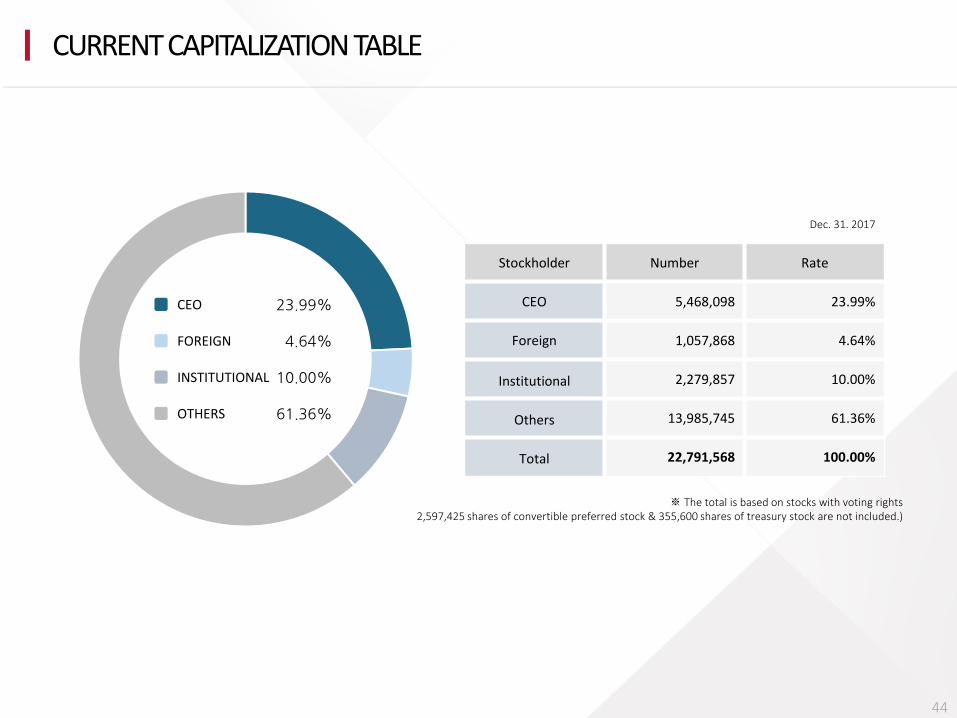
CURRENT CAPITALIZATION TABLE
CEO 23.99%
FOREIGN 4.64%
INSTITUTIONAL 10.00%
OTHERS 61.36%
Stockholder Number Rate
CEO 5,468,098 23.99%
Foreign 1,057,868 4.64%
Institutional 2,279,857 10.00%
Others 13,985,745 61.36%
Total 22,791,568 100.00%
※ The total is based on stocks with voting rights 2,597,425 shares of convertible preferred stock & 355,600 shares of treasury stock are not included.)
Dec. 31. 2017
44
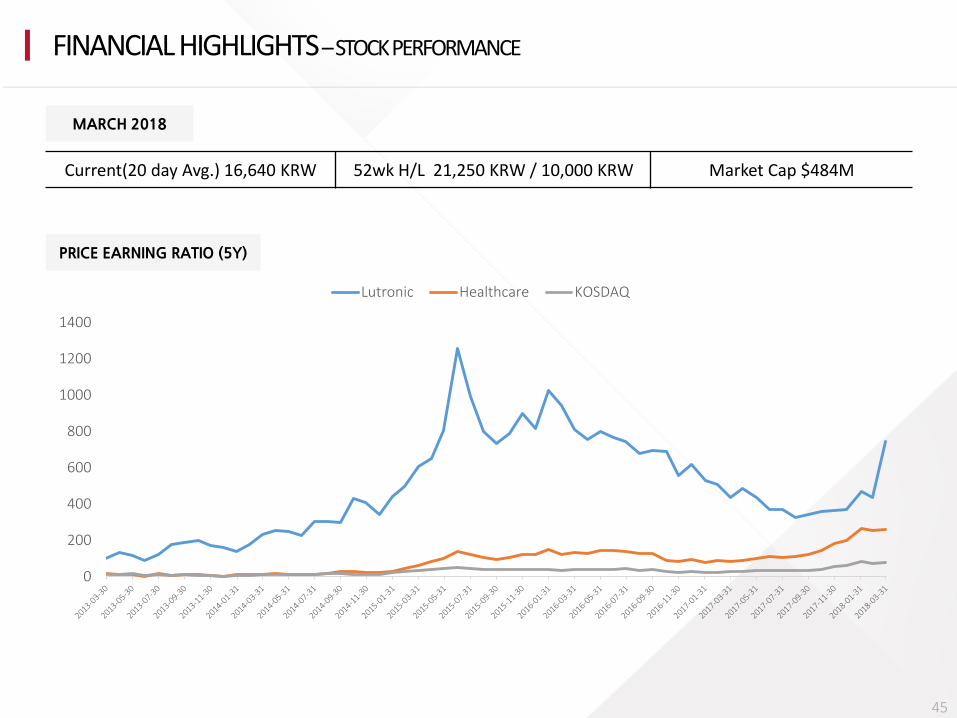
FINANCIAL HIGHLIGHTS – STOCK PERFORMANCE
MARCH 2018
Current(20 day Avg.) 16,640 KRW 52wk H/L 21,250 KRW / 10,000 KRW Market Cap $484M
PRICE EARNING RATIO (5Y)
45
0
200
400
600
800
1000
1200
1400
Lutronic Healthcare KOSDAQ
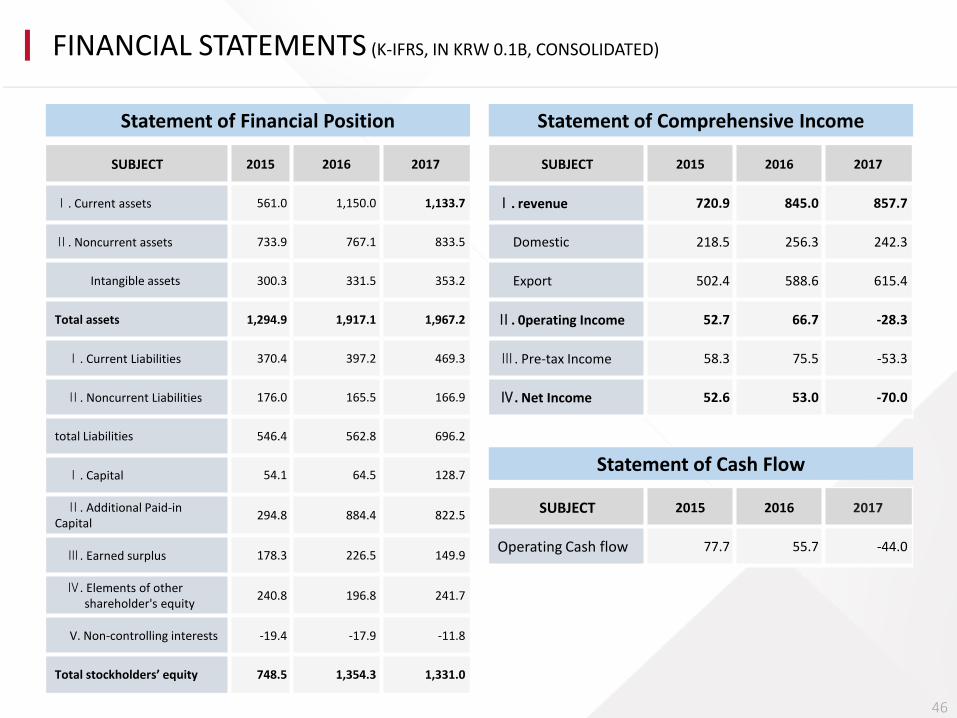
FINANCIAL STATEMENTS (K-IFRS, IN KRW 0.1B, CONSOLIDATED)
SUBJECT 2015 2016 2017
Ⅰ. Current assets 561.0 1,150.0 1,133.7
Ⅱ. Noncurrent assets 733.9 767.1 833.5
Intangible assets 300.3 331.5 353.2
Total assets 1,294.9 1,917.1 1,967.2
Ⅰ. Current Liabilities 370.4 397.2 469.3
Ⅱ. Noncurrent Liabilities 176.0 165.5 166.9
total Liabilities 546.4 562.8 696.2
Ⅰ. Capital 54.1 64.5 128.7
Ⅱ. Additional Paid-in Capital
294.8 884.4 822.5
Ⅲ. Earned surplus 178.3 226.5 149.9
Ⅳ. Elements of other shareholder's equity
240.8 196.8 241.7
V. Non-controlling interests -19.4 -17.9 -11.8
Total stockholders’ equity 748.5 1,354.3 1,331.0
Statement of Comprehensive Income Statement of Financial Position
SUBJECT 2015 2016 2017
Ⅰ. revenue 720.9 845.0 857.7
Domestic 218.5 256.3 242.3
Export 502.4 588.6 615.4
Ⅱ. 0perating Income 52.7 66.7 -28.3
Ⅲ. Pre-tax Income 58.3 75.5 -53.3
Ⅳ. Net Income 52.6 53.0 -70.0
Statement of Cash Flow
SUBJECT 2015 2016 2017
Operating Cash flow 77.7 55.7 -44.0
46
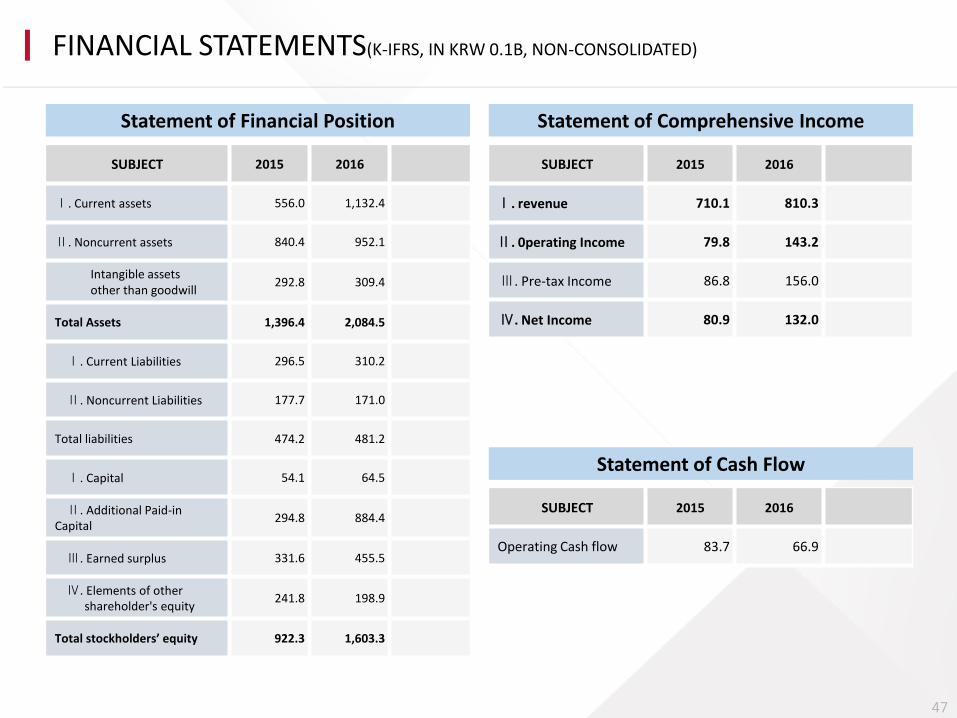
FINANCIAL STATEMENTS(K-IFRS, IN KRW 0.1B, NON-CONSOLIDATED)
SUBJECT 2015 2016
Ⅰ. Current assets 556.0 1,132.4
Ⅱ. Noncurrent assets 840.4 952.1
Intangible assets other than goodwill
292.8 309.4
Total Assets 1,396.4 2,084.5
Ⅰ. Current Liabilities 296.5 310.2
Ⅱ. Noncurrent Liabilities 177.7 171.0
Total liabilities 474.2 481.2
Ⅰ. Capital 54.1 64.5
Ⅱ. Additional Paid-in Capital
294.8 884.4
Ⅲ. Earned surplus 331.6 455.5
Ⅳ. Elements of other shareholder's equity
241.8 198.9
Total stockholders’ equity 922.3 1,603.3
Statement of Comprehensive Income Statement of Financial Position
SUBJECT 2015 2016
Ⅰ. revenue 710.1 810.3
Ⅱ. 0perating Income 79.8 143.2
Ⅲ. Pre-tax Income 86.8 156.0
Ⅳ. Net Income 80.9 132.0
Statement of Cash Flow
SUBJECT 2015 2016
Operating Cash flow 83.7 66.9
47