Embed Size (px)
Citation preview
4Q 2013 Business Results & Outlook
Jan 27, 2014
/ 12
The business results for the forth quarter of 2013 currently under audit
review are presented here for investors’ convenience. Hence, please be
advised that some of their contents may be altered in the course of audit.
The business results are subject to the IFRS(International Financial
Reporting Standards) from 2010. In addition, operating profits are
amended to reflect revisions of “K-IFRS, No. 1001” decided on 19th
regular Financial Services Commission’s meeting on October 17th 2012
and “Guidance for public announcements of business results” reported
by KAI(Korea Accounting Institute) on Feb 18th 2013.
Forecasts and projections contained in this material are based on current
business environments and management’s strategies, and they may
differ from the actual results upon changes and unaccounted variables.
Disclaimer
Table of Contents
Yearly Business Results 4Q 2013 Business Results Divisional Results & Outlook 2014 Business Plan Appendix - Divisional Sales & Operating Profit
- Borrowings & Cash Flow
- CAPEX Plan & Results
- Quarterly Price Trends
- Monthly Price Trends
1
2
4
6
8
/ 12
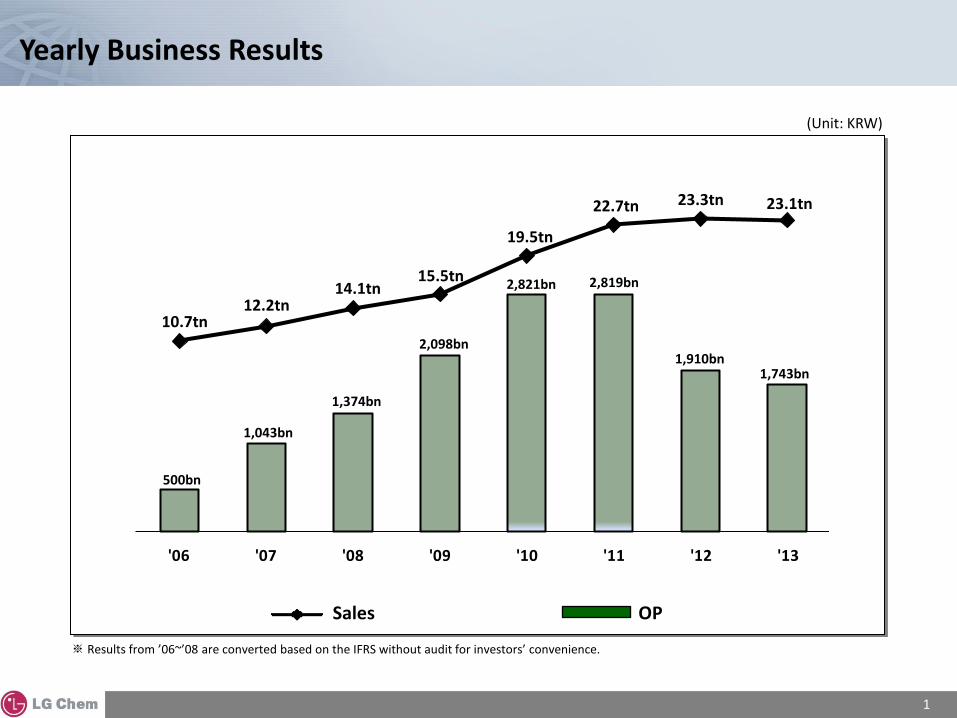
Yearly Business Results
'06 '07 '08 '09 '10 '11 '12 '13
OP Sales
2,819bn
2,098bn
14.1tn
19.5tn
15.5tn
1,374bn
10.7tn
500bn
1,043bn
12.2tn
(Unit: KRW)
※ Results from ’06~’08 are converted based on the IFRS without audit for investors’ convenience.
2,821bn
22.7tn
Sales OP
1,910bn
23.3tn
1
1,743bn
23.1tn
/ 12 2
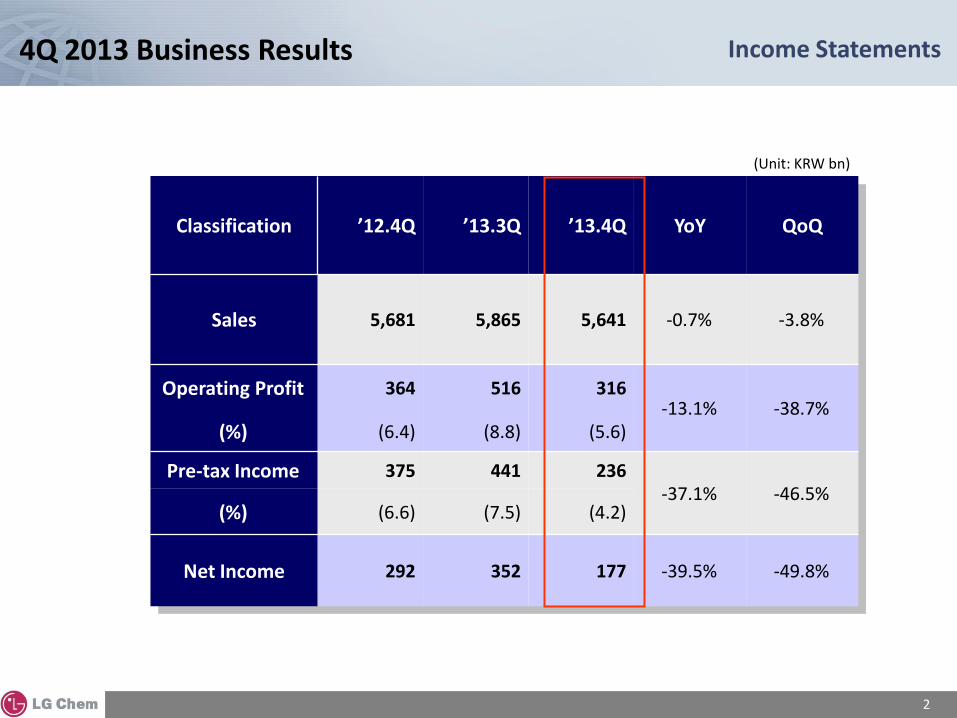
Classification ’12.4Q ’13.3Q ’13.4Q YoY QoQ
Sales 5,681 5,865 5,641 -0.7% -3.8%
Operating Profit 364 516 316 -13.1% -38.7%
(%) (6.4) (8.8) (5.6)
Pre-tax Income 375 441 236 -37.1% -46.5%
(%) (6.6) (7.5) (4.2)
Net Income 292 352 177 -39.5% -49.8%
4Q 2013 Business Results Income Statements
(Unit: KRW bn)

/ 12
Classification ’12 ’13 Change
Asset 16,581 17,447 5.2%
Cash and equivalents 1,341 1,909 42.4%
Liabilities 5,816 5,721 -1.6%
Borrowings 2,947 3,011 2.2%
Shareholder’s
Equity 10,765 11,726 8.9%
Financial Position
EBITDA 2,784 2,762
Classification ’12 ’13 Change
Total Liabilities/
Equity (%) 54.0 48.8 -5.2%p
Borrowings / Equity (%)
27.4 25.7 -1.7%p
Interest Coverage Ratio (x)
26.2 26.7 0.5
ROE (%) 14.7 11.3 -3.4%p
ROA (%) 9.5 7.5 -2.0%p
Financial Ratios
4Q 2013 Business Results Financial Position
(Unit: KRW bn)
3
/ 12
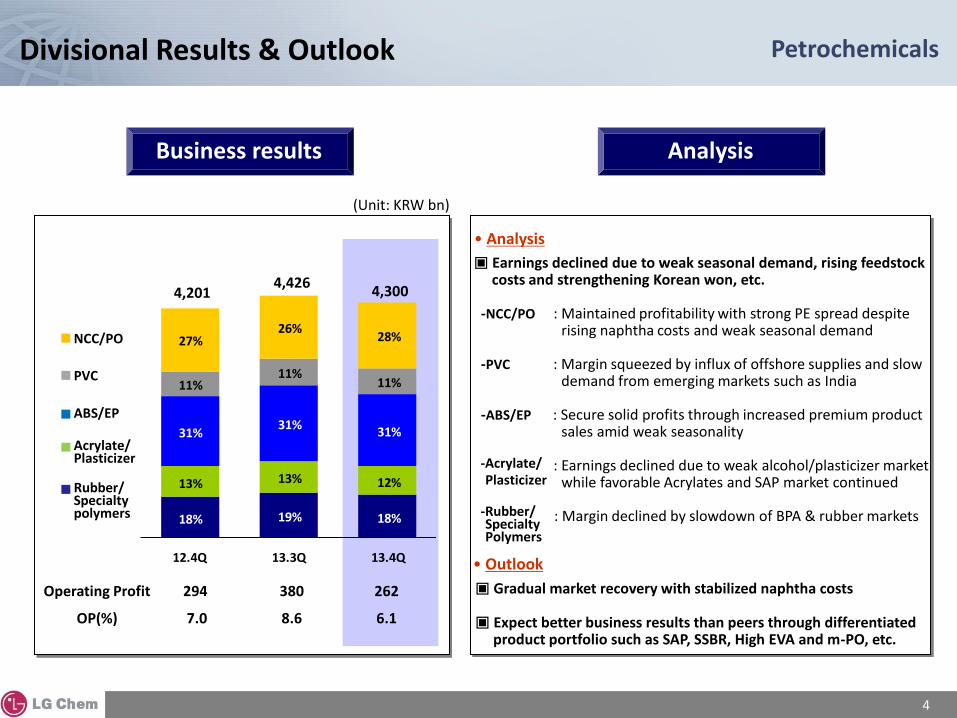
Business results Analysis
Divisional Results & Outlook Petrochemicals
(Unit: KRW bn)
Operating Profit 294 380 262
OP(%) 7.0 8.6 6.1
• Analysis
4
Rubber/ Specialty polymers
NCC/PO
PVC
Acrylate/ Plasticizer
ABS/EP
18% 19% 18%
13% 13% 12%
31%31%
31%
11%11%
11%
27%26%
28%
12.4Q 13.3Q 13.4Q
4,201 4,426
4,300
• Outlook
▣ Earnings declined due to weak seasonal demand, rising feedstock costs and strengthening Korean won, etc. -NCC/PO : Maintained profitability with strong PE spread despite rising naphtha costs and weak seasonal demand -PVC : Margin squeezed by influx of offshore supplies and slow demand from emerging markets such as India -ABS/EP : Secure solid profits through increased premium product sales amid weak seasonality : Earnings declined due to weak alcohol/plasticizer market while favorable Acrylates and SAP market continued : Margin declined by slowdown of BPA & rubber markets
-Acrylate/ Plasticizer
-Rubber/ Specialty Polymers
▣ Gradual market recovery with stabilized naphtha costs ▣ Expect better business results than peers through differentiated product portfolio such as SAP, SSBR, High EVA and m-PO, etc.
/ 12
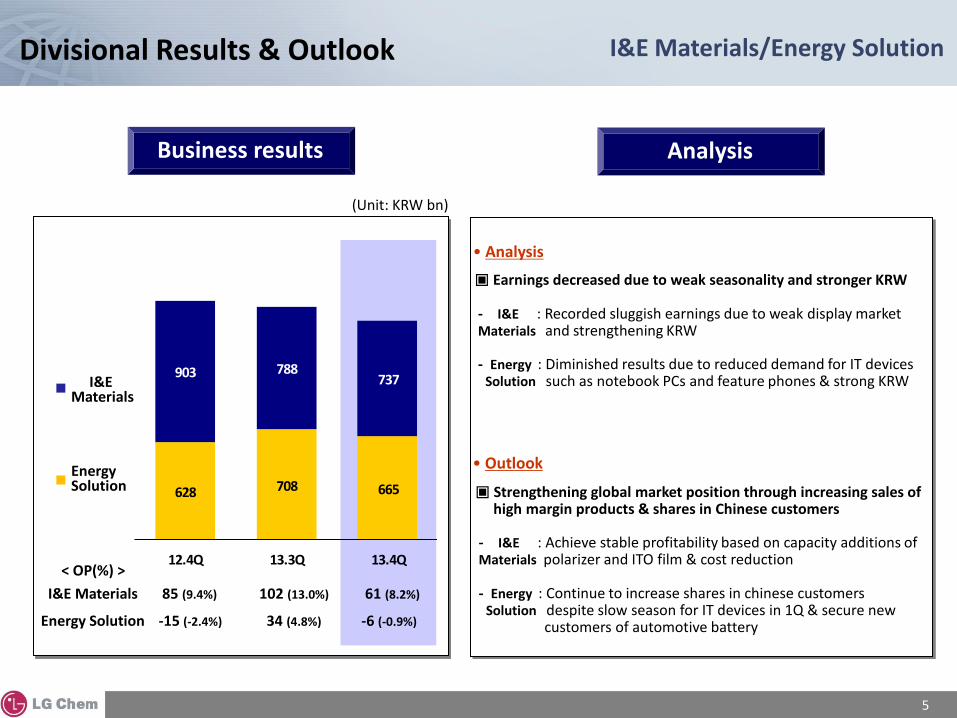
Business results Analysis
Divisional Results & Outlook I&E Materials/Energy Solution
(Unit: KRW bn)
• Analysis
• Outlook
5
I&E Materials
I&E Materials 85 (9.4%) 102 (13.0%) 61 (8.2%)
Energy Solution -15 (-2.4%) 34 (4.8%) -6 (-0.9%)
628 708 665
903 788737
12.4Q 13.3Q 13.4Q
Energy Solution
< OP(%) >
▣ Earnings decreased due to weak seasonality and stronger KRW - I&E : Recorded sluggish earnings due to weak display market Materials and strengthening KRW
- Energy : Diminished results due to reduced demand for IT devices Solution such as notebook PCs and feature phones & strong KRW
▣ Strengthening global market position through increasing sales of high margin products & shares in Chinese customers
- I&E : Achieve stable profitability based on capacity additions of Materials polarizer and ITO film & cost reduction - Energy : Continue to increase shares in chinese customers Solution despite slow season for IT devices in 1Q & secure new customers of automotive battery
/ 12 7
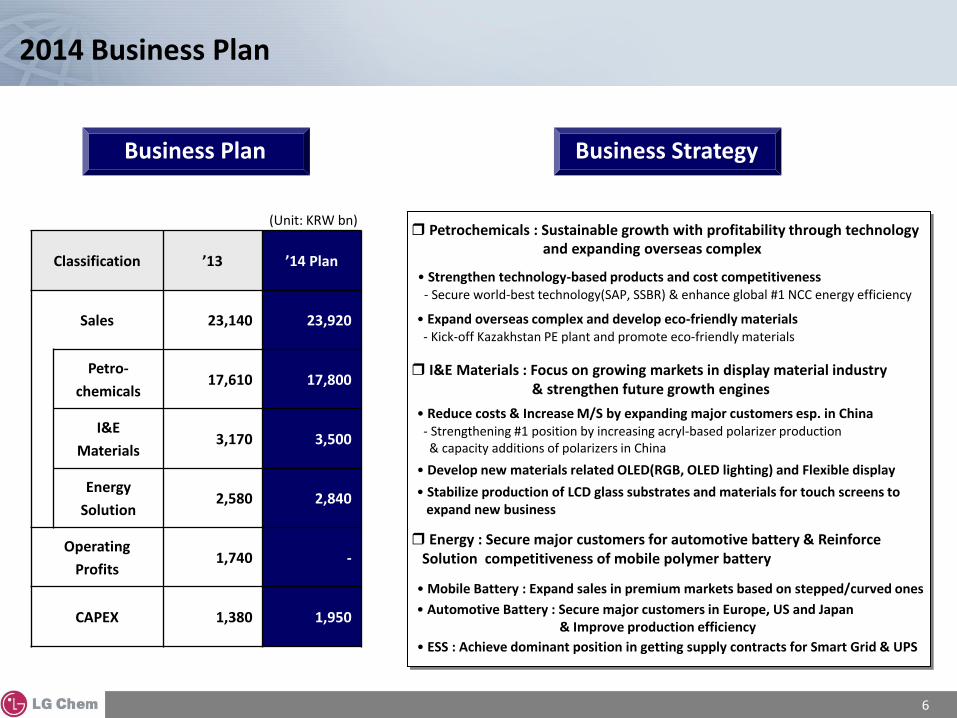
I&E Materials : Focus on growing markets in display material industry & strengthen future growth engines
• Reduce costs & Increase M/S by expanding major customers esp. in China - Strengthening #1 position by increasing acryl-based polarizer production & capacity additions of polarizers in China
Energy : Secure major customers for automotive battery & Reinforce Solution competitiveness of mobile polymer battery
• Mobile Battery : Expand sales in premium markets based on stepped/curved ones
• Automotive Battery : Secure major customers in Europe, US and Japan & Improve production efficiency
• Strengthen technology-based products and cost competitiveness - Secure world-best technology(SAP, SSBR) & enhance global #1 NCC energy efficiency
Petrochemicals : Sustainable growth with profitability through technology and expanding overseas complex
Business Plan
2014 Business Plan
(Unit: KRW bn)
Business Strategy
Classification ’13 ’14 Plan
Sales 23,140 23,920
Petro-
chemicals 17,610 17,800
I&E
Materials 3,170 3,500
Energy
Solution 2,580 2,840
Operating
Profits 1,740 -
CAPEX 1,380 1,950
• Develop new materials related OLED(RGB, OLED lighting) and Flexible display
6
• Stabilize production of LCD glass substrates and materials for touch screens to expand new business
• ESS : Achieve dominant position in getting supply contracts for Smart Grid & UPS
• Expand overseas complex and develop eco-friendly materials - Kick-off Kazakhstan PE plant and promote eco-friendly materials
/ 12
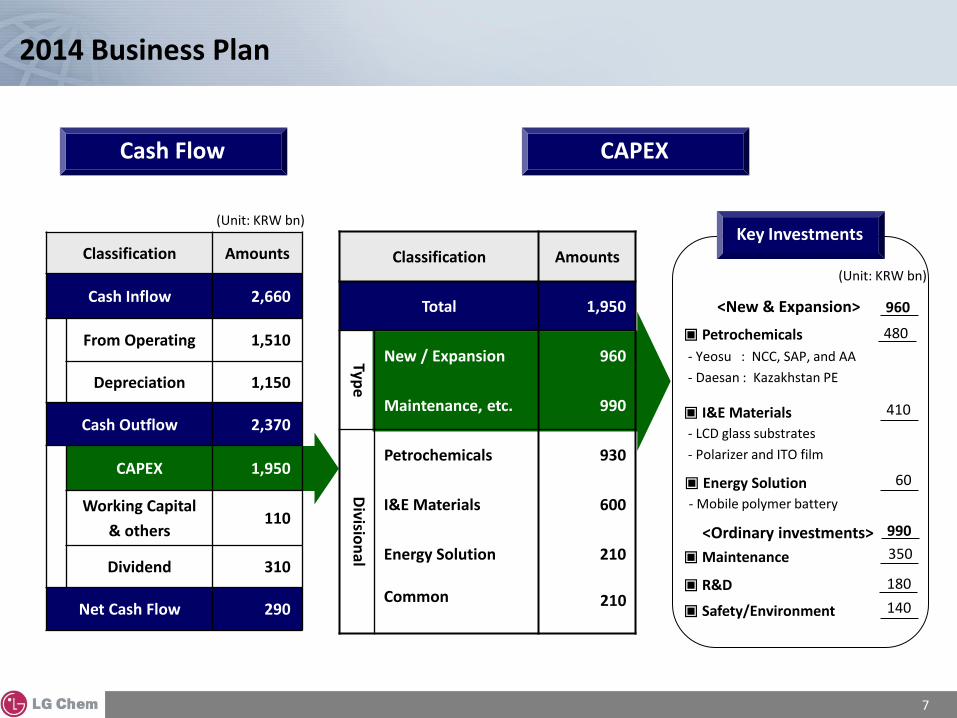
CAPEX Cash Flow
Classification Amounts
Cash Inflow 2,660
From Operating 1,510
Depreciation 1,150
Cash Outflow 2,370
CAPEX 1,950
Working Capital
& others 110
Dividend 310
Net Cash Flow 290
Key Investments
▣ Petrochemicals 480
▣ I&E Materials 410
Classification Amounts
Total 1,950
Type
New / Expansion 960
Maintenance, etc. 990
Divisio
nal
Petrochemicals 930
I&E Materials 600
Energy Solution 210
Common
2014 Business Plan
(Unit: KRW bn)
(Unit: KRW bn)
- Yeosu : NCC, SAP, and AA
- Daesan : Kazakhstan PE
210
- LCD glass substrates
- Polarizer and ITO film
▣ Energy Solution 60
- Mobile polymer battery
7
<New & Expansion>
<Ordinary investments>
▣ Maintenance 350
▣ R&D 180
▣ Safety/Environment 140
960
990
/ 12
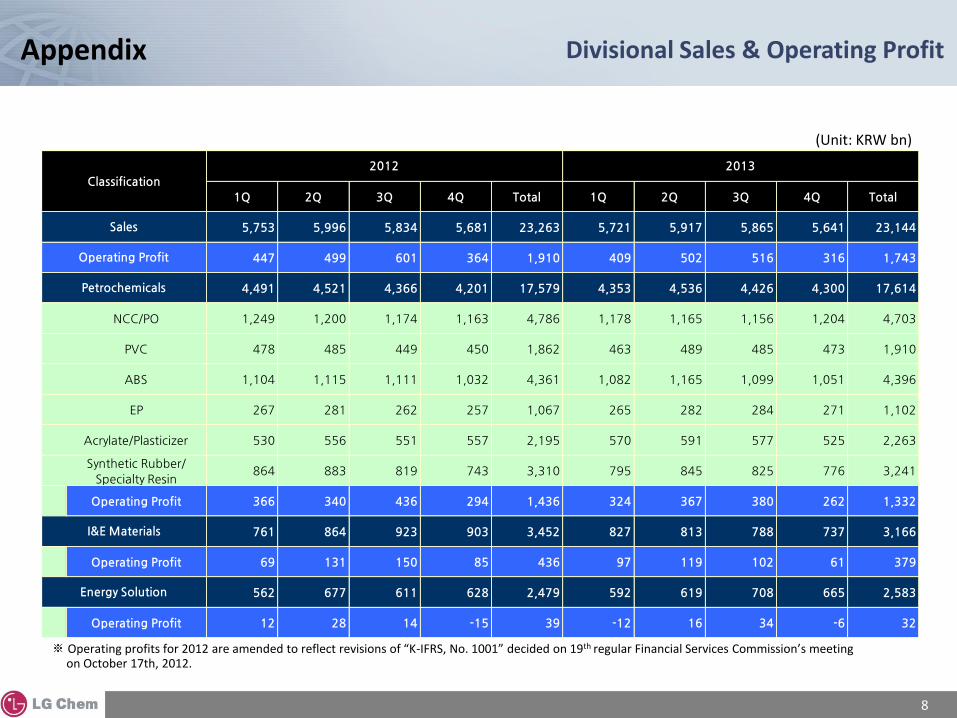
Appendix Divisional Sales & Operating Profit
8
(Unit: KRW bn)
※ Operating profits for 2012 are amended to reflect revisions of “K-IFRS, No. 1001” decided on 19th regular Financial Services Commission’s meeting on October 17th, 2012.
1Q 2Q 3Q 4Q Total 1Q 2Q 3Q 4Q Total
5,753 5,996 5,834 5,681 23,263 5,721 5,917 5,865 5,641 23,144
447 499 601 364 1,910 409 502 516 316 1,743
4,491 4,521 4,366 4,201 17,579 4,353 4,536 4,426 4,300 17,614
NCC/PO 1,249 1,200 1,174 1,163 4,786 1,178 1,165 1,156 1,204 4,703
PVC 478 485 449 450 1,862 463 489 485 473 1,910
ABS 1,104 1,115 1,111 1,032 4,361 1,082 1,165 1,099 1,051 4,396
EP 267 281 262 257 1,067 265 282 284 271 1,102
Acrylate/Plasticizer 530 556 551 557 2,195 570 591 577 525 2,263
Synthetic Rubber/
Specialty Resin864 883 819 743 3,310 795 845 825 776 3,241
Operating Profit 366 340 436 294 1,436 324 367 380 262 1,332
761 864 923 903 3,452 827 813 788 737 3,166
Operating Profit 69 131 150 85 436 97 119 102 61 379
562 677 611 628 2,479 592 619 708 665 2,583
Operating Profit 12 28 14 -15 39 -12 16 34 -6 32
I&E Materials
Energy Solution
Classification
2012 2013
Sales
Operating Profit
Petrochemicals
/ 12
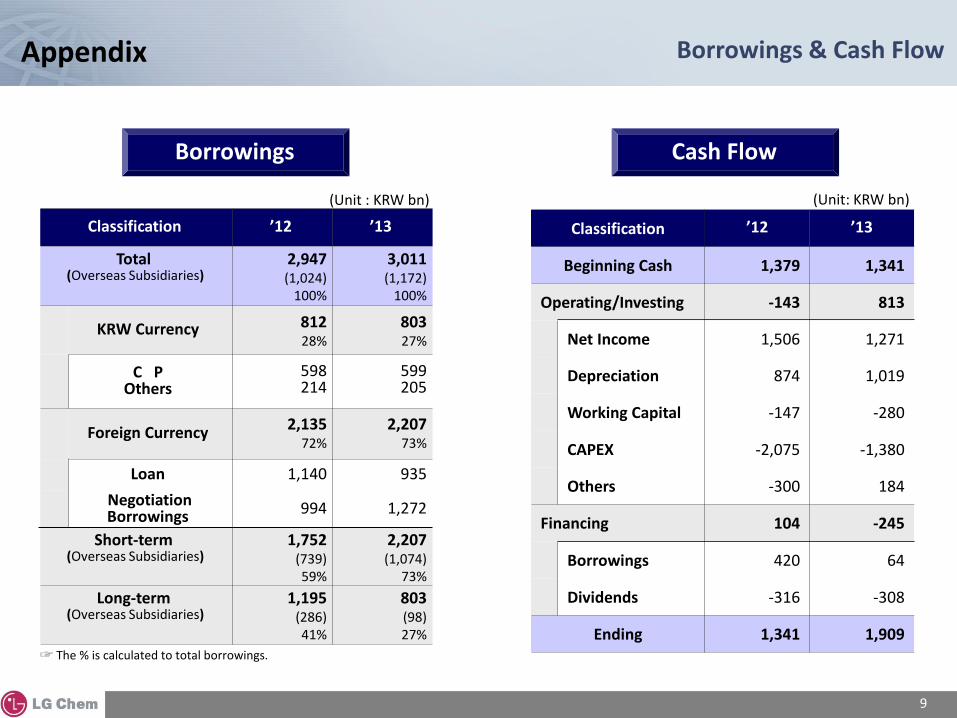
Borrowings
Classification ’12 ’13
Total (Overseas Subsidiaries)
2,947 (1,024)
100%
3,011 (1,172)
100%
KRW Currency 812 28%
803 27%
C P Others
598 214
599 205
Foreign Currency 2,135 72%
2,207 73%
Loan 1,140 935
Negotiation Borrowings 994 1,272
Short-term (Overseas Subsidiaries)
1,752 (739) 59%
2,207 (1,074)
73%
Long-term (Overseas Subsidiaries)
1,195 (286) 41%
803 (98) 27%
(Unit : KRW bn)
Cash Flow
Classification ’12 ’13
Beginning Cash 1,379 1,341
Operating/Investing -143 813
Net Income 1,506 1,271
Depreciation 874 1,019
Working Capital -147 -280
CAPEX -2,075 -1,380
Others -300 184
Financing 104 -245
Borrowings 420 64
Dividends -316 -308
Ending 1,341 1,909
Appendix Borrowings & Cash Flow
(Unit: KRW bn)
9
☞ The % is calculated to total borrowings.
/ 12
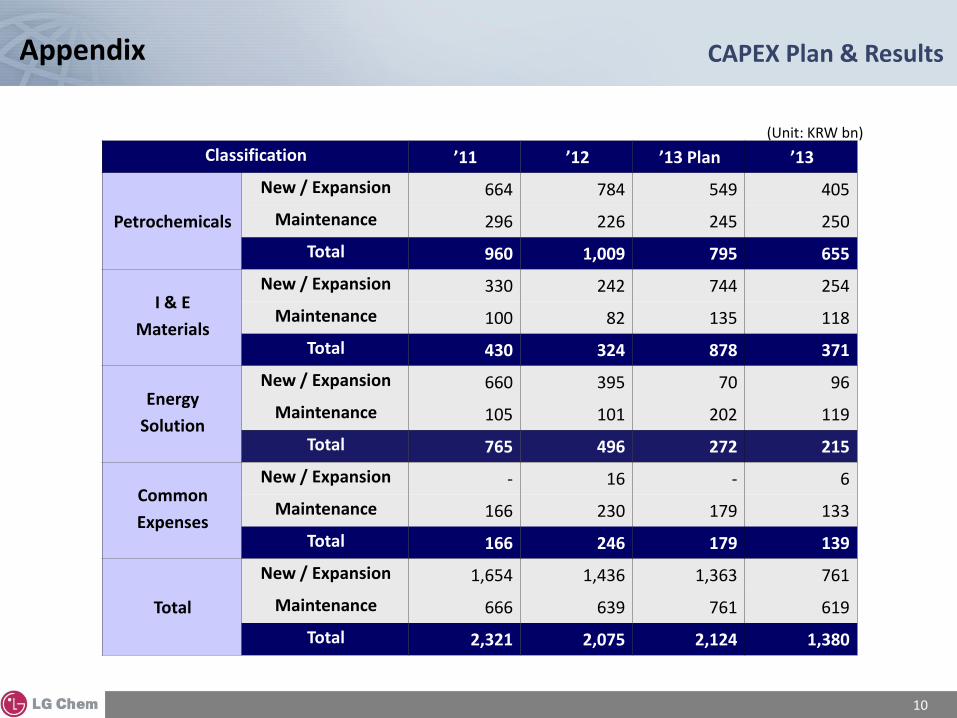
Classification ’11 ’12 ’13 Plan ’13
Petrochemicals
New / Expansion 664 784 549 405
Maintenance 296 226 245 250
Total 960 1,009 795 655
I & E
Materials
New / Expansion 330 242 744 254
Maintenance 100 82 135 118
Total 430 324 878 371
Energy
Solution
New / Expansion 660 395 70 96
Maintenance 105 101 202 119
Total 765 496 272 215
Common
Expenses
New / Expansion - 16 - 6
Maintenance 166 230 179 133
Total 166 246 179 139
Total
New / Expansion 1,654 1,436 1,363 761
Maintenance 666 639 761 619
Total 2,321 2,075 2,124 1,380
Appendix
(Unit: KRW bn)
CAPEX Plan & Results
10
/ 12
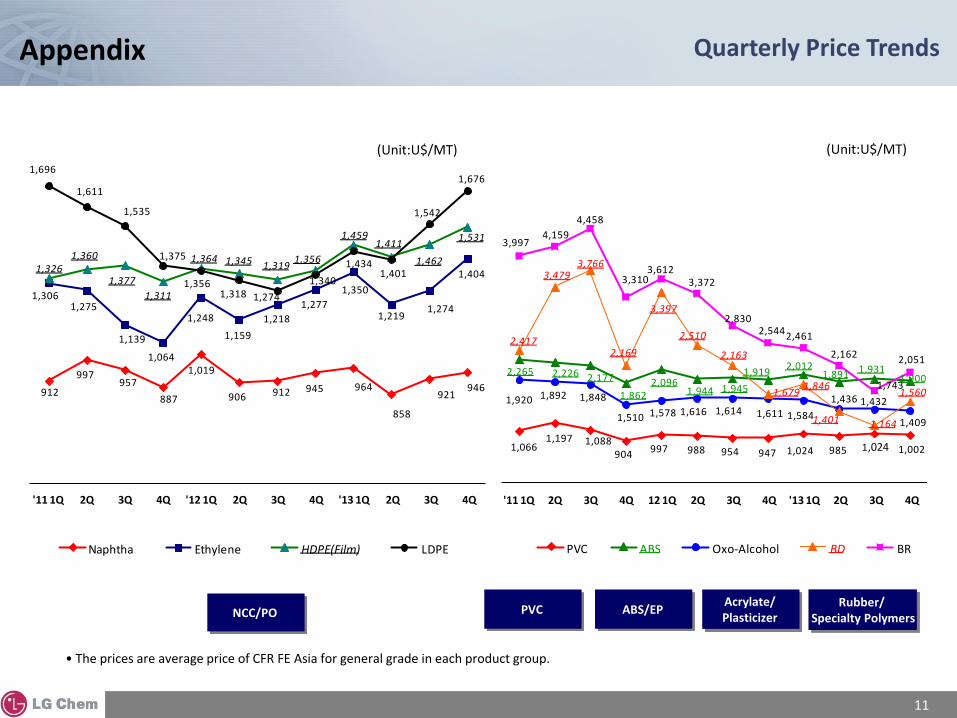
분기별 제품가격 추이 Appendix
• The prices are average price of CFR FE Asia for general grade in each product group.
(Unit:U$/MT) (Unit:U$/MT)
12
Appendix Quarterly Price Trends
11
PVC ABS/EP Acrylate/ Plasticizer
Rubber/ Specialty Polymers NCC/PO
912
997 957
887
1,019
906 912 945 964
858
921 946
1,306 1,275
1,139
1,064
1,248
1,159
1,218
1,277
1,350
1,219 1,274
1,404 1,326 1,360
1,377
1,311
1,364 1,345 1,319 1,356
1,459 1,411
1,462
1,531
1,696
1,611
1,535
1,375
1,3561,318 1,274
1,340
1,4341,401
1,542
1,676
'11 1Q 2Q 3Q 4Q '12 1Q 2Q 3Q 4Q '13 1Q 2Q 3Q 4Q
Naphtha Ethylene HDPE(Film) LDPE
1,066 1,197 1,088
904 997 988 954 947 1,024 985 1,024 1,002
2,265 2,226 2,177
1,862 2,096
1,944 1,945
1,919 2,012
1,891 1,931 1,900
1,920 1,892 1,848
1,510 1,578 1,616 1,614 1,611 1,584
1,436 1,432
1,409
2,417
3,479 3,766
2,169
3,397
2,510
2,163
1,679 1,846
1,401 1,164
1,560
3,997 4,159
4,458
3,310 3,612
3,372
2,830 2,544 2,461
2,162
1,743
2,051
'11 1Q 2Q 3Q 4Q 12 1Q 2Q 3Q 4Q '13 1Q 2Q 3Q 4Q
PVC ABS Oxo-Alcohol BD BR
/ 12
943 961
1,007
923
855 855 864 894
926 944
919 943 976
937
1,356
1,356
1,410
1,284
1,225 1,198
1,233 1,249 1,256
1,316
1,394 1,374
1,445
1,550
1,384
1,454 1,491
1,431 1,395
1,411 1,428
1,448 1,461 1,476 1,511
1,534 1,548 1,540
1,421
1,421 1,464
1,416
1,361
1,390
1,453 1,486
1,551
1,588
1,632 1,676
1,720 1,680
Dec
’12
Jan
’13
Feb Mar Apr May Jun Jul Aug Sep Oct Nov Dec Jan
’14
Naphtha Ethylene HDPE(Film) LDPE
9
• The prices are average price of CFR FE Asia for general grade in each product group.
PVC ABS/EP Acrylate/ Plasticizer
Rubber/ Specialty Polymers NCC/PO
(Unit:U$/MT) (Unit:U$/MT)
Appendix Monthly Price Trends
12 12
* Shows the prices on Jan 17, 2014
955 997 1,046 1,030
973 967 1,015 1,012 1,026 1,033 1,005 985 1,015
1,055
1,938
2,026 2,046 1,965
1,879 1,881 1,913 1,927 1,936 1,930
1,924 1,871 1,905
1,920
1,571 1,597 1,601 1,553
1,510
1,438 1,361
1,421 1,450 1,424
1,422 1,390 1,416
1,430
1,579 1,816
2,060
1,663
1,433
1,469
1,300
941
1,178
1,373
1,682
1,491 1,506 1,510
2,389 2,424 2,488
2,470 2,248
2,164
2,075
1,713 1,709
1,808
2,089 2,065
2,000 2,000
Dec '12
Jan '13
Feb Mar Apr May Jun Jul Aug Sep Oct Nov Dec Jan '14
PVC ABS Oxo-Alcohol BD BR