Embed Size (px)
Citation preview
INTERACTIVE VERSION
4K TV and UHD: the whole picture
What’s inside
UHD forecasts
UHD global status
UHD media consumption
4K and UHD defined
Human vision and viewing distance Perception
UHD technologies
Find out more
1
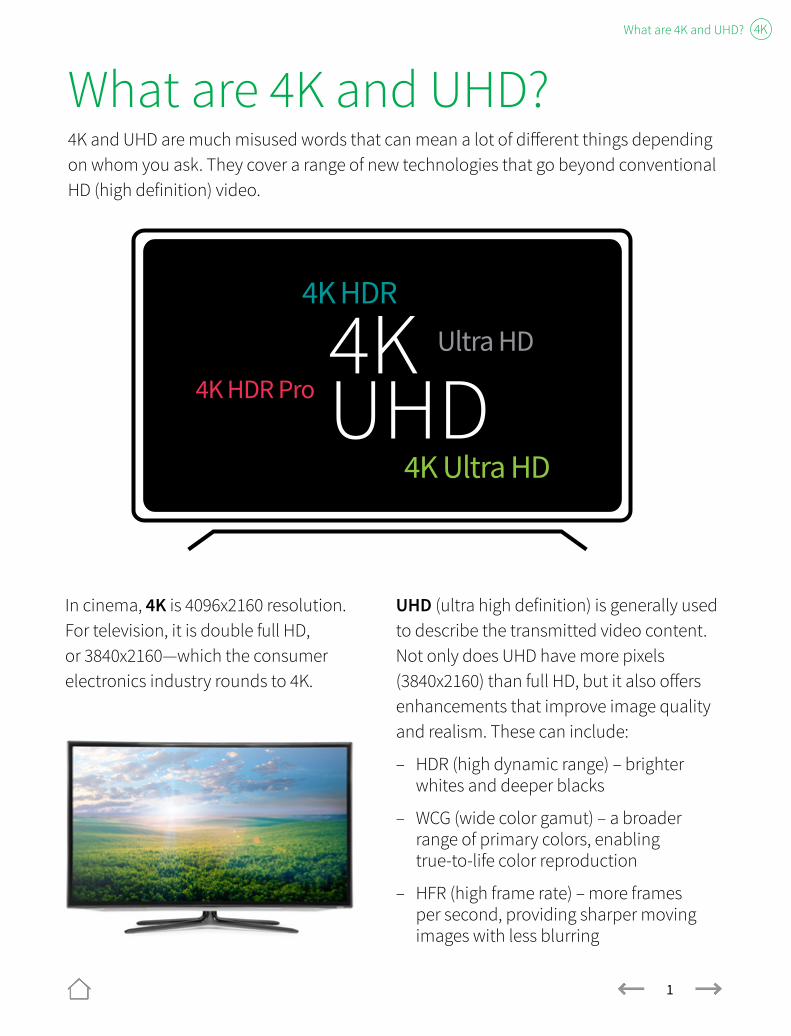
What are 4K and UHD?4K and UHD are much misused words that can mean a lot of different things depending on whom you ask. They cover a range of new technologies that go beyond conventional HD (high definition) video.
In cinema, 4K is 4096x2160 resolution. For television, it is double full HD, or 3840x2160—which the consumer electronics industry rounds to 4K.
UHD (ultra high definition) is generally used to describe the transmitted video content. Not only does UHD have more pixels (3840x2160) than full HD, but it also offers enhancements that improve image quality and realism. These can include:
– HDR (high dynamic range) – brighter whites and deeper blacks
– WCG (wide color gamut) – a broader range of primary colors, enabling true-to-life color reproduction
– HFR (high frame rate) – more frames per second, providing sharper moving images with less blurring
What are 4K and UHD? 4K
4K UHD
Ultra HD
4K HDR
4K HDR Pro
4K Ultra HD
2
Human vision and viewing distance
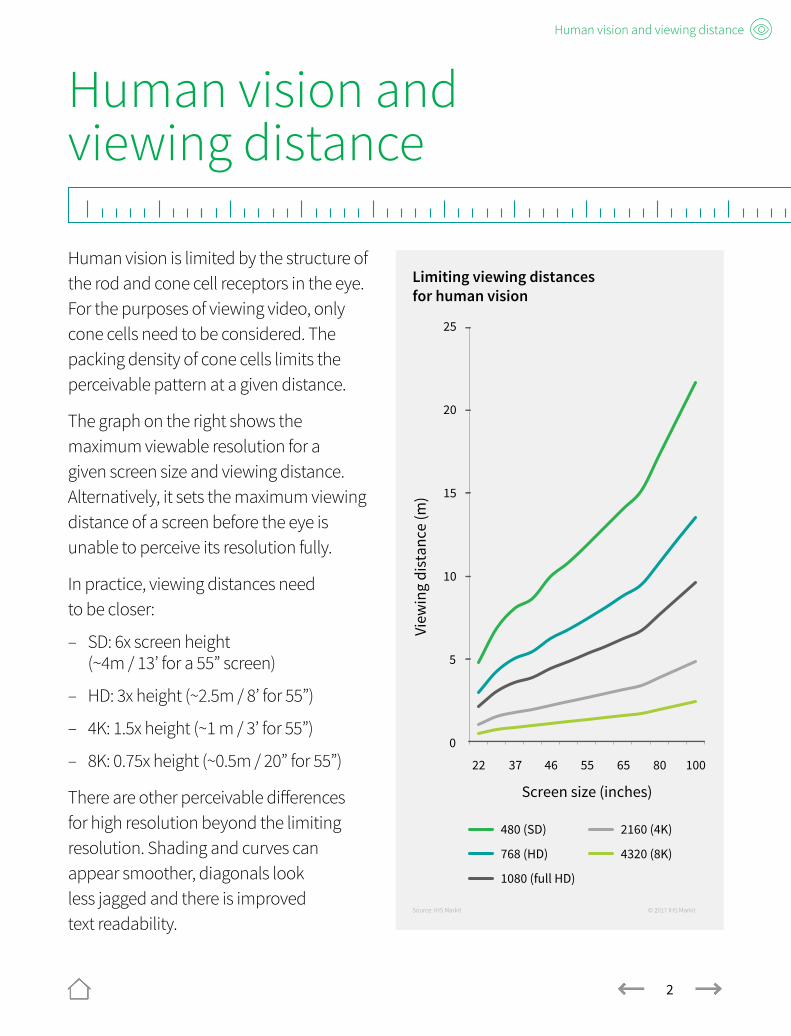
Human vision is limited by the structure of the rod and cone cell receptors in the eye. For the purposes of viewing video, only cone cells need to be considered. The packing density of cone cells limits the perceivable pattern at a given distance.
The graph on the right shows the maximum viewable resolution for a given screen size and viewing distance. Alternatively, it sets the maximum viewing distance of a screen before the eye is unable to perceive its resolution fully.
In practice, viewing distances need to be closer:
– SD: 6x screen height (~4m / 13’ for a 55” screen)
– HD: 3x height (~2.5m / 8’ for 55”)
– 4K: 1.5x height (~1 m / 3’ for 55”)
– 8K: 0.75x height (~0.5m / 20” for 55”)
There are other perceivable differences for high resolution beyond the limiting resolution. Shading and curves can appear smoother, diagonals look less jagged and there is improved text readability.
Human vision and viewing distance
0
5
10
15
20
25
22 37 46 55 65 80 100
View
ing
dist
ance
(m)
Screen size (inches)
480 (SD)
768 (HD)
1080 (full HD)
2160 (4K)
4320 (8K)
Source: IHS Markit © 2017 IHS Markit
Limiting viewing distancesfor human vision
3
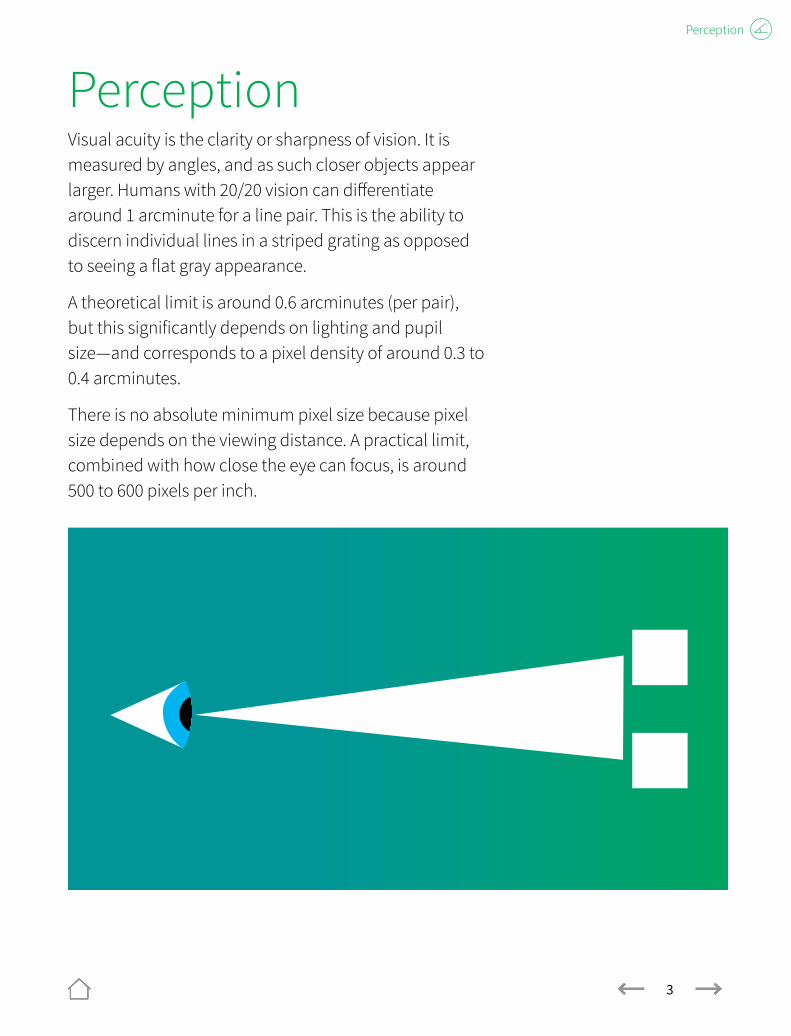
PerceptionVisual acuity is the clarity or sharpness of vision. It is measured by angles, and as such closer objects appear larger. Humans with 20/20 vision can differentiate around 1 arcminute for a line pair. This is the ability to discern individual lines in a striped grating as opposed to seeing a flat gray appearance.
A theoretical limit is around 0.6 arcminutes (per pair), but this significantly depends on lighting and pupil size—and corresponds to a pixel density of around 0.3 to 0.4 arcminutes.
There is no absolute minimum pixel size because pixel size depends on the viewing distance. A practical limit, combined with how close the eye can focus, is around 500 to 600 pixels per inch.
1 arcminute (0.017 degrees)
Perception

4
UHD technologies
5
UHD technologies
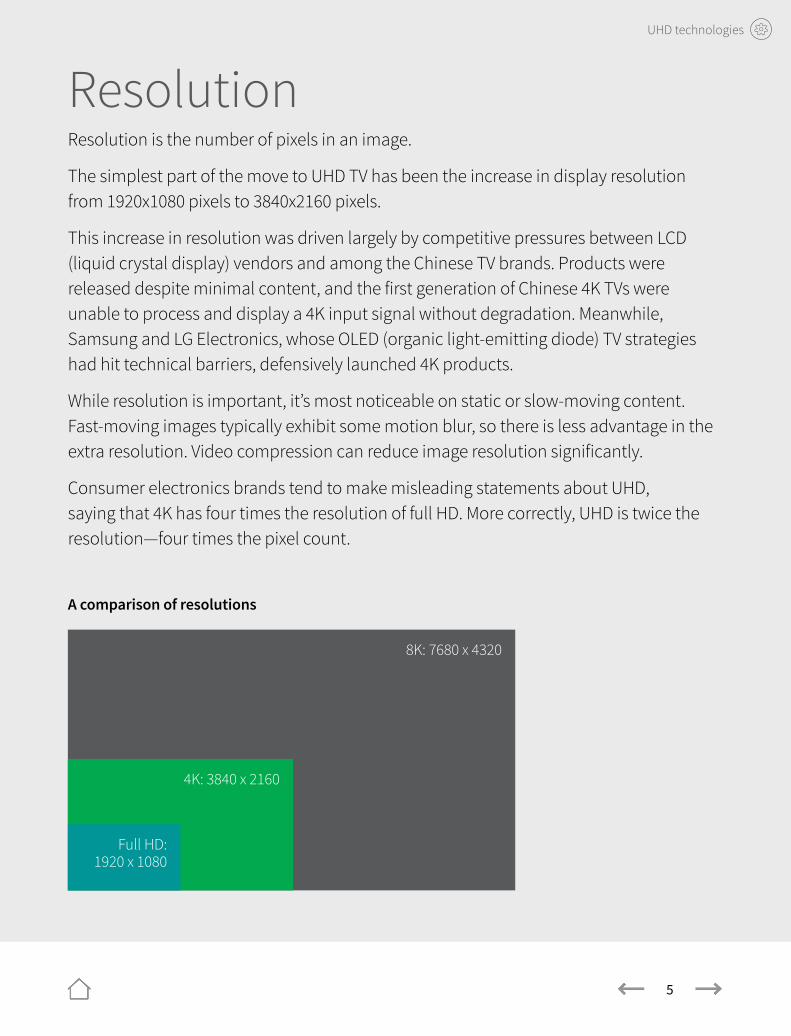
ResolutionResolution is the number of pixels in an image.
The simplest part of the move to UHD TV has been the increase in display resolution from 1920x1080 pixels to 3840x2160 pixels.
This increase in resolution was driven largely by competitive pressures between LCD (liquid crystal display) vendors and among the Chinese TV brands. Products were released despite minimal content, and the first generation of Chinese 4K TVs were unable to process and display a 4K input signal without degradation. Meanwhile, Samsung and LG Electronics, whose OLED (organic light-emitting diode) TV strategies had hit technical barriers, defensively launched 4K products.
While resolution is important, it’s most noticeable on static or slow-moving content. Fast-moving images typically exhibit some motion blur, so there is less advantage in the extra resolution. Video compression can reduce image resolution significantly.
Consumer electronics brands tend to make misleading statements about UHD, saying that 4K has four times the resolution of full HD. More correctly, UHD is twice the resolution—four times the pixel count.
8K: 7680 x 4320
4K: 3840 x 2160
Full HD: 1920 x 1080
A comparison of resolutions
6
UHD technologies
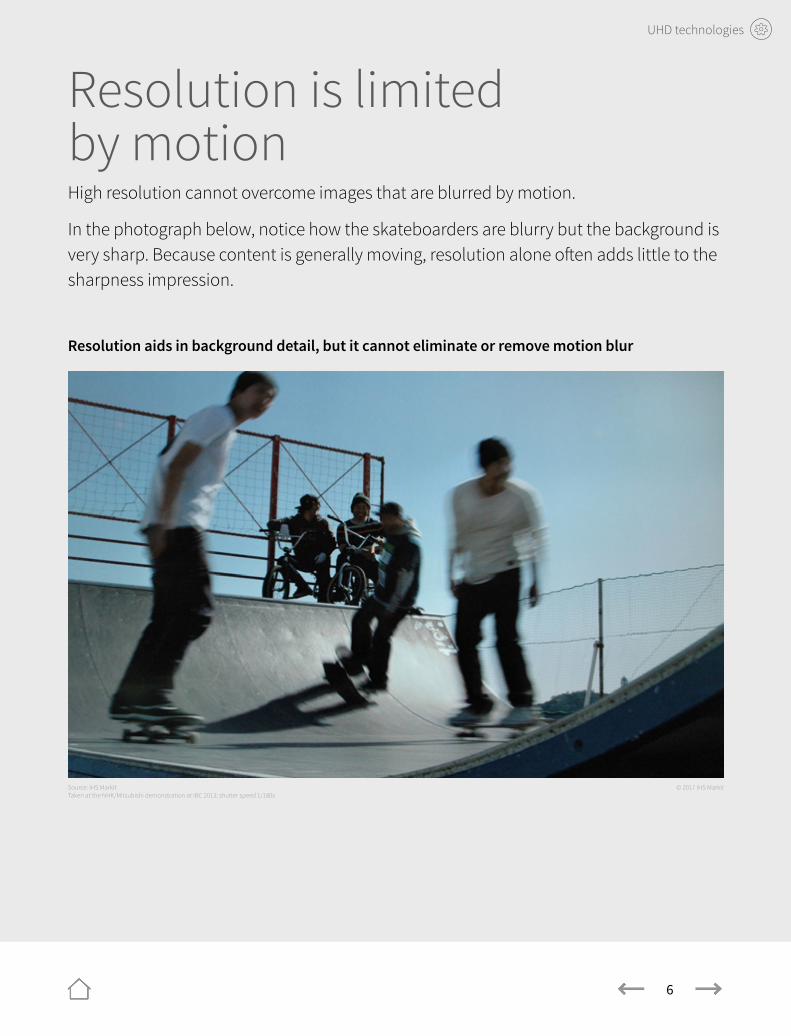
Resolution is limited by motionHigh resolution cannot overcome images that are blurred by motion.
In the photograph below, notice how the skateboarders are blurry but the background is very sharp. Because content is generally moving, resolution alone often adds little to the sharpness impression.
© 2017 IHS MarkitSource: IHS Markit Taken at the NHK/Mitsubishi demonstration at IBC 2013; shutter speed 1/180s
Resolution aids in background detail, but it cannot eliminate or remove motion blur
7
UHD technologies
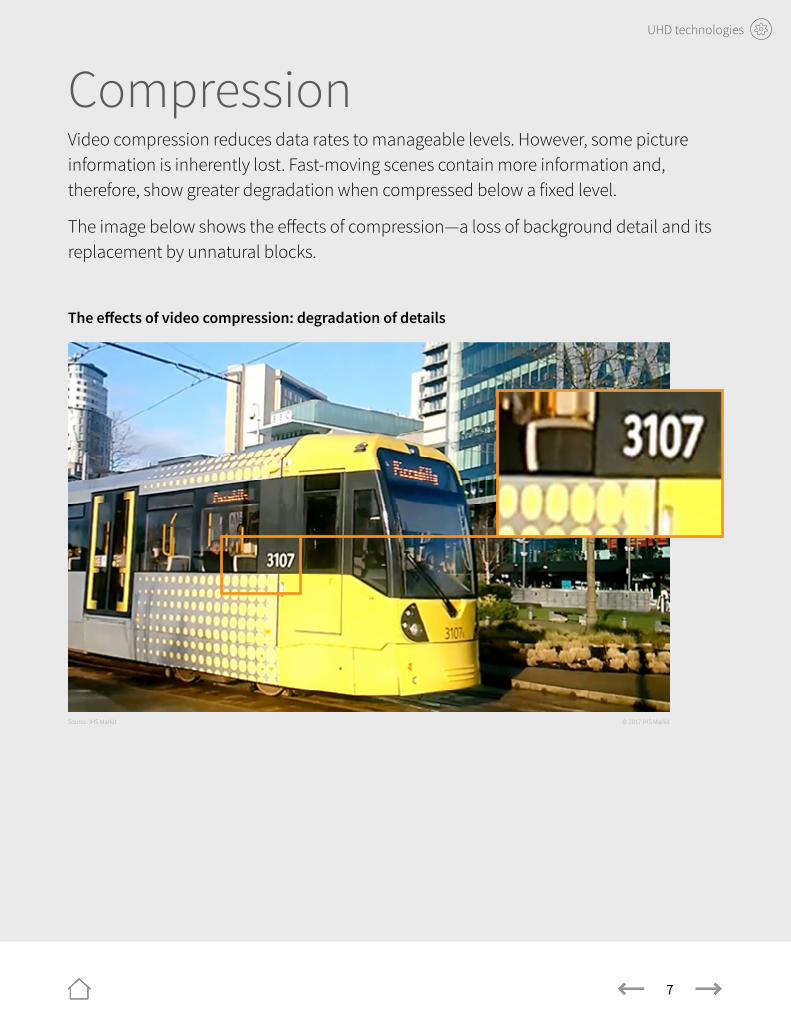
CompressionVideo compression reduces data rates to manageable levels. However, some picture information is inherently lost. Fast-moving scenes contain more information and, therefore, show greater degradation when compressed below a fixed level.
The image below shows the effects of compression—a loss of background detail and its replacement by unnatural blocks.
The effects of video compression: degradation of details
© 2017 IHS MarkitSource: IHS Markit
8
UHD technologies
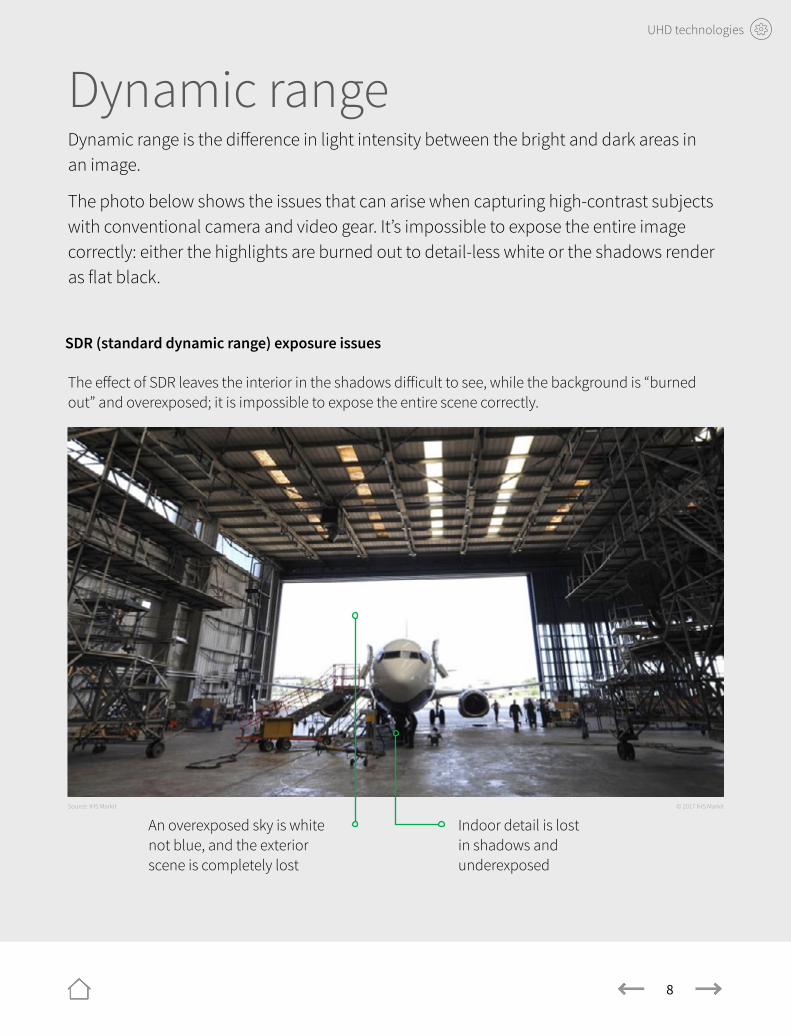
Dynamic rangeDynamic range is the difference in light intensity between the bright and dark areas in an image.
The photo below shows the issues that can arise when capturing high-contrast subjects with conventional camera and video gear. It’s impossible to expose the entire image correctly: either the highlights are burned out to detail-less white or the shadows render as flat black.
The effect of SDR leaves the interior in the shadows difficult to see, while the background is “burned out” and overexposed; it is impossible to expose the entire scene correctly.
An overexposed sky is white not blue, and the exterior scene is completely lost
Indoor detail is lost in shadows and underexposed
© 2017 IHS MarkitSource: IHS Markit
SDR (standard dynamic range) exposure issues
9
UHD technologies
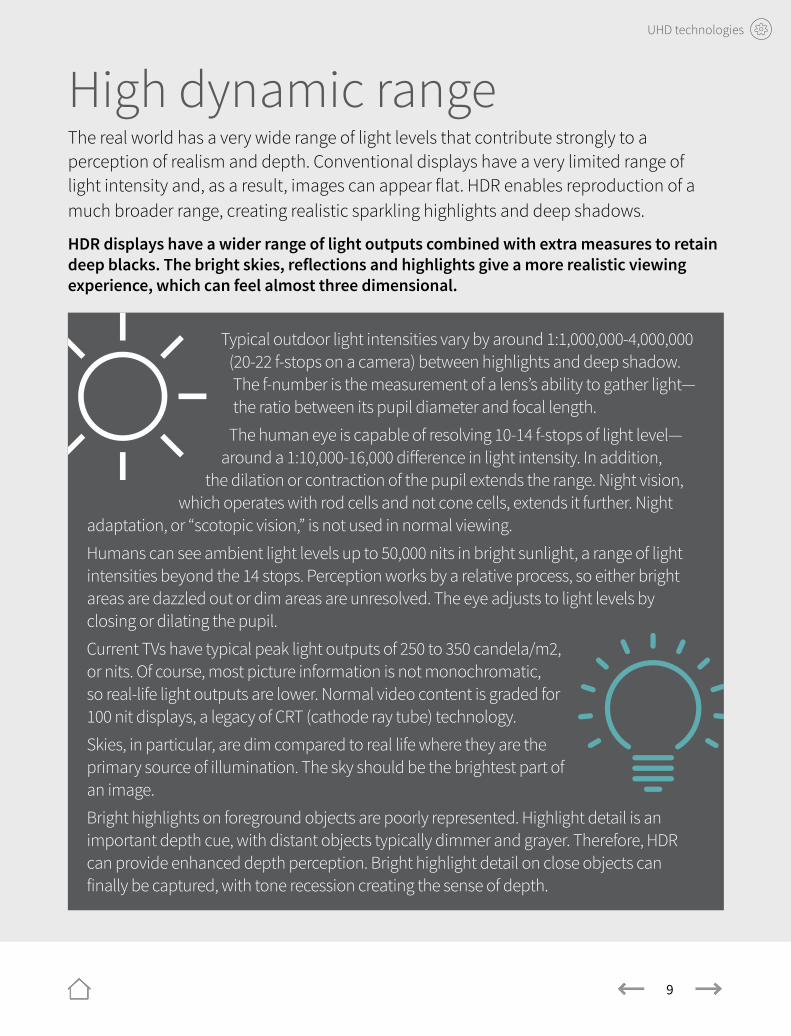
High dynamic rangeThe real world has a very wide range of light levels that contribute strongly to a perception of realism and depth. Conventional displays have a very limited range of light intensity and, as a result, images can appear flat. HDR enables reproduction of a much broader range, creating realistic sparkling highlights and deep shadows.
HDR displays have a wider range of light outputs combined with extra measures to retain deep blacks. The bright skies, reflections and highlights give a more realistic viewing experience, which can feel almost three dimensional.
Typical outdoor light intensities vary by around 1:1,000,000-4,000,000 (20-22 f-stops on a camera) between highlights and deep shadow. The f-number is the measurement of a lens’s ability to gather light—the ratio between its pupil diameter and focal length.
The human eye is capable of resolving 10-14 f-stops of light level—around a 1:10,000-16,000 difference in light intensity. In addition,
the dilation or contraction of the pupil extends the range. Night vision, which operates with rod cells and not cone cells, extends it further. Night
adaptation, or “scotopic vision,” is not used in normal viewing.
Humans can see ambient light levels up to 50,000 nits in bright sunlight, a range of light intensities beyond the 14 stops. Perception works by a relative process, so either bright areas are dazzled out or dim areas are unresolved. The eye adjusts to light levels by closing or dilating the pupil.
Current TVs have typical peak light outputs of 250 to 350 candela/m2, or nits. Of course, most picture information is not monochromatic, so real-life light outputs are lower. Normal video content is graded for 100 nit displays, a legacy of CRT (cathode ray tube) technology.
Skies, in particular, are dim compared to real life where they are the primary source of illumination. The sky should be the brightest part of an image.
Bright highlights on foreground objects are poorly represented. Highlight detail is an important depth cue, with distant objects typically dimmer and grayer. Therefore, HDR can provide enhanced depth perception. Bright highlight detail on close objects can finally be captured, with tone recession creating the sense of depth.
10
UHD technologies
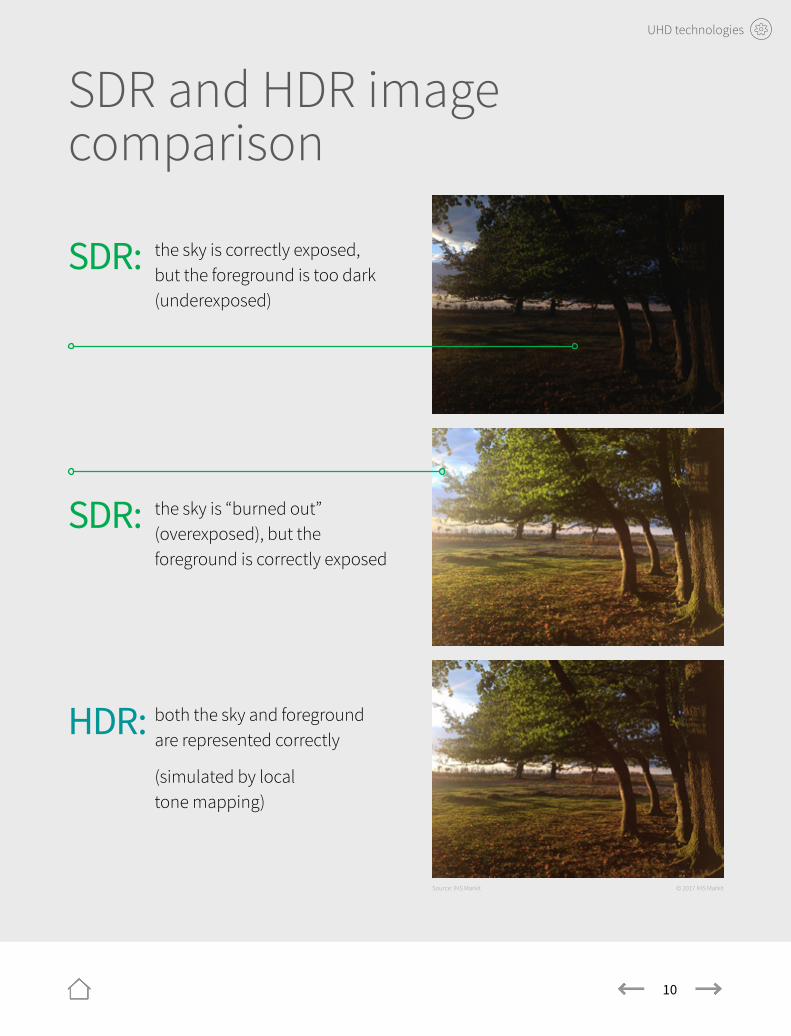
SDR and HDR image comparison
SDR: the sky is correctly exposed, but the foreground is too dark (underexposed)
SDR: the sky is “burned out” (overexposed), but the foreground is correctly exposed
HDR: both the sky and foreground are represented correctly
(simulated by local tone mapping)
© 2017 IHS MarkitSource: IHS Markit
11
UHD technologies
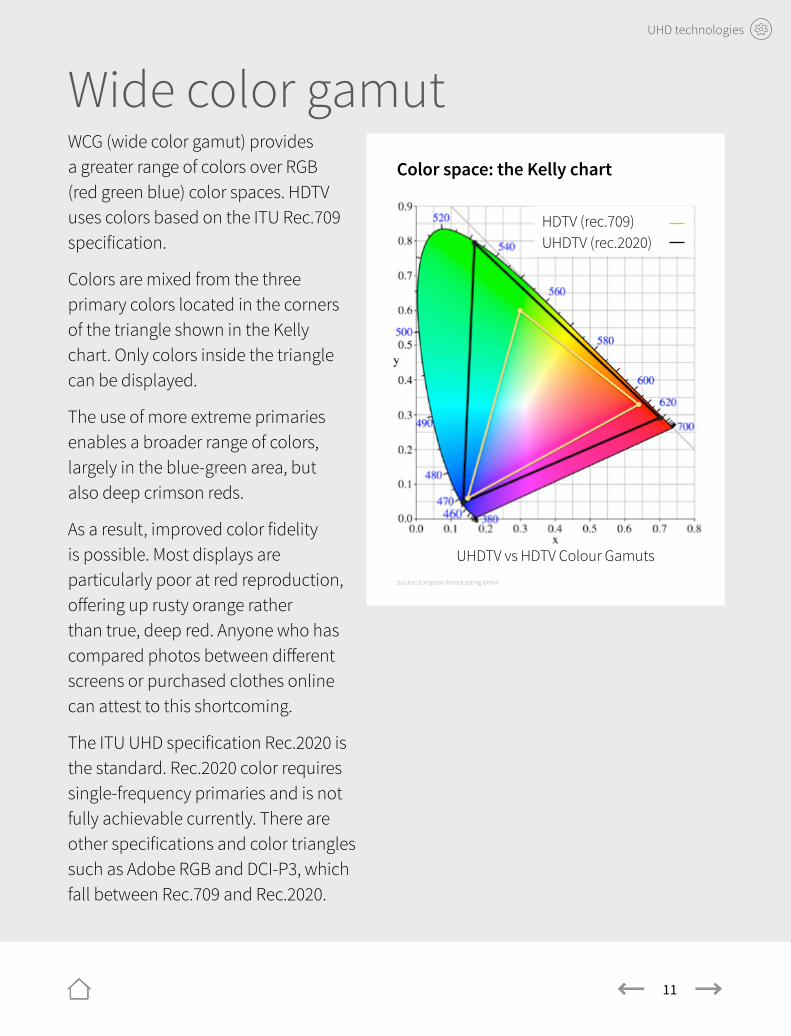
Wide color gamutWCG (wide color gamut) provides a greater range of colors over RGB (red green blue) color spaces. HDTV uses colors based on the ITU Rec.709 specification.
Colors are mixed from the three primary colors located in the corners of the triangle shown in the Kelly chart. Only colors inside the triangle can be displayed.
The use of more extreme primaries enables a broader range of colors, largely in the blue-green area, but also deep crimson reds.
As a result, improved color fidelity is possible. Most displays are particularly poor at red reproduction, offering up rusty orange rather than true, deep red. Anyone who has compared photos between different screens or purchased clothes online can attest to this shortcoming.
The ITU UHD specification Rec.2020 is the standard. Rec.2020 color requires single-frequency primaries and is not fully achievable currently. There are other specifications and color triangles such as Adobe RGB and DCI-P3, which fall between Rec.709 and Rec.2020.
Color space: the Kelly chart
Source: European Broadcasting Union
UHDTV vs HDTV Colour Gamuts
HDTV (rec.709) UHDTV (rec.2020)
12
UHD technologies
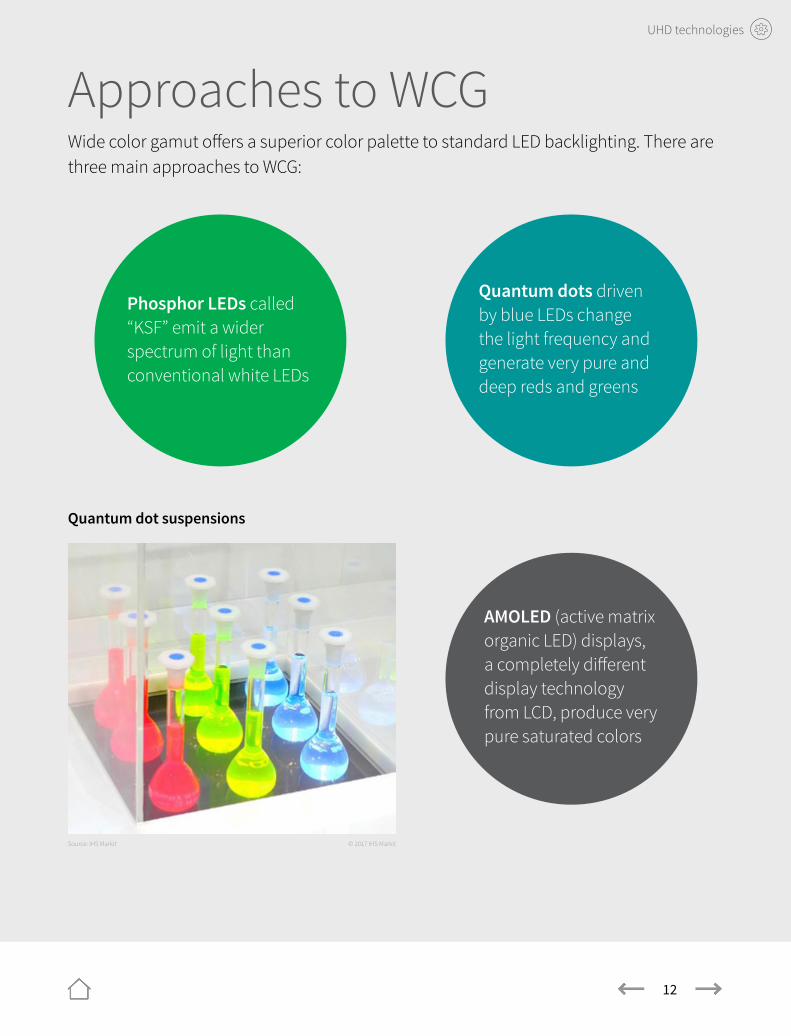
AMOLED (active matrix organic LED) displays, a completely different display technology from LCD, produce very pure saturated colors
Approaches to WCGWide color gamut offers a superior color palette to standard LED backlighting. There are three main approaches to WCG:
Quantum dot suspensions
© 2017 IHS MarkitSource: IHS Markit
Quantum dots driven by blue LEDs change the light frequency and generate very pure and deep reds and greens
Phosphor LEDs called “KSF” emit a wider spectrum of light than conventional white LEDs
13
UHD technologies
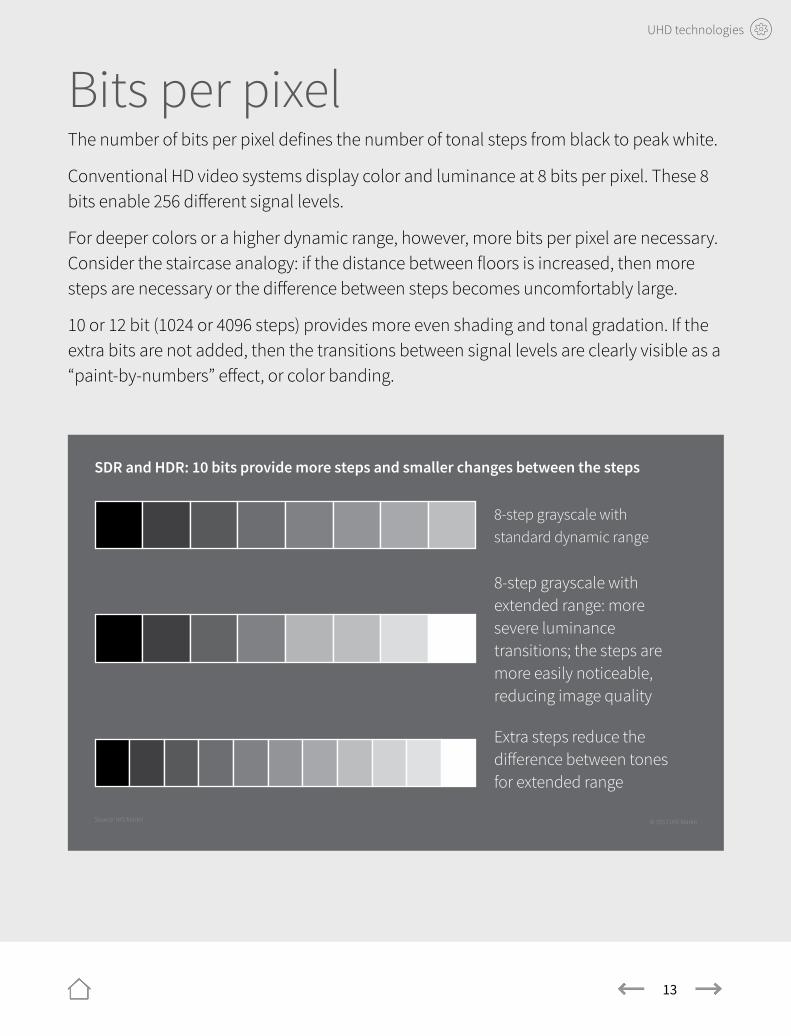
Bits per pixelThe number of bits per pixel defines the number of tonal steps from black to peak white.
Conventional HD video systems display color and luminance at 8 bits per pixel. These 8 bits enable 256 different signal levels.
For deeper colors or a higher dynamic range, however, more bits per pixel are necessary. Consider the staircase analogy: if the distance between floors is increased, then more steps are necessary or the difference between steps becomes uncomfortably large.
10 or 12 bit (1024 or 4096 steps) provides more even shading and tonal gradation. If the extra bits are not added, then the transitions between signal levels are clearly visible as a “paint-by-numbers” effect, or color banding.
SDR and HDR: 10 bits provide more steps and smaller changes between the steps
8-step grayscale with standard dynamic range
8-step grayscale with extended range: more severe luminance transitions; the steps are more easily noticeable, reducing image quality
Extra steps reduce the difference between tones for extended range
© 2017 IHS MarkitSource: IHS Markit
14
UHD technologies
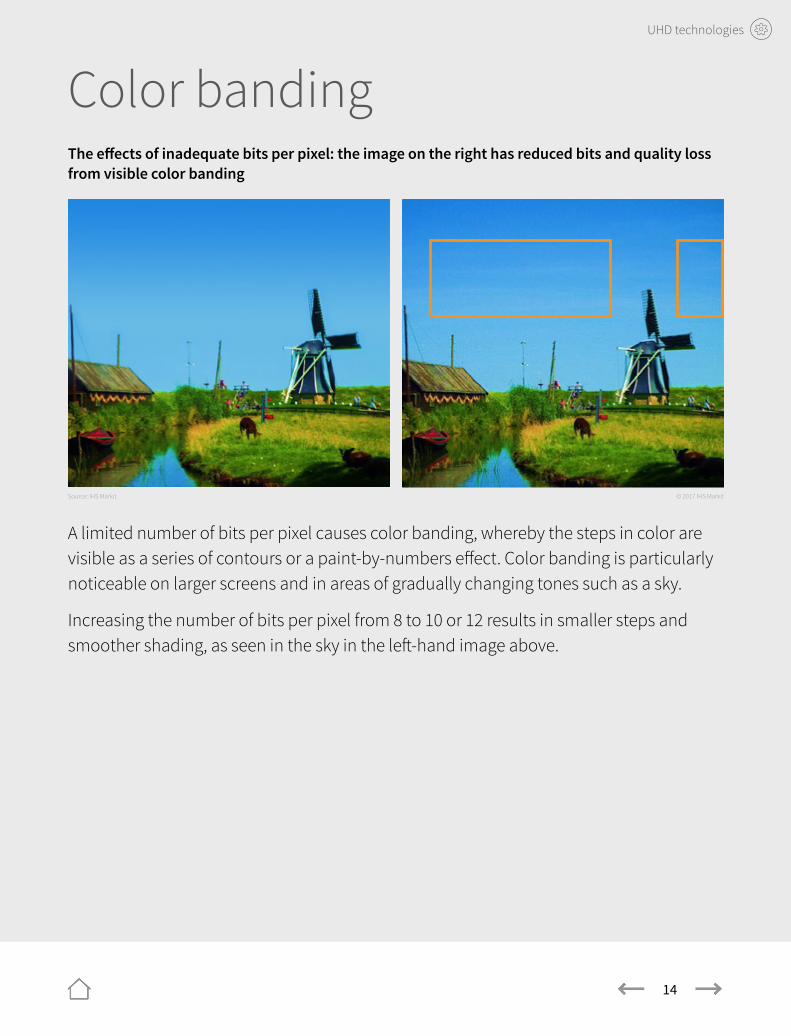
Color bandingThe effects of inadequate bits per pixel: the image on the right has reduced bits and quality loss from visible color banding
A limited number of bits per pixel causes color banding, whereby the steps in color are visible as a series of contours or a paint-by-numbers effect. Color banding is particularly noticeable on larger screens and in areas of gradually changing tones such as a sky.
Increasing the number of bits per pixel from 8 to 10 or 12 results in smaller steps and smoother shading, as seen in the sky in the left-hand image above.
© 2017 IHS MarkitSource: IHS Markit
15
UHD technologies
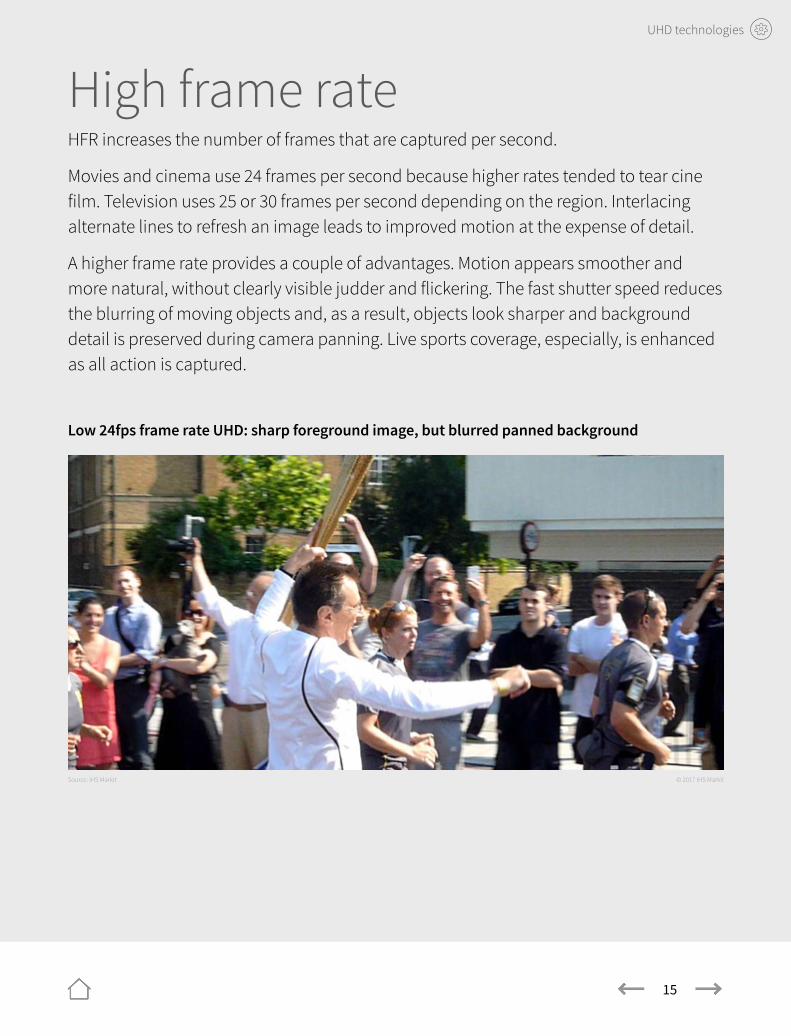
High frame rateHFR increases the number of frames that are captured per second.
Movies and cinema use 24 frames per second because higher rates tended to tear cine film. Television uses 25 or 30 frames per second depending on the region. Interlacing alternate lines to refresh an image leads to improved motion at the expense of detail.
A higher frame rate provides a couple of advantages. Motion appears smoother and more natural, without clearly visible judder and flickering. The fast shutter speed reduces the blurring of moving objects and, as a result, objects look sharper and background detail is preserved during camera panning. Live sports coverage, especially, is enhanced as all action is captured.
Low 24fps frame rate UHD: sharp foreground image, but blurred panned background
© 2017 IHS MarkitSource: IHS Markit
16
UHD technologies
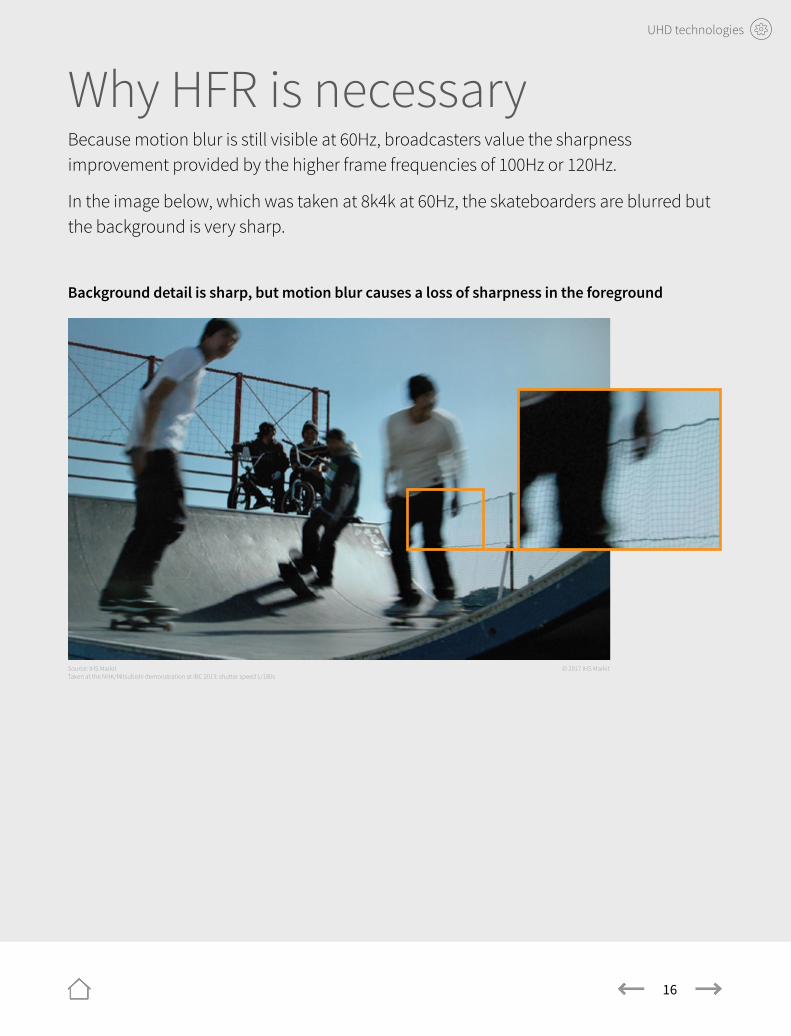
Why HFR is necessaryBecause motion blur is still visible at 60Hz, broadcasters value the sharpness improvement provided by the higher frame frequencies of 100Hz or 120Hz.
In the image below, which was taken at 8k4k at 60Hz, the skateboarders are blurred but the background is very sharp.
Background detail is sharp, but motion blur causes a loss of sharpness in the foreground
© 2017 IHS MarkitSource: IHS Markit Taken at the NHK/Mitsubishi demonstration at IBC 2013; shutter speed 1/180s
17
UHD technologies
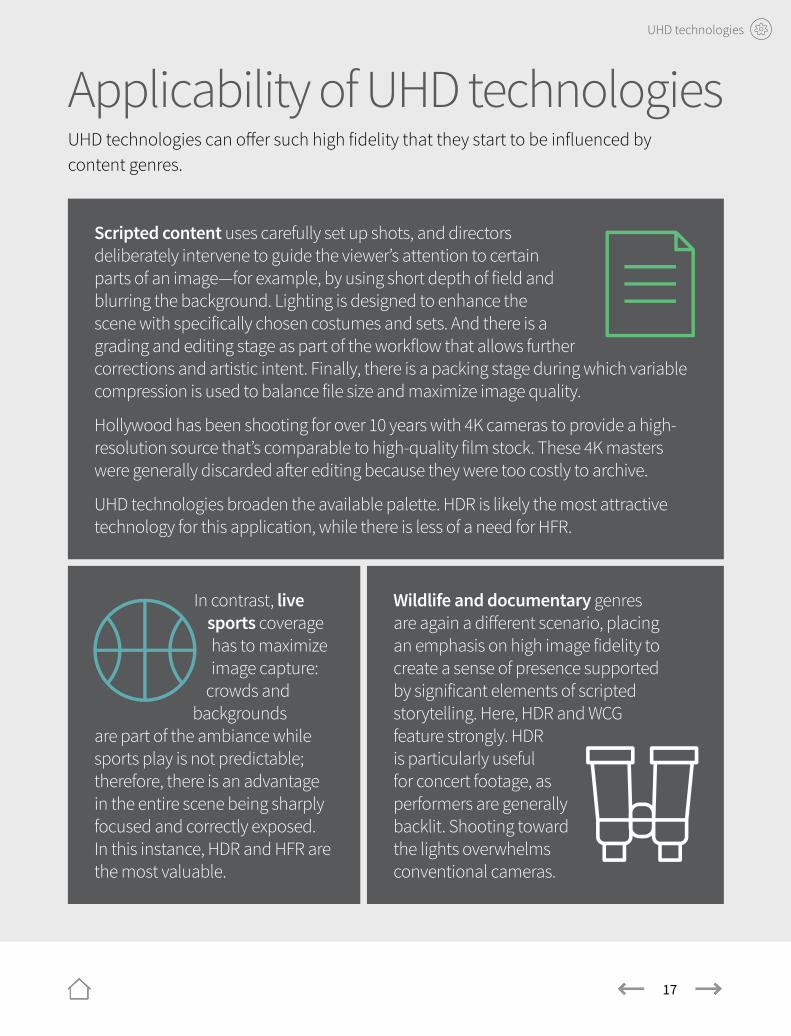
Applicability of UHD technologiesUHD technologies can offer such high fidelity that they start to be influenced by content genres.
Scripted content uses carefully set up shots, and directors deliberately intervene to guide the viewer’s attention to certain parts of an image—for example, by using short depth of field and blurring the background. Lighting is designed to enhance the scene with specifically chosen costumes and sets. And there is a grading and editing stage as part of the workflow that allows further corrections and artistic intent. Finally, there is a packing stage during which variable compression is used to balance file size and maximize image quality.
Hollywood has been shooting for over 10 years with 4K cameras to provide a high-resolution source that’s comparable to high-quality film stock. These 4K masters were generally discarded after editing because they were too costly to archive.
UHD technologies broaden the available palette. HDR is likely the most attractive technology for this application, while there is less of a need for HFR.
In contrast, live sports coverage has to maximize image capture:
crowds and backgrounds
are part of the ambiance while sports play is not predictable; therefore, there is an advantage in the entire scene being sharply focused and correctly exposed. In this instance, HDR and HFR are the most valuable.
Wildlife and documentary genres are again a different scenario, placing an emphasis on high image fidelity to create a sense of presence supported by significant elements of scripted storytelling. Here, HDR and WCG feature strongly. HDR is particularly useful for concert footage, as performers are generally backlit. Shooting toward the lights overwhelms conventional cameras.
18
UHD technologies
Effectiveness of UHD technologies
In France, the 4EVER project was established to research new technologies for next-generation content and broadcast. Its first phase examined—under laboratory conditions—the response of consumers to different factors in improved video quality. The conclusions of this project are summarized here:
– Resolution has no “wow” effect. UHD is visibly better than full HD at 1.5 times screen height; for example, 84 inches at 1.6m.
– High frame rate is noticeable to viewers. 120Hz native content provides much better quality than 60Hz. HFR is especially useful for sports content.
– High dynamic range was very noticeable to viewers. Perceived video quality and viewing comfort increases with peak luminance, but some viewers reported visual discomfort at high luminance (3000 cd/m²). Standardization is necessary; no consumer wants to be dazzled by a soap commercial!
– Deep color was perceptible to consumers with the right content.
19
UHD technologies
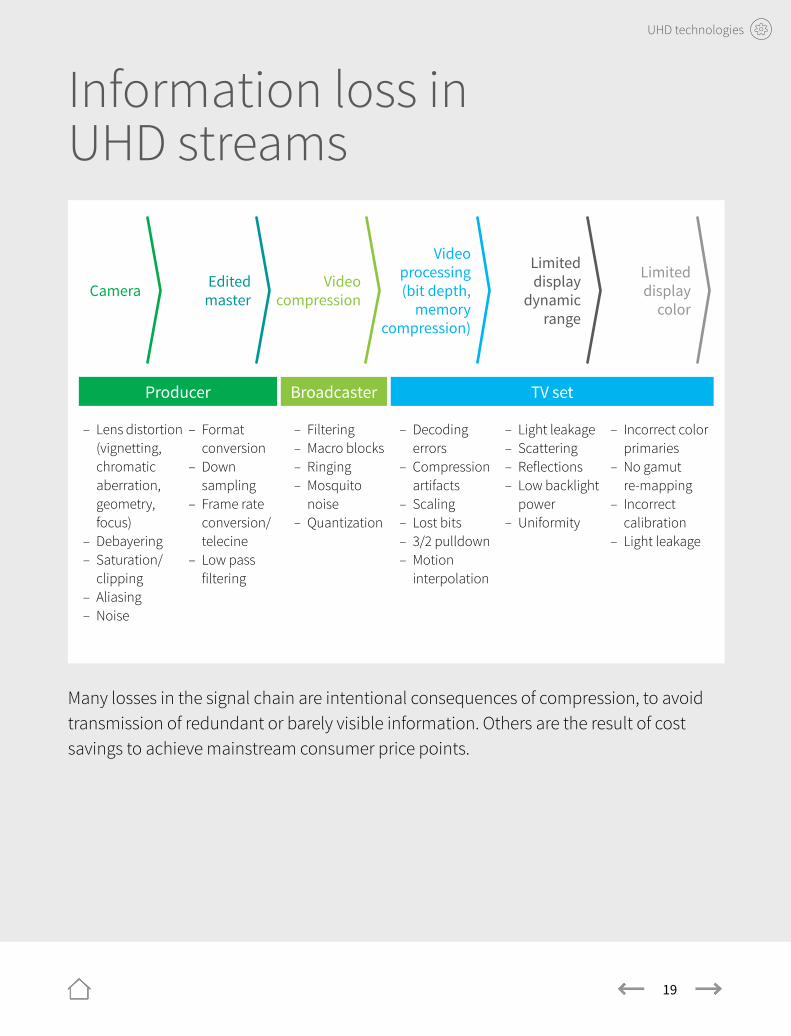
Information loss in UHD streams
Many losses in the signal chain are intentional consequences of compression, to avoid transmission of redundant or barely visible information. Others are the result of cost savings to achieve mainstream consumer price points.
– Lens distortion (vignetting, chromatic aberration, geometry, focus)
– Debayering – Saturation/
clipping – Aliasing – Noise
– Format conversion
– Down sampling
– Frame rate conversion/telecine
– Low pass filtering
– Filtering – Macro blocks – Ringing – Mosquito
noise – Quantization
– Decoding errors
– Compression artifacts
– Scaling – Lost bits – 3/2 pulldown – Motion
interpolation
– Light leakage – Scattering – Reflections – Low backlight
power – Uniformity
– Incorrect color primaries
– No gamut re-mapping
– Incorrect calibration
– Light leakage
Producer Broadcaster TV set
Camera Edited master
Video compression
Video processing (bit depth,
memory compression)
Limited display
dynamic range
Limited display
color

20
UHD global status
UHD global status
21
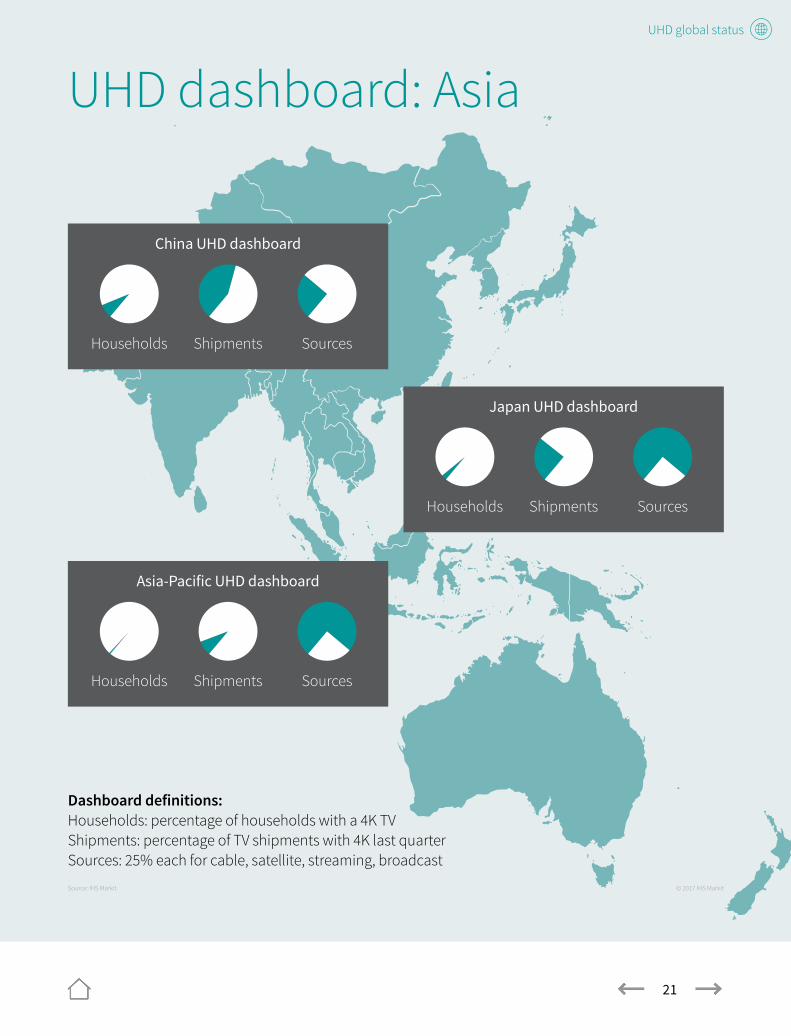
UHD dashboard: Asia
Dashboard definitions: Households: percentage of households with a 4K TV Shipments: percentage of TV shipments with 4K last quarter Sources: 25% each for cable, satellite, streaming, broadcast
China UHD dashboard
Households Shipments Sources
Japan UHD dashboard
Households Shipments Sources
Asia-Pacific UHD dashboard
Households Shipments Sources
© 2017 IHS MarkitSource: IHS Markit
UHD global status
22
North America UHD dashboard
Households Shipments Sources
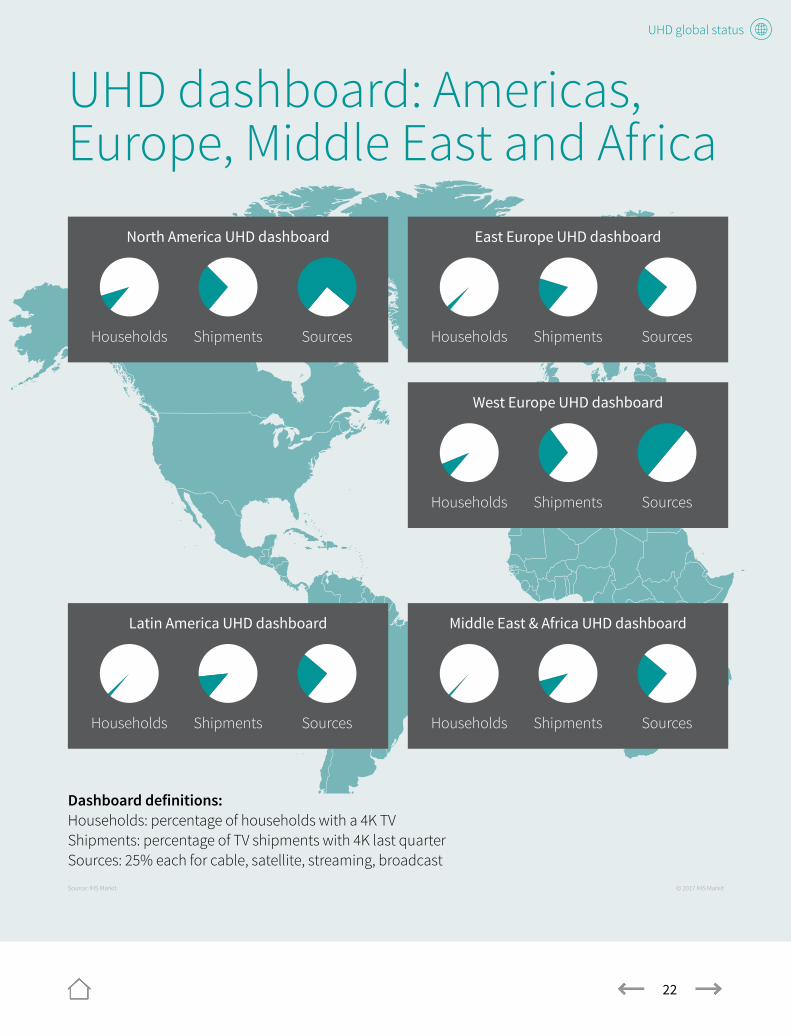
UHD dashboard: Americas, Europe, Middle East and Africa
East Europe UHD dashboard
Households Shipments Sources
West Europe UHD dashboard
Households Shipments Sources
Middle East & Africa UHD dashboard
Households Shipments Sources
Latin America UHD dashboard
Households Shipments Sources
© 2017 IHS MarkitSource: IHS Markit
Dashboard definitions: Households: percentage of households with a 4K TV Shipments: percentage of TV shipments with 4K last quarter Sources: 25% each for cable, satellite, streaming, broadcast

23
UHD forecasts
UHD forecasts
24
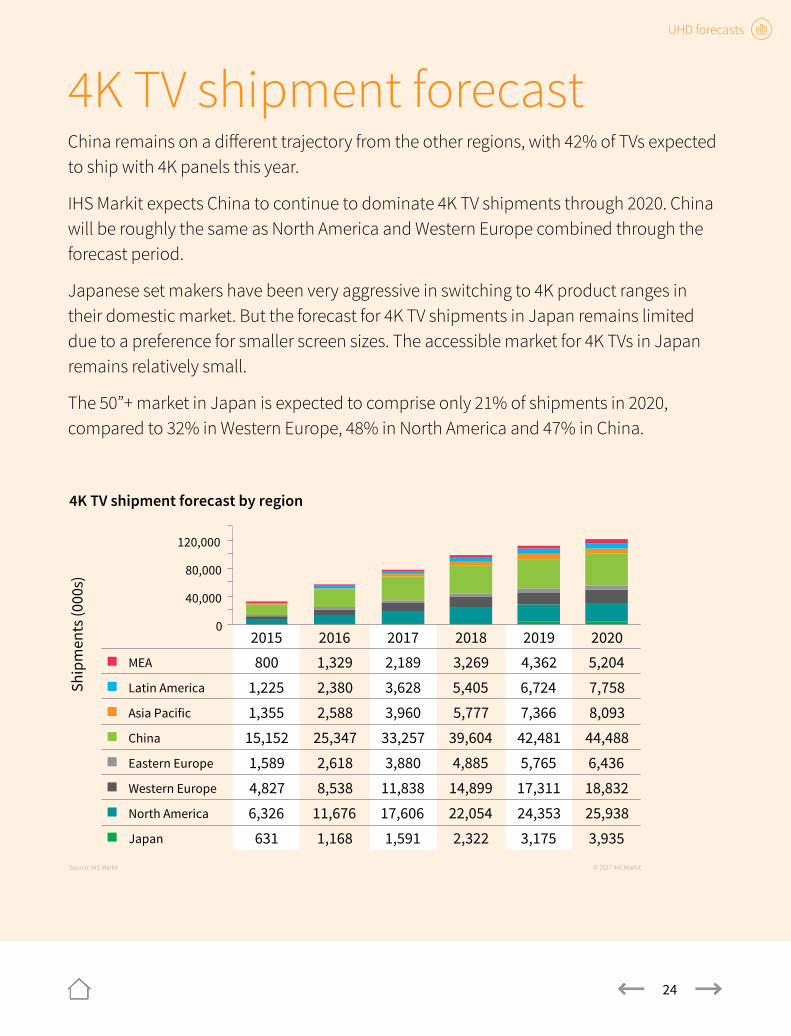
4K TV shipment forecastChina remains on a different trajectory from the other regions, with 42% of TVs expected to ship with 4K panels this year.
IHS Markit expects China to continue to dominate 4K TV shipments through 2020. China will be roughly the same as North America and Western Europe combined through the forecast period.
Japanese set makers have been very aggressive in switching to 4K product ranges in their domestic market. But the forecast for 4K TV shipments in Japan remains limited due to a preference for smaller screen sizes. The accessible market for 4K TVs in Japan remains relatively small.
The 50”+ market in Japan is expected to comprise only 21% of shipments in 2020, compared to 32% in Western Europe, 48% in North America and 47% in China.
2015 2016 2017 2018 2019 2020 800 1,329 2,189 3,269 4,362 5,204
1,225 2,380 3,628 5,405 6,724 7,758 1,355 2,588 3,960 5,777 7,366 8,093
15,152 25,347 33,257 39,604 42,481 44,488 1,589 2,618 3,880 4,885 5,765 6,436 4,827 8,538 11,838 14,899 17,311 18,832 6,326 11,676 17,606 22,054 24,353 25,938
MEA
Latin America
Asia Pacific
China
Eastern Europe
Western Europe
North America
Japan 631 1,168 1,591 2,322 3,175 3,935
0
40,000
80,000
120,000
Ship
men
ts (0
00s)
Source: IHS Markit © 2017 IHS Markit
4K TV shipment forecast by region
UHD forecasts
25
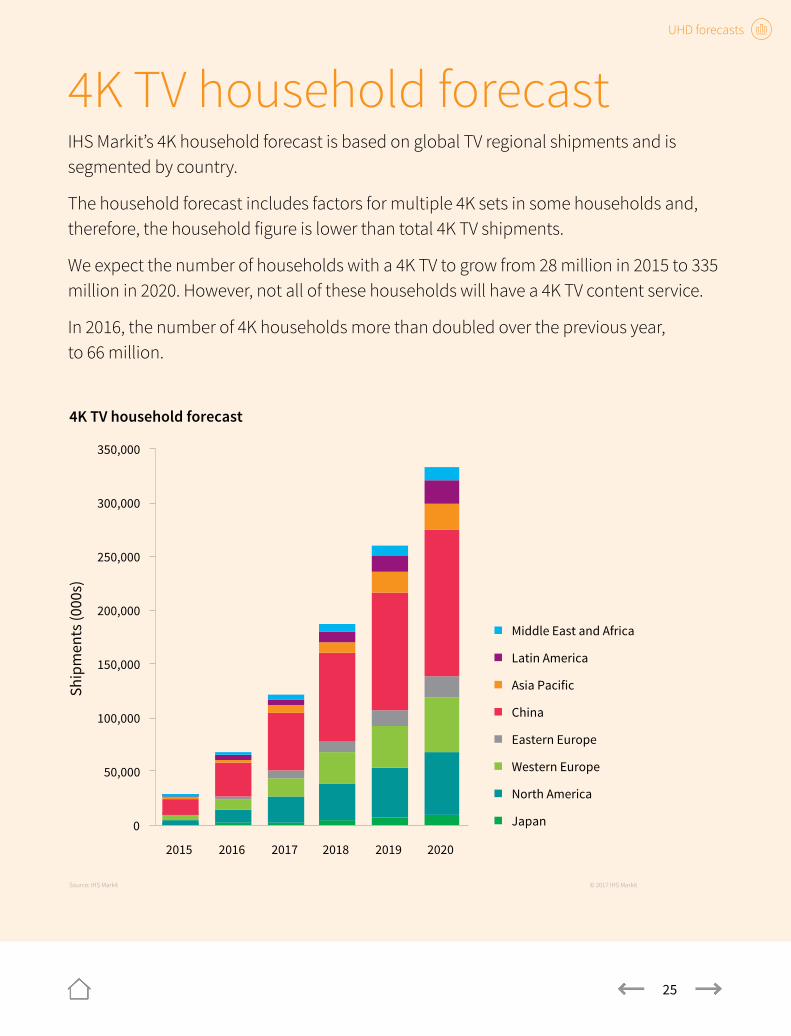
4K TV household forecastIHS Markit’s 4K household forecast is based on global TV regional shipments and is segmented by country.
The household forecast includes factors for multiple 4K sets in some households and, therefore, the household figure is lower than total 4K TV shipments.
We expect the number of households with a 4K TV to grow from 28 million in 2015 to 335 million in 2020. However, not all of these households will have a 4K TV content service.
In 2016, the number of 4K households more than doubled over the previous year, to 66 million.
0
50,000
100,000
150,000
200,000
250,000
300,000
350,000
2015 2016 2017 2018 2019 2020
Ship
men
ts (0
00s)
Middle East and Africa
Latin America
Asia Pacific
China
Eastern Europe
Western Europe
North America
Japan
Source: IHS Markit © 2017 IHS Markit
4K TV household forecast
UHD forecasts
26
Looking ahead to 8K TVPanel makers are starting to add 8K resolution to their roadmaps and product plans.
Aggressive competition in the panel industry will likely fuel a race to higher pixel counts, especially as new Chinese fabs start production, eager to demonstrate their capabilities.
Taiwanese and Korean panel makers are facing new competition from China and will respond by raising performance requirements to levels that new competitors may find hard to reach.
Existing panel makers have used increased performance (4K resolution) to raise barriers to entry. Chinese panel vendors have struggled to make 4K panels efficiently.
8K presents several obstacles:
– Japan is planning 8K broadcast for 2020, a demanding timescale. No other countries have plans for 8K broadcasting. The Japanese consumer’s preference for smaller TV sizes directly contradicts the broadcast plan. The plan has more in common with historical format launches, where transmission led the consumer electronics industry.
– For most regions, the forecast dynamic will be “supply push,” and not “content pull.” 8K video content will be scarce.
– IHS Markit believes that China is the region most receptive to new TV technology and expects that Chinese consumers will be prepared to buy 8K sets if pricing is accessible.
– The fashion factor and “numbers marketing” will be the dominant drivers of the 8K TV market; however, volumes will be low.
UHD forecasts
27
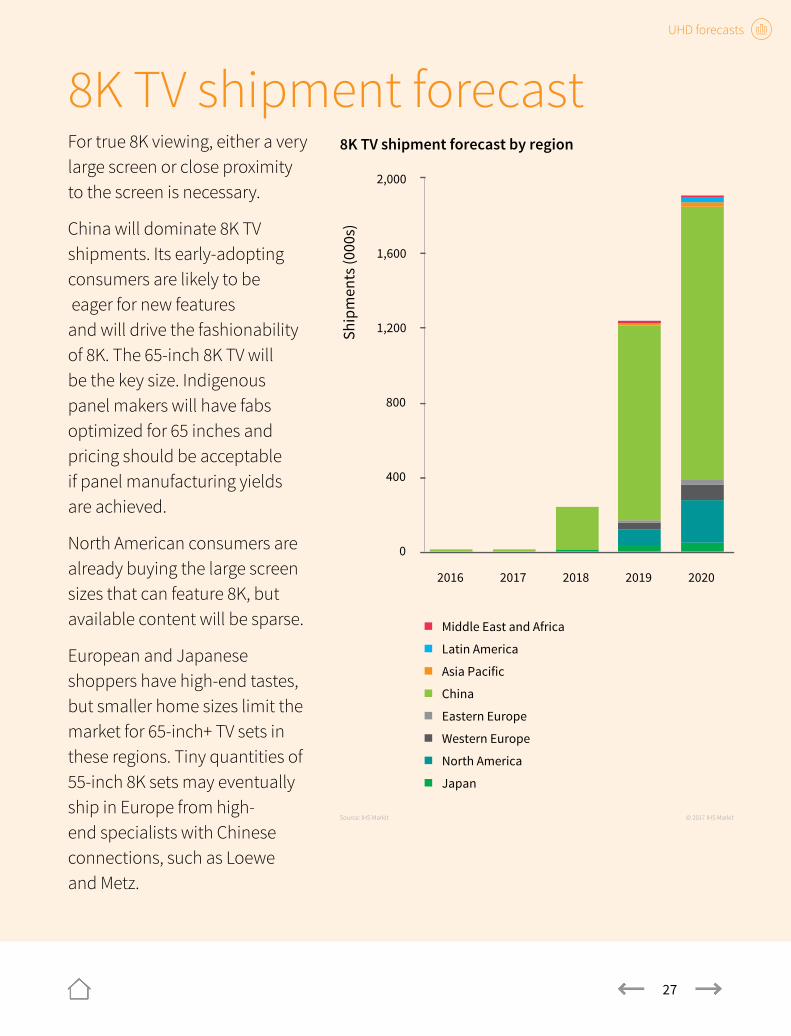
8K TV shipment forecastFor true 8K viewing, either a very large screen or close proximity to the screen is necessary.
China will dominate 8K TV shipments. Its early-adopting consumers are likely to be eager for new features and will drive the fashionability of 8K. The 65-inch 8K TV will be the key size. Indigenous panel makers will have fabs optimized for 65 inches and pricing should be acceptable if panel manufacturing yields are achieved.
North American consumers are already buying the large screen sizes that can feature 8K, but available content will be sparse.
European and Japanese shoppers have high-end tastes, but smaller home sizes limit the market for 65-inch+ TV sets in these regions. Tiny quantities of 55-inch 8K sets may eventually ship in Europe from high-end specialists with Chinese connections, such as Loewe and Metz.
0
400
800
1,200
1,600
2,000
2016 2017 2018 2019 2020
Ship
men
ts (0
00s)
Middle East and Africa
Latin America
Asia Pacific
China
Eastern Europe
Western Europe
North America
Japan
Source: IHS Markit © 2017 IHS Markit
8K TV shipment forecast by region
28
UHD media consumption
UHD media consumption
29
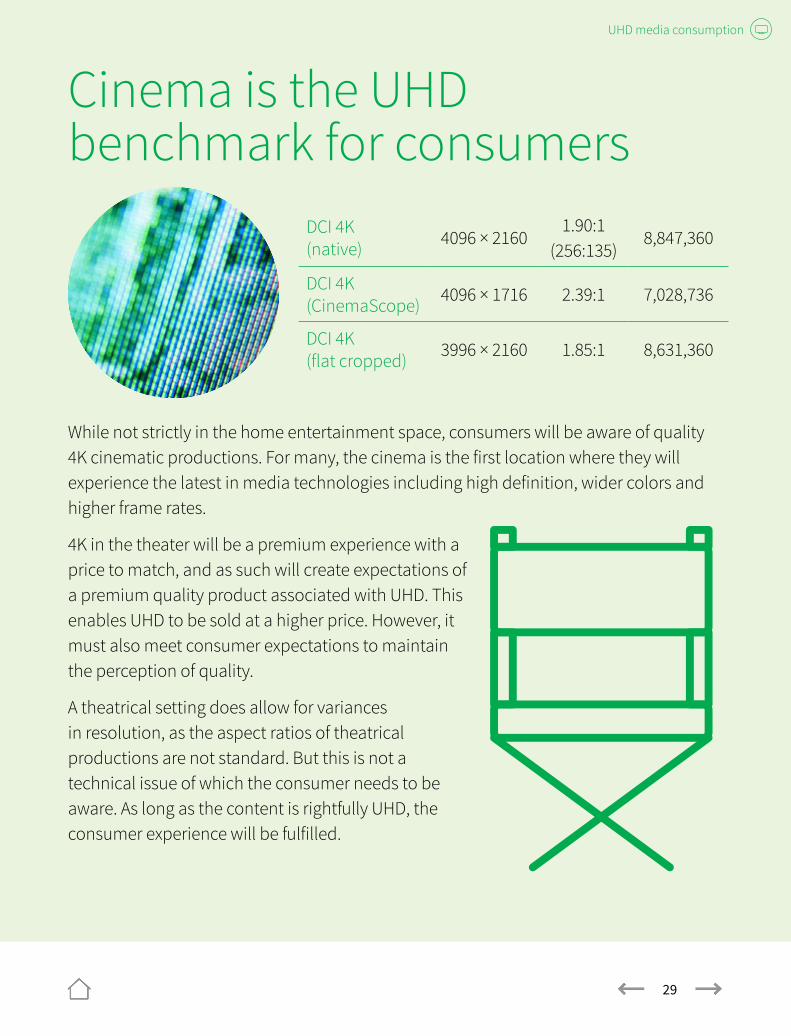
Cinema is the UHD benchmark for consumers
While not strictly in the home entertainment space, consumers will be aware of quality 4K cinematic productions. For many, the cinema is the first location where they will experience the latest in media technologies including high definition, wider colors and higher frame rates.
4K in the theater will be a premium experience with a price to match, and as such will create expectations of a premium quality product associated with UHD. This enables UHD to be sold at a higher price. However, it must also meet consumer expectations to maintain the perception of quality.
A theatrical setting does allow for variances in resolution, as the aspect ratios of theatrical productions are not standard. But this is not a technical issue of which the consumer needs to be aware. As long as the content is rightfully UHD, the consumer experience will be fulfilled.
DCI 4K (native) 4096 × 2160
1.90:1 (256:135)
8,847,360
DCI 4K (CinemaScope) 4096 × 1716 2.39:1 7,028,736
DCI 4K (flat cropped) 3996 × 2160 1.85:1 8,631,360
UHD media consumption
30
OTT and SVoD service providers use UHD as marketingSVoD (subscription video on demand) providers will not as much market their UHD/HDR content as use it in the marketing of their own services.
The fast refresh rates of a software-only platform enable SVoD services to be deployed now and perfected later—meaning that any bit rate or quality issues can be tweaked subsequently based on consumer feedback.
SVoD platforms can also add in other UHD technologies besides higher resolution without significant further hardware investment. A low- or no-cost SVoD option will be many consumers’ introduction to UHD, as free trials and low-cost subscriptions are cheap and easy ways to access content.
The use of UHD in SVoD will allow for high-tier packaging to be pushed to consumers —something that’s much needed as markets become saturated and competitive.
UHD media consumption
31
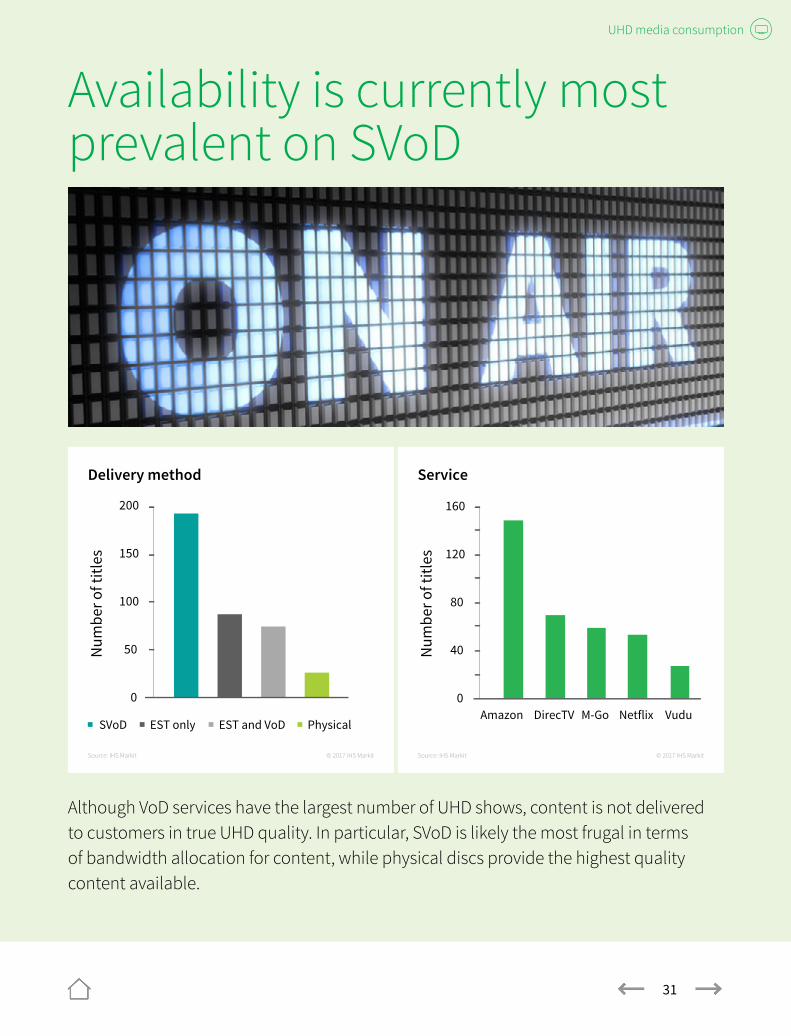
Availability is currently most prevalent on SVoD
Although VoD services have the largest number of UHD shows, content is not delivered to customers in true UHD quality. In particular, SVoD is likely the most frugal in terms of bandwidth allocation for content, while physical discs provide the highest quality content available.
Physical EST and VoD EST only SVoD
0
50
100
150
200
Num
ber o
f titl
es
Delivery method
Source: IHS Markit © 2017 IHS Markit
0
40
80
120
160
Amazon DirecTV M-Go Netflix Vudu
Service
Source: IHS Markit © 2017 IHS Markit
Num
ber o
f titl
es

UHD media consumption
32
While film is often considered the most suitable format for 4K, SVoD giants are investing in UHD TV series
Amazon and Netflix are not only acquiring films and documentaries, but they are also heavily involved in producing their own content using both higher resolutions and HDR technologies.
SVoD services have among the lowest revenue per hour of content viewed, making premium content a greater risk.
While films comprise the largest number of titles, TV series offer a better return on hours of content viewed per dollar invested.
Sales
Source: IHS Markit © 2017 IHS Markit
Film TV series Events Documentary Sports
Amazon vs. Netflix, by genre*
Source: IHS Markit © 2017 IHS Markit
Documentary *Total international library; includes planned content
Events Film Sports TV series
0
20
40
60
80
Amazon Netflix
Num
ber o
f titl
es
UHD media consumption
33
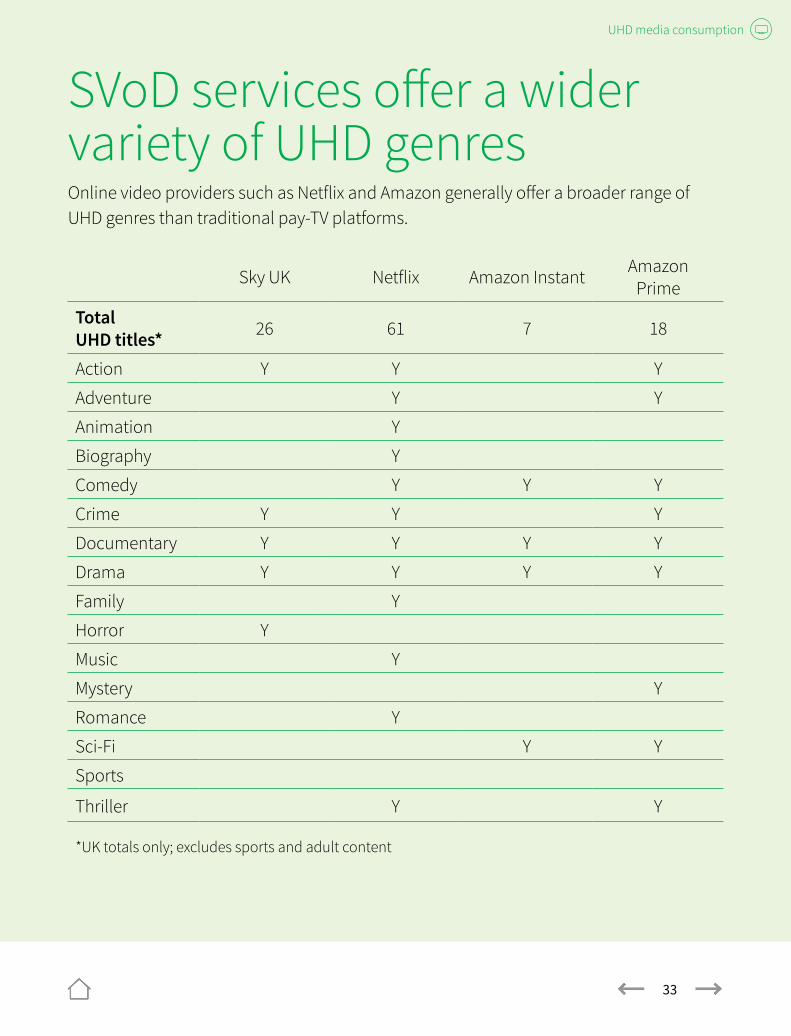
SVoD services offer a wider variety of UHD genresOnline video providers such as Netflix and Amazon generally offer a broader range of UHD genres than traditional pay-TV platforms.
Sky UK Netflix Amazon Instant Amazon Prime
Total UHD titles* 26 61 7 18
Action Y Y Y
Adventure Y Y
Animation Y
Biography Y
Comedy Y Y Y
Crime Y Y Y
Documentary Y Y Y Y
Drama Y Y Y Y
Family Y
Horror Y
Music Y
Mystery Y
Romance Y
Sci-Fi Y Y
Sports
Thriller Y Y
*UK totals only; excludes sports and adult content
UHD media consumption
34
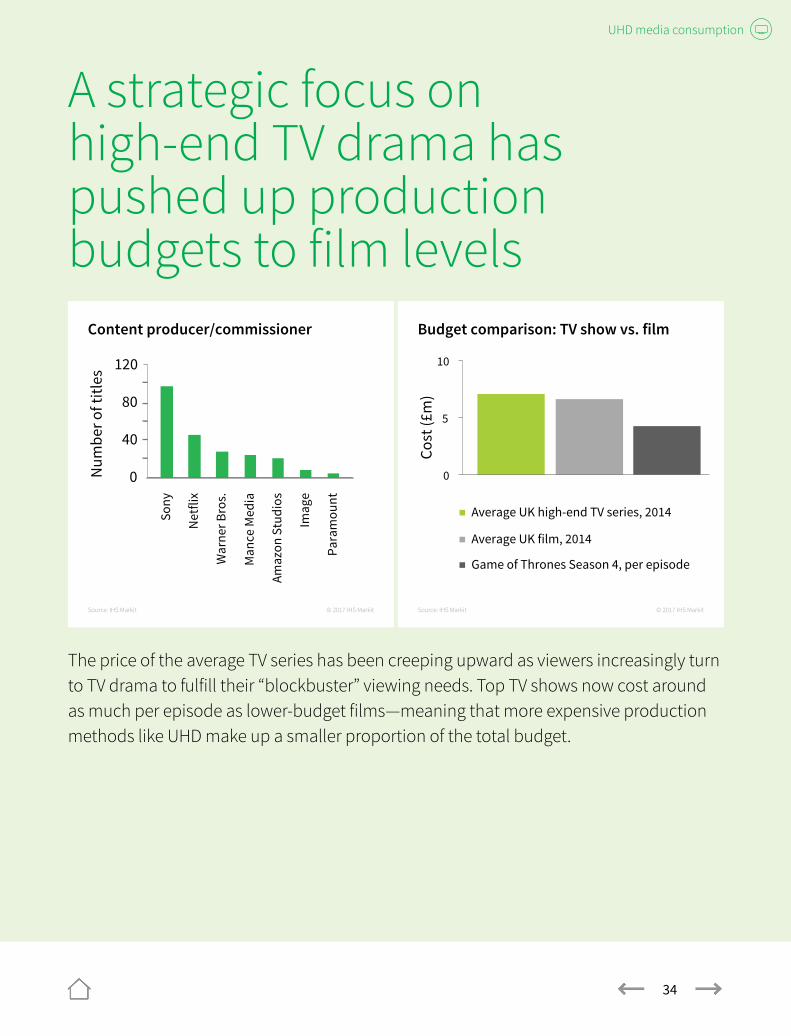
A strategic focus on high-end TV drama has pushed up production budgets to film levels
The price of the average TV series has been creeping upward as viewers increasingly turn to TV drama to fulfill their “blockbuster” viewing needs. Top TV shows now cost around as much per episode as lower-budget films—meaning that more expensive production methods like UHD make up a smaller proportion of the total budget.
Num
ber o
f titl
es
Content producer/commissioner
Source: IHS Markit © 2017 IHS Markit
0
40
80
120
Sony
Net
flix
War
ner B
ros.
Man
ce M
edia
Amaz
on S
tudi
os
Imag
e
Para
mou
nt
Budget comparison: TV show vs. film
Source: IHS Markit © 2017 IHS Markit
0
5
10
Cost
(£m
)
Average UK high-end TV series, 2014
Average UK film, 2014
Game of Thrones Season 4, per episode
Find out moreIHS Markit provides timely insight on today’s media and advertising market, supported by a continuous flow of research covering television, film, gaming, music and advertising.
For more information on TV and video trends or on IHS Markit research relevant to this topic, please visit our media site.
35
About IHS Markit The Technology Group at IHS Markit is the leading source of information, insight and analytics in critical areas that shape today’s technology ecosystem—from materials and components, to devices and equipment, to end markets and consumers. Businesses and governments in more than 150 countries around the globe rely on the deep market insight and expert independent analysis of our 300+ industry analysts in technology sectors spanning IT, telecom, media, industrial, automotive, electronics, solar and more.
@IHS4Tech
Tel: +1 844 301-7334
technology.ihs.com 4102-MT-0217Copyright © 2017 IHS Markit. All Rights Reserved
Find out more
Contributors to this publication:
Paul Gray Principal Analyst, Consumer Devices [email protected]
Jonathan Broughton Senior Analyst, Home Entertainment [email protected]