Embed Size (px)
DESCRIPTION
Half year results for 4imprint plc
Citation preview
Results presentation for the
half year ended
27 June 2015
Half Year Results 2015
Kevin Lyons-Tarr CEO
David Seekings CFO
1. Background
2. Highlights
3. Financial review
4. Operational review
5. Outlook
2
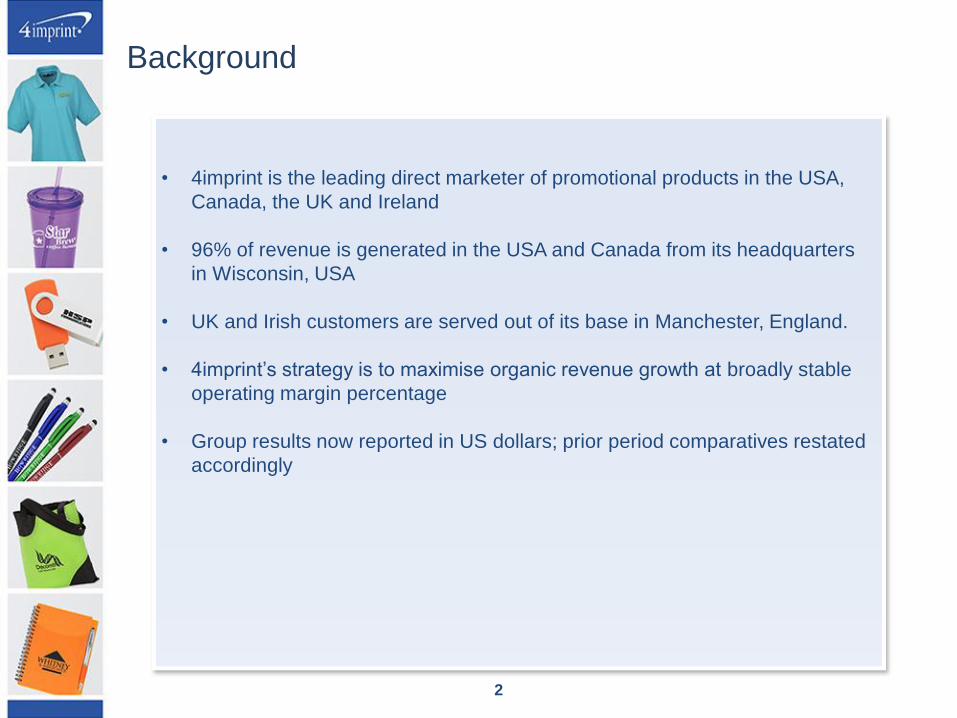
• 4imprint is the leading direct marketer of promotional products in the USA,
Canada, the UK and Ireland
• 96% of revenue is generated in the USA and Canada from its headquarters
in Wisconsin, USA
• UK and Irish customers are served out of its base in Manchester, England.
• 4imprint’s strategy is to maximise organic revenue growth at broadly stable
operating margin percentage
• Group results now reported in US dollars; prior period comparatives restated
accordingly
Background

3
Highlights
4
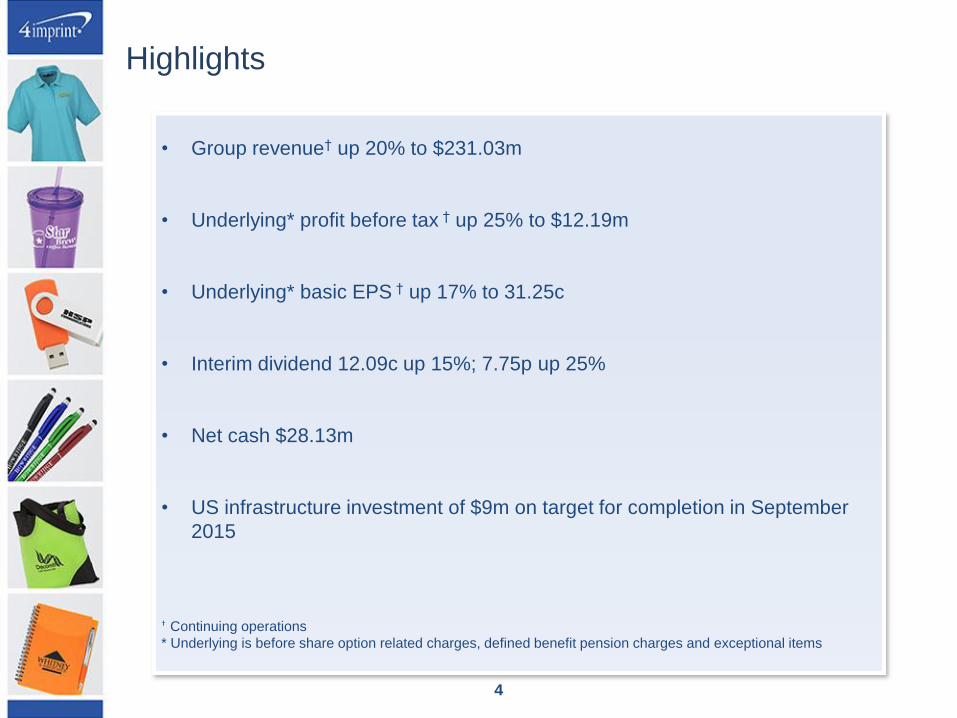
• Group revenue† up 20% to $231.03m
• Underlying* profit before tax † up 25% to $12.19m
• Underlying* basic EPS † up 17% to 31.25c
• Interim dividend 12.09c up 15%; 7.75p up 25%
• Net cash $28.13m
• US infrastructure investment of $9m on target for completion in September
2015
† Continuing operations
* Underlying is before share option related charges, defined benefit pension charges and exceptional items
Highlights

Financial Review
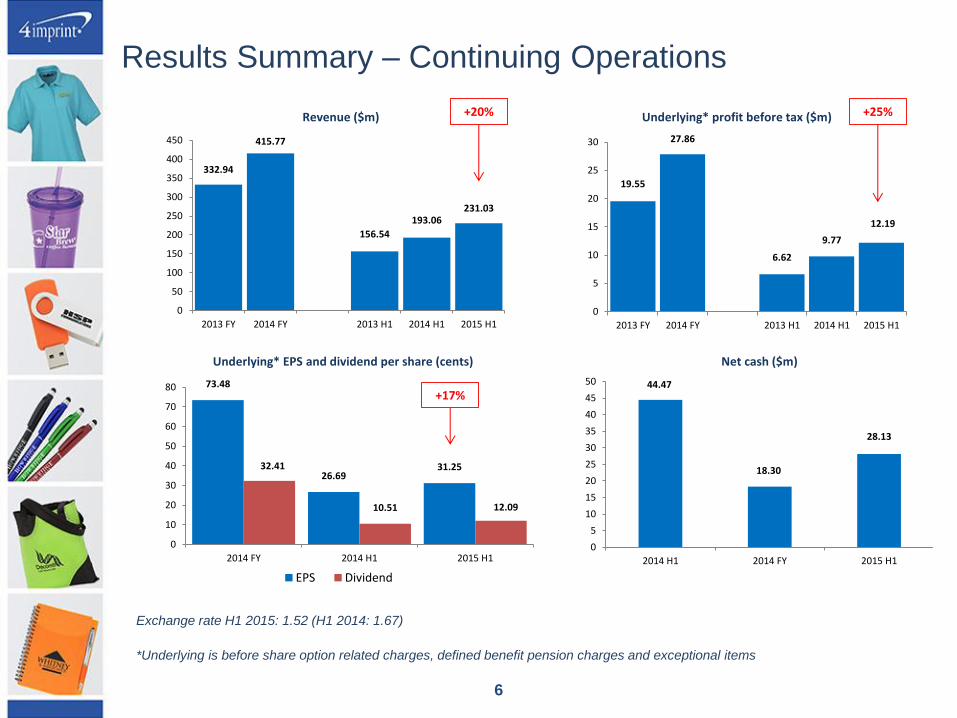
73.48
26.69 31.25 32.41
10.51 12.09
0
10
20
30
40
50
60
70
80
2014 FY 2014 H1 2015 H1
Underlying* EPS and dividend per share (cents)
EPS Dividend
332.94
415.77
156.54
193.06 231.03
0
50
100
150
200
250
300
350
400
450
2013 FY 2014 FY 2013 H1 2014 H1 2015 H1
Revenue ($m)
19.55
27.86
6.62
9.77
12.19
0
5
10
15
20
25
30
2013 FY 2014 FY 2013 H1 2014 H1 2015 H1
Underlying* profit before tax ($m)
6
Results Summary – Continuing Operations
Exchange rate H1 2015: 1.52 (H1 2014: 1.67)
*Underlying is before share option related charges, defined benefit pension charges and exceptional items
+20% +25%
+17% 44.47
18.30
28.13
0
5
10
15
20
25
30
35
40
45
50
2014 H1 2014 FY 2015 H1
Net cash ($m)
7
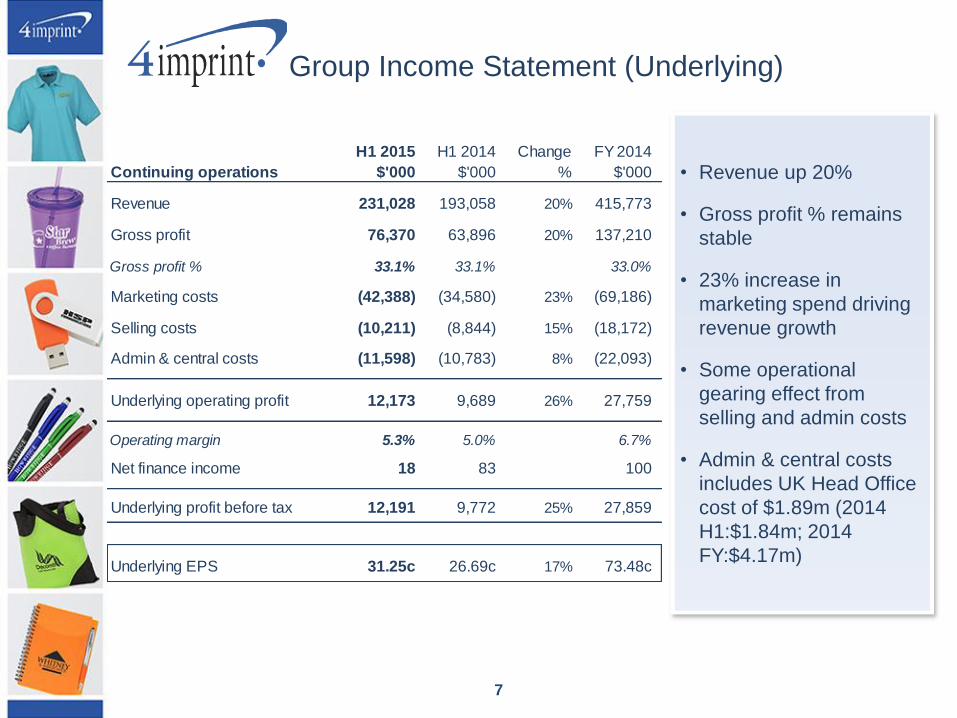
• Revenue up 20%
• Gross profit % remains
stable
• 23% increase in
marketing spend driving
revenue growth
• Some operational
gearing effect from
selling and admin costs
• Admin & central costs
includes UK Head Office
cost of $1.89m (2014
H1:$1.84m; 2014
FY:$4.17m)
Group Income Statement (Underlying)
H1 2015 H1 2014 Change FY 2014
Continuing operations $'000 $'000 % $'000
Revenue 231,028 193,058 20% 415,773
Gross profit 76,370 63,896 20% 137,210
Gross profit % 33.1% 33.1% 33.0%
Marketing costs (42,388) (34,580) 23% (69,186)
Selling costs (10,211) (8,844) 15% (18,172)
Admin & central costs (11,598) (10,783) 8% (22,093)
Underlying operating profit 12,173 9,689 26% 27,759
Operating margin 5.3% 5.0% 6.7%
Net finance income 18 83 100
Underlying profit before tax 12,191 9,772 25% 27,859
Underlying EPS 31.25c 26.69c 17% 73.48c
8
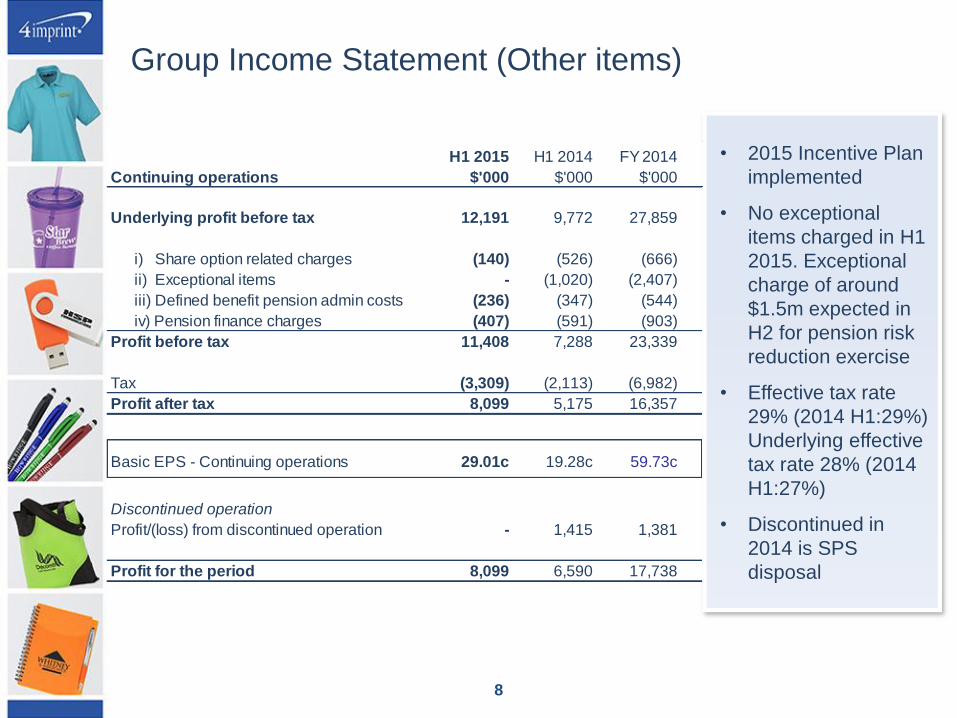
Group Income Statement (Other items)
• 2015 Incentive Plan
implemented
• No exceptional
items charged in H1
2015. Exceptional
charge of around
$1.5m expected in
H2 for pension risk
reduction exercise
• Effective tax rate
29% (2014 H1:29%)
Underlying effective
tax rate 28% (2014
H1:27%)
• Discontinued in
2014 is SPS
disposal
H1 2015 H1 2014 FY 2014
Continuing operations $'000 $'000 $'000
Underlying profit before tax 12,191 9,772 27,859
i) Share option related charges (140) (526) (666)
ii) Exceptional items - (1,020) (2,407)
iii) Defined benefit pension admin costs (236) (347) (544)
iv) Pension finance charges (407) (591) (903)
Profit before tax 11,408 7,288 23,339
Tax (3,309) (2,113) (6,982)
Profit after tax 8,099 5,175 16,357
Basic EPS - Continuing operations 29.01c 19.28c 59.73c
Discontinued operation
Profit/(loss) from discontinued operation - 1,415 1,381
Profit for the period 8,099 6,590 17,738
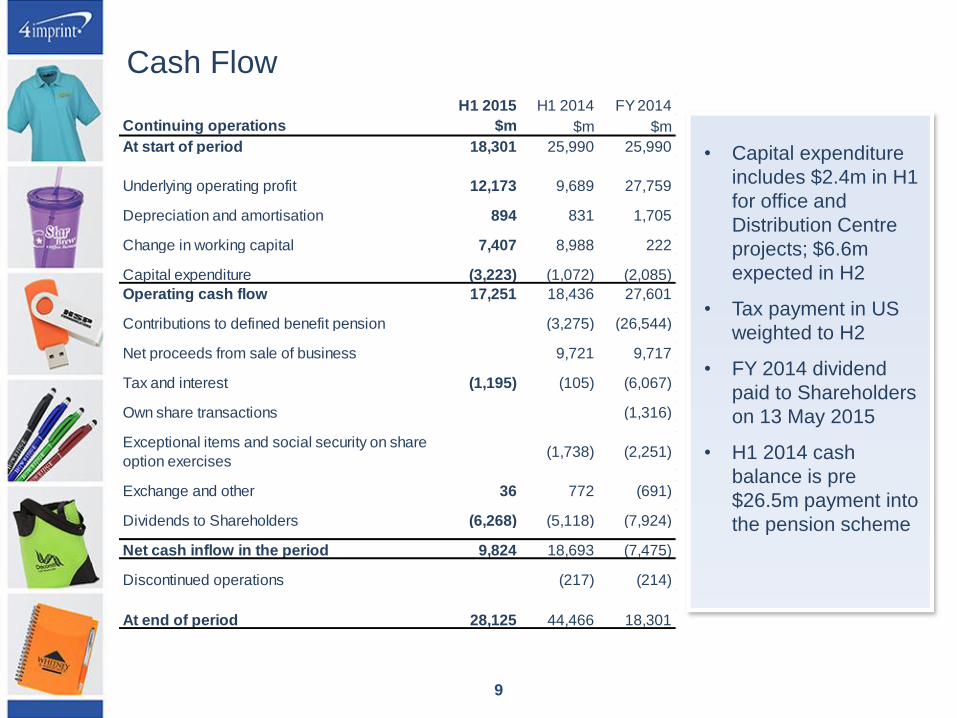
Cash Flow
• Capital expenditure
includes $2.4m in H1
for office and
Distribution Centre
projects; $6.6m
expected in H2
• Tax payment in US
weighted to H2
• FY 2014 dividend
paid to Shareholders
on 13 May 2015
• H1 2014 cash
balance is pre
$26.5m payment into
the pension scheme
9
H1 2015 H1 2014 FY 2014
Continuing operations $m $m $m
At start of period 18,301 25,990 25,990
Underlying operating profit 12,173 9,689 27,759
Depreciation and amortisation 894 831 1,705
Change in working capital 7,407 8,988 222
Capital expenditure (3,223) (1,072) (2,085)
Operating cash flow 17,251 18,436 27,601
Contributions to defined benefit pension (3,275) (26,544)
Net proceeds from sale of business 9,721 9,717
Tax and interest (1,195) (105) (6,067)
Own share transactions (1,316)
Exceptional items and social security on share
option exercises(1,738) (2,251)
Exchange and other 36 772 (691)
Dividends to Shareholders (6,268) (5,118) (7,924)
Net cash inflow in the period 9,824 18,693 (7,475)
Discontinued operations (217) (214)
At end of period 28,125 44,466 18,301
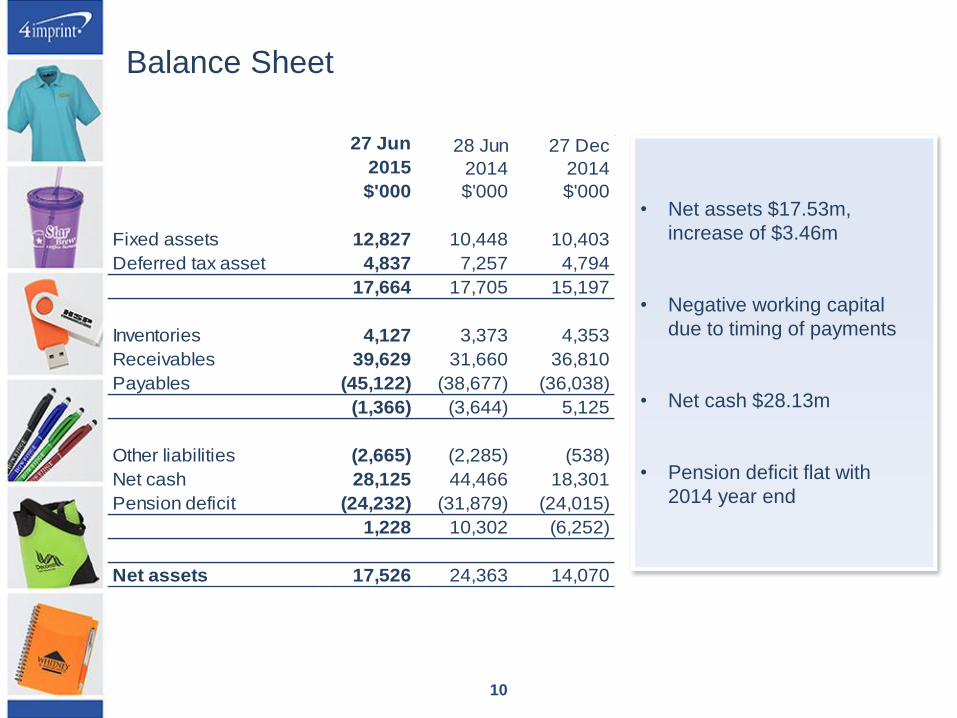
Balance Sheet
• Net assets $17.53m,
increase of $3.46m
• Negative working capital
due to timing of payments
• Net cash $28.13m
• Pension deficit flat with
2014 year end
10
$'000 $'000 $'000
Fixed assets 12,827 10,448 10,403
Deferred tax asset 4,837 7,257 4,794
17,664 17,705 15,197
Inventories 4,127 3,373 4,353
Receivables 39,629 31,660 36,810
Payables (45,122) (38,677) (36,038)
(1,366) (3,644) 5,125
Other liabilities (2,665) (2,285) (538)
Net cash 28,125 44,466 18,301
Pension deficit (24,232) (31,879) (24,015)
1,228 10,302 (6,252)
Net assets 17,526 24,363 14,070
27 Jun
2015
27 Dec
2014
28 Jun
2014
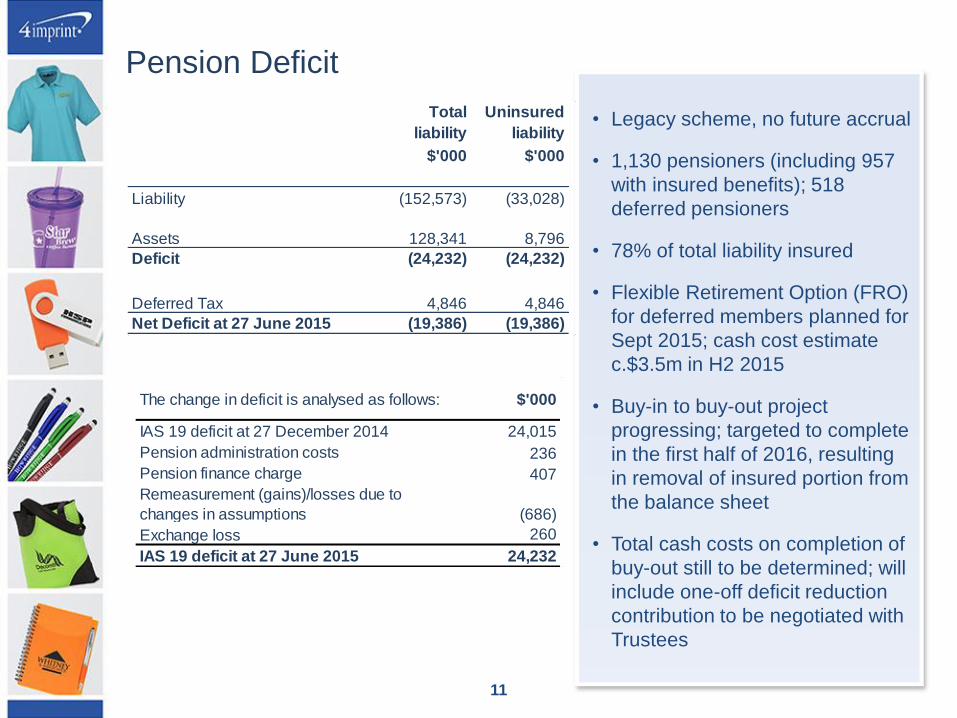
Pension Deficit
• Legacy scheme, no future accrual
• 1,130 pensioners (including 957
with insured benefits); 518
deferred pensioners
• 78% of total liability insured
• Flexible Retirement Option (FRO)
for deferred members planned for
Sept 2015; cash cost estimate
c.$3.5m in H2 2015
• Buy-in to buy-out project
progressing; targeted to complete
in the first half of 2016, resulting
in removal of insured portion from
the balance sheet
• Total cash costs on completion of
buy-out still to be determined; will
include one-off deficit reduction
contribution to be negotiated with
Trustees
11
Total
liability
Uninsured
liability
$'000 $'000
Liability (152,573) (33,028)
Assets 128,341 8,796
Deficit (24,232) (24,232)
Deferred Tax 4,846 4,846
Net Deficit at 27 June 2015 (19,386) (19,386)
The change in deficit is analysed as follows: $'000
IAS 19 deficit at 27 December 2014 24,015
Pension administration costs 236
Pension finance charge 407
Remeasurement (gains)/losses due to
changes in assumptions (686)
Exchange loss 260
IAS 19 deficit at 27 June 2015 24,232
• Continue to drive organic revenue growth through investment in marketing
• Operating profit margin higher in H2 than H1 due to phasing of marketing spend; but consistent with prior years
• Oshkosh office and Distribution Centre projects: Cash cost $2.4m in H1; $6.6m in H2
• FY 2015 tax rate expected to be c. 29%, underlying c. 28%
• Share-based payments (IFRS2) charge of c. $0.2m in H2
• Average shares in issue FY 2015 c. 27.9m; fully diluted 28.1m
• Pension
o Cash requirements H2 2015: $3.5m (FRO); no regular contributions
o Buy-out progressing; timing dependent on progress of legal/actuarial work and negotiations with Trustee
o Exceptional costs of around $1.5m expected in H2 2015 relating to buy-out/FRO
• Interim dividend payable in Sept 2015, cash cost c. $3.4m
2015 Guidance
12
Operational Review
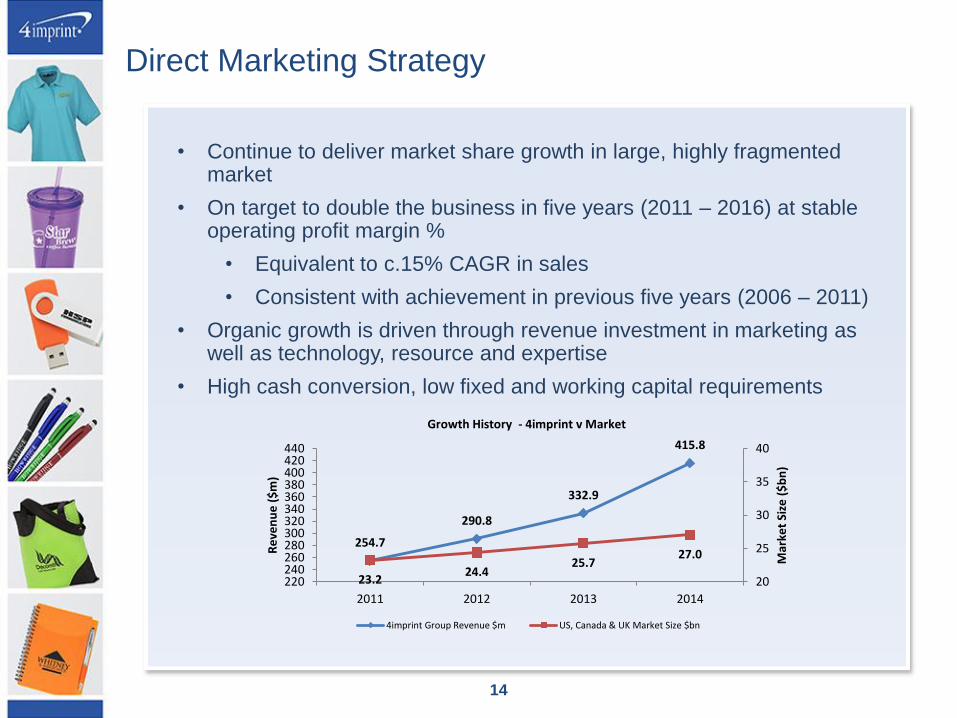
Direct Marketing Strategy
• Continue to deliver market share growth in large, highly fragmented market
• On target to double the business in five years (2011 – 2016) at stable operating profit margin %
• Equivalent to c.15% CAGR in sales
• Consistent with achievement in previous five years (2006 – 2011)
• Organic growth is driven through revenue investment in marketing as well as technology, resource and expertise
• High cash conversion, low fixed and working capital requirements
254.7
290.8
332.9
415.8
23.2 24.4
25.7 27.0
20
25
30
35
40
220240260280300320340360380400420440
2011 2012 2013 2014
Mar
ket
Size
($
bn
)
Re
ven
ue
($
m)
Growth History - 4imprint v Market
4imprint Group Revenue $m US, Canada & UK Market Size $bn
14
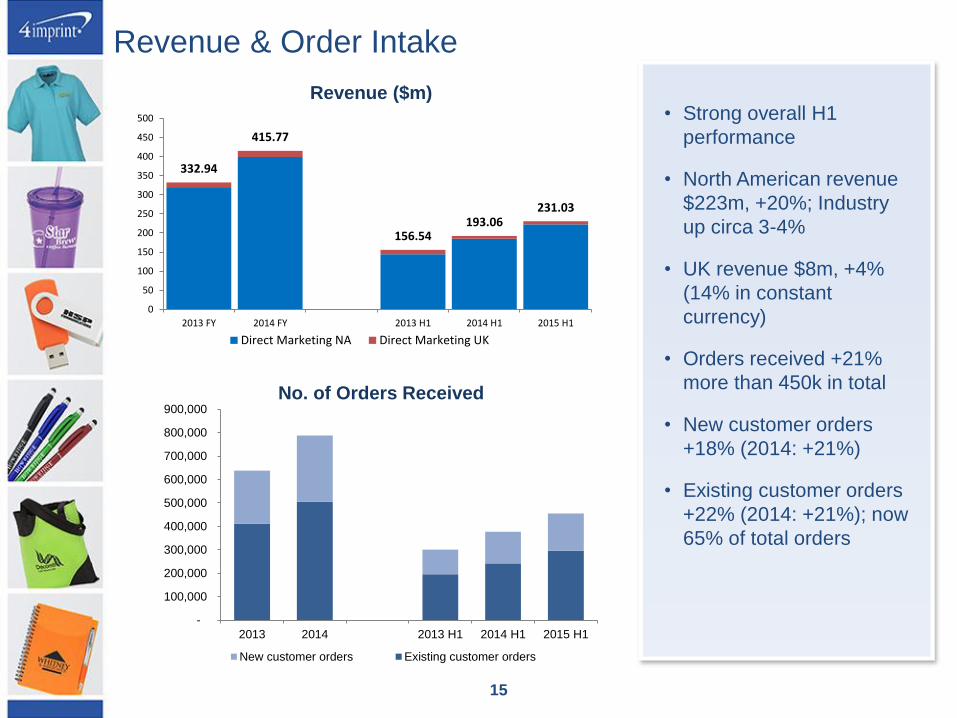
Revenue & Order Intake
• Strong overall H1
performance
• North American revenue
$223m, +20%; Industry
up circa 3-4%
• UK revenue $8m, +4%
(14% in constant
currency)
• Orders received +21%
more than 450k in total
• New customer orders
+18% (2014: +21%)
• Existing customer orders
+22% (2014: +21%); now
65% of total orders
15
-
100,000
200,000
300,000
400,000
500,000
600,000
700,000
800,000
900,000
2013 2014 2013 H1 2014 H1 2015 H1
No. of Orders Received
New customer orders Existing customer orders
332.94
415.77
156.54 193.06
231.03
0
50
100
150
200
250
300
350
400
450
500
2013 FY 2014 FY 2013 H1 2014 H1 2015 H1
Revenue ($m)
Direct Marketing NA Direct Marketing UK
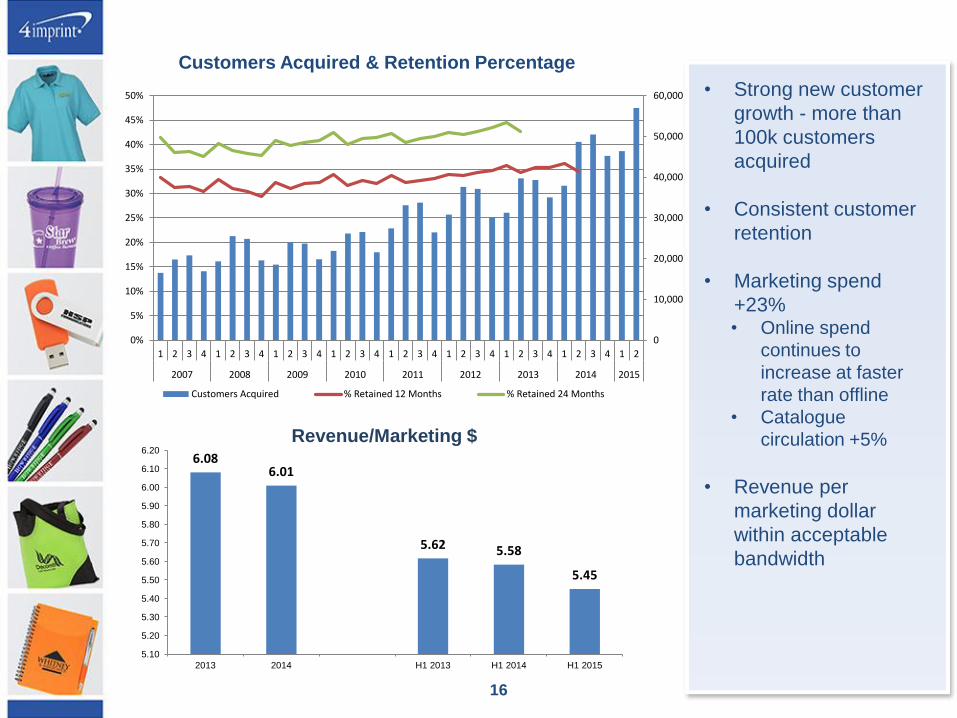
Customers Acquired & Retention Percentage
• Strong new customer
growth - more than
100k customers
acquired
• Consistent customer
retention
• Marketing spend
+23% • Online spend
continues to
increase at faster
rate than offline
• Catalogue
circulation +5%
• Revenue per
marketing dollar
within acceptable
bandwidth
Revenue/Marketing $
16
6.08 6.01
5.62 5.58
5.45
5.10
5.20
5.30
5.40
5.50
5.60
5.70
5.80
5.90
6.00
6.10
6.20
2013 2014 H1 2013 H1 2014 H1 2015
0
10,000
20,000
30,000
40,000
50,000
60,000
0%
5%
10%
15%
20%
25%
30%
35%
40%
45%
50%
1 2 3 4 1 2 3 4 1 2 3 4 1 2 3 4 1 2 3 4 1 2 3 4 1 2 3 4 1 2 3 4 1 2
2007 2008 2009 2010 2011 2012 2013 2014 2015
Customers Acquired % Retained 12 Months % Retained 24 Months
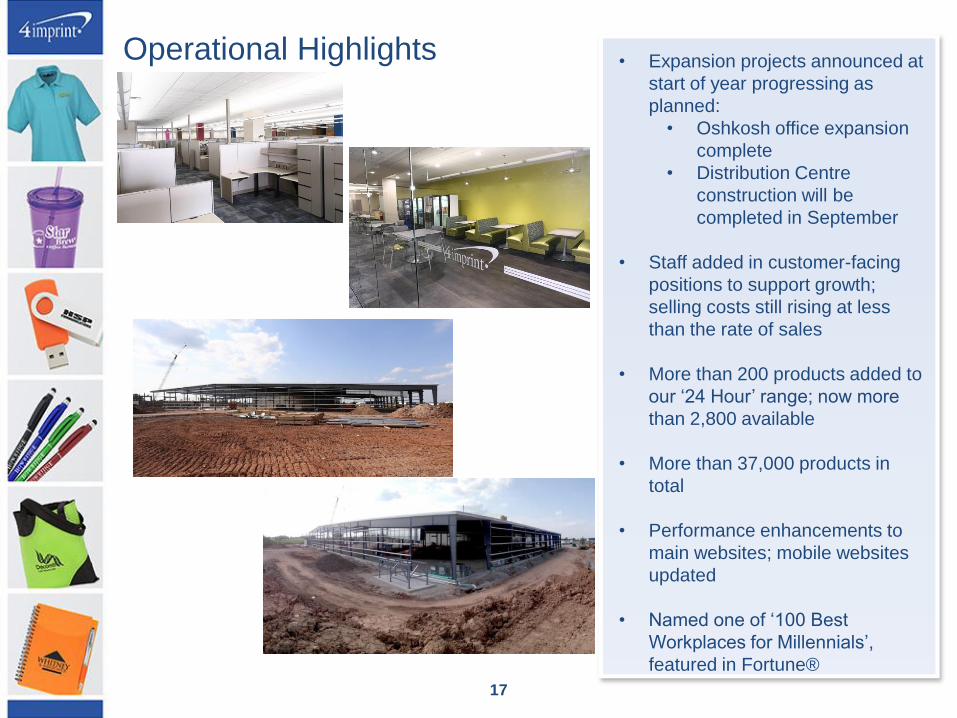
Operational Highlights • Expansion projects announced at
start of year progressing as
planned:
• Oshkosh office expansion
complete
• Distribution Centre
construction will be
completed in September
• Staff added in customer-facing
positions to support growth;
selling costs still rising at less
than the rate of sales
• More than 200 products added to
our ‘24 Hour’ range; now more
than 2,800 available
• More than 37,000 products in
total
• Performance enhancements to
main websites; mobile websites
updated
• Named one of ‘100 Best
Workplaces for Millennials’,
featured in Fortune®
17
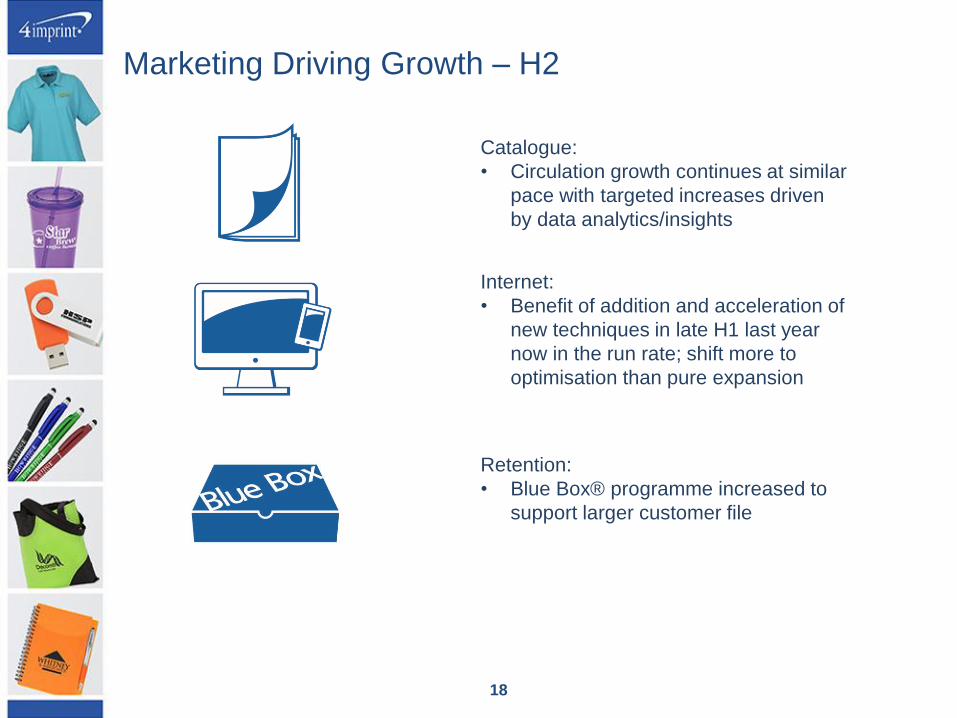
Marketing Driving Growth – H2
Catalogue:
• Circulation growth continues at similar
pace with targeted increases driven
by data analytics/insights
Internet:
• Benefit of addition and acceleration of
new techniques in late H1 last year
now in the run rate; shift more to
optimisation than pure expansion
Retention:
• Blue Box® programme increased to
support larger customer file
18
Indications for the balance of the year are for a good
performance in keeping with our strategic growth objectives,
despite the strong growth comparator in the second half of 2014.
The Group expects a good outcome for the year as a whole.
Outlook
19

Appendices
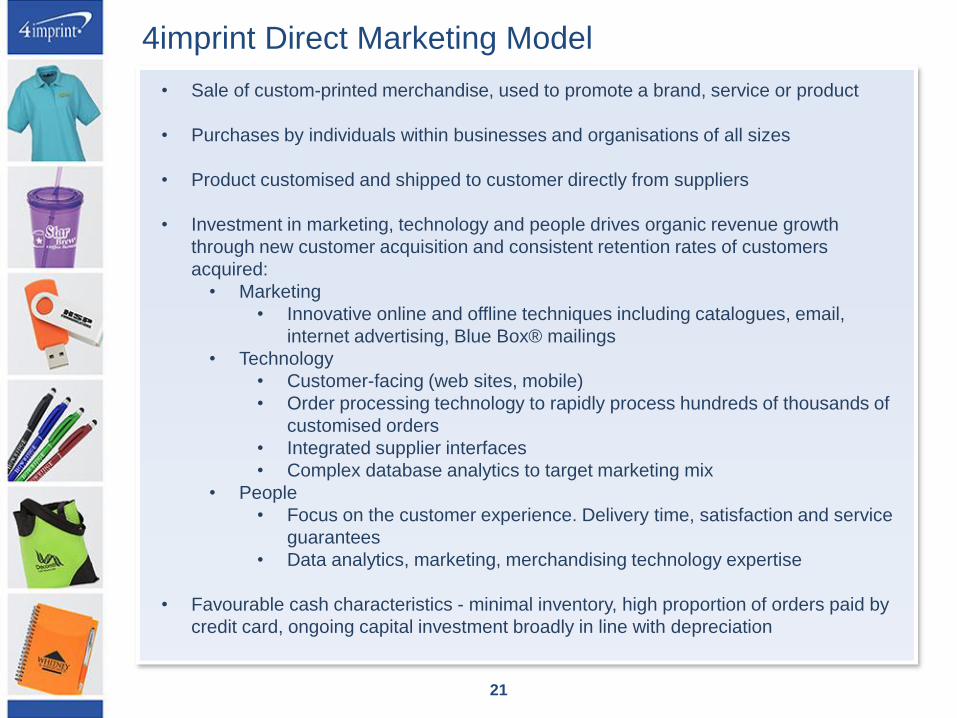
• Sale of custom-printed merchandise, used to promote a brand, service or product
• Purchases by individuals within businesses and organisations of all sizes
• Product customised and shipped to customer directly from suppliers
• Investment in marketing, technology and people drives organic revenue growth
through new customer acquisition and consistent retention rates of customers
acquired:
• Marketing
• Innovative online and offline techniques including catalogues, email,
internet advertising, Blue Box® mailings
• Technology
• Customer-facing (web sites, mobile)
• Order processing technology to rapidly process hundreds of thousands of
customised orders
• Integrated supplier interfaces
• Complex database analytics to target marketing mix
• People
• Focus on the customer experience. Delivery time, satisfaction and service
guarantees
• Data analytics, marketing, merchandising technology expertise
• Favourable cash characteristics - minimal inventory, high proportion of orders paid by
credit card, ongoing capital investment broadly in line with depreciation
4imprint Direct Marketing Model
21
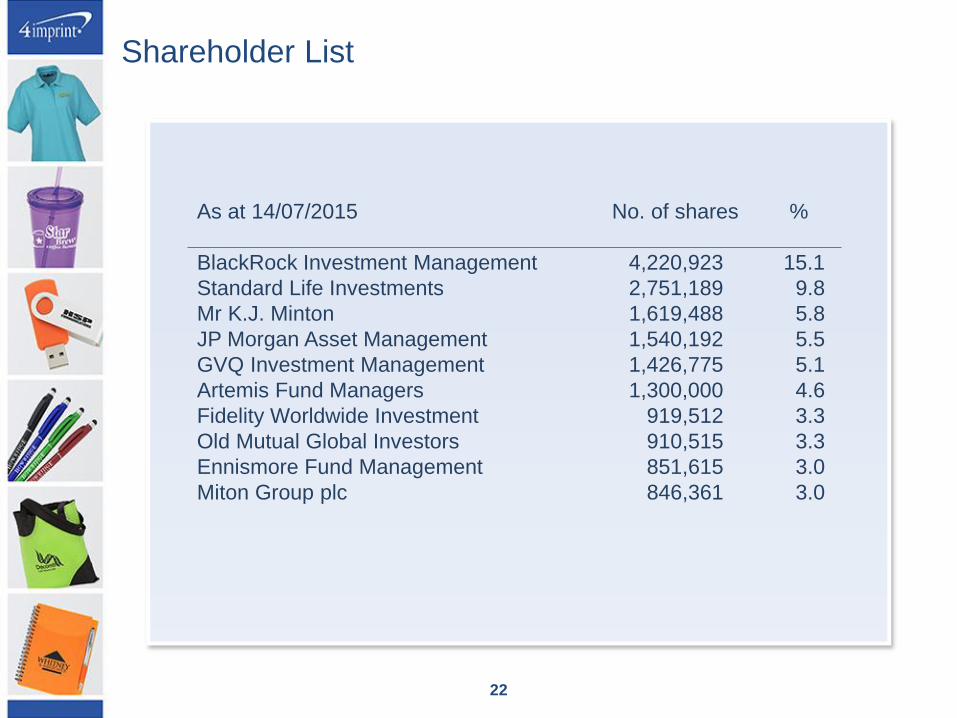
Shareholder List
As at 14/07/2015 No. of shares %
BlackRock Investment Management 4,220,923 15.1
Standard Life Investments 2,751,189 9.8
Mr K.J. Minton 1,619,488 5.8
JP Morgan Asset Management 1,540,192 5.5
GVQ Investment Management 1,426,775 5.1
Artemis Fund Managers 1,300,000 4.6
Fidelity Worldwide Investment 919,512 3.3
Old Mutual Global Investors 910,515 3.3
Ennismore Fund Management 851,615 3.0
Miton Group plc 846,361 3.0
22