Embed Size (px)
Citation preview

4D-A235 369REPAIR, EVALUATION, MAINTENANCE, AND 0
REHABILITATION RESEARCH PROGRAM
r ATECHNICAL REPORT REMR-CS-32
PROPERTIES OF SILICA-FUME CONCRETE
by
James E. McDonald
Structures Laboratory
DEPARTMENT OF THE ARMYWaterways Experiment Station, Corps of Engineers
3909 Halls Ferry Road, Vicksburg, Mississippi 39180-6199
US rm1CrprofEniner
rNl
March 19911PEGS E Final Report
Approved For Public Release; Distribution Unlimited
Prepared for DEPARTMENT OF THE ARMYUS Army Corps of Engineers
Washington, DC '1314-1000
ivil Works Research Work Unit 32303
DTIC FILE COPY ' - ,, t r ;
The following two letters used as part of the number designating technical reports of research published under the Repair.Evaluation, Maintenance, and Rehabilitation (REMR) Research Program identify the problem area under which the report
was prepared:
Problem Area Problem Area
CS Concrete and Steel Structures EM Electrical and Mechanical
GT Geotechnical El Environmental Impacts
HY Hydraulics OM Operations Management
CO Coastal
Destroy this report when no longer needed. Do not returnit to the originator.
The findings in this report are not to be construed as an officialDepartment of the Army position unless so designated
by other authorized documents.
The contents of this report are not to be used foradvertising, publication, or promotional purposes.
Citation of trade names does not constitute anofficial endorsement or approval of the use of such
commercial products.
COVER PHOTOS:
TOP- Position of strain meters in beam mold.
BOTTON- Abrasion-erosion test aparatus.

Form ApprovedREPORT DOCUMENTATION PAGE FM Noe 40
Public reporting bdurden for tis collection of information is estimated to average I hour per response, including the time for revewng instructions. searching existing data sources.gatheig and maintain the data needed, and completing and reiewing the collection of information Send comments rearding this burden estimate or any other aspect of thiscollection of information, including suggestions for reducing this burden. to Washington Headquarters Services, Directorate for Information Operations and Reports, 121S JeffersonDavis Highway, Suite 1204. Arlington. VA 22202-4302. and to the Office of Management and Budget. Paperwork Reduction Project (0704-0188), Washington, DC 20503.
1. AGENCY USE ONLY (Leave blank) 2. REORT DATE 3. REPORT TYPE AND DATES COVERED
I arc 1991 Final Report
4. TITLE AND SUBTITLE 5. FUNDING NUMBERS
Properties of Silica-Fume Concrete
6. AUTHOR(S)
James E. McDonald7. PERFORMING ORGANIZATION NAME(S) AND ADDRESS(ES) 8. PERFORMING ORGANIZATION
REPORT NUMBERUSAE Waterways Experiment StationStructures Laboratory Technical Report REMR-3909 Halls Ferry Road CS-32Vicksburg, MS 39180-6199
9. SPONSORING/ MONITORING AGENCY NAME(S) AND ADDRESS(ES) 10. SPONSORING / MONITORINGAGENCY REPORT NUMBER
US Army Corps of EngineersWashington, DC 20314-1000
11. SUPPLEMENTARY NOTES 1Ils is a report or Mne Concrete and Steel Structures problemarea of the Repair, Evaluation, Maintenance, and Rehabilitation (REMR) ResearchProgram. Available from National Technical Information Service, 5285 Port RoyalRoad, Springfield, VA 22161
12a. DISTRIBUTION/AVAILABILITY STATEMENT 12b. DISTRIBUTION CODE
Approved for public release; distribution unlimited
13. ABSTRACT (Maximum 200 words)Two major applications of silica-fume concrete within the Corps of Engi-
neers were to repair abrasion-erosion damage in the stilling basin at Kinzua Damand in the concrete lining of the low-flow channel, Los Angeles River. In eachcase, concrete cracking occurred during the repair. Apparently, this crackinghas not significantly affected the performance of the concrete in resistingabrasion-erosion damage. However, such cracking could limit the use of silica-fume concrete in other repair and rehabilitation applications.
This study was conducted to determine those properties of silica-fume con-crete which might affect cracking and to develop guidance for minimizing crack-ing problems associated with the use of such concrete in future repair projects.Tests included compressive and tensile splitting strengths, modulus of elastic-ity, Poisson's ratio, ultimate strain capacity, uniaxial creep, shrinkage, coef-ficient of thermal expansion, adiabatic temperature rise, and abrasion erosion.
(Continued)11.bSUBJECT TERMS .15. NUMBER OF PAGES
rasn-erosion resistance Hydraulic structures Silica fumi 48Concrete cracking Material properties 16. PRICE CODEHigh- strength concrete Repair
17. SECURITY CLASSIFICATION 18. SECURITY CLASSIFICATION 19. SECURITY CLASSIFICATION 20. LIMITATION OF ABSTRACTOF REPORT OF THIS PAGE OF ABSTRACT
UNCLASSIFIED UNCLASSIFIED II
NSN 7540-01-280-5500 Standard Form 298 (Rev 2-89)Prescribed by ANSI Std 139-185 29* ,102

Unclassified
13. (Concluded).
None of the material properties of silica-fume concrete reported herein,with the possible exception of autogenous shrinkage, indicate that this materialshould be significantly more susceptible to cracking as a result of restrainedcontraction than conventional concrete. In fact, some material properties, par-ticularly ultimate tensile strain capacity, would indicate that silica-fume con-crete should have a reduced potential for cracking.
Silica fume offers potential for improving many properties of concrete.However, the very high compressive strength and resulting increase in abrasion-erosion resistance are particularly beneficial in repair of hydraulic structures.These concretes should be considered in repair of abrasion-erosion susceptiblelocations, particularly in those areas where locally available aggregate mightnot otherwise be acceptable.
The potential for cracking of restrained concrete overlays, with or withoutsilica fume, should be recognized. Any variations in concrete materials, mixtureproportions, and construction practices that will minimize shrinkage or reduceconcrete temperature differentials should be considered. Where structural con-siderations permit, a bond breaker at the interface between the replacement andexisting concrete is recommended.
Unclassified

PREFACE
The study reported herein was authorized by Headquarters, US Army Corps
of Engineers (HQUSACE), under Civil Works Research Work Unit 32303, "Applica-
tion of New Technology to Maintenance and Minor Repair," for which
Mr. James E. McDonald, US Army Engineer Waterways Experiment Station (WES),
Structures Laboratory (SL), is Principal Investigator. This work unit is part
of the Concrete and Steel Structures Problem Area of the Repair, Evaluation,
Maintenance, and Rehabilitation (REMR) Research Program sponsored by HQUSACE,
for which Mr. McDonald is the Problem Area Leader. The Overview Committee at
HQUSACE for the REMR Research Program consists of Mr. James E. Crews (CECW-OM)
and Dr. Tony C. Liu (CECW-EG). Technical Monitor for this study was Dr. Liu.
Mr. Jesse A. Pfeiffer, Jr. (CERD-C) was the REMR Coordinator at the Director-
ate of Research and Development, HQUSACE. Program Manager for REMR is
Mr. William F. McCleese (CiWES-SC-A).
The study was performed at WES under the general supervision of
Mr. Bryant Mather, Chief, SL, and Mr. Kenneth L. Saucier, Chief, Concrete
Technology Division (CTD), and under the direct supervision of Mr. McDonald,
who prepared this report. Concrete casting and testing activities were moni-
tored by Mr. Donald M. Walley, CTD.
COL Larry B. Fulton, EN, was Commander and Director of WES during publi-
cation of this report. Dr. Robert W. Whalin was Technical Director.
I

CONTENTS
Page
PREFACE ............................................................. 1
CONVERSION FACTORS, NON-SI TO SI (METRIC) UNITS OF MEASUREMENT ...... 3
PART I: INTRODUCTION .................................................. 4
Background ......................................................... 4Purpose ....................................................... 4Scope ......................................................... 5
PART II: MATERIALS AND TEST SPECIMENS ................................. 6
Materials ..................................................... 6Test Specimens ..................................................... 7
PART III: RESULTS AND DISCUSSION ...................................... 10
Elastic Properties ................................................ 10Creep and Shrinkage .............................................. 12Ultimate Strain Capacity ......................................... 26Thermal Properties ................................................ 27Abrasion Erosion .................................................. 30
PART IV: CONCLUSIONS AND RECOMMENDATIONS .............................. 34
Conclusions ................................................... 34Recommendations ................................................... 36
REFERENCES .......................................................... 37
TABLES 1-4
2
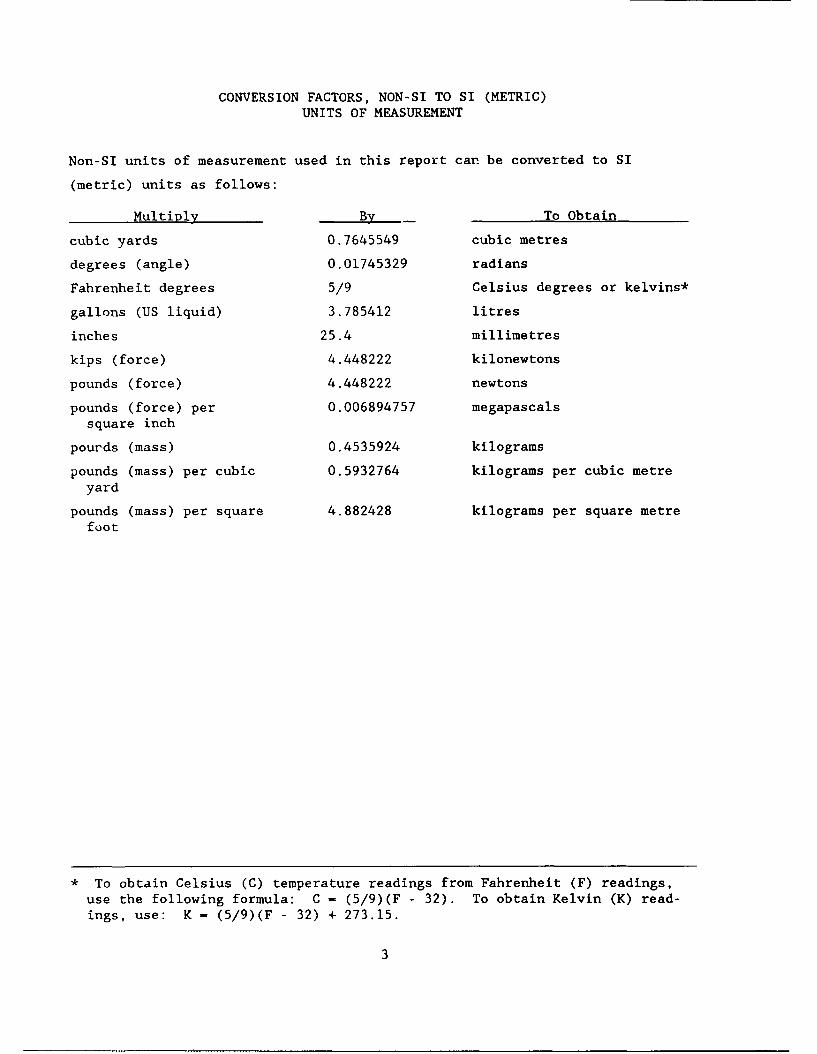
CONVERSION FACTORS, NON-SI TO SI (METRIC)
UNITS OF MEASUREMENT
Non-SI units of measurement used in this report can be converted to SI
(metric) units as follows:
Multiply By To Obtain
cubic yards 0.7645549 cubic metres
degrees (angle) 0.01745329 radians
Fahrenheit degrees 5/9 Celsius degrees or kelvins*
gallons (US liquid) 3.785412 litres
inches 25.4 millimetres
kips (force) 4.448222 kilonewtons
pounds (force) 4.448222 newtons
pounds (force) per 0.006894757 megapascals
square inch
pourds (mass) 0.4535924 kilograms
pounds (mass) per cubic 0.5932764 kilograms per cubic metre
yard
pounds (mass) per square 4.882428 kilograms per square metre
foot
* To obtain Celsius (C) temperature readings from Fahrenheit (F) readings,
use the following formula: C - (5/9)(F - 32). To obtain Kelvin (K) read-
ings, use: K - (5/9)(F - 32) + 273.15.
3

PROPERTIES OF SILICA-FUME CONCRETE
PART I: INTRODUCTION
Background
1. Laboratory tests have shown that the addition of an appropriate
amount of silica fume and a high-range water-reducing admixture (HRWRA) to a
concrete mixture will greatly increase compressive strength. This, in turn,
increases abrasion-erosion resistance (Holland 1983, 1986a, 1986b). As a
result of these tests, concretes containing silica fume were used by the
US Army Engineer Districts, Pittsburgh and Los Angeles, to repair abrasion-
erosion damage in the stilling basin at Kinzua Dam (Holland et al. 1986) and
in the concrete lining of the low-flow channel, Los Angeles River (Holland and
Gutschow 1987), respectively. In each case, concrete cracking occurred during
repair. At Kinzua Dam, the cracks usually appeared 2 or 3 days after concrete
placement. The widths of the cracks at the surface were initially 0.01 to
0.02 in.* and decreased with depth. Ultimately, the cracks were primarily
attributed to restraint of volume changes resulting from thermal expansion and
contraction and, possibly, autogenous shrinkage. Several different approaches
to eliminate or minimize the cracking were attempted; however, no overall
solution to the problem with cracking was found. An inspection of the jtill-
ing basin by divers approximately 3-1/2 years after the repair indicated that
the maximum depth of erosion, located along joints and cracks in the slabs,
was approximately 1 in.
2. Apparently, cracks in the concretes containing silica fume have not
significantly affected their performance in resisting abrasion-erosion damage.
However, such cracking could limit the use of silica-fume concrete in other
repair and rehabilitation applications.
Purpose
3. The purpose of this study was to determine those properties of
* A table of factors for converting non-SI units of measurements to SI
(metric) units is presented on page 3.
4

silica-fume concrete which might affect cracking and to develop guidance to
avoid or minimize cracking problems associated with the use of silica-fume
concrete in future repair projects.
Scope
4. Concrete materials and mixture proportions similar to those used in
the Kinzua Dam repair were obtained for casting laboratory test specimens.
Tests included compressive strength, splitting tensile strength, modulus of
elasticity, Poisson's ratio, ultimate strain capacity, uniaxial creep,
shrinkage, coefficient of thermal expansion, adiabatic temperature rise, and
abrasion erosion resistance. Results of these tests were compared with the
results of tests on similar concretes without silica fume which were used on
recent Corps projects.
5

PART II: MATERIALS AND TEST SPECIMENS
Materials
5. The aggregates, cement, and silica fume were supplied by the
Pittsburgh District. The remaining materials were laboratory stock at the
US Army Engineer Waterways Experiment Station (WES). All of the materials
used are described in the following paragraphs.
Aggregates
6. The coarse aggregate used, WES, Structures Laboratory (SL) Serial
No. CL 55-MG-I, was from Allegheny Minerals Company, Harrisboro, PA. The
crushed limestone had an absorption of 0.41.
7. The fine aggregate used, SL Serial No. CL 55-5-1, was from Tionesta
Sand and Gravel Company, Tidiout, PA. The washed pit sand had an absorption
of 2.17.
Cement
8. The cement used, SL Serial No. CL 55-C-1, was from Armstrong Cement
Company, Cabot, PA. The cement met the requirements of American Society for
Testing and Materials (ASTM) C 150-86 (ASTM 1987e) for a Type I (low-alkali)
cement.
Mineral admixture
9. The silica fume used, SL Serial No. CL 55-AD 847, was from Elkem
Chemicals Company, Pittsburgh, PA. Silica fume is finely divided dust
collected at electric furnaces where silicon or ferrosilicon is being made.
This material fills spaces between cement particles that otherwise would be
waterfilled, thus producing stronger concrete. According to the supplier,
material characteristics were as follows:
Test Result
Fineness 274,950 cm2/gmSi02 content 94.52%
Loss on ignition 2.63%Moisture content 0.34%
10. The silica fume used at Kinzua Dam and in this study was supplied
as slurry in 55-gal drums. According to the supplier, slurry proportions for
a l-cu-yd batch of concrete were as follows:
6

Material Weight, lb
Water 134Silica fume 118Chemical admixture 11
Chemical admixture
11. The HRWRA used was provided as part of the silica-fume slurry.
This admixture permits workable concrete of low water content and, hence, high
strength.
Test Specimens
12. A concrete mixture proportioned with 3/4-in. nominal maximum size
aggregate for 12,500-psi compressive strength at 28 days was used to cast all
test specimens. The water-cement (w/c) plus silica-fume ratio was 0.28.
Mixture proportions for a l-cu-yd batch were as follows:
Material Weight, lb
Cement, Type I/II 650Silica-fume slurry 263Coarse aggregate 1,637Fine aggregate 1,388Water 85
Slump and air content of the freshly mixed concrete averaged 9-1/4 in. and
2.2 percent, respectively. Test specimens were fabricated according to
applicable provisions of ASTM C 192-81 (ASTM 1987a) as described in the
following paragraphs.
Strength and elasticity
13. Twenty-four 6- by 12-in. cylinders were cast for strength and
elasticity tests. Because of the limited supply of concrete materials, only
two specimens were cast for each test condition. After they were cast, the
cylinders were cured in their molds under moist burlap for 24 hr; then the
molds were stripped, and the specimens were stored at 730 F in a moist curing
room until the time of testing.
Creep and drying shrinkage
14. Ten 6- by 16-in. cylindrical concrete specimens, each containing an
embedded Carlson strain meter, were fabricated for creep and shrinkage test-
ing. These specimens were cast horizontally in a steel mold which maintained
7

parallelism of the 1-in. end plates. After they were consolidated on a
vibrating table, the specimens were troweled to complete the circular cross
section and then placed under moist burlap. After approximately 24 hr, the
specimens were stripped and stored in a moist curing room at 730 F until the
time of testing.
Autogenous volume change
15. Four 6- by 16-in. cylindrical specimens, each containing an
embedded Carlson strain meter, were fabricated for autogenous volume-change
testing. Casting procedures were the same as those previously described for
the creep and drying shrinkage specimens. The unrestrained volume-change
specimens were demolded 13.25 hr after casting when the concrete reached final
set. Following initial strain and temperature measurements, the test speci-
mens were continuously stored in a moist curing room.
16. Six restrained volume-change specimens, prisms 3-in. square with a
gage length of 10 in., were fabricated in accordance with ASTM C 878-87 (ASTM
1987h). The specimens were demolded approximately 24 hr after casting. Fol-
lowing initial length measurements, two specimens each were cured under the
following conditions: plastic bags in air, moist curing room, and lime-
saturated water, all at 730 F.
Ultimate strain capacity
17. Twelve 12- by 12- by 66-in. concrete beams were cast in steel forms
for ultimate strain-capacity tests. Strain meters were positioned in the
forms parallel to the tensile and compressive faces, 1-1/2 in. from the
concrete surface, and centered within the middle one-third of a 60-in. simple
span (Figure 1), prior to concrete placement. All beams were consolidated
internally, surface finished, and cured in their molds under moist burlap at730 F for a period of approximately 24 hr. The beams were then stripped,
rotated 90 deg, aiA tested or stored under moist burlap pending testing as
appropriate.
Abrasion-erosion
18. Three concrete cylinders, 4 in. high with a 11-3/4-in. diam, were
fabricated for abrasion-erosion testing. After consolidation and surface
finishing, specimens were cured in their molds under moist burlap for approxi-
mately 24 hr. The cylinders were then stripped and stored in a tank of lime-
saturated water until time of testing.
8

Figure 1. Position of strain meters in beam mold
Coefficient of thermal expansion
19. Four 6- by 16-in. cylindrical concrete specimens, each containing
an embedded Carlson strain meter, were fabricated for coefficient of thermal
expansion testing. Casting and curing procedures were the same as those pre-
viously described for the creep and shrinkage specimens.
Adiabatic heat rise
20. A 30- by 30-in. concrete cylinder containing five electrical resis-
tance thermometers was fabricated for the adiabatic temperature-rise test.
Immediately after the concrete was placed and consolidated, the cover for the
sheet metal specimen container was soldered in place. The specimen was then
insulated and placed in the test cabinet.
9

PART III: RESULTS AND DISCUSSION
Elastic Properties
Compressive strength and
splitting tensile strength
21. Compressive strength and splitting tensile strength tests were
conducted at 1, 3, 7, 28, 90, 180, and 365 days. Compressive strength testing
was done in accordance with ASTM C 39-86 (ASTM 1987d). Splitting tensile
strength testing was done in accordance with ASTM C 496-86 (ASTM 1987f).
Results are presented in Table 1.
22. Compressive strengths of the silica-fume concrete ranged from
6,080 psi at 1 day to 14,910 psi at 1 year. The concrete gained strength at a
very rapid rate with 1- and 3-day compressive strengths of 6,080 and
8,200 psi, respectively (Figure 2). The 28-day compressive strength
(14,280 psi) was 96 percent of the strength at 1 year. In comparison, the
compressive strength of conventional concrete, containing similar limestone
aggregate, without silica fume and HRWRA, was only 5,710 psi at 28 days. The
w/c ratio of the conventional concrete was 0.45 (Holland 1983).
23. Splitting tensile strengths ranged from 500 psi at 1 day to a maxi-
mum of 1,015 psi at 90 days (Figure 3). Splitting tensile strengths at the
various ages ranged from 5.8 to 8.2 percent of the compressive strength at the
same age. The higher percentages, 8.2 and 8.0 percent, were at the earlier
ages of 1 and 3 days, respectively. Overall, splitting tensile strengths
averaged approximately 7 percent of comparable compressive strengths. This
value is in general agreement with the approximately 9 percent reported by
Saucier (1984) for a range of silica-fume concrete mixtures and the normally
accepted value of 10 percent for conventional concrete.
Modulus of elasticityand Poisson's ratio
24. The modulus of elasticity and Poisson's ratio were obtained from
cylinders tested for compressive strength. Prior to testing, two electrical
resistance wire strain gages were mounted diametrically opposite each other
along both the longitudinal and transverse axes of each specimen. An X-Y
plotter was used to graphically record stresses and strains. Results of these
strain measurements were used to compute the secant modulus of elasticity and
10

20000!1-
0
L
U)
a
0
1.0 10 100 1000Age. days
Figure 2. Compressive strength gain
1 0004)
a)
-3
01.0 10 100 1000
Age. days
Figure 3. Splitting tensile strength gain

Poisson's ratio at 50 percent of ultimate compressive strength (Table 1).
25. The modulus of elasticity increased with age (Figure 4), ranging
from 4.1 X 10⁶ psi at 1 day to 7.0 x 10⁶ psi at I year. These measured values
for modulus of elasticity are essentially the same as the values calculated
according to the American Concrete Institute (ACI) Committee 318 (1988)
equation,
E = 571000f
where
E - modulus of elasticity, psi X 106
V - compressive strength, psic
Overall, the average difference in actual and calculated values of modulus of
elasticity was less than 6 percent (Figure 5). Ozyildirim (1986) also
reported that the modulus of elasticity is similar for concrete with and with-
out silica fume. Poisson's ratio at the various test ages was essentially
constant, ranging from 0.21 to 0.24.
Creep and Shrinkage
Uniaxial creep
26. Uniaxial creep tests, conducted in accordance with ASTM C 512-87
(ASTM 1987g) were initiated at 1, 3, and 7 days. In each case, two specimens
were loaded incrementally to 25 percent of the ultimate compressive strength
at the time of testing. Strain measurements were made immediately prior to
loading, at each load increment, upon completion of loading, and periodically
during the sustained loading period of approximately 1 year. Temperature and
relative humidity during the tests were approximately 730 F and 50 percent,
respectively. Unloaded specimens subjected to the same environmental condi-
tions as the loaded specimens (Figure 6) were used as controls to determine
volume changes under the static temperature and moisture conditions.
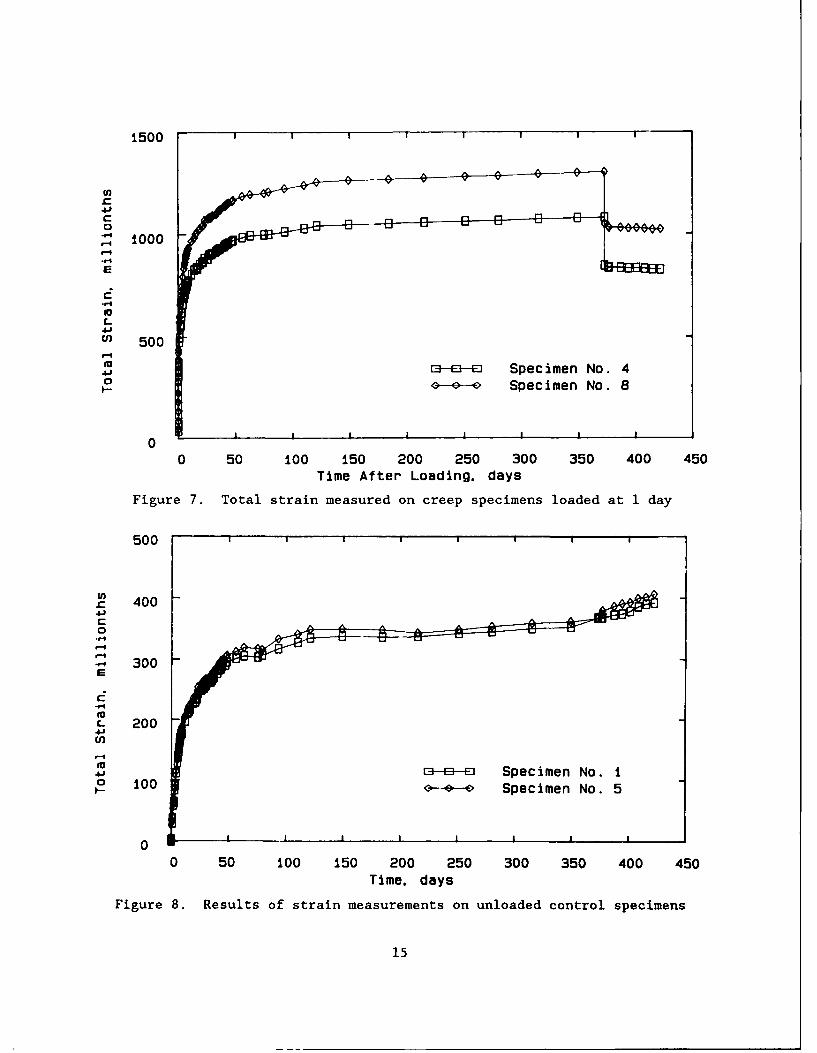
27. At 1 day, creep specimens No. 4 and 8 were loaded in 200-psi incre-
ments to a total sustained load of 1,520 psi. After approximately I year
12

10
8
x-4.
-
M0.
xi 6
u .4+0. 6LN (X
U)
1.0 10 100 1000
Age, days
Figure 4. Increase in modulus of elasticity with time
Actual Calculated
8
x6-
a.
-t
137 28 90 365
Ag, days
Figure 5. A comparison of actual and calculated values
of modulus of elasticity
under load, the creep specimens were unloaded. Results of total strain mea-
surements during the entire test period are presented in Figure 7.
13

Figure 6. Creep and control specimens duringtesting period
Concurrently, strain measurements were made on the unloaded control specimens
with results as presented in Figure 8.
28. Elastic strains resulting from application of the sustained load
equal to 25 percent of the compressive strength were 320 and 331 millionths
for specimens No. 4 and 8, respectively. The average secant modulus of
elasticity calculated from these strains was 4.7 x 10⁶ psi. In comparison,
the average secant modulus of elasticity determined from the compressive
strength tests at 50 percent of the ultimate strength was 4.1 x 10⁶ psi.
Usually, the modulus of elasticity based on the creep specimens is lower
compared to that based on compressive specimens. This lower modulus is
14
1500
U)z61
C0
-'-I- 1000
C-
U) 500
4j8-- Specimen No. 40 ~-e--~ Specimen No. 8
00 50 100 150 200 250 300 350 400 450
Time After Loading. days
Figure 7. Total strain measured on creep specimens loaded at 1 day
500
U)z 4004 1C0
300
2- 20
C
00
0 2000 15 0 50 30 30 0 5
Tie.das- Seie No I
Figure 8. Results of strain measurements on unloaded control specimens
15

generally attributed to larger strains in the creep specimens resulting from
the longer time required for load application and strain measurement.
However, in this case, the modulus of elasticity based on the creep specimens
was higher than that based on the compressive strength tests.
29. The elastic strain for specimen No. 8 was only 4 percent higher
than that of specimen No. 4. However, at the end of the loading period, the
total strain for specimen No. 8 was 20 percent higher than for specimen No. 4.
Creep strains were obtained by (a) subtracting the elastic strain from the
total strains for each specimen and (b) correcting this result for the appro-
priate volume change. Specific creep was calculated by dividing creep strains
by the sustained load. Curves-of-best-fit based on least-squares analyses
were computed for specific creep with results as shown in Figure 9.
30. At 3 days, specimens No. 3 and 9 were loaded in 200-psi increments
to a total load of 2,050 psi. Results of total strain measurements are pre-
sented in Figure 10. Results of strain measurements on an unloaded control
specimen are presented in Figure 11.
31. The elastic strain and the total strain at the end of the sustained
loading period were 6 percent higher for specimen No. 3 than for speci-
men No. 9. The average modulus of elasticity calculated from the creep
specimen data (5.1 x 10⁶ psi) was essentially the same as that calculated from
the compressive strength tests (5.0 x 10⁶ psi). A curve-of-best-fit based on
a least-squares analysis was computed for the average specific creep of the
two test specimens with results shown in Figure 12.
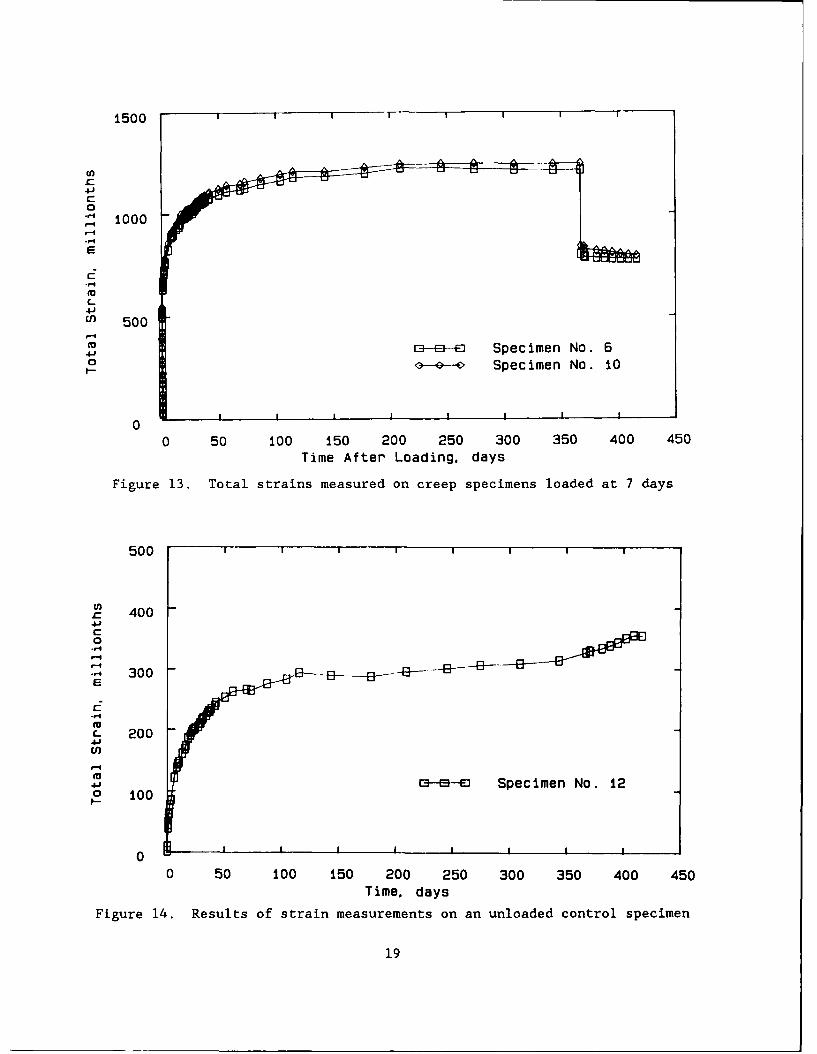
32. At 7 days, specimens No. 6 and 10 were loaded in 200-lb increments
to a total load of 2,695 psi. Results of total strain measurements are
presented in Figure 13. Results of strain measurements on an unloaded control
specimen are presented in Figure 14.
33. The elastic strain and the total strain at the end of the loading
period were approximately 7 and 3 percent higher, respectively, for speci-
men No. 10 than for specimen No. 6. The average modulus of elasticity
calculated from the creep specimen data (5.7 x 10⁶ psi) was essentially the
same as that calculated from the compressive strength tests (5.6 X 10⁶ psi).
A curve-of-best-fit based on a least-squares analysis was computed for the
average specific creep of the two test specimens with results as shown in
Figure 15.
16

0.400[I
CL 0.300
C 0
0
S0.200 1I
C- 0.100oU)
0. 1.0Time After Loading (T+i). days
Figure 9. Average specific creep for specimens loaded at 1 day
1500
C
0- 1000
C-
(n 500
4J Ci--l- Specimen No. 310 0 0- Specimen No. 9
00 50 100 150 200 250 300 350 400 450
Time After Loading. days
Figure 10. Total strain measured on creep specimens loaded at 3 days
17

500
Unr 400
C0
S300E
C- 200.4.U)
-1
4J3f~-E Specimen No. 2
0 - ---- - I
0 50 ioo 150 200 250 300 350 400 450Time. days
Figure 11. Results of strain masurements on an unloaded control specimen
0.250 Do_- i]~.~Z '[-1 ~~L 1- 00--
., 0.200
(n:0. 15
0.100 L
*n 0.050-1 -0.
.0 -o1010
TimeC Afe odn TI.dy
Fiue1.Aeaeseii repfrseieslae t3dy
C-8
1500
0" 1 1000
C
L
m 500
m Specimen No. 6t0 Specimen No. 10
0
0 50 100 150 200 250 300 350 400 450
Time After Loading. days
Figure 13. Total strains measured on creep specimens loaded at 7 days
500
w 400.C
42 20
C0
-109
-'-I
-4 300E
C- 200.41U)
4J8B-- Specimen No. 12
00 50 100 150 200 250 300 350 400 450
Time, days
Figure 14. Results of strain measurements on an unloaded control specimen
19

0.200 T" ---_
o00150 1UU)
0.00
1.0 10 100 O00
Time After Loading (T+i). days
Figure 15. Average specific creep for specimens loaded at 7 days
34. The creep specimens loaded at 7 days exhibited a specific creep of
0.14 millionths/psi after 90 days under a sustained load of 2,695 psi.
Saucier (1984) reported a specific creep of 0.086 millionths/psi for silica-
fume concrete specimens loaded to 2,000 psi at 28 days. Also, specific creep
of the same concrete mixture without silica fume was 0.098 millionths/psi or
about 12 percent higher, under the same test conditions. Considering that the
earlier the concrete is loaded the greater the resulting creep, the creep test
results reported herein appear to be comparable with those previously reported
by Saucier (1984). Others have also reported that creep of silica-fume
concrete is less than that of comparable conventional concrete. For example,
Houde, Prezeau, and Roux (1987) reported that "creep of concrete with and
without fibers was decreased by at least 20 percent when 5 to 10 percent of
cement was replaced by silica fume."
35. After 1 year under a sustained load of 800 psi, conventional
concretes exhibited creep strains ranging from about 450 to 1,150 millionths
depending on the type of aggregate (Troxell, Raphael, and Davis 1958). These
4- by 14-in. cylindrical specimens were loaded at 28 days and stored in air at
70° F and 50-percent relative humidity after loading. The specific creep of
20

these concretes ranged from 0.56 to 1.44 millionths/psi or 3 to 8 times higher
than the creep of silica-fume concrete loaded at 7 days in the tests reported
herein.
Drying shrinkage
36. Strain measurements on the unloaded control specimens in the creep
tests were used to determine the drying shrinkage of silica-fume concrete
exposed to 730 F and 50 percent relative humidity. Tests were initiated at 1,
3, and 7 days with results as shown in Figure 16.
500 - -
-II
400
300 iOi0 0
E
1 00
Time (T+6) days
Figure 16. Results of drying shrinkage tests initiated at 1, 3, and 7 days
37. After 1 year of exposure in air, the drying shrinkage of silica-
fume concrete was 400, 398, and 343 millionths for tests initiated at 1, 3,
and 7 days, respectively. In similar tests initiated at 28 days, 4- by 14-in.
cylinders of conventional concrete exhibited drying shrinkage strains ranging
from 400 to 1,000 millionths depending on the type of aggregate (Troxell,
Raphael, and Davis 1958).
38. In tests initiated at 14 days, Saucier (1984) reported drying
shrinkage strains of 335 and 380 millionths for concrete with and without
silica fume, respectively, after 90 days storage in air. In comparison, the
current tests initiated at 1, 3, and 7 days resulted in drying shrinkage
21
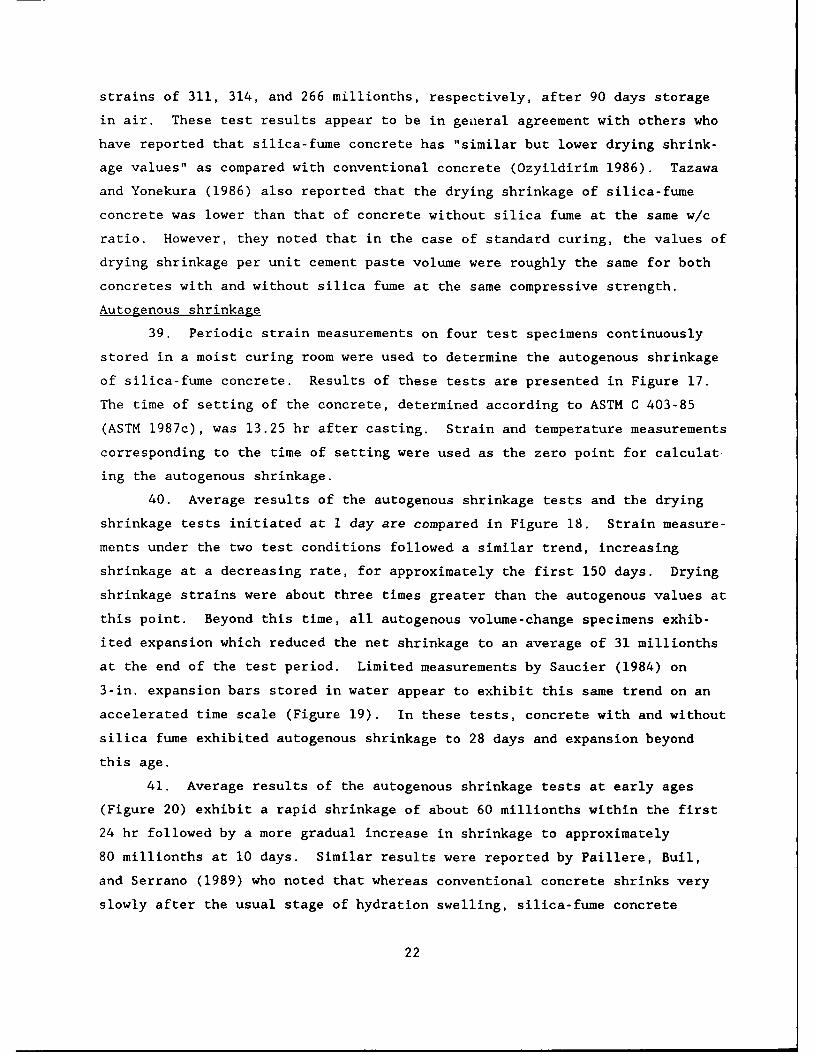
strains of 311, 314, and 266 millionths, respectively, after 90 days storage
in air. These test results appear to be in general agreement with others who
have reported that silica-fume concrete has "similar but lower drying shrink-
age values" as compared with conventional concrete (Ozyildirim 1986). Tazawa
and Yonekura (1986) also reported that the drying shrinkage of silica-fume
concrete was lower than that of concrete without silica fume at the same w/c
ratio. However, they noted that in the case of standard curing, the values of
drying shrinkage per unit cement paste volume were roughly the same for both
concretes with and without silica fume at the same compressive strength.
Autogenous shrinkage
39. Periodic strain measurements on four test specimens continuously
stored in a moist curing room were used to determine the autogenous shrinkage
of silica-fume concrete. Results of these tests are presented in Figure 17.
The time of setting of the concrete, determined according to ASTM C 403-85
(ASTM 1987c), was 13.25 hr after casting. Strain and temperature measurements
corresponding to the time of setting were used as the zero point for calculat.
ing the autogenous shrinkage.
40. Average results of the autogenous shrinkage tests and the drying
shrinkage tests initiated at I day are compared in Figure 18. Strain measure-
ments under the two test conditions followed a similar trend, increasing
shrinkage at a decreasing rate, for approximately the first 150 days. Drying
shrinkage strains were about three times greater than the autogenous values at
this point. Beyond this time, all autogenous volume-change specimens exhib-
ited expansion which reduced the net shrinkage to an average of 31 millionths
at the end of the test period. Limited measurements by Saucier (1984) on
3-in. expansion bars stored in water appear to exhibit this same trend on an
accelerated time scale (Figure 19). In these tests, concrete with and without
silica fume exhibited autogenous shrinkage to 28 days and expansion beyond
this age.
41. Average results of the autogenous shrinkage tests at early ages
(Figure 20) exhibit a rapid shrinkage of about 60 millionths within the first
24 hr followed by a more gradual increase in shrinkage to approximately
80 millionths at 10 days. Similar results were reported by Paillere, Buil,
and Serrano (1989) who noted that whereas conventional concrete shrinks very
slowly after the usual stage of hydration swelling, silica-fume concrete
22

150 1 1 1
*-K---- Specimen No. 138-8--EJ Specimen No. 14
Y"',-X_-X_< Specimen No. 15U)
r ~---~ Specimen No. 16S100
0
E
(0 50L.4-
00 50 100 150 200 250 300 350 400 450 500
Age. days
Figure 17. Autogenous shrinkage of silica-fume concrete
500 1 ---- r
400
C0
300
E
200 ~EI--~Drying Shrinkagem Ce- Autogenous Shrinkage
00 50 100 150 200 250 300 350 400 450 500
Time. days
Figure 18. Average results of drying shrinkage tests initiated at 1 dayand autogenous shrinkage tests
23

150 1
0050
0
E /
C 0C_
E-8--EJ Silica-Fume (Saucier)-50 -s. Conventional (Saucier)
x x x Silica-Fume
-1000 20 40 60 80 O0 120
Age, days
Figure 19. Autogenous volume change of silica-fume concrete compared toconventional concrete
100 -r
80kU) I
C
-u0I 6
40E
CD 40
20 0 ,, II I II
0 1 2 3 4 5 6 7 8 9 t0Age. days
Figure 20. Average results of autogenous shrinkage tests at early ages
24
(w/c - 0.26) exhibited no swelling stage and shrinkage was immediate (from
6 hr) reaching 105 millionths at 92 hr. Also, in the absence of any evapo-
ration or desiccation, concrete having very low w/c ratios, with and without
silica fume, exhibits high autogenous shrinkage sufficient to cause cracking.
This high autogenous shrinkage is attributed to self-desiccation resulting
from the hydration of the cement at a very low w/c ratio. Attempts to correct
this weakness of the material by adding steel fibers were only partially
successful (Paillere, Buil, and Serrano 1989). The fiber-reinforced concretes
exhibited an autogenous shrinkage lower than the reference concrete but still
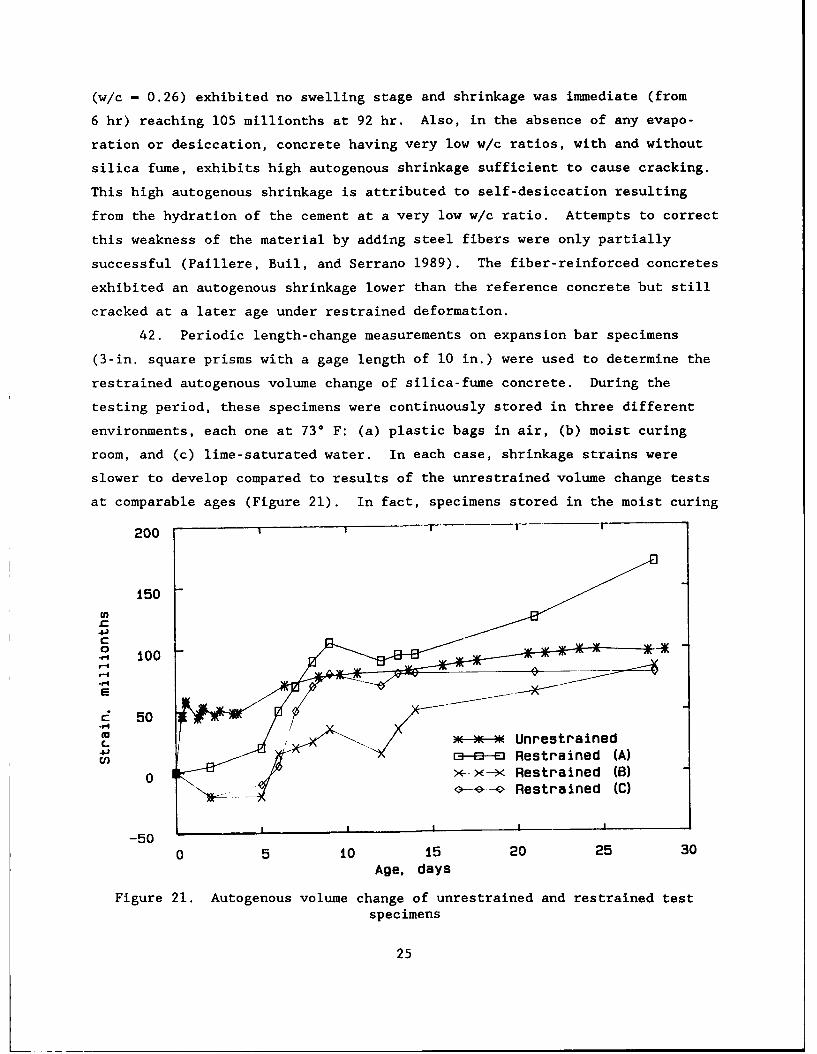
cracked at a later age under restrained deformation.
42. Periodic length-change measurements on expansion bar specimens
(3-in. square prisms with a gage length of 10 in.) were used to determine the
restrained autogenous volume change of silica-fume concrete. During the
testing period, these specimens were continuously stored in three different
environments, each one at 730 F: (a) plastic bags in air, (b) moist curing
room, and (c) lime-saturated water. In each case, shrinkage strains were
slower to develop compared to results of the unrestrained volume change tests
at comparable ages (Figure 21). In fact, specimens stored in the moist curing
200
150mC0
E
e 50A - Unrestrained
U) a-a--E Restrained (A)0 x-x--x Restrained (B)
------ Restrained (C)
iIII I
-50
0 5 10 15 20 25 30
Age. days
Figure 21. Autogenous volume change of unrestrained and restrained testspecimens
25

room and lime-saturated water exhibited an average expansion strain of 15 mil-
lionths at 5 days. At this point, these specimens began to shrink and at the
end of the test exhibited an average shrinkage strain of 83 millionths,
15 percent less than the unrestrained test results. The restrained specimens
placed in plastic bags and stored in air (environment a) did not exhibit a
swelling stage. These specimens, with no external source of moisture,
exhibited immediate and continuing shrinkage with an average strain of
170 millionths, approximately twice that of the other restrained test speci-
mens, at 28 days.
Ultimate Strain Capacity
43. Ultimate strain capacity tests, performed in accordance with
CRD-C 71-80 (US Army Engineer Waterways Experiment Station (USAEWES) (1949c))
were conducted at 1, 3, 7, 28, 90, 180, and 365 days. At each age, two beams
were loaded to failure in third-point flexure with a loading rate of 40 psi/
min outer fiber stress. In the early-age tests, strains were recorded man-
ually after each 1,000-lb increment of total load. In later tests, load and
strain data were continuously recorded on magnetic tape.
44. The actual modulus of rupture was calculated for each specimen in
accordance with ASTM C 78-84 (ASTM 1987b). Results are presented in Table 2.
The actual and predicted values for modulus of rupture are compared in Fig-
ure 22. The predicted values were calculated according to the ACI Commit-
tee 318 (1988) equation,
f -7.5 f'r c
where
fr - modulus of rupture, psi
f - compressive strength, psic
The differences in actual and calculated values were less than 10 percent at 1
and 3 days. However, the differences increased significantly at compressive
strengths in excess of 10,000 psi. The actual modulus of rupture exceeded the
calculated by an average of 23 percent in tests beyond 3 days.
26

Actual Calculated
1500
.10004-
0 a500-
0
1 3 7 28 90 365
Ag. days
Figure 22. Comparison of actual and calculated values formodulus of rupture
45. Strains measured at the strain meters were extrapolated to the
surface fibers of the specimens assuming a linear strain distribution. Typi-
cal load-strain curves are presented in Figure 23. The ultimate tensile
strain capacity is the tensile strain at 90 percent of the ultimate load.
Ultimate strain capacity test data are presented in Table 2.
46. The higher tensile stress and strain capacities of silica-fume
concrete compared with that of conventional concrete used in recently con-
structed Corps of Engineers projects (Bombich, Sullivan, and McDonald 1977;
Holland, Liu, and Bombich 1982) are shown in Figure 24. The tensile strain
capacity of the silica-fume concrete averaged about 2-1/2 times greater than
that of conventional concrete. The ratios between stress and strain capaci-
ties accurately reflect the higher modulus of elasticity of the silica-fume
concrete.
Thermal Properties
Adiabatic temperature rise
47. The adiabatic-heat-rise test was initiated in accordance with
CRD-C 38-73 (USAEWES 1949a). However, the test was terminated prematurely
27

25
20CL
S150.
10 Compression- Tension
5
00 20 40 60 80 100 120 140 160 180 200
Strain, millionths
Figure 23. Typical load-strain curves determined from ultimate straincapacity tests at 7 days
Stress Strain
1000 1000
800 00 2
I o, I-~600- 6009
8400- 400&
~200- 200~0.. ... . 0
01- 10Sllca Fume Tenn.-Tom. Red River
Figure 24. Tensile stress and strain capacities of silica-fume
concrete compared with that of conventional concrete
28
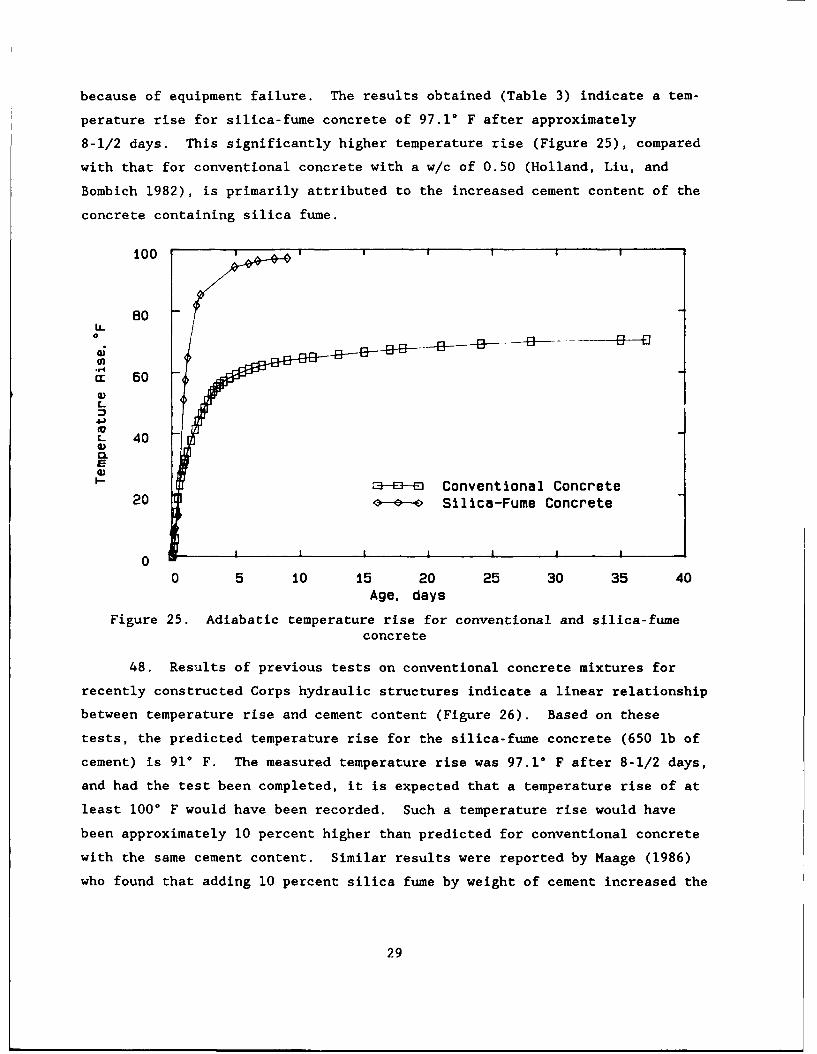
because of equipment failure. The results obtained (Table 3) indicate a tem-
perature rise for silica-fume concrete of 97.10 F after approximately
8-1/2 days. This significantly higher temperature rise (Figure 25), compared
with that for conventional concrete with a w/c of 0.50 (Holland, Liu, and
Bombich 1982), is primarily attributed to the increased cement content of the
concrete containing silica fume.
100 I I '
too
80
r 60
C. 40
E34)
cc. 6
0)
a-E-- Conventional Concrete20 -e Silica-Fume Concrete
00 5 10 15 20 25 30 35 40
Age. days
Figure 25. Adiabatic temperature rise for conventional and silica-fumeconcrete
48. Results of previous tests on conventional concrete mixtures for
recently constructed Corps hydraulic structures indicate a linear relationship
between temperature rise and cement content (Figure 26). Based on these
tests, the predicted temperature rise for the silica-fume concrete (650 lb of
cement) is 91° F. The measured temperature rise was 97.1 ° F after 8-1/2 days,
and had the test been completed, it is expected that a temperature rise of at
least 1000 F would have been recorded. Such a temperature rise would have
been approximately 10 percent higher than predicted for conventional concrete
with the same cement content. Similar results were reported by Maage (1986)
who found that adding 10 percent silica fume by weight of cement increased the
29

o 80 -80c Tenn.-Tom.
a Red70 70
L
4J( 60LC Y= 4. i+0. 12 (X)a)0.E) 50Q "
40250 300 350 400 450 500 550 600
Cement Content, lb/cu yd
Figure 26. Relationship between cement content and adiabatictemperature rise of conventional concrete mixtures
adiabatic temperature rise by about 8 percent compared to a conventional con-
crete mixture proportioned for the same compressive strength.
Coefficient of thermal expansion
49. The coefficient of thermal expansion, determined in accordance with
CRD-C 39-81 (USAEWES 1949d), was 6.7 millionths/°F. This value is similar to
those values previously determined for conventional concrete used on recently
constructed Corps projects (Figure 27). Ozyildirim (1986) also reported that
the thermal coefficients of expansion for concrete with and without silica
fume were "comparable, indicating that the addition of silica fume would not
have any significant effect on the thermal compatibility of overlays."
Abrasion Erosion
50. Abrasion-erosion testing was conducted in accordance with
CRD-C 63-80 (USAEWES 1949b). This test procedure involves subjecting the
concrete specimens to abrasion erosion caused by the wear of steel grinding
balls on the concrete surface (Figure 28). The steel grinding balls are pro-
pelled by water in the test chamber. The water is in turn propelled by a
30

Red River Silica Fume Tenn.-Tom.
8-
UL
EC =0-C0
0 4.0
Concrete Mixtures
Figure 27. The coefficient of thermal expansion of silica-fumeconcrete compared with that of conventional concrete
submerged mixer paddle. Test specimens are periodically removed from the test
apparatus to determine the amount of abraslon-erosion damage. The damage is
quantified and reported as a percentage of original mass lost. The develop-
ment of the test procedure and data from a large number of tests of various
concrete mixtures were described by Liu (1980).
51. Abrasion-erosion testing of three specimens was initiated at
28 days with results as shown in Table 4. Abrasion-erosion losses, expressed
as a percentage of original mass, ranged from 2.4 to 3.3 percent with an aver-
age loss of 2.9 percent (Figure 29). As shown in Figure 30, this average loss
was approximately 60 percent less than :hat for concrete of similar limestone
coarse aggregate which did not contain silica fume and an HRWRA (Holland
1983). This significant improvement in abrasion-erosion resistance is attrib-
uted to the increased compressive strength of the silica-fume concrete,
14,280 psi at 28 days compared to 5,710 psi for the conventional concrete.
The abrasion-erosion resistance of the silica-fume concrete is similar to that
of a conventional concrete mixture (0.40 w/c ratio) containing a very hard
chert aggregate (Figure 30). The chert aggregate concrete had a compressive
strength at 28 days of 9,020 psi (Liu 1980).
31

12"
t,*12" DIAM. 12" THICKSTEEL TANK
STEEL GRINDINGBALLS-DIAM VARIES
325

49nUn
m 3 Specimen A3 +--+ Specimen B
O Specimen C
(12 2U)0-J
L
00 10 20 30 40 50 60 70 80
Test Time, hr
Figure 29. Abrasion-erosion test results
Conventional Silica-Fume ConventionalUmeston Umetone Char
S6.
(0
.2
,44
0
Concrete Mixurs
Figure 30. Abrasion-erosion resistance of limestone aggregate
concrete with and without silica fume and HRWR's compared toconventional chert aggregate concrete
33

PART IV: CONCLUSIONS AND RECOMMENDATIONS
Conclusions
52. Concrete materials and mixture proportions similar to those used in
the 1983 repair of the Kinzua Dam stilling basin were obtained for casting
laboratory test specimens. The silica-fume content of this concrete mixture
was approximately 18 percent by weight of cement. More recent work indicates
that the optimum silica-fume content ranges from about 5 to 10 percent by
weight of cement (ACI Committee 226 1987).
53. Adding silica fume and an HRWRA to a concrete mixture will greatly
increase compressive strength, which, in turn, increases abrasion-erosion
resistance. These very high-strength concretes appear to offer an economical
solution to abrasion-erosion problems, particularly in those areas where
locally available aggregate otherwise might not be acceptable.
54. The general approach to repair of mass concrete hydraulic struc-
tures has been to remove 1 to 2 ft of old concrete and replace it with new
air-entrained concrete. One of the most persistent problems with this
approach has been cracking in the replacement concrete (McDonald 1987). These
early-age cracks are attributed to restrained contraction of the replacement
concrete, the restraint being provided through bond to the existing stable
concrete substrate. As the relatively thin layer of resurfacing concrete
attempts to contract as a result of plastic and drying shrinkage, thermal
gradients, and autogenous volume changes, tensile strains develop in the
replacement concrete. When these strains exceed the ultimate tensile strain
capacity of the replacement concrete, cracks develop. None of the material
properties of silica-fume concrete reported herein, with the possible excep-
tion of autogenous volume change, indicates that this material should be sig-
nificantly more susceptible to this type of cracking than conventional
concrete. In fact, some material properties, particularly ultimate tensile
strain capacity, would indicate that silica-fume concrete should have a
reduced potential for cracking.
55. Silica-fume concrete requires no significant changes from normal
transporting, placing, and consolidating practices. However, adding silica
fume to a concrete mixture will reduce or eliminate bleeding which will affect
34

finishing procedures. This virtual elimination of bleeding causes rapid sur-
face drying and, depending on atmospheric conditions, can cause plastic
shrinkage cracking. Precautions against plastic shrinkage cracking are needed
if the expected evaporation rate at the surface of conventional concrete
approaches 0.2 psf (ACI Committee 305 1988). According to Holland (1987),
this value is too high for silica-fume concrete in which cracking may occur if
the estimated evaporation rate approaches 0.1 psf. Holland gives 11 sugges-
tions for preventing plastic shrinkage cracking and 2 recommendations regard-
ing finishing.
56. Proper curing of silica-fume concrete is essential, as it is for
any concrete. However, improper curing is more harmful to silica-fume con-
crete than to conventional concrete (Holland 1987). To obtain the greatest
benefit from silica fume, the concrete should be cured longer than conven-
tional concrete. Starting immediately after finishing, silica-fume concrete
should be kept moist with wet burlap for a minimum of 7 days.
57. Resurfacing of the lock walls at Lock and Dam No. 20, Mississippi
River, resulted in significantly less cracking in the conventional replacement
concrete than was previously experienced at other rehabilitation projects
within the US Army Engineer District, Rock Island (Wickersham 1987). The
reduced cracking was attributed to a combination of factors including lower
cement content, larger maximum size coarse aggregate, lower *lacing and curing
temperatures, smaller volumes of placement, and close attention to curing.
Any variations in concrete materials, mixture proportions, and construction
practices that will minimize shrinkage or reduce concrete temperature differ-
entials should be considered in efforts to minimize cracking in concrete with
and without silica fume. Guidance in these areas is given in EM 1110-2-2002
(Headquarters, US Army Corps of Engineers (HQUSACE) 1986) and ETL 1110-2-314
(HQUSACE 1988).
58. A general-purpose heat transfer and structural analysis finite
element code was recently used to predict the response of concrete overlays
placed on lock-wall surfaces (Norman, Campbell, and Garner 1988; Hammons,
Garner, and Smith 1989). These analyses indicate that shrinkage is a predomi-
nant factor in overlay cracking. The analyses also demonstrate that an effec-
tive bond breaker at the interface between the replacement and existing
concrete would eliminate cracking. WES recommendations to minimize shrinkage
35

and install a bond breaker were implemented by the US Army Engineer District,
Pittsburgh, during 1989 in the rehabilitation of Dashields Locks, Ohio River.
A recent examination of the project by Hugenberg* indicated that cracking of
concrete placed during 1989 was significantly less than that of concrete
placed during the previous construction season.
Recommendations
59. Silica fume offers potential for improving many properties of con-
crete. However, the very high compressive strength and resulting increase in
abrasion-erosion resistance are particularly beneficial in repair of hydraulic
structures. These concretes should be considered in repair of abrasion-
erosion susceptible locations, particularly in those areas where locally
available aggregate might not otherwise be acceptable.
60. The potential for cracking of restrained concrete overlays, with or
without silica fume, should be recognized. Any variations in concrete mate-
rials, mixture proportions, and construction practices that will minimize
shrinkage or reduce concrete temperature differentials should be considered.
Where structural considerations permit, a bond breaker at the interface
between the replacement and existing concrete is recommended.
* Memorandum for Record, "Dashields Lock Rehabilitation, Site Visit,"
T. L. Hugenberg (1989), US Army Engineer Division, Ohio River, Cincinnati,OH.
36

REFERENCES
American Concrete Institute Committee 22* 1987 (Mar-Apr). "Silica Fume inConcrete," ACI Materials Journal, Vol 84, No. 2, American Concrete Institute,Detroit, MI.
American Concrete Institute Committee 305. 1988. "Hot Weather Concreting,"
ACI 305R-77 (Revised 1982), ACI Manual of Concrete Practice, Part 2, American
Concrete Institute, Detroit, MI.
American Concrete Institute Committee 318. 1988. "Building Code Requirementsfor Reinforced Concrete," ACI 318-83, ACI Manual of Concrete Practice. Part 3,
American Concrete Institute, Detroit, MI.
American Society for Testing and Materials. 1987. 1987 Annual Book of ASTM
Standards. Philadelphia, PA.
a. Designation C 192-81. "Standard Method of Making and Curing Con-
crete Test Specimens in the Laboratory."
b. Designation C 78-84. "Standard Test Method for Flexural Strength of
Concrete (Using Simple Beam with Third-Point Loading)."
c. Designation C 403-85. "Standard Test Method for Time of Setting of
Concrete Mixtures by Penetration Resistance."
d. Designation C 39-86. "Standard Test Method for Compressive Strength
of Cylindrical Concrete Specimens."
e. Designation C 150-86. "Standard Specification for Portland Cement."
f. Designation C 496-86. "Standard Test Method for Splitting TensileStrength of Cylindrical Concrete Specimens."
g. Designation C 512-87. "Standard Test Method for Creep of Concrete
in Compression."
h. Designation C 878-87. "Standard Test Method for Restrained Expan-
sion of Shrinkage-Compensating Concrete."
Bombich, A. A., Sullivan, B. R., and McDonald, J. E. 1977 (Aug). "Concrete
Temperature Control Studies, Tennessee-Tombigbee Waterway Projects," Miscella-
neous Paper C-77-8, US Army Engineer Waterways Experiment Station, Vicksburg,
MS.
Hammons, M. I., Garner, S. B., and Smith, D. M. 1989 (Jun). "Thermal Stress
Analysis of Lock Wall, Dashields Locks, Ohio River," Technical Report SL-89-6,US Army Engineer Waterways Experiment Station, Vicksburg, MS.
Headquarters, US Army Corps of Engineers. 1986 (Jul). "Evaluation and Repairof Concrete Structures," Engineer Manual 1110-2-2002, Washington, DC.
_ 1988 (Aug). "Lock Wall Rehabilitation," Engineer Technical Let
ter 1110-2-314, Washington, DC.
Holland, T. C. 1983 (Sep). "Abrasion-Erosion Evaluation of Concrete Mix-tures, Kinzua Dam, Pennsylvania," Miscellaneous Paper SL-83-16, US Army Engi-neer Waterways Experiment Station, Vicksburg, MS.
37

Holland, T. C. 1986a (Sep). "Abrasion-Erosion Evaluation of Concrete Mix-tures for Repair of Low-Flow Channel, Los Angeles River," Miscellaneous PaperSL-86-12, US Army Engineer Waterways Experiment Station, Vicksburg, MS.
1986b (Sep). "Abrasion-Erosion Evaluation of Concrete Mixturesfor Stilling Basin Repairs, Kinzua Dam, Pennsylvania," Miscellaneous PaperSL-86-14, US Army Engineer Waterways Experiment Station, Vicksburg, MS.
1987 (Mar). "Working With Silica-Fume Concrete," Concrete Con-
struction. Vol 32, No. 3, Addison, IL.
Holland, T. C., and Gutschow, R. A. 1987 (Mar). "Erosion Resistance withSilica-Fume Concrete," Concrete International, Vol 9, No. 3, American ConcreteInstitute, Detroit, MI.
Holland, T. C., Krysa, A., Luther, M. D., and Liu, T. C. 1986. "Use ofSilica-Fume Concrete to Repair Erosion Damage in the Kinzua Dam StillingBasin," Fly Ash, Silica Fume, Slag, and Natural Pozzolans in Concrete. SP-91,Vol 2, American Concrete Institute, Detroit, MI.
Holland, T. C., Liu, T. C., and Bombich, A. A. 1982 (Jun). "Determination ofProperties of Concrete Used in Thermal Studies for Lock and Dam No. 2, RedRiver Waterway," Miscellaneous Paper SL-82-5, US Army Engineer WaterwaysExperiment Station, Vicksburg, MS.
Houde, J., Prezeau, A., and Roux, R. 1987. "Creep of Concrete ContainingFibers and Silica Fume," Fiber Reinforced Concrete Properties and Applica-tions SP-105, American Concrete Institute, Detroit, MI.
Liu, T. C. 1980 (Jul). "Maintenance and Preservation of Concrete Structures;Abrasion-Erosion Resistance of Concrete," Technical Report C-78-4, Report 3,US Army Engineer Waterways Experiment Station, Vicksburg, MS.
Maage, M. 1986. "Strength and Heat Development in Concrete: Influence of FlyAsh and Condensed Silica Fume," Fly Ash. Silica Fume. Slag. and Natural Pozzo-lans in Concrete. SP-91, Vol 2, American Concrete Institute, Detroit, MI.
McDonald, J. E. 1987 (Dec). "Rehabilitation of Navigation Lock Walls: CaseHistories," Technical Report REMR-CS-13, US Army Engineer Waterways ExperimentStation, Vicksburg, MS.
Norman, C. D., Campbell, R. L., and Garner, S. 1988 (Aug). "Analysis of Con-crete Cracking in Lock Wall Resurfacing," Technical Report REMR-CS-15, US ArmyEngineer Waterways Experiment Station, Vicksburg, MS.
Ozyildirim, C. 1986. "Investigation of Concretes Containing Condensed SilicaFume," Report No. VHTRC 86-R25, Virginia Highway and Transportation ResearchCouncil, Charlottesville, VA.
Paillere, A. M., Buil, M., and Serrano, J. J. 1989 (Mar-Apr). "Effect ofFiber Addition on the Autogenous Shrinkage of Silica Fume Concrete," ACI Materials Journal. Vol 86, No. 2, American Concrete Institute, Detroit, MI.
Saucier, K. L. 1984 (Mar). "High Strength Concrete for Peacekeeper Facili-ties," Miscellaneous Paper SL-84-3, US Army Engineer Waterways ExperimentStation, Vicksburg, MS.
Tazawa, E., and Yonekura, A. 1986. "Drying Shrinkage and Creep of Concretewith Condensed Silica Fume," Fly Ash. Silica Fume. Slag. and Natural Pozzolans
in Concrete. SP-91, Vol 2, American Concrete Institute, Detroit, MI.
38

Troxell, G. E., Raphael, J. M., and Davis, R. E. 1958 (Jun). "Long-TimeCreep and Shrinkage Tests of Plain and Reinforced Concrete," Proceedings,Sixty-first Annual Meeting of ASTM.
US Army Engineer Waterways Experiment Station. 1949 (with quarterly supple-ments). Handbook for Concrete and Cement. Vicksburg, MS.
a. CRD-C 38-73. "Method of Test for Temperature Rise in Concrete."
b. CRD-C 63-80. "Test Method for Abrasion-Erosion Resistance of Con-crete (Underwater Method)."
c. CRD-C 71-80. "Standard Test Method for Ultimate Strain Capacity ofConcrete."
d. CRD-C 39-81. "Test Method for Coefficient of Linear Thermal Expan-sion of Concrete."
Wickersham, J. 1987 (Dec). "Concrete Rehabilitation at Lock and Dam No. 20,Mississippi River," The REMR Bulletin, Vol 4, No.4, US Army Engineer WaterwaysExperiment Station, Vicksburg, MS.
39
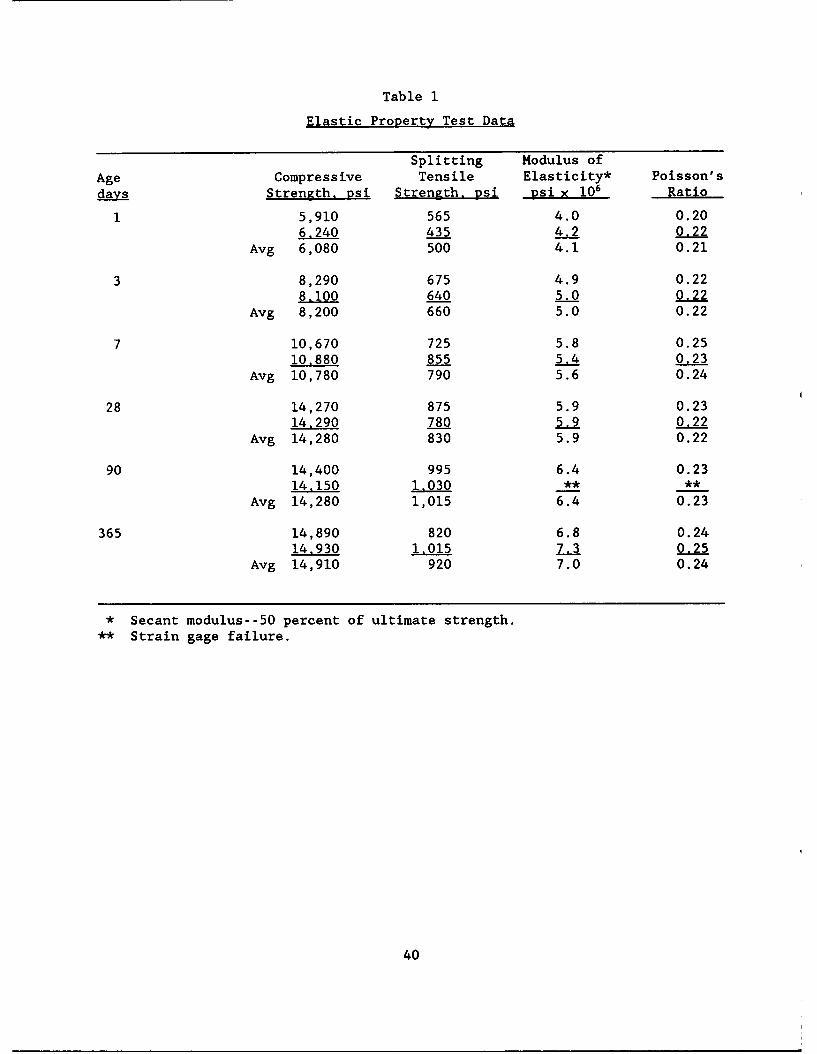
Table 1
Elastic Property Test Data
Splitting Modulus of
Age Compressive Tensile Elasticity* Poisson'sStrength, psi Strength, psi psi X 106 Ratio
S5,910 565 4.0 0.206,240 435 4.2 0.22
Avg 6,080 500 4.1 0.21
3 8,290 675 4.9 0.228.100 640 5.0 0.22
Avg 8,200 660 5.0 0.22
7 10,670 725 5.8 0.2510,880 855 5.4
Avg 10,780 790 5.6 0.24
28 14,270 875 5.9 0.2314,290 780 5,9 0.22
Avg 14,280 830 5.9 0.22
90 14,400 995 6.4 0.2314,150 103** **
Avg 14,280 1,015 6.4 0.23
365 14,890 820 6.8 0.24
14,930 1,015 7.3 0.25Avg 14,910 920 7.0 0.24
* Secant modulus--50 percent of ultimate strength.
** Strain gage failure.
40

Table 2
Ultimate Strain Capacity Test Data
Beam Test Age Total Load Modulus of Tensile Strain
No. days lb Rupture. psi Capacity,* millionths
1 1 17,300 600 1206 14,800 515 128
Avg 560 124
2 3 22,250 775 132
5 20,800 720 141Avg 750 136
3 7 29,000 1,010 1554 29,275 1.015 160
Avg 1,010 158
7 28 33,450 1,160 182
11 31,000 1.075 162Avg 1,120 172
8 90 35,250 1,225 **
9 34,400 1.195 223Avg 1,210
10 365 32,000 1,110 16812 36,000 1.250 200
Avg 1,180 184
* Tensile strain at 90 percent of ultimate load.
** Strain meter failure.
41

Table 3
Adiabatic Temperature Rise Test Data
Time, hr Temperature. °F
0 0
1.75 7.30
2.92 8.07
4.25 8.66
5.92 9.32
11.25 13.48
21.75 51.07
25.42 57.54
29.92 64.90
46.00 81.81
53.75 85.29
117.75 94.40
143.25 95.44
160.92 96.26
192.00 96.92
215.42 97.08
42

Table 4
Abrasion-Erosion Test Data
Specimen
Elapsed A B C Average
Test Time Weight Percent Weight Percent Weight Percent Percent
hr lb Loss lb Loss lb Loss Loss
0 37.58 0.0 39.80 0.0 38.25 0.0 0.0
12 37.32 0.7 39.40 1.0 38.00 0.7 0.8
24 37.20 1.0 39.18 1.6 37.92 0.9 1.2
36 36.90 1.8 39.05 1.9 37.80 1.2 1.6
48 37.70 2.3 38.85 2.4 37.65 1.6 2.1
60 36.45 3.0 38.70 3.0 37.52 1.9 2.6
72 36.35 3.3 38.55 3.1 37.35 2.4 2.9
43