Embed Size (px)
Citation preview
49th AIAA Aerospace Sciences Meeting Including the New Horizons Forum and Aerospace Exposition, 4-7 Jan 2011, Orlando, Florida
PIV Study on Steady and Periodic-Pulsed
Dielectric-Barrier-Discharges
Chong Ma ∗, Huaxing Li†
Northwestern Polytechnical University, Xi’an 710072, China
Feng Liu‡, and Shijun Luo§
University of California, Irvine, CA 92697-3975
The flows induced by different modes of plasma discharge over a 20◦ conical forefody are
studied with a two-dimensional particle image velocimetry in a still air chamber with oneatmosphere pressure. The effects of pulse duty ratio on the induced maximum crossflowvelocity and maximum axial vorticity are compared with those of steady discharge. Effectsof pulse frequency and ac voltage are discussed.
Nomenclature
F = frequency of a.c. voltage source
fp = frequency of pulsed actuation
q = velocity component in crossflow plane
r, θ = polar coordinates at body center, θ measured from windward generator clockwise
rc = body radius
Vp−p = peak-to-peak voltage of a.c. voltage source
v, w = horizontal, vertical component of q
τp = duty ratio of pulse over a pulse period
ψ = phase angle over a pulse period
ωx = axial vorticity component in x direction
I. Introduction
Proportional lateral control on slender forebodies at high angles of attack is highly needed in aerody-namic design of air vehicles. The fact that the separation vortices over pointed forebodies generate largeairloads and are very sensitive to small perturbations near the body apex offers an exceptional opportunityfor manipulating them with little energy input to achieve active lateral control of the vehicle in place ofconventional control surfaces. It has been found experimentally that unsteady dynamic control techniquesare needed to achieve this goal.1–3
Recently, Liu et al.4 reported wind-tunnel experiments that demonstrate nearly linear proportionalcontrol of lateral forces and moments over a slender conical forebody at high angles of attack by employinga novel design of a pair of single dielectric barrier discharge (SDBD) plasma actuators near the cone apexcombined with a duty cycle technique. In the duty-cycled plasma actuation, both starboard and port plasmaactuators discharge in the mode of periodic pulse. The periodic-pulsed discharges are the key factors in theaction of the duty-cycled actuation. The information on the performance of periodic-pulsed discharge may
∗Graduate Student, Department of Fluid Mechanics†Professor, College of Aeronautical Engineering.‡Professor, Department of Mechanical and Aerospace Engineering. Associate Fellow AIAA.§Researcher, Department of Mechanical and Aerospace Engineering.
1 of 16
American Institute of Aeronautics and Astronautics
49th AIAA Aerospace Sciences Meeting including the New Horizons Forum and Aerospace Exposition4 - 7 January 2011, Orlando, Florida
AIAA 2011-1303
Copyright © 2011 by the American Institute of Aeronautics and Astronautics, Inc. All rights reserved.
provide insight into the mechanism of the duty-cycled SDBD plasma actuation. These considerations motivedthe current study.
The action of asymmetric surface dielectric barrier discharge in air at atmospheric pressure has beentested along different kinds of surface profiles, e.g., flat plates,5–7 circular cylinder,8 NACA airfoils.9, 10 Inthis paper, the crossflow fields produced by a periodic-pulsed SDBD along a ray of 20◦ circular cone in airat atmospheric pressure are studied in detail using the PIV visualizations. The test model is mainly thesame as that is used in Ref. 4. In the following sections, the experimental setup is described. The ensemble-and phase-locked-averaged results for various modes of plasma actuations are investigated. Effects of pulsefrequency and ac voltage are discussed. Finally conclusions are drawn.
II. Experimental Setup
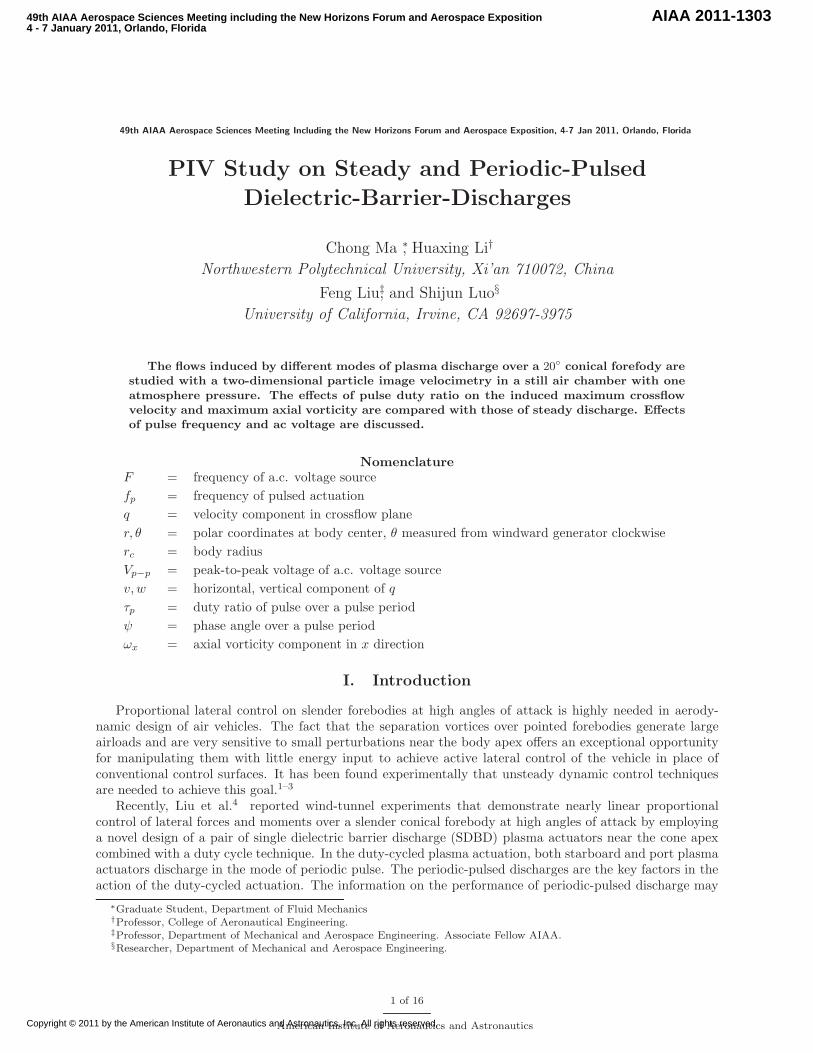
Figure 1. The model
The model is shown in Fig. 1 and mainly the same as used in Ref. 4. The circular-cone forebody consiststwo separate pieces. The frontal portion of the cone is made of plastic and has a length of 150 mm. The restof the model is made of metal. The total length of the cone is 463.8 mm with a base diameter of 163.6 mm.
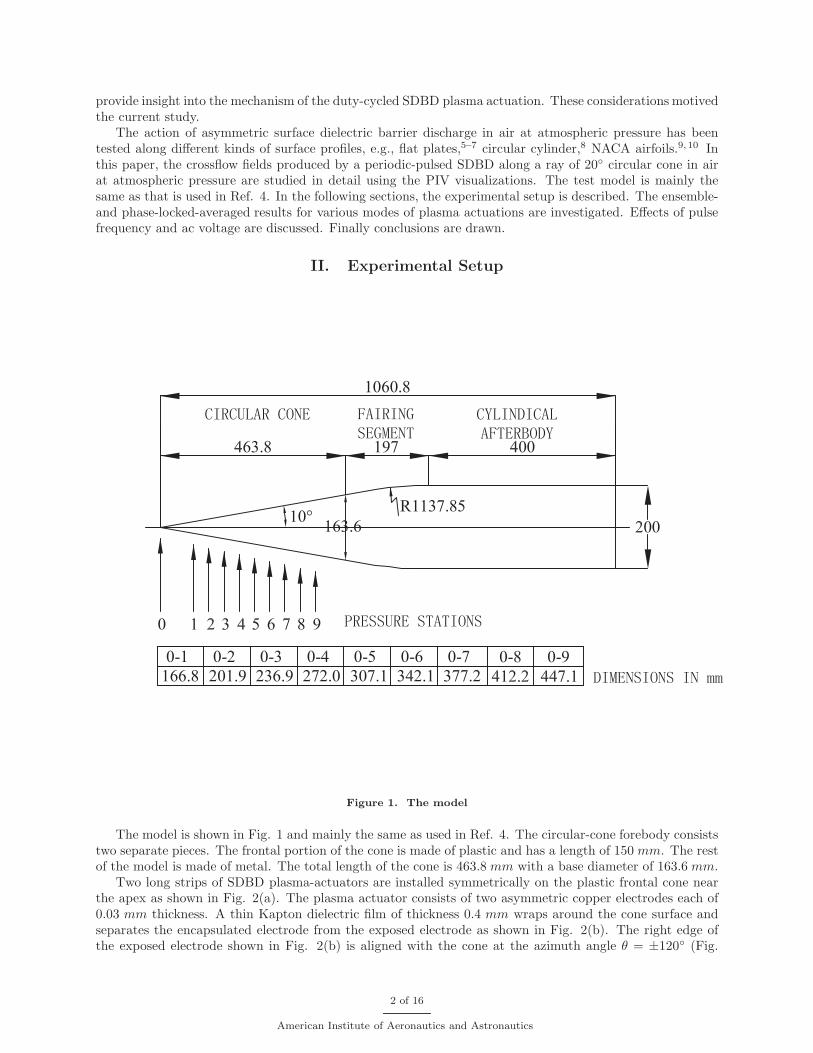
Two long strips of SDBD plasma-actuators are installed symmetrically on the plastic frontal cone nearthe apex as shown in Fig. 2(a). The plasma actuator consists of two asymmetric copper electrodes each of0.03 mm thickness. A thin Kapton dielectric film of thickness 0.4 mm wraps around the cone surface andseparates the encapsulated electrode from the exposed electrode as shown in Fig. 2(b). The right edge ofthe exposed electrode shown in Fig. 2(b) is aligned with the cone at the azimuth angle θ = ±120◦ (Fig.
2 of 16
American Institute of Aeronautics and Astronautics
2(a)). The length of the electrodes is 20 mm along the cone meridian with the leading edge located at 9 mmfrom the cone apex. The width of the exposed and encapsulated electrode is 1 mm and 2 mm, respectively.The two electrodes are separated by a gap of 1.5 mm, where the plasma is created and emits a blue glow indarkness.
(a) arrangement (b) SDBD
Figure 2. Sketches of the plasma actuators.
Four modes of operations of the starboard actuators are defined. The first model is steady discharge ofthe starboard actuator. The rest modes are periodic-pulse discharge of the starboard actuator with pulseduty ratio τp = 0.1, 0.5 and 0.9. The pulse durations for τp = 0.1, 0.5 and 0.9 are 10, 50 and 90 milliseconds,respectively, at pulse frequency fp = 10 Hz. Each of the two actuators on the cone model is separatelydriven by an a.c. voltage source (model CTP-2000K by Nanjing Suman Co.). The waveform of the a.c.source is sine wave. The peak-to-peak voltage and frequency are set at Vp−p ≈ 14.5 kV and F ≈ 11.8 kHz,respectively. The periodic pulses are achieved by modulating the carrier a.c. voltage sources by a digitalpulse wave generator, PC-07 made by Nanjing Suman Co.
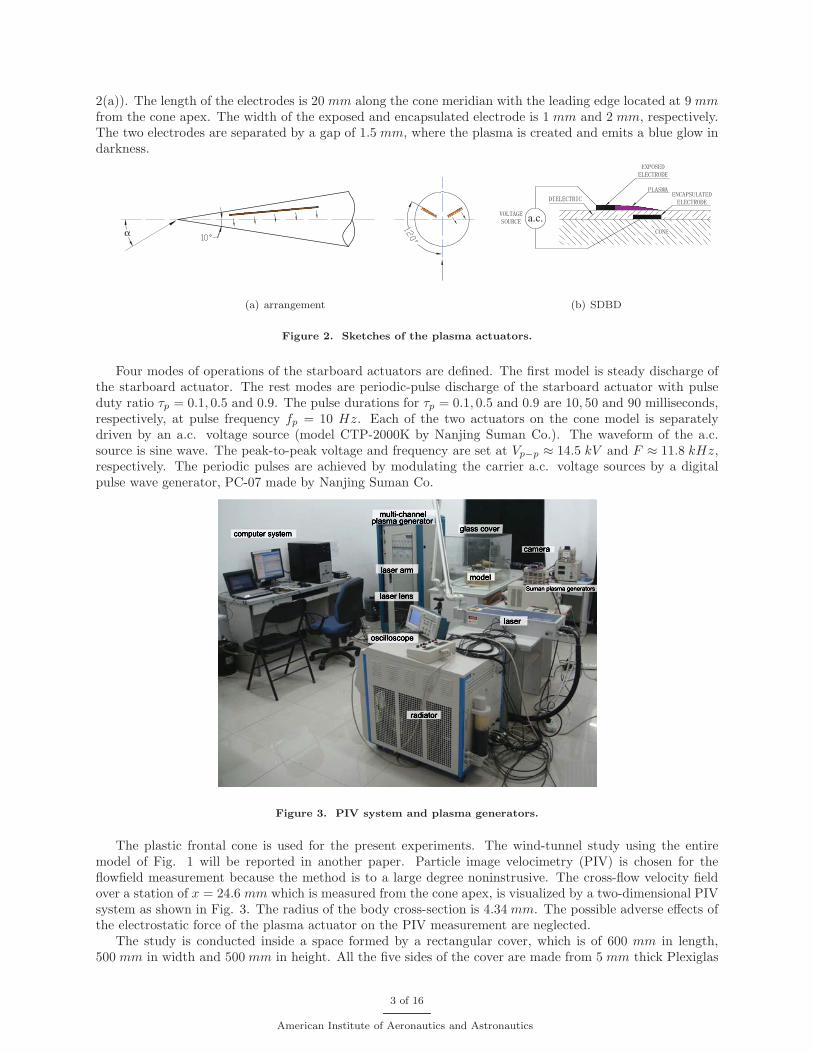
Figure 3. PIV system and plasma generators.
The plastic frontal cone is used for the present experiments. The wind-tunnel study using the entiremodel of Fig. 1 will be reported in another paper. Particle image velocimetry (PIV) is chosen for theflowfield measurement because the method is to a large degree noninstrusive. The cross-flow velocity fieldover a station of x = 24.6 mm which is measured from the cone apex, is visualized by a two-dimensional PIVsystem as shown in Fig. 3. The radius of the body cross-section is 4.34 mm. The possible adverse effects ofthe electrostatic force of the plasma actuator on the PIV measurement are neglected.
The study is conducted inside a space formed by a rectangular cover, which is of 600 mm in length,500 mm in width and 500 mm in height. All the five sides of the cover are made from 5 mm thick Plexiglas
3 of 16
American Institute of Aeronautics and Astronautics
to allow for optical viewing and access for the laser sheet. The cover is shown between the Suman plasmavoltage sources on the right and a multi-channel plasma generator on the left in the photograph in Figure3. The plastic frontal cone is set inside the cover. The air under the cover at one atmosphere pressure isshielded from air flow within the laboratory room. The seeds are smoke particles of approximately 1 μmin diameter commonly used in cinema industry. The seeds would stay suspended for many hours and wereonly replenished when needed.
The PIV system manufactured by the Dantec Dynamic Company, is located in the front in the photographof Figure 3. The Nd:YAG Laser, a product of the Beamtech Optronics Co., emits single pulse of energy≤ 200 mJ and produces double pulses with a time interval of 60 μs. The laser sheet has thickness 1 mm.The repeat rate of the laser double-pulse is limited to 15 Hz. For fp = 10 Hz, the repeat rate of the laserdouble-pulse is set at 9 Hz and consecutive 15 seconds of sampling are performed for each case. To calculate aphase-locked average, every 9 PIV samples are used. For fp = 10 Hz the order of the PIV sampling coincideswith the order of phase angle.In the present experiments, the plasma generator and the PIV velocimetry areoperated independently, and, thus, the exact phase angle corresponding to the pulse initiation is unknown. Inthis paper, the first phase angle is chosen at the point where the phase-locked-averaged maximum crossflowvelocity in the entire neighborhood of the cone is the largest among all the phase angles. A CCD camera of1600×1200 pixels is used to record the cross-flow image of 36.1 mm×32.0 mm. A software of DynamicStudio2.30.47 version is used to calculate the cross-flow velocity vector field from the double-pulse images. Thecamera is located in front of the laser plane as shown in Fig. 3.
Table 1 gives the input power versus periodic-pulse duty ratio of the starboard plasma actuator generatedby an ac voltage source: Vp−p = 14.5 kV and F = 11.8 kHz, where τp = 1 denotes steady plasma actuation.The pulse frequency fp = 10 Hz. The input power is approximately proportional to the duty ratio.
Table 1. Input power versus periodic-pulse duty ratio, Vp−p = 14.5 kV, F = 11.8 kHz, fp = 10 Hz.
Duty ratio 0.1 0.5 0.9 1
Voltage (V ) 20 20 20 20
Current (A) 0.1 0.5 0.85 0.91
Input power (W ) 2.0 10.0 17.0 18.2
III. Ensemble-Averaged Results
To study the convergence of ensemble-averaged crossflow velocity versus sampling time, the mode ofsteady plasma actuation (τ = 1) is considered. On the crossflow plane, a fixed point of r/rc = 1.81 andθ = 23.9◦, is chosen, where the ensemble-averaged maximum crossflow velocity obtained from the PIVsampling time of 15 s in the entire neighborhood of the cone surface is located. At this point, the ensemble-averaged crossflow velocities over sampling time of 1 s, 5 s and 10 s are listed in Table 2. The sampling timeof 15 s almost yields convergent result.
Table 2. Convergence of ensemble-averaged crossflow velocity versus sampling time for steady
plasma actuation.
PIV sampling time (s) 1 5 10 15
Crossflow velocity (m/s) 1.65 2.09 1.79 1.70
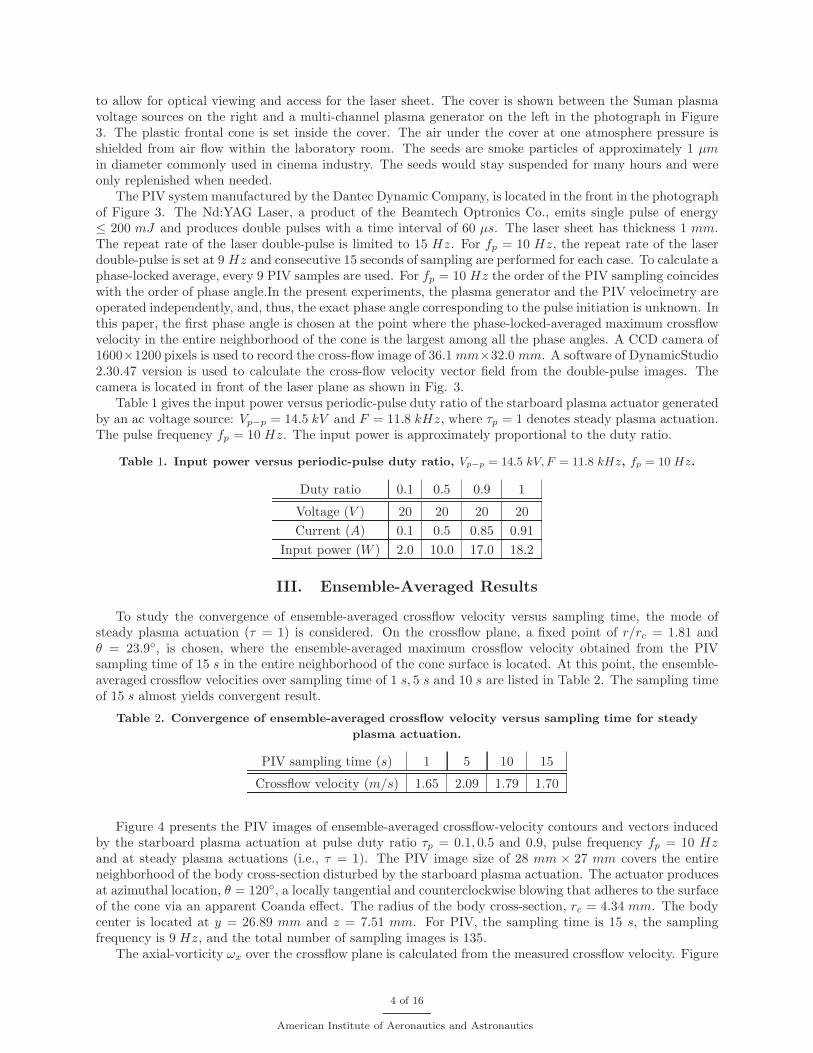
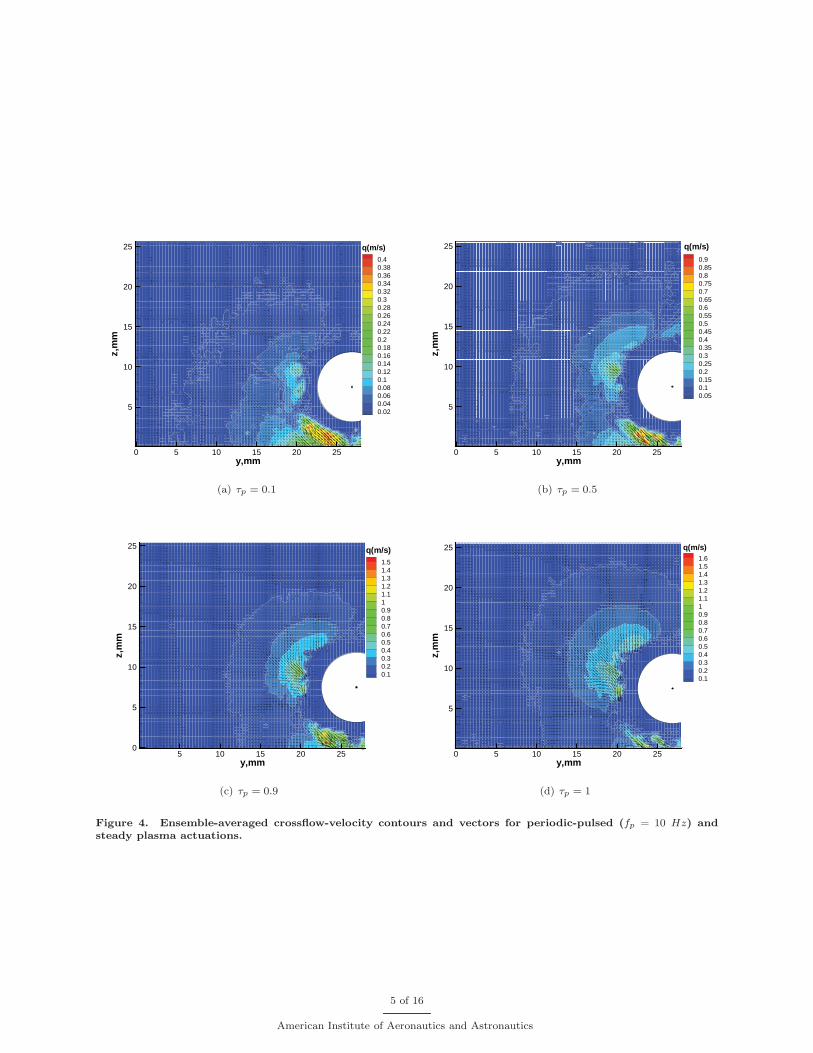
Figure 4 presents the PIV images of ensemble-averaged crossflow-velocity contours and vectors inducedby the starboard plasma actuation at pulse duty ratio τp = 0.1, 0.5 and 0.9, pulse frequency fp = 10 Hzand at steady plasma actuations (i.e., τ = 1). The PIV image size of 28 mm × 27 mm covers the entireneighborhood of the body cross-section disturbed by the starboard plasma actuation. The actuator producesat azimuthal location, θ = 120◦, a locally tangential and counterclockwise blowing that adheres to the surfaceof the cone via an apparent Coanda effect. The radius of the body cross-section, rc = 4.34 mm. The bodycenter is located at y = 26.89 mm and z = 7.51 mm. For PIV, the sampling time is 15 s, the samplingfrequency is 9 Hz, and the total number of sampling images is 135.
The axial-vorticity ωx over the crossflow plane is calculated from the measured crossflow velocity. Figure
4 of 16
American Institute of Aeronautics and Astronautics
y,mm
z,m
m
0 5 10 15 20 25
5
10
15
20
250.40.380.360.340.320.30.280.260.240.220.20.180.160.140.120.10.080.060.040.02
q(m/s)
(a) τp = 0.1
y,mm
z,m
m
0 5 10 15 20 25
5
10
15
20
250.90.850.80.750.70.650.60.550.50.450.40.350.30.250.20.150.10.05
q(m/s)
(b) τp = 0.5
y,mm
z,m
m
5 10 15 20 250
5
10
15
20
25
1.51.41.31.21.110.90.80.70.60.50.40.30.20.1
q(m/s)
(c) τp = 0.9
y,mm
z,m
m
0 5 10 15 20 25
5
10
15
20
251.61.51.41.31.21.110.90.80.70.60.50.40.30.20.1
q(m/s)
(d) τp = 1
Figure 4. Ensemble-averaged crossflow-velocity contours and vectors for periodic-pulsed (fp = 10 Hz) andsteady plasma actuations.
5 of 16
American Institute of Aeronautics and Astronautics
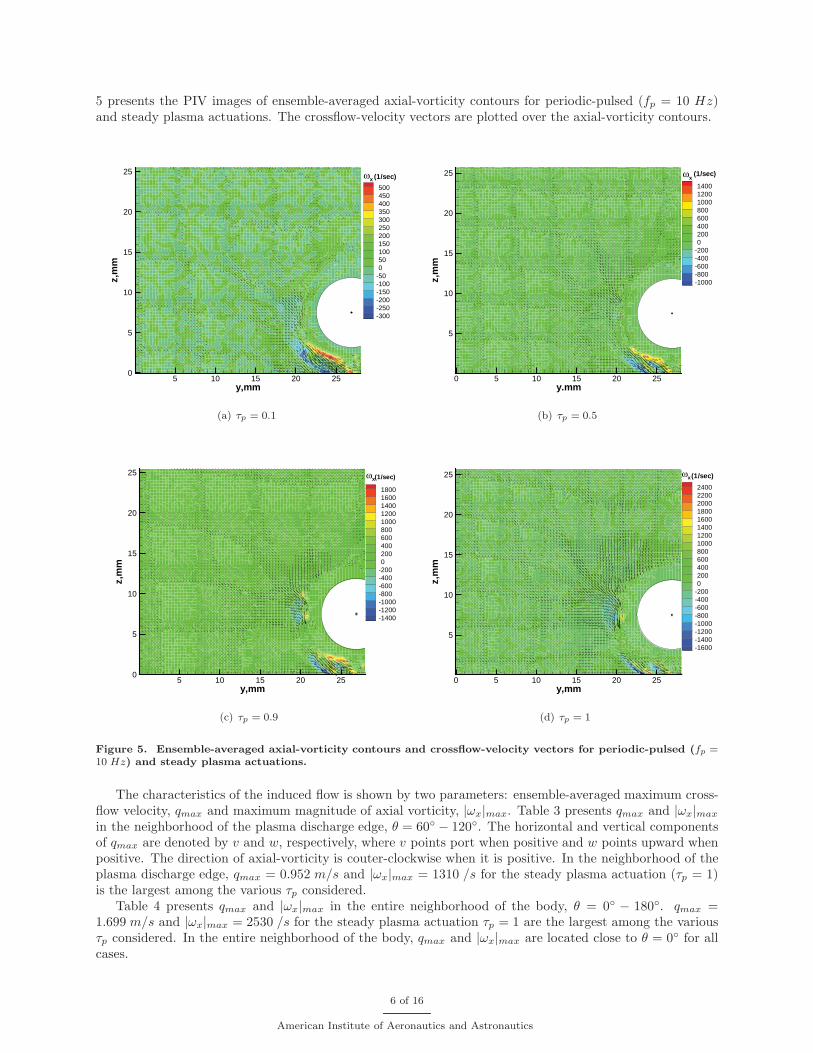
5 presents the PIV images of ensemble-averaged axial-vorticity contours for periodic-pulsed (fp = 10 Hz)and steady plasma actuations. The crossflow-velocity vectors are plotted over the axial-vorticity contours.
y,mm
z,m
m
5 10 15 20 250
5
10
15
20
25
500450400350300250200150100500
-50-100-150-200-250-300
ωx (1/sec)
(a) τp = 0.1
y.mm
z,m
m
0 5 10 15 20 25
5
10
15
20
251400120010008006004002000
-200-400-600-800-1000
ωx (1/sec)
(b) τp = 0.5
y,mm
z,m
m
5 10 15 20 250
5
10
15
20
25
180016001400120010008006004002000
-200-400-600-800-1000-1200-1400
ωx(1/sec)
(c) τp = 0.9
y,mm
z,m
m
0 5 10 15 20 25
5
10
15
20
25240022002000180016001400120010008006004002000
-200-400-600-800-1000-1200-1400-1600
ωx(1/sec)
(d) τp = 1
Figure 5. Ensemble-averaged axial-vorticity contours and crossflow-velocity vectors for periodic-pulsed (fp =10 Hz) and steady plasma actuations.
The characteristics of the induced flow is shown by two parameters: ensemble-averaged maximum cross-flow velocity, qmax and maximum magnitude of axial vorticity, |ωx|max. Table 3 presents qmax and |ωx|max
in the neighborhood of the plasma discharge edge, θ = 60◦ − 120◦. The horizontal and vertical componentsof qmax are denoted by v and w, respectively, where v points port when positive and w points upward whenpositive. The direction of axial-vorticity is couter-clockwise when it is positive. In the neighborhood of theplasma discharge edge, qmax = 0.952 m/s and |ωx|max = 1310 /s for the steady plasma actuation (τp = 1)is the largest among the various τp considered.
Table 4 presents qmax and |ωx|max in the entire neighborhood of the body, θ = 0◦ − 180◦. qmax =1.699 m/s and |ωx|max = 2530 /s for the steady plasma actuation τp = 1 are the largest among the variousτp considered. In the entire neighborhood of the body, qmax and |ωx|max are located close to θ = 0◦ for allcases.
6 of 16
American Institute of Aeronautics and Astronautics
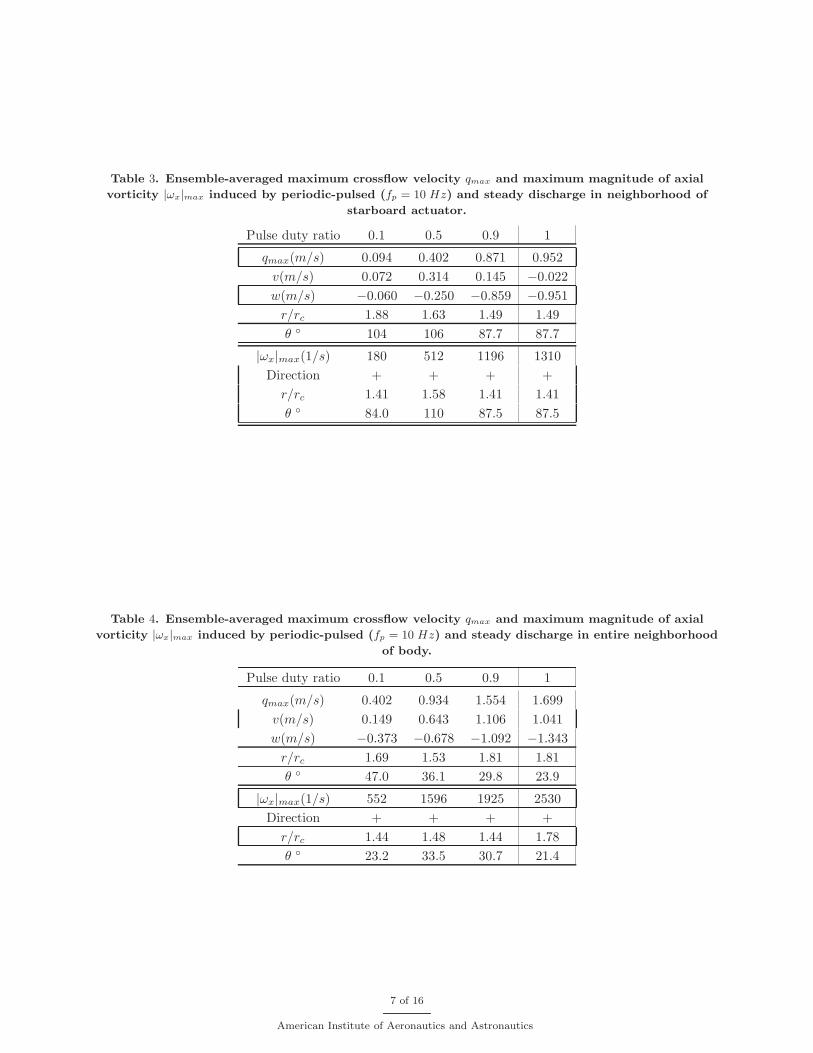
Table 3. Ensemble-averaged maximum crossflow velocity qmax and maximum magnitude of axial
vorticity |ωx|max induced by periodic-pulsed (fp = 10 Hz) and steady discharge in neighborhood of
starboard actuator.
Pulse duty ratio 0.1 0.5 0.9 1
qmax(m/s) 0.094 0.402 0.871 0.952
v(m/s) 0.072 0.314 0.145 −0.022
w(m/s) −0.060 −0.250 −0.859 −0.951
r/rc 1.88 1.63 1.49 1.49
θ ◦ 104 106 87.7 87.7
|ωx|max(1/s) 180 512 1196 1310
Direction + + + +
r/rc 1.41 1.58 1.41 1.41
θ ◦ 84.0 110 87.5 87.5
Table 4. Ensemble-averaged maximum crossflow velocity qmax and maximum magnitude of axial
vorticity |ωx|max induced by periodic-pulsed (fp = 10 Hz) and steady discharge in entire neighborhood
of body.
Pulse duty ratio 0.1 0.5 0.9 1
qmax(m/s) 0.402 0.934 1.554 1.699
v(m/s) 0.149 0.643 1.106 1.041
w(m/s) −0.373 −0.678 −1.092 −1.343
r/rc 1.69 1.53 1.81 1.81
θ ◦ 47.0 36.1 29.8 23.9
|ωx|max(1/s) 552 1596 1925 2530
Direction + + + +
r/rc 1.44 1.48 1.44 1.78
θ ◦ 23.2 33.5 30.7 21.4
7 of 16
American Institute of Aeronautics and Astronautics
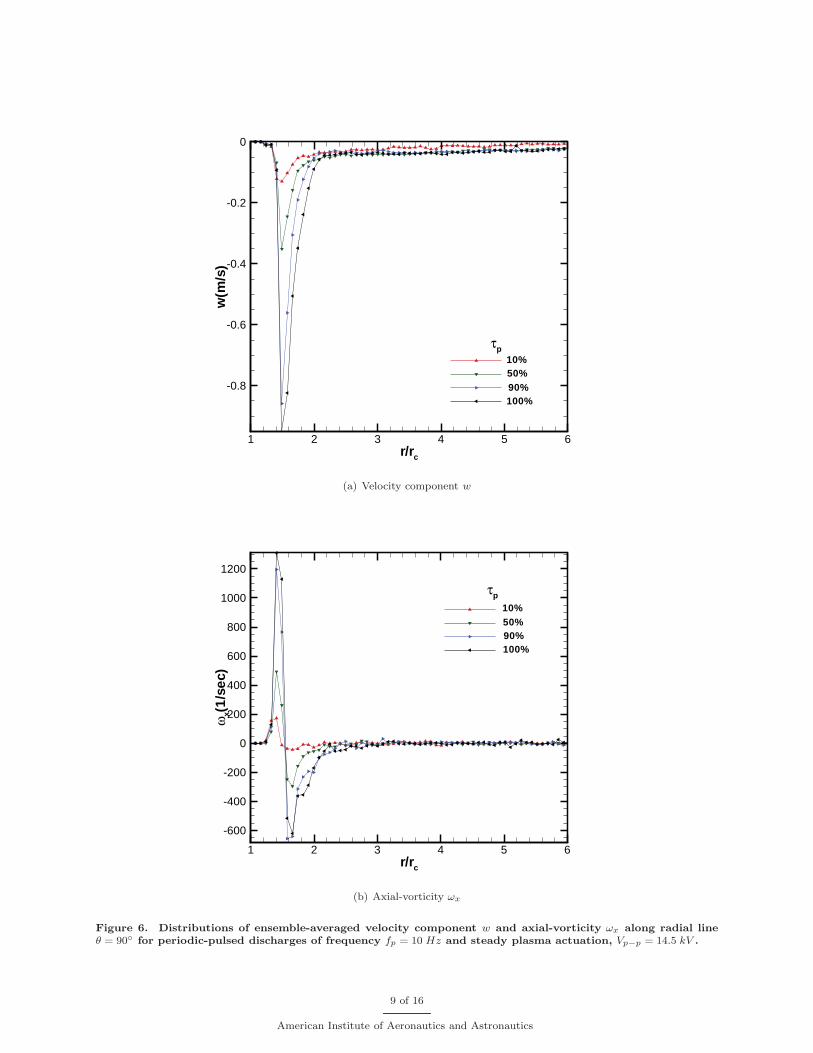
The distributions of the ensemble-averaged velocity component w and axial-vorticity ωx along a radialray originated from the body center at the azimuthal angle of θ = 90◦ are presented in Fig. 6 for theperiodic-pulsed frequency fp = 10 Hz, and compared with the results of the steady plasma actuation atVp−p = 14.5 kV . From Fig. 6(a), w < 0. Thus, the direction of the resulting flow agrees with that of theplasma discharges. The maximum magnitude of velocity componnent w and axial vorticity ωx induced bythe steady plasma actuation are the largest among the four mades considered, and the half-height width ofthw w−profile induced by the steady plasma actuation is also the largest among the four modes considered.
It ia found that the peak values of w and ωx induced by the steady plasma actuation is sharply decreasedwhen the ac voltage Vp−p is decreased slightly. Table 5 compares the peak values of w and ωx induced by thesteady plasma actuation under Vp−p = 14.0 kV and 14.5 kV . The ac voltage of Vp−p = 14.0 kV appears as athreshold above which the peak values of the steady actuation are increased about one order of magnitude.
Table 5. Peak values of w and ωx induced by steady plasma actuation under Vp−p = 14.0 kV and
14.5 kV
Voltage (kV ) 14.0 14.5
Peak values of w( m/s) (0,−0.05) (0,−0.95)
Peak values of ω( 1/s) (−280, 60) (−620, 1320)
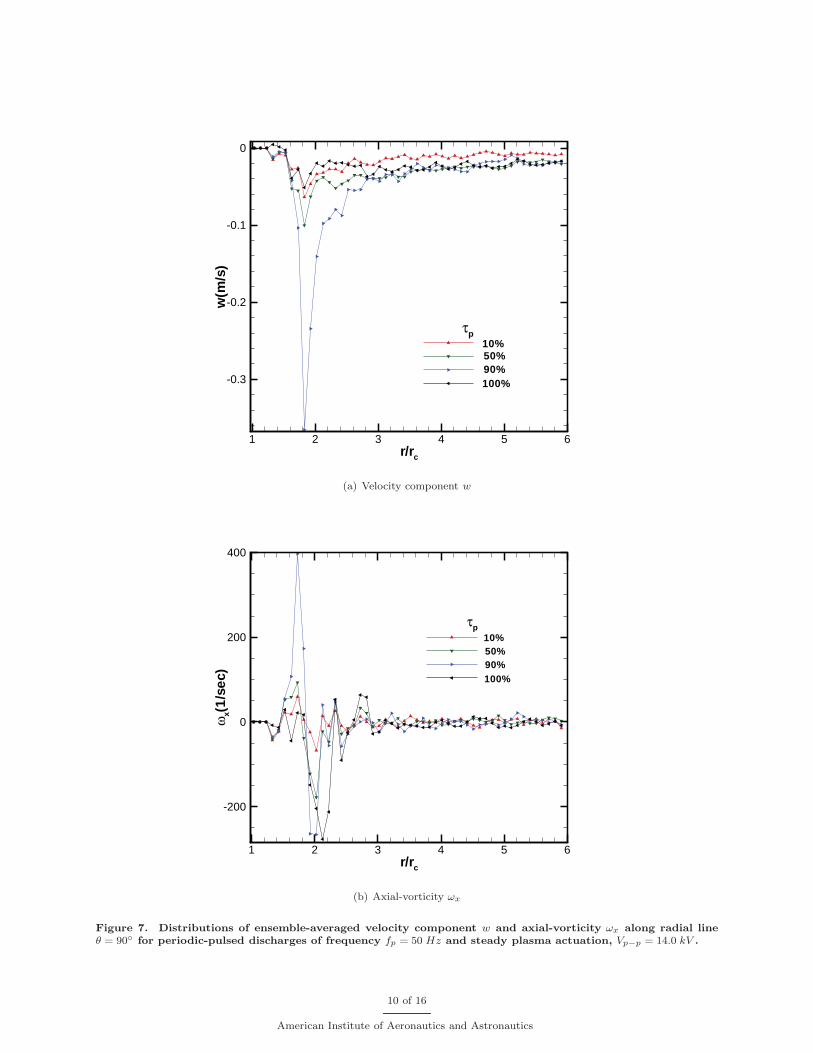
Under Vp−p = 14.0 kV and fp = 50 Hz, the distributions of the ensemble-averaged velocity componentw and axial-vorticity ωx along a radial ray originated from the body center at the azimuthal angle of θ = 90◦
are presented in Fig. 7. In this case, the positive and negative maximum values of w and ωx induced bythe periodic pulsed actuations are, mostly, larger than those of the steady plasma actuation, the half-heightwidth of w−profile induced by pulsed actuation is larger, and stronger discrete vortices are formed in theperiodic-pulse cases. This observation agrees with the finding over a cylinder model in the absence of externalflow measured by hot-wire anemometry in Ref. 8.
IV. Phase-Locked-Averaged Results
The temporal characteristics of the flow induced by the periodic-pulsed plasma actuations are investigatedunder Vp−p = 14.5 kV , fp = 10 Hz and τp = 0.1, 0.5 and 0.9. The PIV sampling frequency is 9 Hz. Thereare 9 phase angles evenly distributed in a period of the pulse cycle. The phase angles are ψ = n × (40◦),where n = 0, 1, 2, ..., 8. The corresponding phase-locked averaged values are calculated from every 9 PIVsamples in the sampling order. n = 0 is chosen at the point where the phase-locked-averaged maximumcrossflow velocity in the entire neighborhood of the cone is the largest among all the phase angles. In thispaper, the PIV sampling time is 15 s. There are altogether 135 samples. At a fixed phase angle there are15 samples. The phase-locked averages are obtained from the 15 PIV samples.
To study the convergence, the phase-locked-averaged maximum crossflow velocity qmax in the entireneighborhood of the cone surface for pulse duty ratio τp = 0.1, obtained from the 15 samples is considered. Atthe location of this phase-locked-averaged maximum crossflow velocity, the phase-locked-averaged crossflowvelocity from samples of 1, 5 and 10 are listed in Tables 6 for pulse duty ratio τp = 0.1, for five phase angles.The convergence of the 15-sample results are quite good. Table 7 compares the phase-locked-averagedmaximum crossflow velocity, qmax and its location in the entire neighborhood of the cone obtained fromthe 15 samples for pulse duty ratio τp = 0.1 and frequency fp = 10 Hz with those of the correspondingensemble-averages. The phase-locked averages varies with phase angle remarkably and deviate from theensemble average significantly.
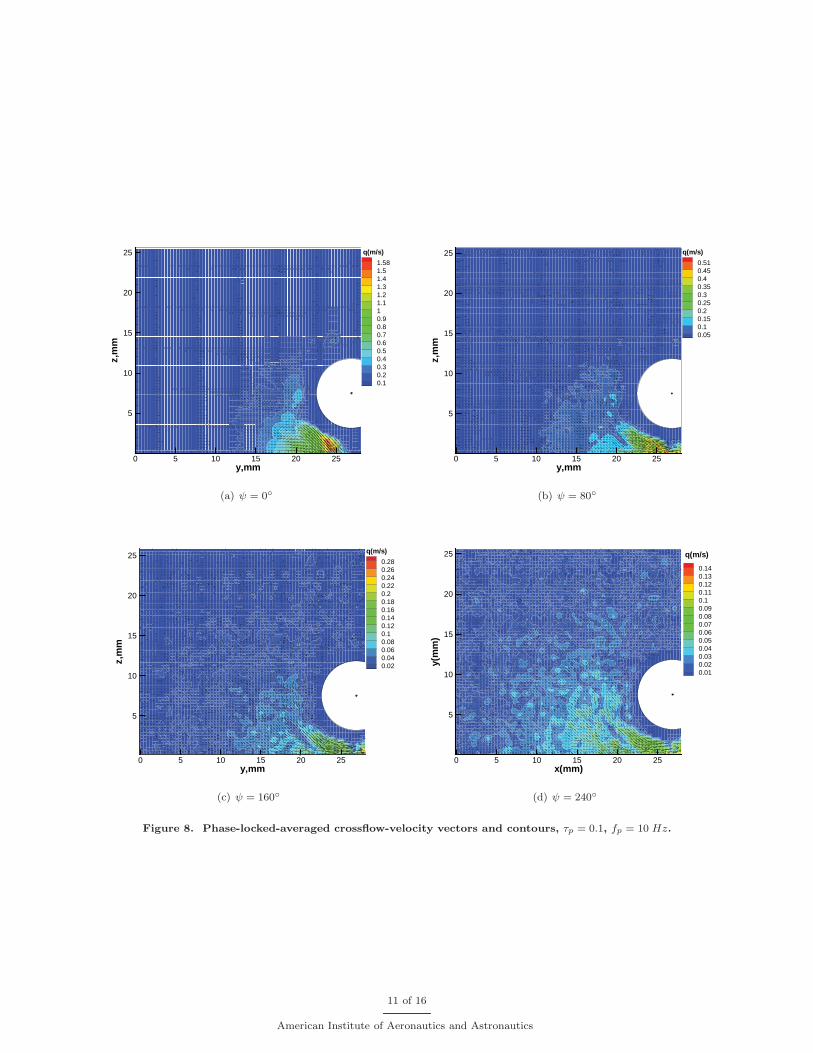
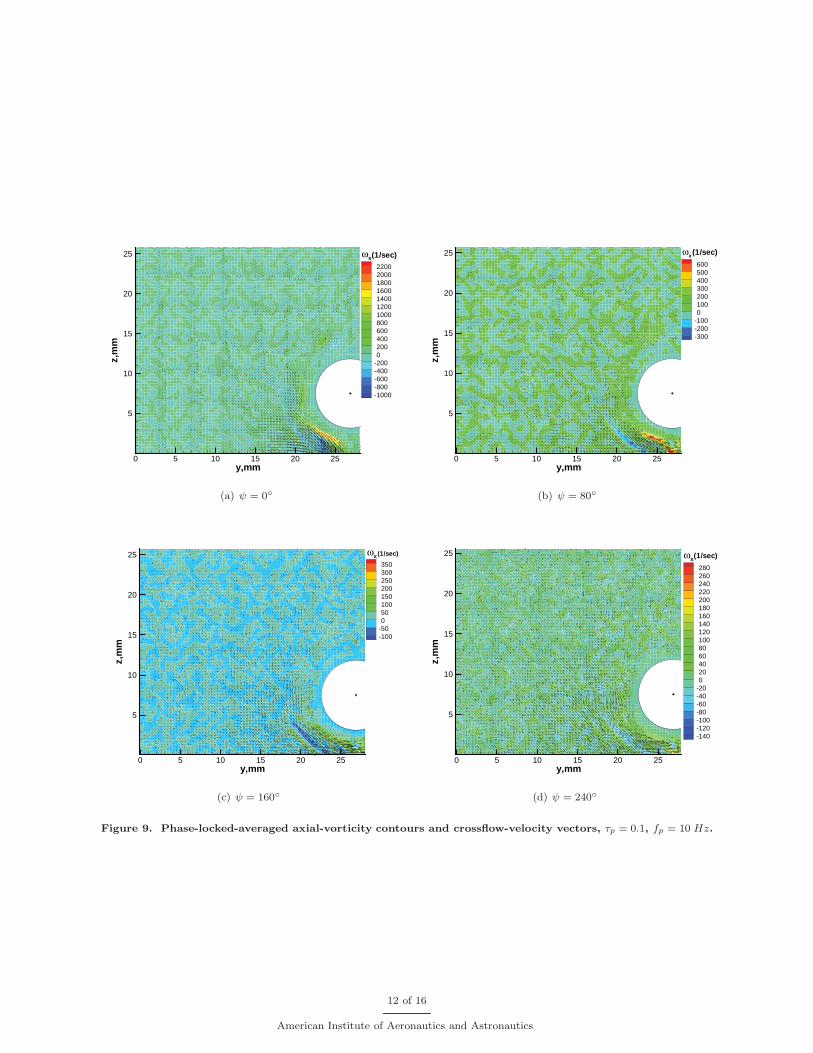
Figures 8 and 9 present phase-locked-averaged crossflow-velocity and axial-vorticity contours, respectively,for periodic pulse ratio, τp = 0.1 at various phase angles. The crossflow velocity vectors are plotted overboth contours.
The distributions of the phase-locked-averaged velocity component w and axial-vorticity ωx along a radialray originated from the body center at the azimuthal angle of θ = 90◦ are presented in Figure 10 for theperiodic-pulse ratio τp = 0.1 and frequency fp = 10 Hz at various phase angles. The phase-locked-averageshave larger variation range than the ensemble averages. Table 8 compares the variation ranges of phase-locked-averaged w and ωx for the five phase angles considered with those of the ensemble-averaged at pulseduty ratio τp = 0.1 and pulse frequency fp = 10 Hz.
8 of 16
American Institute of Aeronautics and Astronautics
r/rc
w(m
/s)
1 2 3 4 5 6
-0.8
-0.6
-0.4
-0.2
0
100%90%50%10%
τp
(a) Velocity component w
r/rc
ωx(1
/sec
)
1 2 3 4 5 6
-600
-400
-200
0
200
400
600
800
1000
1200
100%90%50%10%
τp
(b) Axial-vorticity ωx
Figure 6. Distributions of ensemble-averaged velocity component w and axial-vorticity ωx along radial lineθ = 90◦ for periodic-pulsed discharges of frequency fp = 10 Hz and steady plasma actuation, Vp−p = 14.5 kV .
9 of 16
American Institute of Aeronautics and Astronautics
r/rc
w(m
/s)
1 2 3 4 5 6
-0.3
-0.2
-0.1
0
10%50%90%100%
τp
(a) Velocity component w
r/rc
ωx(1
/sec
)
1 2 3 4 5 6
-200
0
200
400
10%50%90%100%
τp
(b) Axial-vorticity ωx
Figure 7. Distributions of ensemble-averaged velocity component w and axial-vorticity ωx along radial lineθ = 90◦ for periodic-pulsed discharges of frequency fp = 50 Hz and steady plasma actuation, Vp−p = 14.0 kV .
10 of 16
American Institute of Aeronautics and Astronautics
y,mm
z,m
m
0 5 10 15 20 25
5
10
15
20
251.581.51.41.31.21.110.90.80.70.60.50.40.30.20.1
q(m/s)
(a) ψ = 0◦
y,mm
z,m
m
0 5 10 15 20 25
5
10
15
20
250.510.450.40.350.30.250.20.150.10.05
q(m/s)
(b) ψ = 80◦
y,mm
z,m
m
0 5 10 15 20 25
5
10
15
20
250.280.260.240.220.20.180.160.140.120.10.080.060.040.02
q(m/s)
(c) ψ = 160◦
x(mm)
y(m
m)
0 5 10 15 20 25
5
10
15
20
25
0.140.130.120.110.10.090.080.070.060.050.040.030.020.01
q(m/s)
(d) ψ = 240◦
Figure 8. Phase-locked-averaged crossflow-velocity vectors and contours, τp = 0.1, fp = 10 Hz.
11 of 16
American Institute of Aeronautics and Astronautics
y,mm
z,m
m
0 5 10 15 20 25
5
10
15
20
2522002000180016001400120010008006004002000
-200-400-600-800-1000
ωx(1/sec)
(a) ψ = 0◦
y,mm
z,m
m
0 5 10 15 20 25
5
10
15
20
256005004003002001000
-100-200-300
ωx(1/sec)
(b) ψ = 80◦
y,mm
z,m
m
0 5 10 15 20 25
5
10
15
20
25350300250200150100500
-50-100
ωx(1/sec)
(c) ψ = 160◦
y,mm
z,m
m
0 5 10 15 20 25
5
10
15
20
25
280260240220200180160140120100806040200
-20-40-60-80-100-120-140
ωx(1/sec)
(d) ψ = 240◦
Figure 9. Phase-locked-averaged axial-vorticity contours and crossflow-velocity vectors, τp = 0.1, fp = 10 Hz.
12 of 16
American Institute of Aeronautics and Astronautics
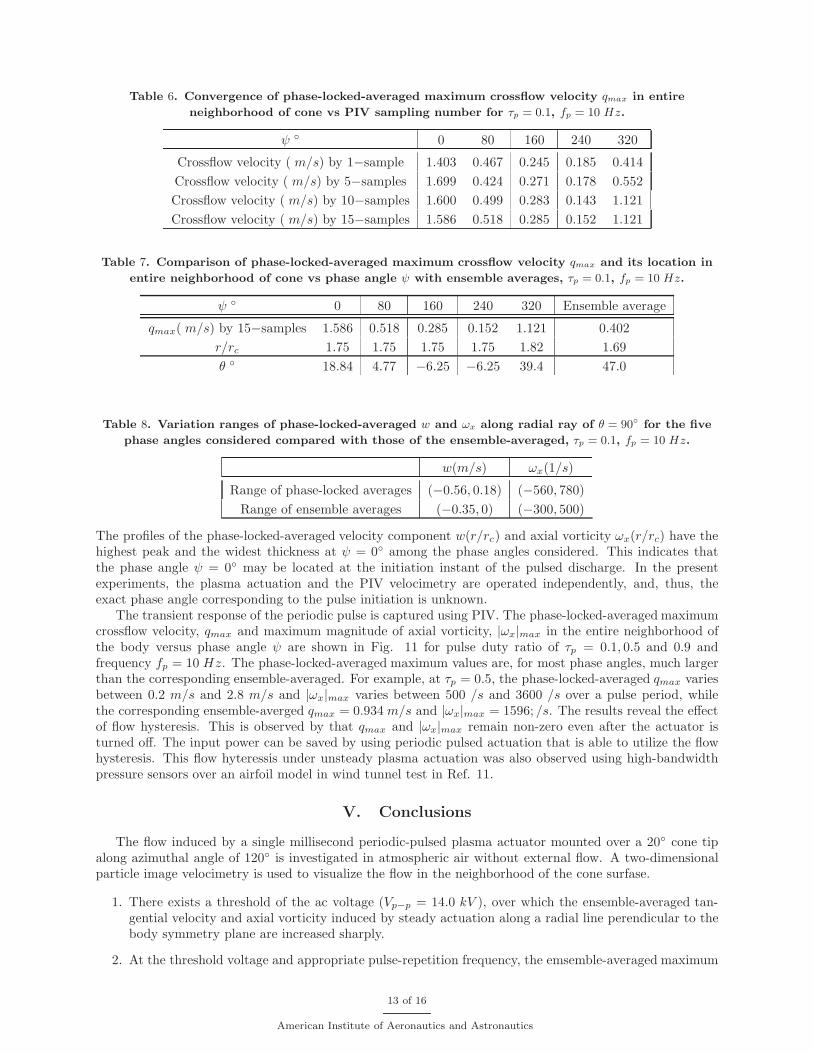
Table 6. Convergence of phase-locked-averaged maximum crossflow velocity qmax in entire
neighborhood of cone vs PIV sampling number for τp = 0.1, fp = 10 Hz.
ψ ◦ 0 80 160 240 320
Crossflow velocity ( m/s) by 1−sample 1.403 0.467 0.245 0.185 0.414
Crossflow velocity ( m/s) by 5−samples 1.699 0.424 0.271 0.178 0.552
Crossflow velocity ( m/s) by 10−samples 1.600 0.499 0.283 0.143 1.121
Crossflow velocity ( m/s) by 15−samples 1.586 0.518 0.285 0.152 1.121
Table 7. Comparison of phase-locked-averaged maximum crossflow velocity qmax and its location in
entire neighborhood of cone vs phase angle ψ with ensemble averages, τp = 0.1, fp = 10 Hz.
ψ ◦ 0 80 160 240 320 Ensemble average
qmax( m/s) by 15−samples 1.586 0.518 0.285 0.152 1.121 0.402
r/rc 1.75 1.75 1.75 1.75 1.82 1.69
θ ◦ 18.84 4.77 −6.25 −6.25 39.4 47.0
Table 8. Variation ranges of phase-locked-averaged w and ωx along radial ray of θ = 90◦ for the five
phase angles considered compared with those of the ensemble-averaged, τp = 0.1, fp = 10 Hz.
w(m/s) ωx(1/s)
Range of phase-locked averages (−0.56, 0.18) (−560, 780)
Range of ensemble averages (−0.35, 0) (−300, 500)
The profiles of the phase-locked-averaged velocity component w(r/rc) and axial vorticity ωx(r/rc) have thehighest peak and the widest thickness at ψ = 0◦ among the phase angles considered. This indicates thatthe phase angle ψ = 0◦ may be located at the initiation instant of the pulsed discharge. In the presentexperiments, the plasma actuation and the PIV velocimetry are operated independently, and, thus, theexact phase angle corresponding to the pulse initiation is unknown.
The transient response of the periodic pulse is captured using PIV. The phase-locked-averaged maximumcrossflow velocity, qmax and maximum magnitude of axial vorticity, |ωx|max in the entire neighborhood ofthe body versus phase angle ψ are shown in Fig. 11 for pulse duty ratio of τp = 0.1, 0.5 and 0.9 andfrequency fp = 10 Hz. The phase-locked-averaged maximum values are, for most phase angles, much largerthan the corresponding ensemble-averaged. For example, at τp = 0.5, the phase-locked-averaged qmax variesbetween 0.2 m/s and 2.8 m/s and |ωx|max varies between 500 /s and 3600 /s over a pulse period, whilethe corresponding ensemble-averged qmax = 0.934 m/s and |ωx|max = 1596; /s. The results reveal the effectof flow hysteresis. This is observed by that qmax and |ωx|max remain non-zero even after the actuator isturned off. The input power can be saved by using periodic pulsed actuation that is able to utilize the flowhysteresis. This flow hyteressis under unsteady plasma actuation was also observed using high-bandwidthpressure sensors over an airfoil model in wind tunnel test in Ref. 11.
V. Conclusions
The flow induced by a single millisecond periodic-pulsed plasma actuator mounted over a 20◦ cone tipalong azimuthal angle of 120◦ is investigated in atmospheric air without external flow. A two-dimensionalparticle image velocimetry is used to visualize the flow in the neighborhood of the cone surfase.
1. There exists a threshold of the ac voltage (Vp−p = 14.0 kV ), over which the ensemble-averaged tan-gential velocity and axial vorticity induced by steady actuation along a radial line perendicular to thebody symmetry plane are increased sharply.
2. At the threshold voltage and appropriate pulse-repetition frequency, the emsemble-averaged maximum
13 of 16
American Institute of Aeronautics and Astronautics
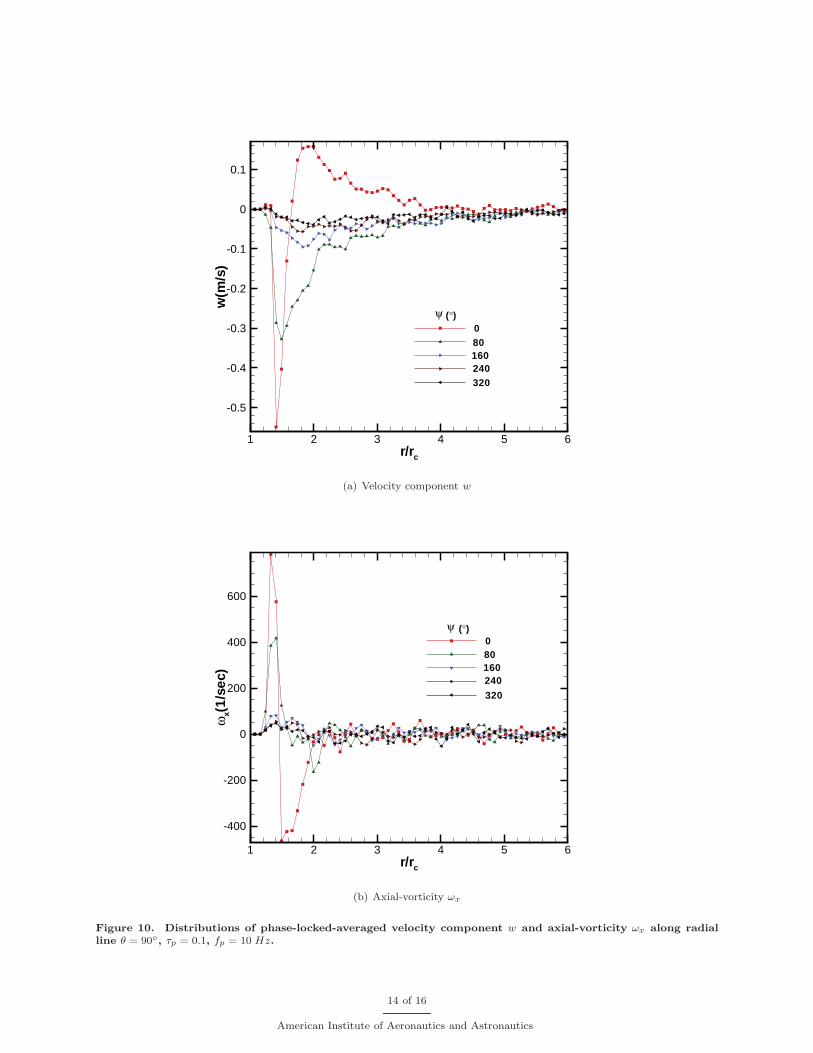
r/rc
w(m
/s)
1 2 3 4 5 6
-0.5
-0.4
-0.3
-0.2
-0.1
0
0.1
ψ (°)080160240320
(a) Velocity component w
r/rc
ωx(1
/sec
)
1 2 3 4 5 6
-400
-200
0
200
400
600
ψ (°)080160240320
(b) Axial-vorticity ωx
Figure 10. Distributions of phase-locked-averaged velocity component w and axial-vorticity ωx along radialline θ = 90◦, τp = 0.1, fp = 10 Hz.
14 of 16
American Institute of Aeronautics and Astronautics
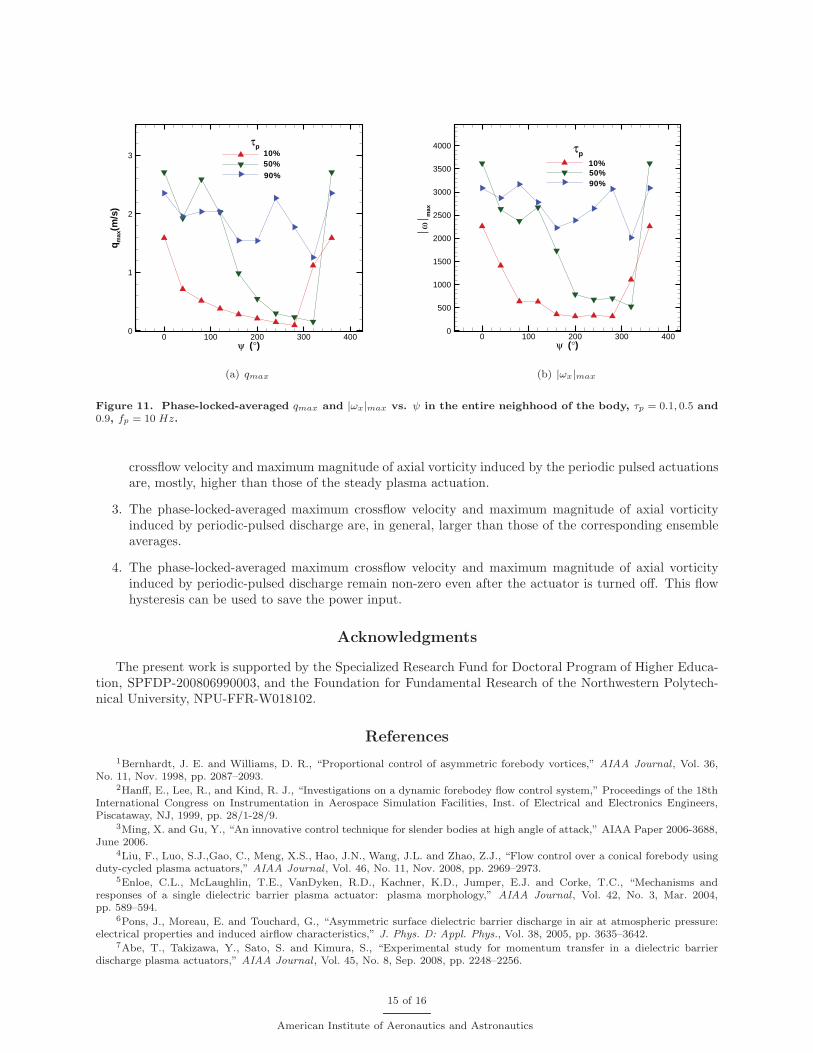
ψ (°)
q max
(m/s
)
0 100 200 300 4000
1
2
3 10%
90%50%
τp
(a) qmax
ψ (°)0 100 200 300 400
0
500
1000
1500
2000
2500
3000
3500
4000
10%50%90%
τp
⏐ω⏐ m
ax
(b) |ωx|max
Figure 11. Phase-locked-averaged qmax and |ωx|max vs. ψ in the entire neighhood of the body, τp = 0.1, 0.5 and0.9, fp = 10 Hz.
crossflow velocity and maximum magnitude of axial vorticity induced by the periodic pulsed actuationsare, mostly, higher than those of the steady plasma actuation.
3. The phase-locked-averaged maximum crossflow velocity and maximum magnitude of axial vorticityinduced by periodic-pulsed discharge are, in general, larger than those of the corresponding ensembleaverages.
4. The phase-locked-averaged maximum crossflow velocity and maximum magnitude of axial vorticityinduced by periodic-pulsed discharge remain non-zero even after the actuator is turned off. This flowhysteresis can be used to save the power input.
Acknowledgments
The present work is supported by the Specialized Research Fund for Doctoral Program of Higher Educa-tion, SPFDP-200806990003, and the Foundation for Fundamental Research of the Northwestern Polytech-nical University, NPU-FFR-W018102.
References
1Bernhardt, J. E. and Williams, D. R., “Proportional control of asymmetric forebody vortices,” AIAA Journal , Vol. 36,No. 11, Nov. 1998, pp. 2087–2093.
2Hanff, E., Lee, R., and Kind, R. J., “Investigations on a dynamic forebodey flow control system,” Proceedings of the 18thInternational Congress on Instrumentation in Aerospace Simulation Facilities, Inst. of Electrical and Electronics Engineers,Piscataway, NJ, 1999, pp. 28/1-28/9.
3Ming, X. and Gu, Y., “An innovative control technique for slender bodies at high angle of attack,” AIAA Paper 2006-3688,June 2006.
4Liu, F., Luo, S.J.,Gao, C., Meng, X.S., Hao, J.N., Wang, J.L. and Zhao, Z.J., “Flow control over a conical forebody usingduty-cycled plasma actuators,” AIAA Journal , Vol. 46, No. 11, Nov. 2008, pp. 2969–2973.
5Enloe, C.L., McLaughlin, T.E., VanDyken, R.D., Kachner, K.D., Jumper, E.J. and Corke, T.C., “Mechanisms andresponses of a single dielectric barrier plasma actuator: plasma morphology,” AIAA Journal , Vol. 42, No. 3, Mar. 2004,pp. 589–594.
6Pons, J., Moreau, E. and Touchard, G., “Asymmetric surface dielectric barrier discharge in air at atmospheric pressure:electrical properties and induced airflow characteristics,” J. Phys. D: Appl. Phys., Vol. 38, 2005, pp. 3635–3642.
7Abe, T., Takizawa, Y., Sato, S. and Kimura, S., “Experimental study for momentum transfer in a dielectric barrierdischarge plasma actuators,” AIAA Journal , Vol. 45, No. 8, Sep. 2008, pp. 2248–2256.
15 of 16
American Institute of Aeronautics and Astronautics

8Thomas, F.O., Kozlov, A. and Corke, T.C., “Plasma actuators for cylinder flow control and noise reduction,” AIAA
Journal , Vol. 45, No. 8, Aug. 2008, pp. 1921–1931.9Roth, J.R., “Aerodynamic flow acceleration using paraelectric and peristaltic electrohydrodynamic effect of a one atmo-
sphere uniform glow discharge plasma,” Phys. Plasma, Vol. 10, 2003, pp. 2117–2126.10Post, M.L. and Corke, T.C., “Separation control using plasma actuators–stationary and oscillating airfoil,” AIAA Paper
2004-0841, Jan 2004.11Patel, M.P., Ng, T.T., Vasudevan, S., Corke, T.C.. Post, M.L., McLaughlin, T.E. and Suchomel, C.F., “Scaling effects of
an aerodynamic plasma actuation,” AIAA Paper 2007-635, Jan. 2007.
16 of 16
American Institute of Aeronautics and Astronautics