Embed Size (px)
Citation preview

BC MINISTRY OF ENVIRONMENT
FRASER RIVER HYDRAULIC MODEL UPDATE
FINAL REPORT
MARCH 2008
nhc northwest hydraulic consultants
Leaders in water resource technology

FRASER RIVER HYDRAULIC MODEL UPDATE FINAL REPORT
Prepared for: BC Ministry of Environment
10470 – 152nd Street Surrey, BC V3R 0YR
Prepared by: northwest hydraulic consultants
30 Gostick Place North Vancouver, BC V7M 3G3
March 2008 34743

nhc
Fraser River Hydraulic Model Update Final Report i
DISCLAIMER This document has been prepared by northwest hydraulic consultants in accordance with generally accepted engineering and geoscience practices and is intended for the exclusive use and benefit of the client for whom it was prepared and for the particular purpose for which it was prepared. No other warranty, expressed or implied, is made.
northwest hydraulic consultants and its officers, directors, employees, and agents assume no responsibility for the reliance upon this document or any of its contents by any party other than the client for whom the document was prepared. The contents of this document are not to be relied upon or used, in whole or in part, by or for the benefit of others without specific written authorization from northwest hydraulic consultants.

nhc
Fraser River Hydraulic Model Update Final Report ii
EXECUTIVE SUMMARY In 2006, northwest hydraulic consultants (nhc) developed a MIKE11 hydraulic model for the Fraser River, covering the reach from just upstream of Mission to the Strait of Georgia. Using the model, a new design profile was computed and found to be up to 1 m higher than the previous design profile developed in 1969. The results affected the profile for the upstream reach from Laidlaw to Mission developed in 2001 by UMA Engineering Ltd. The two models were merged into a single model and a design profile computed, corresponding to a reoccurrence of the 1894 flood.
The 2007 snow-pack was well above normal and considering the increase in the design profile there was concern of potential flooding in the Fraser Valley. The British Columbia Ministry of Environment (MOE) retained nhc to run the new hydraulic model in real-time to forecast flood levels between Laidlaw and the Strait of Georgia. An intensive program of water level and flow data collection was carried out by Water Survey Canada (WSC), MOE, Fraser Valley municipalities and others to monitor river conditions and assess model performance during the daily forecasting as well as collect additional information for model fine-tuning. The model performed well but it became evident that there were problems with previously reported discharge data published by WSC. Also, that the Laidlaw – Mission (upper) model was not entirely compatible with the Mission – Georgia Strait (lower) model.
An unprecedented amount of water level and flow data was collected during the 2007 flood and following the freshet the project described in this report was undertaken to resolve the discharge data issues, update the two models as necessary, merge them and refine the previously developed design profile.
Both the Hope and Mission stage-discharge curves were revised by WSC in 2007. Using corrected discharges the lower model was calibrated to the 2007 flood and validated to the 2002 flood. A slight reduction in roughness coefficients was warranted for flows under 14,500 m3/s. However, roughness coefficients for the design profile were unaltered in the Mission-Douglas Island reach since they were previously derived using a historic model and the 1948 flood, to ensure proper representation of channel conditions at very high flows. No network changes were required to the fully hydro-dynamic lower model. The design profile was essentially unaltered, with a maximum flood level reduction of 0.16m in the Coquitlam area.
The upper model was recalibrated to the 1999 flood and validated to the 2007 flood. Significant changes were made to the model network. These modifications were undertaken to allow operating the model hydro-dynamically rather than using the diffusive wave algorithm. Roughness coefficients were revised, Harrison Lake was added to the model and several other changes were made. The changes resulted in increases and decreases in the design profile of up to 0.28 m.
A number of dikes were raised prior to the 2007 freshet. The dike crest elevation assessment completed in 2006 was repeated using the updated design profile and available as-built dike survey information.

nhc
Fraser River Hydraulic Model Update Final Report iii
The two models were combined and provide an excellent tool for forecasting flood levels for the Lower Fraser River. The model needs to be kept up-to-date and particularly during floods with return periods exceeding about 10-15 years it should be revalidated. The model is highly sensitive to flow and it is imperative that WSC carry out additional flow measurements during peak flows to keep the stage-discharge curves current for key gauges on the river.

nhc
Fraser River Hydraulic Model Update Final Report iv
CREDITS AND ACKNOWLEDGEMENTS This project was conducted under the guidance of Ron Henry, P.Eng. of the BC Ministry of Environment, who throughout the project provided information, direction and advice. Russell White, M.Sc. and Bruno Tassone, P.Eng. of Water Survey Canada assisted with reviewing flow records and obtaining flow measurements during the 2007 freshet. Dan Couture and Mick Mills of Public Works and Government Services Canada provided flow split measurements at various locations. The cooperation of all the gauge operators during the 2007 freshet measurement program was greatly appreciated.
Key nhc staff involved in this project was Tamsin Lyle, P.Eng. who completed the hydraulic modelling updates; Sarah North, who managed the GIS component of the project; and Charlene Menezes, GIT, who completed the dike assessment and prepared the dike drawings. Project management and flow reviews were carried out by Monica Mannerström, P.Eng. The report was prepared by Tamsin Lyle and Monica Mannerström, with independent review by Dr. David McLean, P.Eng.

nhc
Fraser River Hydraulic Model Update Final Report v
TABLE OF CONTENTS List of Tables.......................................................................................................... vii List of Figures ........................................................................................................ vii List of Drawings.................................................................................................... viii List of Maps........................................................................................................... viii List of Appendices................................................................................................ viii 1 Introduction ....................................................................................................... 1
1.1 Scope of Work .............................................................................................. 1 1.2 Report Outline............................................................................................... 3
2 Background ....................................................................................................... 4 2.1 Early Flood Investigations............................................................................. 4 2.2 Laidlaw - Mission (Upper) Model ................................................................. 4 2.3 Mission - Strait of Georgia (Lower) Model..................................................... 5 2.4 Initial Combined Models................................................................................ 6
3 2007 Freshet Data Collection and Analysis .................................................... 7 3.1 Water Level Gauges ..................................................................................... 7 3.2 Discharge Measurements ............................................................................. 7
3.2.1 Measurement Program...................................................................................... 7 3.2.2 Fraser River at Hope ......................................................................................... 8 3.2.3 Harrison River at Harrison Lake ........................................................................ 9 3.2.4 Fraser River at Mission.................................................................................... 10
3.3 Flow Split Data............................................................................................ 10 3.4 Adopted Freshet Discharges ...................................................................... 11 3.5 Bathymetric Surveys................................................................................... 11
4 Model Recalibration and Updates.................................................................. 13 4.1 Lower Model .............................................................................................. 13
4.1.1 Model Updates ................................................................................................ 13 4.1.2 Model Calibration (2007) ................................................................................. 14 4.1.3 Model Validation (2002)................................................................................... 15 4.1.4 Assessment of Results .................................................................................... 15
4.2 Upper Model ............................................................................................... 16 4.2.1 Original Model Limitations And Model Updates............................................... 16 4.2.2 Model Calibration(1999) .................................................................................. 18 4.2.3 Model Validation (2007)................................................................................... 18 4.2.4 Assessment of Results .................................................................................... 19
4.3 Merged Model............................................................................................. 19

nhc
Fraser River Hydraulic Model Update Final Report vi
4.3.1 Inclusion of Harrison Lake ............................................................................... 19 4.3.2 Model Merging Methodology ........................................................................... 20 4.3.3 Model Validation (2007)................................................................................... 20
5 Design Flood Profile ....................................................................................... 21 5.1 Lower Model ............................................................................................... 21
5.1.1 Model Conditions............................................................................................. 21 5.1.2 Simulation Results........................................................................................... 21 5.1.3 Sensitivity Runs ............................................................................................... 22
5.2 Upper Model ............................................................................................... 22 5.2.1 Model Conditions............................................................................................. 22 5.2.2 Simulation Results........................................................................................... 22 5.2.3 Sensitivity Runs ............................................................................................... 23
5.3 Model Limitations........................................................................................ 23
6 Flood Level Forecasting Model...................................................................... 24 6.1 Input Requirements .................................................................................... 24 6.2 User Instructions......................................................................................... 24 6.3 Simulation Results ...................................................................................... 25 6.4 Limitations................................................................................................... 25
7 Dike Assessment............................................................................................. 26 7.1 Methodology ............................................................................................... 26 7.2 Assessment Results ................................................................................... 27
8 Water Level Reference Tables........................................................................ 28 8.1 Lower Model ............................................................................................... 28 8.2 Upper Model ............................................................................................... 28
9 Conclusions and Recommendations ............................................................ 29 9.1 Conclusions ................................................................................................ 29 9.2 Recommendations...................................................................................... 29
10 References....................................................................................................... 31

nhc
Fraser River Hydraulic Model Update Final Report vii
LIST OF TABLES Table 3.1: WSC 2007 Flow Measurements Table 3.2: 2007, 2002 and 1999 Freshet Flow Time-Series Table 3.3: 2007 Flow Split Measurements Table 3.4: Peak Inflows to Models Table 4.1: Freshet Calibration/Validation of Water Levels for Lower Model Table 4.2: Freshet Calibration Roughness Summary for Lower Model Table 4.3: Freshet Calibration/Validation of Flows for Lower Model Table 4.4: Calibration/Validation of Water Levels for Upper Model Table 4.5: Calibration Roughness Summary for Upper Model Table 4.6: 2007 Freshet Validation of Water Levels for Merged Model Table 5.1: Design Profile Comparison for Lower Model (1969, 2006 and 2007) Table 5.2: Design Profile Comparison for Upper Model (1969, 2001, 2006 and 2007) Table 7.1: Dike Information Sources Table 7.2: Qualitative Dike Elevation Assessment Table 8.1: Inflows to Upper Model for Development of Municipal Water Level Reference
Tables
LIST OF FIGURES Figure 3.1: Fraser River at Hope - Specific Gauge Curve based on WSC Rating Curves Figure 3.2: Fraser River at Hope - Rating Curves and 2000-2007 Flow Measurements Figure 3.3: Fraser River at Mission - Specific Gauge Curve based on WSC Rating
Curves Figure 3.4: Fraser River at Mission - Rating Curves and Recent Flow Measurements Figure 3.5: Uncorrected and Corrected 2007 Flow Hydrographs Figure 3.6: Uncorrected and Corrected 2002 Flow Hydrographs Figure 3.7: Uncorrected and Corrected 1999 Flow Hydrographs Figure 3.8: Fraser River at Hope, Channel at WSC Metering Section, 1917-1982 Figure 3.9: Fraser River at Hope, MOT Bridge Soundings 30 m Upstream of Bridge
Centreline Figure 3.10: Bathymetry Comparisons at Oak Street Bridge Figure 3.11: Bathymetry Comparisons at Knight Street Bridge Figure 3.12: Bathymetry Comparisons at Queensborough Bridge Figure 3.13: Bathymetry Comparisons at Port Mann Bridge Figure 3.14: Bathymetry Comparisons at Mission Road Bridge Figure 4.1: Fraser River at Mission, Roughness versus Flow Figure 4.2: Upper Model MIKE11 Updates Figure 4.3: Merged Fraser Model 2007 Calibration, Harrison Lake at Harrison Hotsprings Figure 5.1: Design Profile Lower Model Figure 5.2: Design Profile Upper Model

nhc
Fraser River Hydraulic Model Update Final Report viii
LIST OF DRAWINGS Drawing No. 1: Profile Comparison 2007 Modelled and 1969 Calculated Profiles
Downstream of Mission Drawing No. 2: Profile Comparison 2007 Modelled and 1969 Calculated Profiles
Upstream of Mission Drawing No. 3: Dike Crest and Flood Profile Comparison – District of Kent Drawing No. 4: Dike Crest and Flood Profile Comparison – City of Chilliwack Drawing No. 5: Dike Crest and Flood Profile Comparison – City of Chilliwack, City of
Abbotsford Drawing No. 6: Dike Crest and Flood Profile Comparison – City of Abbotsford Drawing No. 7: Dike Crest and Flood Profile Comparison – Nicomen Island
Improvement District Drawing No. 8: Dike Crest and Flood Profile Comparison – District of Mission and
Dewdney Area Improvement District Drawing No. 9: Dike Crest and Flood Profile Comparison – Glen Valley Diking
Authority, Township of Langley Drawing No. 10: Dike Crest and Flood Profile Comparison – District of Maple Ridge,
District of Pitt Meadows Drawing No. 11: Dike Crest and Flood Profile Comparison – District of Pitt Meadows Drawing No. 12: Dike Crest and Flood Profile Comparison – City of Port Coquitlam,
City of Coquitlam Drawing No. 13: Dike Crest and Flood Profile Comparison – Electoral District A, City of
Surrey Drawing No. 14: Dike Crest and Flood Profile Comparison – City of New Westminster Drawing No. 15: Dike Crest and Flood Profile Comparison – City of Richmond Drawing No. 16: Dike Crest and Flood Profile Comparison – City of Richmond Drawing No. 17: Dike Crest and Flood Profile Comparison – Corporation of Delta Drawing No. 18: Dike Crest and Flood Profile Comparison – Corporation of Delta
LIST OF MAPS Map No. 1: Gauge Locations Map No. 2: MIKE11 Schematic – Lower Model Map No. 3: MIKE11 Schematic – Upper Model Map No. 4: Water Surface Profile Plan and Dike Layout – Lower Model Map No. 5: Water Surface Profile Plan and Dike Layout – Upper Model
LIST OF APPENDICES Appendix A: WSC Information Appendix B: Calibration/Validation Plots for Lower Model Appendix C: Roughness from ADCP Data Appendix D: Calibration/Validation Plots for Upper Model Appendix E: Sensitivity Analyses for Lower Model (Tables and Charts) Appendix F: Sensitivity Analyses for Upper Model (Tables and Charts) Appendix G: Railway Embankment Breach at Seabird Island Appendix H: Municipal Water Level Reference Tables Appendix I: Design Water Levels Listed by Gauge

nhc
Fraser River Hydraulic Model Update Final Report 1
1 INTRODUCTION In 2006, northwest hydraulic consultants (nhc) developed a MIKE11 hydraulic model for the Fraser River, covering the reach from just upstream of Mission to the Strait of Georgia. This model was merged with a model developed by UMA Engineering Ltd. (UMA) in 2001 for the reach from Laidlaw, just downstream of Hope, to Mission. Using these models, a new design flood profile was computed that replaced the previous profile developed in 1969. The new profile was found to be up to 1 m higher than the old profile in some locations.
Due to the increase in the design profile and the high snow-pack in 2007 there was concern that the freshet would be large enough to potentially trigger flooding in the Fraser Valley. To aid with flood response during the freshet, the British Columbia Ministry of Environment (MOE) retained nhc to run the hydraulic model in real-time to forecast flood levels between Laidlaw and the Strait of Georgia. An intensive program of water level and flow data collection was carried out by Water Survey Canada (WSC), MOE, Fraser Valley municipalities, Public Works and Government Services Canada (PWGSC) and some private agencies to monitor river conditions, improve the accuracy of model input data and assess the model performance.
During the forecasting project, it became apparent that there were inconsistencies in reported WSC flows affecting the model results. Also, the need was identified to extend and fine-tune the Laidlaw-Mission model to make it more compatible with the Mission-Strait of Georgia model. The data collected in 2007, provided an excellent basis for undertaking this model update work.
1.1 SCOPE OF WORK
MOE’s original scope of work for the Fraser River hydraulic model update study specified the following tasks:
1. Review river flow measurements and river cross section surveys carried out by Water Survey of Canada (WSC) staff and others, in relation to the flows estimated using the present rating curves. Flow measurements were done at the Fraser River at Mission, Fraser River at Hope and the Harrison River at the Lake outlet. Liaise with WSC staff to discuss the flow estimates and possible revisions to rating curves at these flow gauge sites.
2. During the freshet, flow split data was collected at Douglas Island and other sites, by Public Works and Government Services Canada (PWGSC). The measured flow split data are to be compared with the computed flows generated with the model and adjustments made as required.
3. Review the accuracy of water level gauge data collected during the freshet by local municipalities, diking districts and other agencies. In some instances there may be datum problems or local hydraulic effects, where the actual water level varies greatly from the modelled level.

nhc
Fraser River Hydraulic Model Update Final Report 2
4. Recalibrate and verify the Mission to Georgia Strait model using observed water levels and Mission flows based upon a new rating curve, taking into account recent flow measurements.
5. Re-run the design flood profile for the Fraser River below Mission using the recalibrated model and compare it to the previous design flood profile, as shown in the 2006 nhc report.
6. Carry out a detailed review of the Mission to Laidlaw model and revise the model as required. The revisions are to also include extending the model to include Harrison Lake.
7. Re-run the upstream model for the design event and compare it to the design profile prepared in the 2006 nhc and the 2001 UMA Engineering reports.
8. Prepare revised dike profile drawings to illustrate the design profile and to incorporate the new dike crest elevations where revised under the 2007 Urgent Flood Mitigation Works Program. The dike profile drawings for dikes in Dewdney, Abbotsford, Pitt Meadows, Maple Ridge, Surrey, Port Coquitlam and Mission need to be revised to illustrate the new dike crests.
9. Prepare additional dike profile drawings to illustrate the water surface profile for various flows (estimated return periods 1:100, 1:50 and 1:25 yr) and the new dike crest elevations.
10. Merge the upstream and downstream models into one seamless model that can be used in future for water level forecasting during the freshet.
11. Prepare a report summarising the results of the model recalibration. Update the relevant tables and figures from the 2006 nhc report to illustrate the new flood profile.
As a result of preliminary findings and at the request of MOE and other stakeholders, the original scope was modified and expanded to include:
12. Review a letter prepared by WSC regarding stream-gauge information and obtain additional discharge measurements and other information, not initially available.
13. Prepare water level reference tables for all the gauge sites in the study reach corresponding to Mission water levels of between 6.0 m and 8.5 m in 0.5 m increments.
14. Present preliminary study results to MOE and municipal representatives. Provide follow-up information and answer questions subsequent to the meeting.
15. Compare 2007 bathymetric surveys at bridge crossings and 2005 model cross-sections to assess recent river changes. Also, assess historic cross-section changes at Mission and Hope. Review WSC files for relevant information such as the original Colonel Whyte memo from 1934 regarding the 1894 high water marks at Hope.
16. Review ADCP flow measurement data for Mission collected by WSC and nhc and calculate channel roughness coefficients based on velocity vector data.

nhc
Fraser River Hydraulic Model Update Final Report 3
1.2 REPORT OUTLINE
This report describes the hydraulic model updates and presents the latest design profile for the Lower Fraser River based on the flow and water level data collected during the 2007 freshet. Section 2 provides modelling background information, Section 3 reviews flow measurements at key locations, summarizes rating curve revisions and observed channel changes, Section 4 describes the updates to and recalibration of the upper and lower Fraser River models and Section 5 describes the updated design profile. Section 6 gives guidance on the use of the models for flood forecasting. Section 7 provides the dike assessment methodology and results. A new tool developed over the course of the project, a set of municipal reference tables, is described in Section 8. Conclusions and recommendations are provided in Section 9, and a full reference list is found in Section 10.
nhc
Fraser River Hydraulic Model Update Final Report 4
2 BACKGROUND
2.1 EARLY FLOOD INVESTIGATIONS
The flood of 1894 has been adopted as the design flood condition for the Fraser River. No reliable flow measurements were taken during the flood, but based on an approximate high water mark at Hope established forty years after the flood (Appendix A), a flow estimate of 17,000 m3/s was previously derived (Fraser River Board, 1958). Prior to the 1999-2008 Fraser River numerical modelling work, the design standard for dikes and other structures along the river was an estimated 1894 profile, developed in 1969. The profile was derived mainly from historic high water marks from 1894, 1948 and the 1960’s. Some adjustments were made to account for the effects of dikes built after the high water mark observations.
In 1894, during the flood of record, a maximum water level of 7.92 m was observed at Mission. During this flood the entire floodplain, including the vast Sumas Prairie was inundated and the Fraser River flowed into Harrison Lake across Agassiz. The floodplain provided substantial flow storage, which would have significantly reduced the peak flow at Mission compared to the flow at Hope. No dikes confined the flow in 1894 and the channel capacity would have been considerably greater than in 1969. In spite of these flow and channel variations, the 1969 profile work set the Mission design level at an elevation of 7.92 m, equal to the level observed in 1894.
A relatively large flood occurred in 1997, with a return period exceeding 10 years. During the flood, MOE collected water level data at a series of gauges, mostly located in the Mission to Agassiz reach. MOE plotted this data against the design profile and showed that the two profiles were far from parallel. In some reaches, particularly at Harrison Mills/Chilliwack, the 1997 flood profile was surprisingly close to the estimated 1894 profile, indicating that the profile developed in 1969 may not be an appropriate design standard.
2.2 LAIDLAW - MISSION (UPPER) MODEL
As a result of the 1997 findings, the City of Chilliwack, with the assistance of MOE, retained UMA Engineering Ltd (UMA) to model the Fraser River and update the design profile for the 65 km long gravel bed reach between Laidlaw, just downstream of Hope, and Mission. A MIKE 11 model was developed using 1999 bathymetry and LiDAR data. The river reach is complex, containing multiple channels and a number of gravel bars. The model included Harrison River to Harrison Lake outlet and the lower Vedder River (UMA, 2000).
MIKE11 provides three methods for computing water levels; the fully dynamic method; the diffusive wave approximation and the kinematic wave approximation (nhc, 2006). UMA encountered some instability problems when using the fully dynamic method and chose to use the diffusive wave approximation.
The model was calibrated to WSC flows for the 1999 flood and validated to the flood of 1997. The design profile was based on an upstream inflow of 17,000 m3/s, corresponding to

nhc
Fraser River Hydraulic Model Update Final Report 5
the estimated 1894 flood. A Harrison River discharge of 2,230 m3/s was assumed and other inflows were estimated based on flow ratios. The model downstream boundary condition was set equal to the observed 1894 water level at Mission of 7.92 m. The computed design profile was found to be up to 0.85 m higher than the 1969 profile.
In 2001, UMA undertook further hydrologic analyses and were able to fine-tune the Harrison River design flow to 1,300 m3/s, which lowered the Fraser design profile near the Harrison confluence. However, the revised profile was still a maximum of 0.8 m higher than the 1969 design profile (UMA, 2001). The model results raised questions regarding the accuracy of the design profile downstream of Mission.
2.3 MISSION - STRAIT OF GEORGIA (LOWER) MODEL
In 2005, the Fraser Basin Council (FBC) and MOE in collaboration with municipal and federal stakeholders retained nhc to build a MIKE11 model for the roughly 90 km long reach from Mission to Strait of Georgia. This work was completed in December 2006, and was documented in two progress reports and a final report (nhc, 2006).
The model was built using 2005 bathymetry for the channels and LiDAR data for the floodplain topography. It covered the Fraser River sand-bed reach, from just upstream of Mission to Georgia Strait and encompassed the North, Middle and South Arms of the Fraser, including Canoe Pass as well as Pitt River and Pitt Lake. The river reach is tidal and it was essential that the fully hydrodynamic method of MIKE 11 be used. The model was calibrated to hourly flows provided by WSC for the 2002 flood and validated to reported flows for 1999 and 1997. Within the study reach, recorded water levels were available at 13 locations in 2002, 6 locations in 1999 and 6 locations in 1997.
The calibration/validation floods had return periods in the order of 10-years. In sand-bed rivers, such as the lower Fraser, sand dunes begin to form in certain flow ranges and may subsequently wash-out as flows increase, affecting the channel roughness. To verify if the roughness coefficients developed for flows in the 10-year flood range would be applicable at the design discharge, a separate historic model was developed for the Mission to Douglas Island reach. It used bathymetry from the 1950’s and was calibrated to the floods of 1948 and 1950, with reported flows at Hope of respectively 15,200 m3/s and 12,600 m3/s. The calibrated roughness coefficients for these high flows were found to be somewhat lower than in the 10-year flood range (flow at Hope around 11,000 m3/s) and were subsequently used for the design profile computations. The development of the historic model and the flow-roughness relationship is more fully described in the nhc (2006) report.
To model the freshet design profile, an upstream inflow of 18,900 m3/s was adopted at Mission, corresponding to the 1894 flood estimate at Hope of 17,000 m3/s plus local inflows between Hope and Mission. Additional flows for the Stave, Pitt, Alouette and Coquitlam Rivers were incorporated. The updated design profile, which assumed that flow is confined by dikes, was found to be 1 m higher at Mission than the 1969 profile. This result showed that the previous starting level for the upper model was incorrect and that the UMA design profile needed to be revised.

nhc
Fraser River Hydraulic Model Update Final Report 6
2.4 INITIAL COMBINED MODELS
Following the development of the lower model, it was merged with the upper model to provide a flood level forecasting tool for the entire river between Laidlaw and the Strait of Georgia (nhc, 2006). During the preparatory phase of the 2007 freshet flood level forecasting project, a careful review was made on the input data and the operation of the combined model. During this phase, some discrepancies were identified with the published flow data. Some limitations were also found with the combined model’s operations (nhc, 2007). These issues were as follows:
• The sum of discharges published by WSC for Fraser River at Hope, Harrison River at Harrison Lake Outlet and other smaller tributaries between Hope and Mission was consistently higher than reported discharges at Mission. Since the lower model had been calibrated to reported Mission flows, using the sum of upstream flows as input, resulted in water levels downstream of Mission that were too high.
• The reach between Mission and Harrison Lake in the upper model was tidally influenced and the diffusive wave approximation used in the model did not provide accurate results. When the fully hydrodynamic method was used, instabilities occurred.
• Harrison Lake was not included in the model. Since the hydrologic model used by MOE’s River Forecast Centre (RFC) predicted lake inflows, lake outflows required for modelling could not accurately be determined.
• The upper model used unusually high roughness coefficients to account for energy losses other than those associated with channel friction. It was suspected that these coefficients would not be representative for flows outside the calibration range. Other roughness concerns were associated with the overly jagged bed topography of the upper model.
As a result, the upper and lower models had to be run separately during the 2007 freshet and some flow adjustments made to ensure accurate water level predictions. The work described in this report was chiefly undertaken to:
• Together with WSC, investigate and resolve discharge discrepancies.
• Improve the compatibility of the upper model with the lower model to simplify flood level forecasting procedures in the future.
• With the extensive flow and water level data collected in 2007, fine-tune the calibration of the upper and lower models and refine the design profile.

nhc
Fraser River Hydraulic Model Update Final Report 7
3 2007 FRESHET DATA COLLECTION AND ANALYSIS The Fraser River flood level forecasting project highlighted the need for extensive and accurate flow and water level data, particularly at high flows. Considering the high snow-pack in the spring of 2007 and the potential for a significant flood, an unprecedented data collection program was undertaken by WSC, MOE, municipalities, PWGSC and private organizations. This included collecting water level information at over 70 gauges, obtaining flow measurements at WSC key gauge sites and channel splits, as well as bathymetric surveys at some bridge crossings.
3.1 WATER LEVEL GAUGES
WSC operates five continuous water level gauges along the Fraser Main Arm; at Hope, Mission, Whonnock, Port Mann and Steveston, plus one on the North Arm (Vancouver South), one on Pitt River (near Port Coquitlam), one on the Harrison River (at Harrison Hot Springs), and one on the Chilliwack River at Vedder Crossing. Of these gauges, only Pitt River and North Arm gauges did not report in real-time during the 2007 freshet. The Harrison and Chilliwack stations reported daily flows, all others hourly data.
Compared to the 2002 flood, used for calibrating the lower model, a number of additional continuous recording gauges were installed prior to the 2007 freshet. In total, 21 continuous gauges were in operation within the lower model reach, compared to only 13 in 2002. In the upper model reach there were five continuous gauges.
MOE maintains 30 staff gauges between New Westminster and Hope, with an additional 16 staff gauges run by the municipalities of New Westminster, Coquitlam, Kent and Chilliwack. These gauges are manually read, typically once a day during the freshet, when water levels at Mission approach or exceed 6 m. The condition of staff gauges was checked prior to the freshet and any required repairs carried out.
Over the freshet period, data was collected from a total of 70 gauges between Hope and the Ocean. Map 1 shows the gauge network. This was the most extensive water level data ever collected on the river.
3.2 DISCHARGE MEASUREMENTS
3.2.1 MEASUREMENT PROGRAM
Accurate flow data is essential for model calibration and flood level computations. The 2007 forecasting preparatory work showed that summing the Fraser River flow at Hope and the local inflows between Hope and Mission (from Harrison River, Chilliwack River, and other smaller tributaries) consistently resulted in higher flows than those reported at Mission. WSC was informed of this apparent discrepancy and subsequently provided excellent cooperation and technical support to assess this issue. WSC also collected a large number of flow

nhc
Fraser River Hydraulic Model Update Final Report 8
measurements at the Hope, Harrison and Mission gauge sites to update their rating curves. A preliminary analysis of this information was summarized by nhc in a memorandum (September 20, 2007). In a letter dated November 16, WSC responded to the memorandum and provided further clarification on measurement techniques and procedures for developing stage-discharge curves.
Typically, flows published and reported in real-time by WSC are based on observed water levels and stage-discharge curves established for each gauge. Periodically, WSC measures flows to confirm that the stage-discharge curve in use is still representative. Any net changes to the channel cross-section, such as aggradation or degradation, give rise to shifts in the stage-discharge relationship and typically, a new curve is developed if measured flows consistently deviate by more than 5%. The number of measurements obtained per year has reduced in the past decade.
3.2.2 FRASER RIVER AT HOPE
WSC gauge Fraser River at Hope, 08MF005 is located on the right bank, 15 m downstream of the Highway/Old Kettle Valley Railroad Bridge. To convert to geodetic datum, 27.926 m must be added to the gauge height. Flow measurements were previously obtained from the bridge using a Price Meter but are now taken by boat using an Acoustic Doppler Current Profiler (ADCP). The ADCP measurements are considered more accurate but channel changes cannot be evaluated based on these metering notes since the measurement cross-section varies each time, as a result of the boat drifting downstream.
Water level and flow records begin in 1912 and since then 35 different stage-discharge curves have been in use, suggesting a fairly active channel cross-section. A specific gauge curve based on the stage-discharge curves is plotted in Figure 3.1. The data shows aggradation from about 1920 to the 1940’s, followed by degradation from the early 1950’s to the 1980’s. This trend seems to have reversed and the channel section has now aggraded. On November 12, 2007, WSC introduced a new stage-discharge curve, replacing the previous curve from 1987. The new curve was made effective from January 1, 2006. In recent years relatively few flow measurements have been obtained at discharges exceeding 5,000 m3/s, relevant for flood conditions. In the 1990’s nine such measurements were obtained and during the period from 2000 to 2006 there were only four. This is a significant reduction from the number of 5,000+ m3/s measurements in the 1960’s (28), 1970’s (36) and 1980’s (23). Since flows are a direct function of the stage-discharge curve, it is imperative that the curve be kept up-to-date. The channel section is active and future shifts in the stage-discharge relation are expected. Accurate reported flows are essential for both hydrologic and hydraulic modelling of the river. The highest measurement ever obtained was 12,290 m3/s (in 1972) and the stage-discharge relationship above this flow should be considered approximate. In the future, when higher flows occur extensive measurements should be obtained. The 1894 high water mark was estimated based on anecdotal evidence forty years after the flood (Appendix A). The high water level was then applied to an approximate rating curve extension to estimate the design
nhc
Fraser River Hydraulic Model Update Final Report 9
flow. The shifts in rating curves over time add further uncertainty to the estimate. It is conceivable that the actual 1894 peak flow may have been quite different from 17,000 m3/s. Extending the Fraser model to Hope gauge is recommended to verify the upper end of the present stage-discharge curve. Extending the model further to Alexandra Bridge, where a photograph was taken of the 1894 flood, could provide some verification of the flood magnitude.
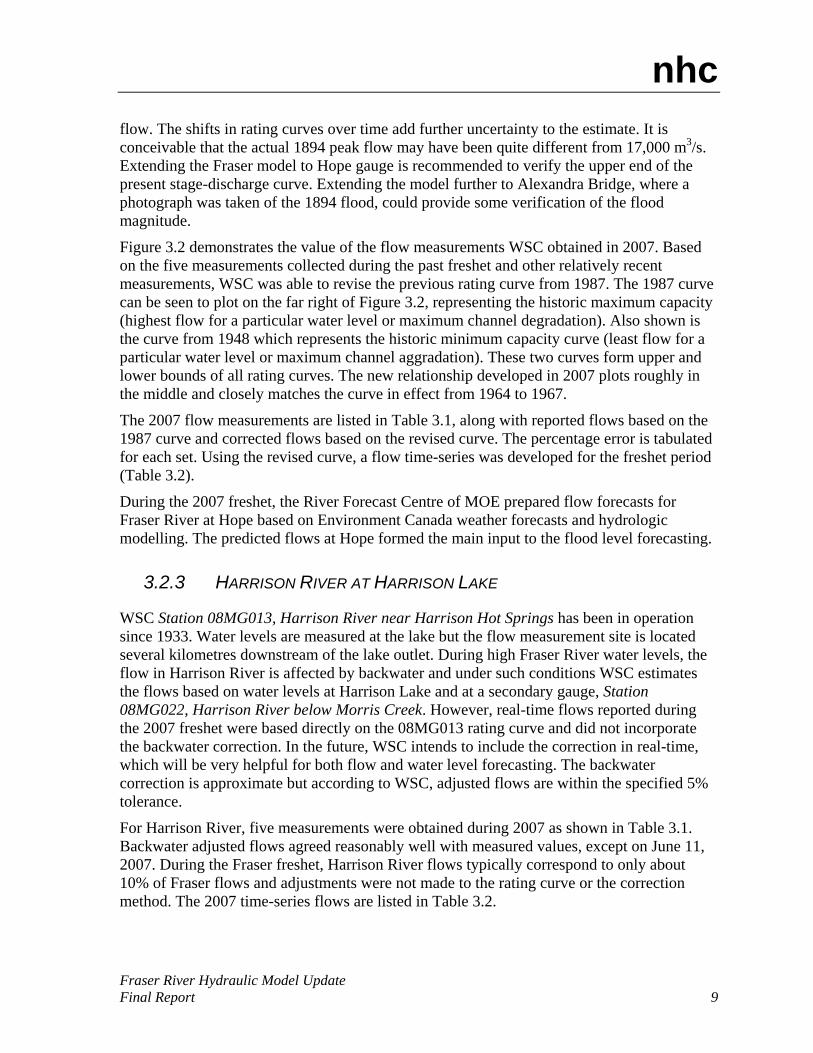
Figure 3.2 demonstrates the value of the flow measurements WSC obtained in 2007. Based on the five measurements collected during the past freshet and other relatively recent measurements, WSC was able to revise the previous rating curve from 1987. The 1987 curve can be seen to plot on the far right of Figure 3.2, representing the historic maximum capacity (highest flow for a particular water level or maximum channel degradation). Also shown is the curve from 1948 which represents the historic minimum capacity curve (least flow for a particular water level or maximum channel aggradation). These two curves form upper and lower bounds of all rating curves. The new relationship developed in 2007 plots roughly in the middle and closely matches the curve in effect from 1964 to 1967.
The 2007 flow measurements are listed in Table 3.1, along with reported flows based on the 1987 curve and corrected flows based on the revised curve. The percentage error is tabulated for each set. Using the revised curve, a flow time-series was developed for the freshet period (Table 3.2).
During the 2007 freshet, the River Forecast Centre of MOE prepared flow forecasts for Fraser River at Hope based on Environment Canada weather forecasts and hydrologic modelling. The predicted flows at Hope formed the main input to the flood level forecasting.
3.2.3 HARRISON RIVER AT HARRISON LAKE
WSC Station 08MG013, Harrison River near Harrison Hot Springs has been in operation since 1933. Water levels are measured at the lake but the flow measurement site is located several kilometres downstream of the lake outlet. During high Fraser River water levels, the flow in Harrison River is affected by backwater and under such conditions WSC estimates the flows based on water levels at Harrison Lake and at a secondary gauge, Station 08MG022, Harrison River below Morris Creek. However, real-time flows reported during the 2007 freshet were based directly on the 08MG013 rating curve and did not incorporate the backwater correction. In the future, WSC intends to include the correction in real-time, which will be very helpful for both flow and water level forecasting. The backwater correction is approximate but according to WSC, adjusted flows are within the specified 5% tolerance.
For Harrison River, five measurements were obtained during 2007 as shown in Table 3.1. Backwater adjusted flows agreed reasonably well with measured values, except on June 11, 2007. During the Fraser freshet, Harrison River flows typically correspond to only about 10% of Fraser flows and adjustments were not made to the rating curve or the correction method. The 2007 time-series flows are listed in Table 3.2.

nhc
Fraser River Hydraulic Model Update Final Report 10
In addition to predicted flows at Hope, RFC provided Harrison Lake outflows. However, attempts were maid to match predicted flows to the real-time unadjusted Harrison River flows, resulting in flows that were too high. By including Harrison Lake in the MIKE11 model, RFC can predict lake inflows rather than outflows, simplifying hydrologic modelling for Harrison River.
3.2.4 FRASER RIVER AT MISSION
Water levels at Station 08MG024, Fraser River at Mission are tidally influenced at most flows. Water level records date back to the 1870’s but flow records commence in 1965. Because of the strong tidal influence at low river discharges, flow records are typically not available for stage levels less than 3 m (flows less than about 6,000 m3/s). Even in the 3 m to 6+ m range there is a tidal effect and for a particular water level the flow may vary. WSC is considering installing an acoustic velocity meter at this site (Appendix A).
The stream-gauge is located on the right bank, 16 m downstream of the CPR Bridge. The measurement section is 320 m upstream of the gauge. To convert to geodetic datum, 0.043 m must be added to the gauge height (0.073 m, prior to 1988). The measurement section at Mission has degraded by about 0.5 m since 1965 as shown in the specific gauge plot in Figure 3.3. In recent years, relatively few flow measurements were obtained for flows exceeding 6,000 m3/s, relevant to flood conditions. During the 1990’s a total of 10 such measurements were collected, dropping to 3 for the period 2000 to 2006.
The data collected in 2007, along with other recent measurements were invaluable for updating the rating curve. The 10 flow measurements (Table 3.1) collected in 2007 consistently deviated by 5% or more from the previous stage-discharge curve and following the freshet, WSC provided a new curve. All rating curves used for the gauge are plotted in Figure 3.4. The 2007 time-series flows, developed based on the latest curve, are listed in Table 3.2.
The gauge section is likely to continue to degrade and obtaining regular flow measurements to keep the stage-discharge rating curve up to date is essential. The maximum flow recorded at Mission was 13,650 m3/s (in 1972). The upper end of the rating curve agrees with model results and assumes flow is confined by dikes. Additional flow measurements along the upper end of the curve would be very useful.
3.3 FLOW SPLIT DATA
Flow split measurements were obtained to validate the lower model’s ability to correctly distribute flows at major islands. The measurements, conducted by PWGSC, are summarized in Table 3.3 and were collected at:
• Douglas Island (6 locations)
• Trifurcation (4 locations)

nhc
Fraser River Hydraulic Model Update Final Report 11
• Ladner (3 locations)
• Steveston (4 locations)
• North Arm (3 locations)
Several transects were obtained at each location. The ADCP measurements in the lower reaches of the river are very sensitive to tidal levels; the river flow near the ocean is rapidly varying as the tide rises and falls. Based on model runs, measurements were timed for periods when the least flow variation was expected for a particular location. Generally, repeat measurements gave similar answers, implying good accuracy.
3.4 ADOPTED FRESHET DISCHARGES
Time series flows for the 2007 freshet were developed based on the revised rating curves for Hope and Mission. Figure 3.5 compares unadjusted and adjusted hydrographs. With the adjusted hydrographs, the sum of flows upstream of Mission more closely equal flows at Mission. There are still some deviations, particularly peak flows at Mission appear to be truncated compared to the sum of upstream flows. This may be due to physical changes, such as flow going into storage or inaccurately estimated local inflows. The flow measurements are included in Figure 3.5 and deviate slightly from the hydrographs. During future flood forecasting projects, when the upper and lower models are operated as a single model, it will be necessary to compare reported and modelled flows at Mission. For accurate flood level predictions it may be necessary to adjust model flows at Mission.
The sparse flow data collected from 1999 to 2006 at Hope and Mission make it difficult to determine when the revised rating curves should be applied. Hydrographs for the 2002 and 1999 floods were also plotted based on the unadjusted and adjusted rating curves (Figures 3.6 and 3.7). The fit was considerably better with the adjusted curves and the decision was made to use the revised rating curves to determine flows for the 2002 and 1999 floods. Table 3.4 summarizes peak model inflows for 1999, 2002, 2007 and design conditions.
3.5 BATHYMETRIC SURVEYS
The specific gauge analyses showed that the channel at Mission has continuously degraded since 1965 and that the channel at Hope has aggraded in recent years. Channel surveys were reviewed to see if channel cross-sections would confirm these changes.
Current metering notes were reviewed for Hope from 1917 to 1982 as shown in Figure 3.8. Portions of the section has scoured or built up by over 3 m but systematic trends were not detected. Even during a single freshet, significant changes take place. A separate plot was produced using BC Ministry of Transport (MOT) bridge soundings from 1983 to 2001 at a section 30 m upstream of the bridge as shown in Figure 3.9. Again, large fluctuations occurred in the bed, but aggradation/degradation trends were not detected.

nhc
Fraser River Hydraulic Model Update Final Report 12
Systematic bed lowering over the last 40 years has been documented in the reach between Mission and New Westminster (nhc, 2006). Large bed level variations occur at the Mission gauge during the freshet, with the channel scouring by up to 5 m and then rapidly infilling. This is not surprising considering the large sand-dunes that move through the reach. The irregular bed shifts make it difficult to detect longterm changes at this site. Also an extensive riprap apron has been placed under the Mission Bridge to arrest scour.
BC Ministry of Transportation conducted surveys at several major Fraser River bridge crossings in the summer of 2007. The bathymetric data was compared to the 2005 cross-sections used in the MIKE11 model. Cross-sections were extracted from the survey data as close to the MIKE11 sections as possible, however, there was not suitable data available for comparison in all cases. Plots of the crossing sites are shown in Figures 3.10 through 3.14. For the most part, there is little change observed between the 2007 and 2005 sections. River depths and areas are very similar for the Oak Street, Knight Street, Queensborough and Port Mann bridges. The Mission Road bridge comparison shows a slight aggradation upstream and degradation downstream of the structure. It was not possible to locate the cross-section lines at the same location for the 2007 and 2005 data as the surveys were taken on slightly different lines, and some of the observed bed level shift may not be due to actual changes in bed level. Similarly, the exact location of the original MIKE11 cross-section at the Agassiz-Rosedale bridge site is not known and a direct comparison of bed levels could not be made.
nhc
Fraser River Hydraulic Model Update Final Report 13
4 MODEL RECALIBRATION AND UPDATES Model calibration involves adjusting channel/overbank roughness coefficients until modelled and observed water levels agree for a particular flood event with a known flow. If an incorrect flow is used for calibration the model will not be representative. If the flow used for calibration is less than the actual flow, as was shown to be the case at Mission, model roughness coefficients will be too high. On the other hand, if the flow used for calibration is higher than the actual flow, as was seen at Hope, the coefficients will be too low. The coefficients in turn affect the computed profiles, if coefficients are too high the profile will also be too high and vice versa.
The WSC flow revisions meant that both the lower and the upper models had to be recalibrated. The extensive water level and flow data collected in 2007 allowed for much more detailed calibrations than those performed previously. Undertaking this work also offered an opportunity to make the upper model more compatible with the lower model.
For recalibration, the lower and upper models were initially worked on separately and were then combined into a single model. During future flood forecasting, runs can be made using the single model, simplifying the forecasting procedure. Using the recalibrated model, a revised design profile was calculated for the reach from Laidlaw to Strait of Georgia as described in Section 5.
4.1 LOWER MODEL
As outlined by nhc (2006), separate freshet and winter models were developed for the lower model reach. The winter model was insensitive to river flows and a recalibration of the winter model was not necessary.
4.1.1 MODEL UPDATES
The lower model was initially calibrated and validated to flows reported by WSC for the Mission gauge using data from 2002, 1999 and 1997. Model recalibration was performed using the 2007 data and the re-validation using 2002 data. The new Mission rating curve increased the 2007 peak flow from 11,000 m3/s to 11,800 m3/s or by 7% (Table 3.4). The 2002 flow was increased from 11,000 m3/s to 11,900 m3/s or by 8%. Tributary inflows at the Stave, Alouette and Coquitlam Rivers were based on recorded values. The tributary inflow to Pitt Lake was estimated based on regional hydrology and remain unchanged from the original calibration.
Tide levels form the downstream boundary condition for the model. For 2007, tide levels were based on observed values at Point Atkinson as recorded by the Canadian Hydrographic Service. The 2002 tide levels were previously provided by Triton Consultants as described in nhc (2006).

nhc
Fraser River Hydraulic Model Update Final Report 14
Unlike the upper model, no physical modifications to the model network were necessary. However, to remove any tidal influence on the inflow boundary, the network was extended upstream to the Vedder Canal confluence. A schematic of the model is shown in Map 2.
4.1.2 MODEL CALIBRATION (2007)
Results for the calibration of the 2007 freshet are listed in Table 4.1. The agreement with the recorded peak levels is generally within the target accuracy of ± 0.10 m, with an average absolute error of 0.05 m. Plots of observed and modelled water levels are provided in Appendix B.
Not all gauges were used in the calibration as some data was suspect. Data from the Matsqui gauge consistently showed a water level greater than the Mission gauge even though it is downstream of Mission, and was therefore not included in the analysis. The City of Abbotsford is investigating this anomaly. The Nelson Road gauge data did not show complete troughs over the tidal cycle as the gauge was unable to read below a particular water level. However, the gauge reported good data for peak water levels and was included in the calibration.
Tidal trough values were not as well matched as tidal peaks but since the main purpose of the model was to simulate peak levels, the calibration was considered sufficiently accurate. The average absolute trough error was 0.11 m.
Original and revised Manning’s roughness coefficients at key cross-sections are compared in Table 4.2. Within the ocean, where river flow is partly over salt water, n-values of 0.015 were used. Roughness coefficients downstream of New Westminster did not require adjustment. Side-channel coefficients were generally unchanged. Between New Westminster and Mission, roughness coefficients were reduced from the 0.030 to 0.033 range to 0.028 as a result of additional water level information collected in 2007 and the adjustments to inflow at Mission. Final coefficients ranged from 0.028 to 0.033 in the mainstem and were higher in the side channels, up to 0.035. MIKE11 interpolates linearly between upstream and downstream roughness coefficients for intervening cross-sections.
For cross-sections downstream of Port Mann, the relative roughness coefficient was varied from 1.0 at peak tide to 0.75 at low tide to better match the water levels during the tidal troughs. Overbank roughness coefficients estimated from air-photography ranged from about 0.08 to 0.10.
Modelled and measured flow splits were also compared (Table 4.3). In general, there is excellent agreement between the observed and modelled flows. Exceptions are the split between the North and Middle Arms and Canoe Pass. Both locations are within the tidal reach and strongly influenced by ocean conditions. Water levels and flows are rapidly varying in this area, and ADCP flow measurements are very sensitive to the time they are taken. Based on channel cross-section areas and flow conveyance, modelled flows seem more representative than the observed splits.

nhc
Fraser River Hydraulic Model Update Final Report 15
4.1.3 MODEL VALIDATION (2002)
The model was validated using water levels recorded during the 2002 freshet. Good agreement was found between the observed and modelled values as shown in Table 4.1 and Appendix B. The average absolute error for peak water levels in 2002 is 0.07 m, and most values fall well within the target range of ±0.10 m. The agreement was slightly better than what was achieved in 2006. Some gauge results had to be discounted from the analysis. These included Manson and Bath Slough, which in 2007 was found to have sunk up to 0.17 m from the previously surveyed datum; the actual height of the gauges in 2002 is not known.
The 2002 flow split comparison was repeated and found to give very similar results to those reported in 2006 (Table 4.3).
4.1.4 ASSESSMENT OF RESULTS
The model calibration and validation results show that the accuracy of the water level predictions are well within target values and that the model meets or exceeds the standards set for floodplain mapping studies. However, the calibration and validation flows are much lower than the design flood condition and the model should be reassessed and refined if higher flows are experienced.
nhc (2006) presented a graph relating roughness coefficients to discharge. Based on the historic model calibration of the 1950 and 1948 floods, the Douglas Island to Mission reach had a roughness coefficient of 0.028 at an estimated Mission flow of 14,530 m3/s and a coefficient of 0.027 at an estimated flow of 15,840 m3/s. This diagram was updated as shown in Figure 4.1 to include the revised roughness coefficients. A constant coefficient of 0.028 is valid for flows up to 14,530 m3/s and only a slight reduction occurs at higher flows. The design flow is 20% higher than the 1948 flood and it is not known if roughness values will reduce further at flows exceeding the 1948 flood of 15,840 m3/s. There is no basis for assuming a further reduction and the coefficient previously used for the design flood (0.027) was maintained.
Recent research has been carried out for estimating channel roughness coefficients based on ADCP velocity measurements. During the 2007 freshet nhc carried out a number of field measurements of current velocity and discharge with an ADCP at the Mission gauge. Surveys of dune geometry were also made to assess the relation between bedform characteristics and channel roughness. The analysis is described in Appendix C. WSC’s ADCP discharge measurements from 2007 were also reviewed to see if the information could be used for estimating roughness. However, it was found that the instrument settings varied between the WSC and nhc equipment and the WSC results are not directly comparable. The Manning’s roughness coefficient at the Mission gauge site determined from the ADCP data (based on nhc data) was 0.031. The model calibration results indicated the average channel roughness in the Mission reach was slightly lower (0.028). The direct model calibration results are considered to be more accurate and more representative of reach-average

nhc
Fraser River Hydraulic Model Update Final Report 16
conditions. The results of the ADCP analysis however are promising and suggest that it may be possible to use this approach to supplement other calibration techniques.
4.2 UPPER MODEL
4.2.1 ORIGINAL MODEL LIMITATIONS AND MODEL UPDATES
During the flood forecasting project it was found that the 2001 upper model was not entirely compatible with the lower model. It was also found to have some limitations that affected its use for real-time forecasting. The changes made to the model are outlined below and summarised in Figure 4.2. Map No. 3 shows the model extents, cross-section locations and significant structures.
1. The original upper model was designed to run using the “diffusive wave” algorithm, where as the lower model uses the “high order fully dynamic” algorithm. As described by nhc (2006) the dynamic method is more accurate and is essential for tidally affected and backwatered reaches. When the upper model was first run in fully dynamic mode minor instabilities occurred. By reducing the time step and introducing some of the other modifications described below, the instabilities were minimized and the model can now be run in fully dynamic mode.
2. The original upper model used very high roughness coefficients to account for losses other than friction, such as bend and contraction losses, which may not be representative at flows outside the calibration range. To rectify this, specific hydraulic energy losses were introduced in the model at significant contractions, expansions and bends in the Harrison River and in the Fraser mainstem near the mouth of the Harrison River. These losses were input as a coefficient, k, in the network file and were then applied to the energy equation: gVkh 22=Δ . The loss coefficients were originally calculated based on standard losses for given bend, contraction and expansion angles and then adjusted based on model calibration. Energy losses applied in this fashion provide valid losses throughout the modelled flow range.
3. The bed topography in the original cross-section geometry had a highly irregular jagged surface, likely a result of the digital elevation model used to develop the cross-sections. This lead to exaggeration of the wetted perimeter, affecting calibrated roughness coefficients and energy loss calculations. All of the cross-sections in the mainstem and many of the cross-sections in the major side-channels were smoothed such that the flow area remained the same while the perimeter was reduced. This was accomplished using a simple smoothing algorithm coded in visual basic.
4. The upper model uses a complex branched network to describe flow over braided gravel bars, and therefore there are numerous junctions. In some reaches the network was simplified to reduce the number of junctions, which have higher hydraulic losses in the model than would likely be observed. Given the one dimensional nature of the

nhc
Fraser River Hydraulic Model Update Final Report 17
model, it is necessary to treat the gravel reach as a series of connected channels. By limiting the number of junctions, unrealistic hydraulic losses were reduced.
5. The original model boundary was at the outlet of Harrison Lake, which is affected by backwater at high Fraser River flows. Outflows from the lake are difficult to establish, especially in real-time for flood level forecasting, and the model was extended to the upstream end of Harrison Lake. The addition of the lake means that the model will route flows through the lake based on available storage and backwater from the Fraser River. However, the model used for calibration, validation and to establish design water levels does not include the lake as there are no reliable lake inflow estimates available. It would be advisable to run the RFC Harrison River hydrologic model and the MIKE11 model in tandem to ensure that the models are mutually compatible and jointly correctly calibrated.
6. In the spring of 2007, nhc conducted a field assessment of the gauges to be read during the freshet. Some gauge location links were refined in the model.
7. Water levels at the downstream boundary condition were adjusted to reflect the changes to the Mission rating curve. For the design profile and associated sensitivity runs, the updated lower model water levels formed the downstream boundary condition.
8. Inflows at the upstream boundary were updated to reflect the adjustments to the rating curve at Hope.
The upper model was initially developed, calibrated and validated to flows reported by WSC for the Mission gauge using data from 1999 and 1997. As a result of the changes listed above, The upper model was recalibrated to the 1999 flood as this was the closest high flow year to when the bathymetric data was collected. Model revalidation was performed using the 2007 data. The new Hope rating curve only marginally reduced the 1999 or 2007 peak flows, where as lesser flows were more significantly affected. Complete inflows for the calibration run are presented in Table 3.1.
Tributary inflows for both 1999 and 2007 are based on a combination of reported flows (Chilliwack River, Chehalis River), estimated flows (Silverhope Creek, Ruby and Wahleach Creeks, Norrish Creek and Sumas River), and backwater adjusted flows (Harrison River). Reported flows are from WSC, estimated flows are based on reported flows and relative drainage areas of the tributaries. The adjusted Harrison River inflow estimates are based on WSC’s spreadsheet that account for the backwater from the Fraser River. All tributary flows were daily flow averages and spanned a six week period around the peak Fraser River flow.
The roughness values for most reaches changed significantly. The upper model calibration and validation were more involved than for the lower model. This was due in part to the calibration of the hydraulic loss coefficients in addition to the calibration of roughness coefficients. The model was calibrated and validated using a network that did not include Harrison Lake, as flow input to the upstream end of the Lake for 1999 and 2007 are not known. Harrison Lake was added to the model once calibration of roughness and energy losses was complete.

nhc
Fraser River Hydraulic Model Update Final Report 18
While completing network mapping in GIS, it became clear that the MIKE11 network file created by UMA did not exactly match the cross-section locations shown in the CAD drawings and reporting for the 2001 model. The reasons for these adjusted locations are not known, and therefore for the current model the cross-sections are assumed to be where they are shown in the MIKE11 network file.
4.2.2 MODEL CALIBRATION(1999)
Results for the recalibration for the 1999 freshet are listed in Table 4.4. The agreement with the recorded peak levels is generally within the target accuracy of ± 0.10 m, with an average absolute error of 0.05 m. Plots of observed and modelled water levels are provided in Appendix D. For the most part, observed and modelled water levels are in good agreement over the five days around the freshet peak. The exceptions include the gauges near the Agassiz-Rosedale Bridge, where there are three gauges in close proximity (Agassiz Bridge South, Agassiz Bridge North and Chip Intake) that have significantly different recorded water levels. This may be due to two dimensional hydraulic conditions such as super-elevation at the bend upstream of Agassiz Bridge, or possibly to errors in the gauge readings. The model was calibrated to minimise the average absolute error at all three sites; the model under-predicts water levels at the Chip Intake gauge by 0.13 m, over-predicts water levels at the Agassiz-Rosedale Bridge North gauge by 0.14 m and is within 0.01 m of the Agassiz-Rosedale Bridge South gauge.
Estimated Manning’s roughness coefficients are presented in Table 4.5. MIKE11 interpolates linearly between upstream and downstream roughness coefficients for intervening cross-sections. Roughness values for the gravel reach were based on theoretical values before being slightly modified during the calibration process; main channel sections were assigned a Manning’s roughness value of 0.030, side-channels a value of 0.035, unvegetated gravel bars a value of 0.035, agricultural floodplain areas a value of 0.040 and well vegetated overbank areas a value of 0.060. Calibrated Manning’s roughness coefficients lie within the original theoretical bounds of 0.030 to 0.060 as shown in Table 4.5.
Hydraulic loss coefficients in the Harrison River and at Harrison bend were adjusted during the calibration process. Initial loss coefficients were based on theoretical values; the final coefficients were based on slight adjustments to the theoretical values as a result of calibration.
4.2.3 MODEL VALIDATION (2007)
Following calibration, the model was validated using water levels recorded during the 2007 freshet. Good agreement was found between the observed and modelled values as shown in Table 4.4 and Appendix D. The average absolute error for peak water levels in 2007 is 0.08 m, and most values fall well within the target range of ±0.10 m. Some gauges (Bell Dam, Seabird Island and Wahleach Powerhouse) were not included in the validation due to irregularities and suspect data. The validation shows generally good results, though water levels on the Fraser River mainstem between Harrison River and Agassiz-Rosedale Bridge

nhc
Fraser River Hydraulic Model Update Final Report 19
show over-prediction of water levels. This may in part be due to changes to the river morphology in this complex reach since the river was surveyed in 1999 or to inflow estimates.
4.2.4 ASSESSMENT OF RESULTS
The results from the calibration and validation show that the upper model is an excellent tool for computing water levels. The accuracy of the water level predictions are well within target values and the model meets typical standards set for floodplain mapping. However, the calibration and validation flows are much lower than the design flood condition. Also, the bathymetry used to build the upper model is almost ten years old. The gravel reach is subject to significant changes, especially during high flow years. The model should be reassessed and refined if higher flows are experienced or if significant bathymetric changes are identified. Extending the model to Hope would provide valuable information for fine-tuning the upper end of the Hope rating curve.
4.3 MERGED MODEL
The upper and lower Fraser River models were joined together to provide a single model of the entire reach of the river from Hope to the Strait of Georgia. This simplifies running the model, particularly for flood forecasting. Also, for flood level forecasting, Harrison Lake was included in the model so that RFC predicted lake inflows can directly be used as model input rather than lake outflows.
4.3.1 INCLUSION OF HARRISON LAKE
Harrison Lake, with a surface area of 255 km2, provides a significant storage volume. In the first instance, Harrison Lake was added to the upper model only. This allowed for verification of the lake routing. Once the upper model was shown to accurately route flows through the Lake, Harrison Lake was added to the merged model.
Lake geometry was digitised from 1951 charts (International Pacific Salmon Fisheries Commission), the most recent readily available data, at 3 km intervals. The lake bathymetry is not expected to have changed greatly over the 60 years since this data was collected. The data was included as additional cross-sections in the XNS11 file. The network file was also edited to include the lake.
The lake routing was validated using 2007 data. Recorded lake inflow data was not available and a simple hydrologic model was applied to the observed data on the Lillooet River near Pemberton (08MG005) to estimate inflows. The boundary file was edited to input flow at the top end of the lake, and the model was run for the two weeks surrounding the 2007 freshet peak. Water levels on the lake were compared to observed levels, and the single observed flow measurement was compared to modelled flows. Figure 4.3 shows a comparison of observed and modelled data for Harrison River and Lake. The validation for the lake is not

nhc
Fraser River Hydraulic Model Update Final Report 20
nearly as good as for the remainder of the model. This is primarily due to the limited observed data, in particular the estimated flows upstream of the lake. When the model is used for forecasting, the RFC is able to provide estimates at the lake inlet using a WARNS hydrologic model.
The lake outlet has a relatively small outlet capacity, especially when the Harrison River is backwatered by the Fraser and it takes time for the model to adjust if the initial conditions are incorrect. It is important that consideration of the initial lake elevation is taken, especially when running the model in real-time.
4.3.2 MODEL MERGING METHODOLOGY
The DOS tool “pfs.MERGE” was used to join the upper and lower models but some editing of the combined network and hydrodynamic parameter files was required. Where the two models overlap between Vedder Canal and Mission, the upstream model was used, as this model was calibrated in detail to observed water levels in this reach.
4.3.3 MODEL VALIDATION (2007)
To ensure that the merged model functions correctly, it was validated to the 2007 event. The model input was the same as that used for the lower and upper models, except that input to the Harrison system was based on flow estimates at the inlet of Harrison Lake rather than reported flows on the Harrison River. The Lillooet River flow estimation method is described above.
Good agreement was found between the observed and modelled values as shown in Table 4.6. As expected, the values are near identical to the water levels calculated with the two individual models. The average absolute error for peak water levels in 2007 is 0.08 m, and most values fall well within the target range of ±0.10 m. As before, some gauges were not included in the validation due to irregularities and suspect data collection.
nhc
Fraser River Hydraulic Model Update Final Report 21
5 DESIGN FLOOD PROFILE
5.1 LOWER MODEL
5.1.1 MODEL CONDITIONS
Following successful model calibration and validation, the model boundary conditions were set to design values. As specified in the original terms of reference, and as per the 2006 model development, a design inflow of 18,900 m3/s was used at the upstream end of the model, corresponding to a discharge of 17,000 m3/s at Hope (estimated to have occurred in 1894), plus local inflows between Hope and Mission. A summary of inflows for the design flood is presented in Table 3.1.
During the Fraser River freshet, high tide levels are common (since large tides occur in June around the time of the peak freshet) but storm surges are minimal. At the four outlet arms, the 2002 calibration tide levels were used as the downstream boundary condition (maximum tide at Point Atkinson of 1.84 m GSC). The levels roughly correspond to a two-year return period summer high tide (no surge). Since winter flood conditions exceed freshet levels for the lower 28 km, an in-depth analysis of summer tides was not carried out.
For the Douglas Island–Mission reach, the roughness value derived from calibration of the historic high-flow model was used. Some adjustments had to be made to the calibrated model to accommodate the design flow. All standard, non-standard and other types of dikes including railroad and highway embankments were extended vertically in the model to stop flow spillage onto the floodplain. This was based on the assumption that dikes presently not high enough will be raised to prevent flooding in the future and is in keeping with MOE guidelines for floodplain mapping studies. However, unprotected floodplain areas, as covered by cross-section lines on Map No. 2, were included as actively conveying flow.
5.1.2 SIMULATION RESULTS
The water level at Mission was found to be 8.9 m GSC or 1.0 m higher than the design water level computed in 1969, which was equal to the observed 1894 level. The design profile is plotted in Drawing No. 1 and tabulated in Table 5.1. Also listed in the table are the design level increases compared to the 1894 profile calculated in 1969, and compared to the design level calculated in 2006 using the original MIKE11 model. Explanations for the difference in flood profiles between the 1969 and 2007 profiles are found in the 2006 report, and include changes to the river geometry, the introduction of dikes into the model and the loss of floodplain storage.
The updated design profile remains virtually unchanged from the profile developed by nhc in 2006 as shown in Table 5.1 and Figure 5.1. There has been a minor lowering of the profile from just below the trifurcation to Douglas Island. This is a result of the fine-tuning of the

nhc
Fraser River Hydraulic Model Update Final Report 22
calibration using the very comprehensive 2007 data set. Water surface profiles are shown in plan on Map 4.
Flow levels at the bridges were reviewed and only one bridge, Jacob-Haldi at McMillan Island was subject to pressure flow, with water touching the bridge deck but not overflowing it. Computed flow split percentages at the design flow were nearly the same as for the calibration/validation flows.
5.1.3 SENSITIVITY RUNS
In order to assess the sensitivity of the model to changes in inflows, ocean levels and roughness a series of sensitivity analyses were undertaken for the original model (nhc, 2006). For completeness these analyses were repeated for the updated model as summarised in Appendix E.
5.2 UPPER MODEL
5.2.1 MODEL CONDITIONS
Following successful model calibration and validation, the model boundary conditions were set to design values. A design inflow of 17,000 m3/s at Hope was used with a flow of 1,300 m3/s at Harrison Lake outlet. Tributary design inflows from several tributaries were based on peak flow ratios as summarized in Table 3.1. The downstream boundary condition at Mission was based on modelled water levels for the lower model with a peak water level of 8.9 m GSC.
Roughness coefficients in gravel-bed rivers do not typically vary with flow and the coefficients derived from the 1999 model calibration were used for the design profile. During the design flood, large gravel bar shifts are likely to occur, resulting in some profile variations. It is not possible to predict these variations and instead careful consideration should be given to specifying an adequate freeboard allowance.
Similar adjustments were made to the upper model as to the lower model to convey the design flow.
5.2.2 SIMULATION RESULTS
The design profile is plotted in Drawing No. 2 and tabulated in Table 5.2. A comparison is provided with the design profiles derived in 2006 in Figure 5.2. The water surface profile is shown in plan on Map 5.
A comparison of the updated profile and the profile prepared by nhc in 2006 shows relatively minor changes considering the extensive modifications made to the model. Results are generally within + 0.2 m and the maximum difference is an increase 0.32 m at Maria Slough.

nhc
Fraser River Hydraulic Model Update Final Report 23
There is a significant difference between the UMA 2001 profiles and the updated profiles in the reach between Mission and the Harrison River confluence. This is due to the backwater effects from further downstream. The updated downstream boundary level at Mission is 0.9 m higher than the value used by UMA in 2001. The change in the water level at Mission affects the design profile for a significant distance upstream due to the relatively gradual slope of the channel which creates a significant backwater effect. This change is apparent to just upstream of the confluence of the Harrison and Fraser Rivers.
There is very little difference between the updated flood profiles, the UMA 2001 profile and the original 1969 design flood profile upstream of the Agassiz-Rosedale Bridge.
5.2.3 SENSITIVITY RUNS
The upper model was tested for sensitivity to inflows, the Mission water level and roughness. Tabular and graphical results of the sensitivity modelling are presented in Appendix F.
5.3 MODEL LIMITATIONS
The accuracy of the predicted flood levels is limited by several factors including:
The reliability and accuracy of flow data for calibrating and verifying the models. The range of flow conditions the model has been calibrated to. When the design
discharge is significantly higher than the calibration flows, assumptions must be made on the hydraulic roughness. In the case of the Fraser River, the design flood is about 60% greater than the calibration flows used in 2007.
Topographic changes that occur in the channel and on the floodplain over time in response to degradation/aggradation, new infrastructure such as bridges or dikes etc.
Changes in flow confinement due to breaching of dikes or overbank spills. It should be recognized that the model assumes all existing dikes have been raised so that the flow is fully confined. If a breach occurs, the actual water level could be different from the water level predicted in the model.

nhc
Fraser River Hydraulic Model Update Final Report 24
6 FLOOD LEVEL FORECASTING MODEL In order to provide stakeholders with accurate real-time water levels during a freshet event, the model has been set-up to allow for flood level forecasting. The forecasting model is intended to be a “dynamic” model that is maintained by regular updates. The lower model was previously found to be relatively insensitive to bed changes unlike the upper model. The upper reach should be updated with new bathymetry at least every ten years, as previously recommended by UMA.
DHI is continuously updating and expanding the MIKE11 software. Older versions are not necessarily compatible with newer versions and the model should be kept up to date with newer software versions as they become available.
6.1 INPUT REQUIREMENTS
For present river conditions the model is directly useable and only the boundary conditions need to be edited when applying the model in flood forecasting mode. The model boundary conditions include inflow at Hope, numerous tributary inflows and ocean tide levels. Inflows at Hope and Harrison Lake can be based on predicted freshet flood hydrographs provided by the RFC. Design and calibration/validation flows (Table 3.1) as well as real-time reported flows can be used as a guideline to estimate tributary inflows for flood forecasting.
Predicted tide levels are available for Point Atkinson from published tide tables or from the web at: www.waterlevels.gc.ca. This data does not include water level increases due to local or surge conditions. Triton Consultants used a harmonic model to adjust Point Atkinson data to the four outlet arms. The adjustments were found to be quite minor, roughly 0.1 m or less, and therefore the Point Atkinson data can be directly applied to the four arms without significant loss in accuracy.
6.2 USER INSTRUCTIONS
Detailed user instructions are found in Appendix H of the 2006 nhc report, overview instructions are presented here.
The MIKE11 model is formed of four distinct input files, which are combined in a simulation file. The four input files contain information on the river network, cross-sections, boundary conditions and hydraulic parameters. When running the model in flood forecast mode, typically only the boundary condition file and associated time series file need to be revised. This editing can be accomplished through the simulation file. The simulation file also specifies the time period which needs to be adjusted for forecasting.
The boundary condition data should ideally be hourly, and the model run with a 2 second time-step. The period of modelling can span the entire freshet period or only a few days. The computational time for a two week period is roughly four hours. Generally the model

nhc
Fraser River Hydraulic Model Update Final Report 25
needs a run-up time of at least 6 hours (real-time) before computations are stabilised and the results reliable.
In the Douglas Island to Mission reach, channel roughness decreases from 0.028 to 0.027 in the 14,530 m3/s to 15,840 m3/s flow range. When forecasting flows in this range, the hydraulic parameter file must be altered. An input file, where roughness is automatically adjusted within the model based on average cross-section velocity, was prepared but is not supported by the current version of MIKE11. According to DHI, this file may be useable with future versions of the software.
6.3 SIMULATION RESULTS
Once the model has successfully run, the output can be viewed in MIKEView. MIKEView provides a number of options for viewing the output either as plotted profiles, or as tabulated water levels. Discharge and other hydraulic parameters can also be viewed. Peak flood levels, the timing of peaks, the length of time water levels exceed a certain value and other important information can be directly extracted from MIKEView.
Ideally, the model should be run in forecast mode for each freshet flood and the simulated profile compared with observed data following the flood. This would provide direct feed-back on the accuracy of the model and the need for new bathymetry. During high flows, exceeding the current calibration/validation flows of approximately 12,000 m3/s at Mission such comparisons are essential. To ensure that future comparisons are feasible, flow and water level gauges must remain operational.
The model is straightforward to run and operate. However, if given un-representative input, it will provide erroneous results. It is imperative that the model be operated by technically qualified persons only.
Considering the potential discrepancies between flows at Mission and the sum of upstream flows caused by future rating curve shifts, it is necessary to compare the modelled and reported flows at Mission. If modelled and reported flows show a consistent divergence, it may be necessary to adjust model flows.
6.4 LIMITATIONS
The limitations outlined in the model predictions in Section 5.3 also apply to the model when it is used as a flood forecasting tool. In addition, the model forecast predictions will be limited by the actual accuracy of the discharge forecasts issued by RFC. The accuracy of forecasted flows during the 2007 freshet was discussed in nhc (2007). According to RFC 12-24 hour forecasts are within +200 m3/s, 24-48 hour forecasts are within +300 m3/s and 48-96 hour forecasts within +5 to 7% for flows greater than 10,000 m3/s at Hope.

nhc
Fraser River Hydraulic Model Update Final Report 26
7 DIKE ASSESSMENT A comparison of dike crest elevations and the design profile was provided by nhc (2006). A set of 12 drawings were prepared based on information from MOE, municipalities and LiDAR surveys. In preparation of the 2007 freshet, a number of dikes were raised, including the dikes at Mission/Silverdale, Dewdney, Abbotsford, Chilliwack, Kent (D), Maple Ridge, Surrey, Pitt Meadows and Port Coquitlam. To reflect the updated design profile and raised dike crest profiles, the 2006 dike assessment was repeated. Dike information sources are summarized in Table 7.1.
In addition to the design profile, with and without a freeboard allowance of 0.6 m, the water surface profiles corresponding to Mission water levels of 6.0 m, 7.0 m and 8.0 m were added to the drawings. These three additional profiles assume a reoccurrence of the recorded maximum June tide, which occurred in 1982 and had a peak water level of 1.95 m GSC at Point Atkinson.
To facilitate future easy updating of the dike information, the dike and river station information was combined in a GIS database. The dike assessment methodology and a qualitative discussion of the dikes is included in this section.
7.1 METHODOLOGY
The GIS data base included the following information:
• Dike locations and station features supplied by MOE.
• Model reach centrelines exported from the MIKE11 upper and lower models, including reach names.
• Model cross-section information exported from the MIKE11 upper and lower models, including reach names, river stationing, and water levels.
• Model cross-section lines derived from input data that was used to build the MIKE11 models.
Model cross-section information was converted to point data along the model reach centrelines based on river stationing. A spatial join was then used to attribute the cross-section lines with model data. In order to determine water levels along the dikes, cross-sections were extended to intersect the dikes. A GIS technique called "linear referencing" was used to interpolate dike station values for model cross-section points along each dike. The result was a series of model water level values tied to station values along each dike. Dike station adjustments were necessary in some locations and dike elevations associated with a given dike station should be considered approximate. Updated dike drawings are shown in Drawings 3 to 18. Detailed crest surveys should be undertaken prior to any upgrade work.

nhc
Fraser River Hydraulic Model Update Final Report 27
7.2 ASSESSMENT RESULTS
A qualitative overview assessment of each dike was completed by comparing dike crest elevations with the design flood profile, with and without freeboard. In general, the dikes were found to have inadequate freeboard or to be at risk of overtopping during the design flood. Of the dikes reviewed, about 14% were found to have adequate freeboard over most of their length. By comparison, 49% had inadequate freeboard but crest elevations that generally exceeded the design flood level, where as 37% were found to be below the design flood level. Table 7.2 summarises the assessment.
When dikes are breached, water levels on the land side of the dikes may exceed those predicted by the model. UMA(2000) described modelling undertaken assuming a breach of the railway embankment at Seabird Island. This work along with other previous studies was reviewed as summarised in the memorandum included in Appendix G. Under certain conditions, water levels just upstream of the railway bridge across Maria Slough could conceivably be higher than those on the river side of the railway. The same situation may arise at other locations, where dikes trap flood waters, increasing water levels beyond those indicated by the design profile.
nhc
Fraser River Hydraulic Model Update Final Report 28
8 WATER LEVEL REFERENCE TABLES At the request of MOE and participating municipalities, water level reference tables were generated relating local water levels to the water level at Mission gauge. The tables show expected water levels at key locations along the river given Mission gauge readings of between 6 and 9 m, in 0.5 m increments. The tables are presented in Appendix H. The development of the tables involved numerous runs of both the lower and upper models. The initial request was for flood profiles corresponding to the 100, 50 and 25-year floods. However, since a frequency analysis of Fraser River flows has not been completed, MOE advised using the range of water levels at Mission.
8.1 LOWER MODEL
For the lower model the process began by estimating inflows at Mission that would correspond to gauge readings of 6.0, 6.5, 7.0, 7.5, 8.0, 8.5 and 9.0 m at Mission using the updated rating curve. The historic highest tide for May-June, with a complete hourly dataset at Point Atkinson, was 1.95 m GSC recorded on June 24th, 1982. The model was then run using this dataset as the downstream boundary condition and the tributary inflows from the 2002 validation model. An iterative process was followed, where the inflow at Mission was adjusted slightly until the maximum recorded water level was found to match the required level. Once this was achieved, minimum and maximum water levels were reported in tabular form for municipal boundaries and gauge sites.
The reference tables generated do not replace real-time flood level forecasting. Water levels in the sand-bed reach are strongly influenced by ocean levels. The reference tables were generated for the historic highest tide condition, and do not represent typical freshet conditions. Actual water levels may be lower or may exceed those tabulated. The reference tables should be used for guidance only and do not replace real-time forecasting.
8.2 UPPER MODEL
The development of the reference tables for the upper model reach was simpler than for the lower reach. The downstream boundary condition at Mission was set to the desired water level, and inflows at Hope, Harrison and tributaries were calculated as a function of total flow at Mission (from the lower model) and flow contributions for the calibration/validation and design runs. Table 8.1 shows tributary inflows for each Mission water level scenario. Maximum water levels at municipal boundaries and gauge locations are presented in the reference tables in Appendix H. As for the lower model tables, actual water levels may vary. Computations are based on assumed tributary inflows that will vary with each freshet. The reference tables should be used for guidance only and do not replace real-time forecasting.

nhc
Fraser River Hydraulic Model Update Final Report 29
9 CONCLUSIONS AND RECOMMENDATIONS
9.1 CONCLUSIONS
1. Extensive hydrometric data was collected in 2007 in comparison to previous years. The data provided an excellent opportunity to validate the overall accuracy of the Fraser River model. The results from the 2007 freshet and the model recalibration confirm the key findings of the 2006 flood profile report. The design profile is virtually unchanged, and the key recommendations of the original report remain valid.
2. Models are only as good as the data available for model development, calibration and validation. At the outset of the recalibration project it was found that the discharge at Mission was systematically under-estimated over the last decade because of a shift in the WSC rating curve. Using the new corrected data required minor adjustments to model roughness for flows in the 5,000 m3/s to 14,500 m3/s range.
3. A number of modifications were made to the upper model to improve its accuracy and compatibility with the lower model. The new approach eliminated the need for unrealistic roughness values. The revised model can be run in the high order fully dynamic mode of MIKE11.
4. The two models (upper and lower) were successfully merged into a single model. The merged model was also extended to include Harrison Lake to better model the flow contribution from the Harrison system during freshet events. The new merged model provides a simple tool for flood forecasting along the whole length of the Lower Fraser River.
9.2 RECOMMENDATIONS
1. The updated flood profile should be adopted by MOE and local governments for upgrading dikes and land use planning purposes.
2. The merged model that includes Harrison Lake should be adopted for future flood forecasting operations. The RFC should be advised that for future flood level forecasting, Harrison Lake inflows rather than outflows are required. A joint test run of the RFC Harrison River WARNS model and the MIKE11 model should be undertaken to confirm that the models are mutually compatible.
3. The intensive, real-time water level data collection program that was launched in 2007 should be repeated during all future large flood events, with return periods of ten years or more.
4. The WSC needs resources to continue regular measurements of flow at Hope, Harrison Lake outlet and Mission during the freshet season to ensure that rating curves at these key sites are kept up to date. The focus needs to be on flows exceeding

nhc
Fraser River Hydraulic Model Update Final Report 30
5,000 m3/s at Hope and 6,000 m3/s at Mission. Real-time reported Harrison flows adjusted for Fraser River backwater would be very useful for both hydrologic and hydraulic forecast modelling. A + 5% error in the Mission flow at 12,000 m3/s translates to a discrepancy of + 0.2 m in computed water levels. For flood level forecasting it is very important that reported and predicted flows are as accurate as possible.
5. The model performance needs to regularly be assessed, particularly during floods that are appreciably larger than the calibration and validation flows. Over time, the model may need further updating as a result of changes to the river geometry or because the model is working beyond the flow range it was developed for.
6. The model should be extended to Hope gauge to provide confirmation of the upper end of the rating curve. Further extension to Alexandra Bridge may offer some confirmation of the 1894 flood magnitude, based on 1894 photography at the bridge.
7. Freeboard requirements, particularly in the gravel bed reach should be reviewed.
8. Higher flood levels than those modelled may occur during the design flood as a result of dike breaches and water ponding on the land side of the diking.
nhc
Fraser River Hydraulic Model Update Final Report 31
10 REFERENCES International Pacific Salmon Fisheries Commission 1951. Harrison Lake Bottom Contours.
Available at: http://srmapps.gov.bc.ca/apps/fidq/bath_images/pdf/00331401.pdf
Fraser River Board 1958. Preliminary Report on Flood Control and Hydro-Electric Power in the Fraser River Basin.
nhc 2006. Final report – Lower Fraser River Hydraulic Model. Report prepared for Fraser Basin Council, December 2006.
nhc 2007. Final report – Fraser River 2007 Freshet Flood Level Forecasting. Report prepared for BC Ministry of Environment, August 2007.
nhc 2007. Fraser River Hydraulic Model Recalibration, Review of Flows. Memo prepared for BC Ministry of Environment, Septemeber 20, 2007.
UMA Engineering Ltd. 2000. Fraser River Gravel Reach Hydraulic Modelling Study. Report prepared for City of Chilliwack, March 2000.
UMA Engineering Ltd. and Ward & Associates Ltd. 2001. Fraser and Harrison Rivers Hydrologic and Hydraulic Investigations. Report prepared for City of Chilliwack, January 2001.

TABLES
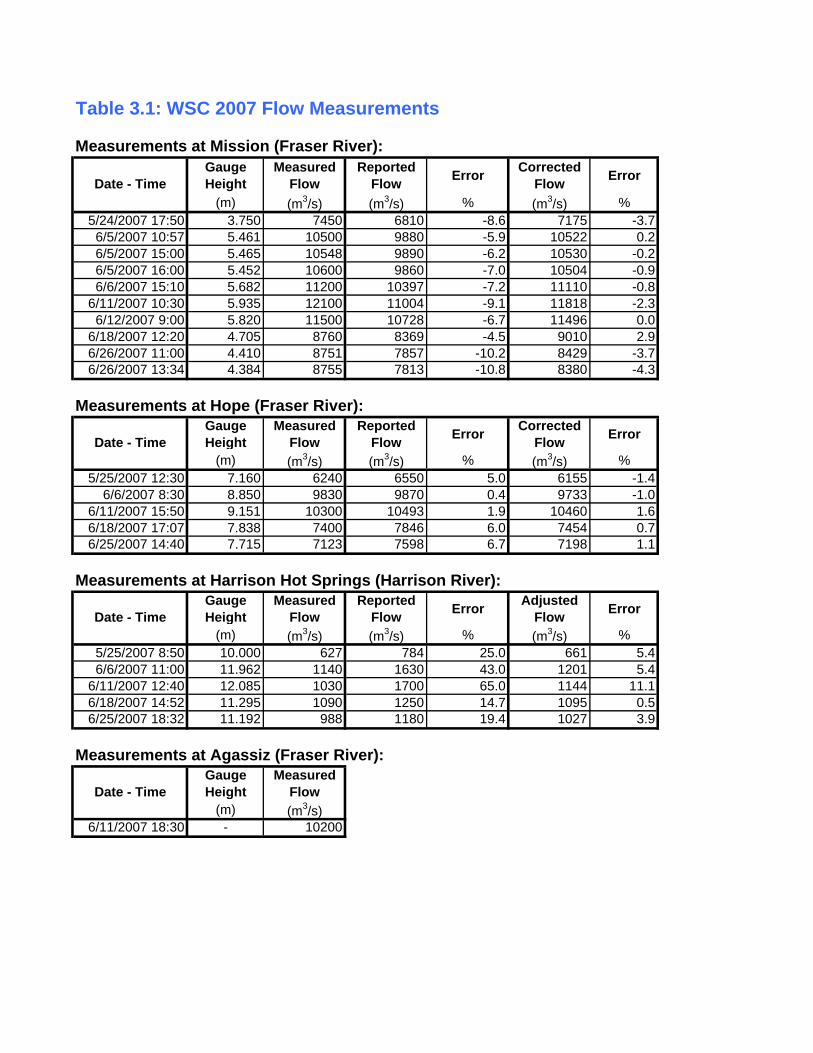
Table 3.1: WSC 2007 Flow Measurements
Measurements at Mission (Fraser River):Gauge Height
Measured Flow
Reported Flow Error Corrected
Flow Error
(m) (m3/s) (m3/s) % (m3/s) %5/24/2007 17:50 3.750 7450 6810 -8.6 7175 -3.7
6/5/2007 10:57 5.461 10500 9880 -5.9 10522 0.26/5/2007 15:00 5.465 10548 9890 -6.2 10530 -0.26/5/2007 16:00 5.452 10600 9860 -7.0 10504 -0.96/6/2007 15:10 5.682 11200 10397 -7.2 11110 -0.8
6/11/2007 10:30 5.935 12100 11004 -9.1 11818 -2.36/12/2007 9:00 5.820 11500 10728 -6.7 11496 0.0
6/18/2007 12:20 4.705 8760 8369 -4.5 9010 2.96/26/2007 11:00 4.410 8751 7857 -10.2 8429 -3.76/26/2007 13:34 4.384 8755 7813 -10.8 8380 -4.3
Measurements at Hope (Fraser River):Gauge Height
Measured Flow
Reported Flow Error Corrected
Flow Error
(m) (m3/s) (m3/s) % (m3/s) %5/25/2007 12:30 7.160 6240 6550 5.0 6155 -1.4
6/6/2007 8:30 8.850 9830 9870 0.4 9733 -1.06/11/2007 15:50 9.151 10300 10493 1.9 10460 1.66/18/2007 17:07 7.838 7400 7846 6.0 7454 0.76/25/2007 14:40 7.715 7123 7598 6.7 7198 1.1
Measurements at Harrison Hot Springs (Harrison River):Gauge Height
Measured Flow
Reported Flow Error Adjusted
Flow Error
(m) (m3/s) (m3/s) % (m3/s) %5/25/2007 8:50 10.000 627 784 25.0 661 5.46/6/2007 11:00 11.962 1140 1630 43.0 1201 5.4
6/11/2007 12:40 12.085 1030 1700 65.0 1144 11.16/18/2007 14:52 11.295 1090 1250 14.7 1095 0.56/25/2007 18:32 11.192 988 1180 19.4 1027 3.9
Measurements at Agassiz (Fraser River):Gauge Height
Measured Flow
(m) (m3/s)6/11/2007 18:30 - 10200
Date - Time
Date - Time
Date - Time
Date - Time

Table 3.2: 2007 Freshet Flow Time Series
Silverhope Harrison Chilliwack Chehalis Ruby+W Norrish Sumas Sum of Diff. of Diff. of Reported Corrected Measured Estimated Adjusted Reported Reported Estimated Estimated Estimated Cor.Inflows Reported Corrected Measured Reported Q's Corrected Q's
(m3/s) (m3/s) (m3/s) (m3/s) (m3/s) (m3/s) (m3/s) (m3/s) (m3/s) (m3/s) (m3/s) (m3/s) (m3/s) (m3/s) (m3/s) (m3/s)15-May 6080 5715 26 473 102 49 6 14 2 6387 6348 6544 404 -15816-May 6111 5744 31 513 122 49 6 14 3 6482 6399 6616 450 -13317-May 6126 5758 33 560 129 49 6 14 3 6553 6556 6830 365 -27718-May 6143 5774 30 599 119 49 6 14 3 6594 6571 6851 393 -25619-May 6369 5983 32 622 124 49 6 14 3 6832 6752 7096 467 -26420-May 6531 6131 30 637 117 49 6 14 3 6987 7013 7439 373 -45221-May 6593 6188 29 645 112 49 6 14 3 7045 7036 7467 414 -42222-May 6627 6220 27 637 104 49 6 14 2 7059 7003 7426 462 -36723-May 6703 6290 27 622 105 49 6 14 2 7116 6984 7402 544 -28624-May 6625 6219 27 631 106 49 6 14 2 7054 6976 7391 7450 484 -33725-May 6496 6100 6240 28 661 111 49 6 14 3 6973 6700 7026 669 -5326-May 6414 6023 30 695 117 49 6 14 3 6936 6550 6822 777 11427-May 6384 5996 32 706 126 49 6 14 3 6932 6487 6737 832 19528-May 6319 5936 31 738 120 49 6 14 3 6897 6428 6656 852 24129-May 6400 6011 29 748 113 49 6 14 3 6973 6431 6660 931 31330-May 6737 6322 33 742 130 49 6 14 3 7299 6690 7013 1024 28631-May 7102 6659 41 750 159 49 6 14 4 7681 7117 7570 1007 1111-Jun 7343 6901 36 817 177 40 7 11 2 7992 7445 7965 988 272-Jun 7677 7267 39 890 191 40 7 11 3 8446 7829 8398 1028 493-Jun 8197 7824 42 965 207 40 7 11 3 9100 8287 8919 1185 1814-Jun 8883 8587 54 1054 267 40 7 11 4 10024 8930 9610 1390 4145-Jun 9448 9224 53 1133 263 40 7 11 4 10736 9777 10433 10550 1182 3036-Jun 9909 9756 9830 45 1201 223 40 7 11 3 11287 10263 10954 11200 1176 3337-Jun 10333 10222 36 1273 177 40 7 11 2 11768 10617 11367 1262 4018-Jun 10646 10576 30 1236 149 40 7 11 2 12050 10739 11509 1382 5419-Jun 10840 10790 28 1171 140 40 7 11 2 12189 10885 11679 1354 51010-Jun 10891 10847 28 1121 139 40 7 11 2 12195 10981 11791 1259 40411-Jun 10659 10589 10300 28 1144 139 40 7 11 2 11960 11011 11826 12100 1019 13412-Jun 10118 9978 25 1179 123 40 7 11 2 11365 10624 11375 11500 881 -1013-Jun 9637 9450 23 1207 115 40 7 11 2 10855 10194 10873 848 -1814-Jun 9330 9085 23 1166 114 40 7 11 2 10448 9864 10507 830 -5915-Jun 8926 8635 23 1134 112 40 7 11 2 9962 9476 10148 778 -18616-Jun 8498 8158 24 1116 117 40 7 11 2 9474 9035 9715 779 -24017-Jun 8159 7770 27 1101 132 40 7 11 2 9090 8660 9326 819 -23718-Jun 7904 7506 7400 26 1095 127 40 7 11 2 8813 8357 8997 8760 855 -18419-Jun 7794 7395 24 1052 118 40 7 11 2 8649 8162 8779 886 -13020-Jun 7913 7523 26 1047 128 40 7 11 2 8783 8152 8767 1022 1721-Jun 8065 7676 28 1035 139 40 7 11 2 8938 8395 9039 931 -10122-Jun 8040 7676 27 1026 134 40 7 11 2 8924 8545 9206 742 -28223-Jun 7825 7428 25 1087 125 40 7 11 2 8725 8334 8972 787 -24724-Jun 7653 7242 24 1083 116 40 7 11 2 8525 8081 8684 855 -15925-Jun 7643 7229 7123 23 1027 113 40 7 11 2 8452 7992 8579 874 -12826-Jun 7624 7210 21 931 105 40 7 11 1 8326 7966 8551 8753 774 -22527-Jun 7508 7084 22 1066 106 40 7 11 1 8337 7908 8486 853 -14928-Jun 7276 6830 23 895 112 40 7 11 2 7919 7713 8269 652 -34929-Jun 7072 6632 24 987 117 40 7 11 2 7819 7588 8128 672 -30930-Jun 6966 6534 25 1032 125 40 7 11 2 7776 7460 7982 748 -207
Notes:1. Corrected Hope flows are based on rating curve developed from complete set of WSC measurements provided in December 2007. Modelling and Table 3.4 based on data provided to nhc in summer 2007.
Hope MissionDate

Table 3.2 Cont: 2002 Freshet Flow Time Series
Silverhope Harrison Chilliwack Chehalis Ruby+W Norrish Sumas Sum of Diff. of Diff. of Reported Corrected Measured Estimated Adjusted Reported Reported Estimated Estimated Estimated Cor.Inflows Reported Corrected Measured Reported Q's Corrected Q's
(m3/s) (m3/s) (m3/s) (m3/s) (m3/s) (m3/s) (m3/s) (m3/s) (m3/s) (m3/s) (m3/s) (m3/s) (m3/s) (m3/s) (m3/s) (m3/s)1-Jun 8530 8200 38 801 188 78 7 11 3 9326 8850 9526 806 -2002-Jun 8790 8484 38 780 187 75.5 7 11 3 9586 9080 9756 811 -1703-Jun 8720 8416 38 819 187 75 7 11 3 9555 9230 9906 630 -3514-Jun 8440 8098 38 892 187 80 7 11 3 9315 9210 9894 448 -5795-Jun 8260 7898 41 947 203 87 7 11 3 9197 9110 9792 449 -5956-Jun 8290 7931 43 1020 213 73 7 11 3 9301 9020 #N/A 640 #N/A7-Jun 8290 7936 36 1060 178 64 7 11 2 9294 8920 9594 729 -3008-Jun 8660 8344 30 995 149 66 7 11 2 9605 8900 9576 1020 299-Jun 9090 8818 28 884 136 64.5 7 11 2 9950 9140 9820 1082 130
10-Jun 8980 8700 30 870 147 70.3 7 11 2 9837 9350 10028 767 -19111-Jun 8510 8178 35 976 170 75.4 7 11 2 9454 9140 9816 9469 646 -36212-Jun 8220 7856 41 1040 200 84.9 7 11 3 9242 8900 9572 706 -33013-Jun 8360 8007 48 1070 238 94.9 7 11 3 9479 8990 9670 843 -19114-Jun 8760 8451 53 1100 262 97.4 7 11 4 9985 9390 10066 904 -8115-Jun 9140 8878 56 1160 276 91 7 11 4 10483 9870 10516 875 -3316-Jun 9440 9219 51 1230 253 79.2 7 11 3 10854 10200 10894 875 -4017-Jun 9660 9479 44 1250 215 67.2 7 11 3 11075 10400 11146 857 -7118-Jun 10000 9912 48 1220 237 75 7 11 3 11513 10800 11616 802 -10319-Jun 10200 10164 41 1190 203 69.6 7 11 3 11689 11000 11849 725 -16020-Jun 10400 10371 37 1150 183 58 7 11 3 11820 11000 11804 849 1621-Jun 10600 10552 39 1100 192 62.1 7 11 3 11966 11000 11860 1014 10622-Jun 10400 10300 43 1100 210 61.3 7 11 3 11735 11000 11863 835 -12823-Jun 9870 9729 42 1190 206 57.3 7 11 3 11245 10800 11527 586 -28224-Jun 9440 9217 39 1250 192 52.6 7 11 3 10771 10400 11093 11183 594 -32225-Jun 9580 9383 39 1260 192 50.1 7 11 3 10945 10100 10782 1042 16326-Jun 9860 9726 43 1220 210 52.1 7 11 3 11272 10100 10790 1306 48227-Jun 10100 9948 44 1200 215 57.1 7 11 3 11484 10400 11070 1237 41428-Jun 10200 10088 44 1260 216 74.6 7 11 3 11704 10600 11311 1216 39229-Jun 10100 9995 58 1340 283 82 7 11 4 11780 10900 11647 984 13330-Jun 10200 10157 46 1380 225 76.8 7 11 3 11906 10800 11619 1149 287
1-Jul 10100 9940 34 1340 193 65.8 4 5 3 11585 10600 11392 1144 1922-Jul 9840 9695 28 1270 163 49.8 4 5 2 11218 10300 11051 1062 1673-Jul 9620 9438 26 1190 147 40.2 4 5 2 10852 10100 10740 934 1124-Jul 9100 8831 23 1170 134 35.7 4 5 2 10205 9640 10304 834 -995-Jul 8490 8160 22 1150 124 33.3 4 5 2 9500 9020 9696 810 -1966-Jul 7890 7500 20 1120 118 30.3 4 5 2 8799 8330 8968 859 -1697-Jul 7330 6894 22 1080 126 31.2 4 5 2 8164 7820 8383 780 -2208-Jul 7030 6602 27 1020 155 39 4 5 2 7854 7540 8068 742 -2149-Jul 6670 6263 25 991 142 34.5 4 5 2 7466 7260 7739 613 -273
10-Jul 6540 6147 25 982 146 34.9 4 5 2 7347 6940 7348 799 -111-Jul 6440 6053 28 979 160 35.6 4 5 2 7266 6820 7183 834 8412-Jul 6510 6119 28 990 161 36 4 5 2 7346 6880 7264 856 8113-Jul 6620 6218 26 1000 152 34.8 4 5 2 7442 6900 7295 944 14714-Jul 6760 6344 25 1010 145 32.4 4 5 2 7568 6950 7356 1034 21215-Jul 6900 6474 23 1020 131 29.8 4 5 2 7688 7150 7610 964 78
Notes:1. Corrected Hope flows are based on rating curve developed from complete set of WSC measurements provided in December 2007. Modelling and Table 3.4 based on data provided to nhc in summer 2007.2. No water level recorded at Mission on June 6th, 2002.
Hope MissionDate

Table 3.2 Cont: 1999 Freshet Flow Time Series
Silverhope Harrison Chilliwack Chehalis Ruby+W Norrish Sumas Sum of Diff. of Diff. of Reported Corrected Measured Estimated Adjusted Reported Reported Estimated Estimated Estimated Cor.Inflows Reported Corrected Measured Reported Q's Corrected Q's
(m3/s) (m3/s) (m3/s) (m3/s) (m3/s) (m3/s) (m3/s) (m3/s) (m3/s) (m3/s) (m3/s) (m3/s) (m3/s) (m3/s) (m3/s) (m3/s)1-Jun 7580 7165 33 839 160 82 7 11 2 8298 8047 8640 667 -3422-Jun 7340 6906 29 873 142 72 7 11 2 8042 7897 8471 579 -4293-Jun 7290 6850 27 884 135 77 7 11 2 7993 7844 8416 589 -4234-Jun 7440 7010 30 832 149 82 7 11 2 8123 8045 8648 508 -5255-Jun 7630 7225 38 758 187 131 7 11 3 8360 8427 9084 338 -7246-Jun 7760 7360 35 816 173 98 7 11 2 8503 8637 9300 266 -7977-Jun 7740 7346 31 954 151 66 7 11 2 8568 8467 9116 495 -5488-Jun 7980 7594 27 937 134 61 7 11 2 8773 8554 9220 605 -4479-Jun 8470 8133 24 831 120 56 7 11 2 9184 8921 9606 600 -422
10-Jun 8620 8300 23 806 114 66 7 11 2 9329 8977 9654 672 -32511-Jun 8360 8009 23 841 112 70 7 11 2 9074 8703 9364 722 -29012-Jun 8040 7656 25 849 125 88 7 11 2 8763 8469 9116 678 -35313-Jun 7880 7490 33 857 163 106 7 11 2 8669 8465 9118 594 -44914-Jun 7880 7485 46 895 227 124 7 11 3 8799 8643 9314 550 -51515-Jun 8080 7698 59 969 292 142 7 11 4 9182 9044 9734 520 -55216-Jun 8800 8496 61 1100 299 144 7 11 4 10122 9642 10316 784 -19417-Jun 9360 9121 45 1220 223 110 7 11 3 10741 10194 10883 785 -14218-Jun 9750 9590 42 1300 207 97 7 11 3 11257 10603 11359 814 -10219-Jun 10200 10176 39 1290 194 85 7 11 3 11805 11004 11829 825 -2420-Jun 10500 10510 36 1240 177 72 7 11 2 12055 11364 12252 681 -19721-Jun 10700 10686 35 1200 174 69 7 11 2 12184 11498 12408 701 -22422-Jun 11000 10976 38 1160 186 77 7 11 3 12458 11602 12534 880 -7623-Jun 11000 11043 38 1140 186 76 7 11 3 12503 11700 12642 761 -13924-Jun 10800 10821 10626 39 1160 190 76 7 11 3 12306 11641 12570 11045 644 -26425-Jun 10300 10371 40 1210 199 77 7 11 3 11918 11402 12282 444 -36426-Jun 9880 9852 38 1280 186 71 7 11 3 11447 11026 11832 449 -38527-Jun 9450 9345 33 1330 164 62 7 11 2 10955 10584 11317 476 -36228-Jun 9180 9024 32 1330 155 59 7 11 2 10619 10152 10807 624 -18829-Jun 9110 8948 29 1290 144 62 7 11 2 10493 9801 10448 854 4530-Jun 9090 8926 30 1230 145 63 7 11 2 10413 9704 10364 873 49
1-Jul 9090 8921 29 1170 167 71 4 5 2 10370 9733 10392 806 -222-Jul 9070 8905 29 1160 166 65 4 5 2 10336 9718 10376 783 -403-Jul 9060 8904 26 1150 149 67 4 5 2 10307 9651 10314 811 -74-Jul 8920 8760 23 1120 133 57 4 5 2 10104 9508 10174 756 -705-Jul 9010 8862 21 1050 123 53 4 5 2 10120 9371 10048 898 726-Jul 9090 8943 25 979 144 62 4 5 2 10164 9459 10134 852 307-Jul 9170 9038 32 969 185 88 4 5 3 10324 9685 10352 772 -288-Jul 9250 9136 31 1040 176 86 4 5 3 10480 9960 10594 633 -1149-Jul 9410 9336 31 1070 181 81 4 5 3 10711 10110 10776 675 -65
10-Jul 9600 9560 36 1110 206 88 4 5 3 11012 10457 11188 595 -17611-Jul 9720 9712 39 1190 226 88 4 5 3 11268 10731 11504 545 -23712-Jul 9850 9869 41 1250 234 84 4 5 3 11490 10977 11793 494 -30313-Jul 9770 9771 40 1340 233 80 4 5 3 11477 11106 11936 370 -45814-Jul 9640 9619 39 1450 222 79 4 5 3 11420 11030 11846 412 -42615-Jul 9580 9555 33 1490 189 69 4 5 3 11347 10931 11731 441 -384
Notes:1. Corrected Hope flows are based on rating curve developed from complete set of WSC measurements provided in December 2007. Modelling and Table 3.4 based on data provided to nhc in summer 2007.
Hope MissionDate

Table 3.3: 2007 Flow Split Measurements
Discharge Average(m3/s) (m3/s)
Douglas Island Fraser R d/s of Douglas Isl 12-Jun-07 12:01 PM 15,260 15,200 2.5 km d/s of Douglas Isl. under power lines12-Jun-07 12:05 PM 15,105
Douglas Isl South Channel 12-Jun-07 11:35 AM 9,853 8,99012-Jun-07 11:44 AM 9,017
Fraser R u/s of Douglas Isl 12-Jun-07 11:13 AM 12,773 12,550 Approx 1.3 km u/s of Douglas Isl.12-Jun-07 11:19 AM 12,330
Douglas Isl East Channel 12-Jun-07 10:50 AM 3,587 3,68012-Jun-07 10:54 AM 3,764
Douglas Isl North Channel 12-Jun-07 10:31 AM 6,319 6,24012-Jun-07 10:34 AM 6,151
Pitt R 12-Jun-07 09:53 AM 2,208 2,280 u/s of the Pitt River bridges 12-Jun-07 09:57 AM 2,347
Trifurcation Annieville Channel 11-Jun-07 08:57 AM 12,407 12,300 u/s end of Annacis island approx. 200 m 11-Jun-07 09:15 AM 12,022 d/s from end of the island in Annieville Ch.11-Jun-07 09:23 AM 12,57511-Jun-07 09:29 AM 12,317
Fraser R full flow 11-Jun-07 09:44 AM 16,408 15,750 1000m upstream of Annacis island 11-Jun-07 09:52 AM 14,86711-Jun-07 09:57 AM 16,54711-Jun-07 10:03 AM 15,181
North Arm 11-Jun-07 10:31 AM 1,731 1,650 At entrance of the Fraser North Arm approx.11-Jun-07 10:33 AM 1,613 100m u/s of the Railroad bridge.11-Jun-07 10:37 AM 1,67611-Jun-07 10:40 AM 1,595
Annacis Channel 11-Jun-07 10:13 AM 1,579 1,450 u/s end of Annacis Channel 11-Jun-07 10:17 AM 1,319 Near the Pipeline Crossing.11-Jun-07 10:19 AM 1,56111-Jun-07 10:22 AM 1,355
Kirkland Island Woodward 13-Jun-07 10:08 AM 13,633 13,43013-Jun-07 10:13 AM 13,25413-Jun-07 10:19 AM 13,43013-Jun-07 10:25 AM 13,420
Ladner 13-Jun-07 09:47 AM 1,165 1,150 At the entrance of Ladner Reach13-Jun-07 09:50 AM 1,18013-Jun-07 09:55 AM 1,11813-Jun-07 09:57 AM 1,153
Canoe Pass 13-Jun-07 09:12 AM 357 346 At the entrance of Canoe Pass(u/s)13-Jun-07 09:14 AM 336
Garry Point Garry Point 13-Jun-07 07:05 AM 11,850 11,960 Fraser River main channel by Garry Point13-Jun-07 07:12 AM 12,070
Steveston Entrance 13-Jun-07 06:56 AM 302 294 At entrance of Steveston harbour (d/s)13-Jun-07 06:57 AM 285
Reifel Island 13-Jun-07 08:01 AM 13,837 14,180 d/s of entrance of Sea Reach13-Jun-07 08:10 AM 14,521
Albion Wall 13-Jun-07 07:33 AM 2,128 1,960 Parallel to Albion wall13-Jun-07 07:42 AM 1,801
Sea Island Middle Arm 14-Jun-07 07:52 AM 1,013 1,03014-Jun-07 07:55 AM 1,037
North Arm d/s 14-Jun-07 08:06 AM 1,101 1,09014-Jun-07 08:08 AM 1,084
North Arm u/s 14-Jun-07 08:21 AM 2,003 2,04014-Jun-07 08:24 AM 2,12614-Jun-07 08:29 AM 1,98314-Jun-07 08:32 AM 2,035
NotesArea Location Date Time
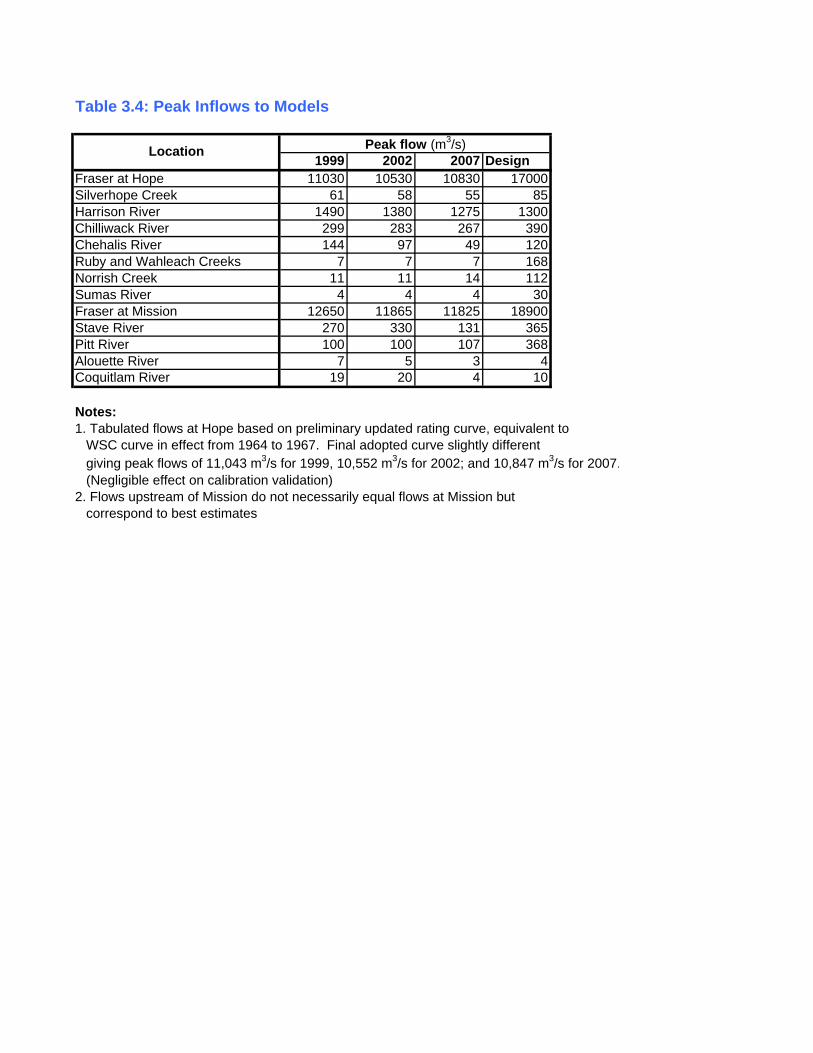
Table 3.4: Peak Inflows to Models
1999 2002 2007 DesignFraser at Hope 11030 10530 10830 17000Silverhope Creek 61 58 55 85Harrison River 1490 1380 1275 1300Chilliwack River 299 283 267 390Chehalis River 144 97 49 120Ruby and Wahleach Creeks 7 7 7 168Norrish Creek 11 11 14 112Sumas River 4 4 4 30Fraser at Mission 12650 11865 11825 18900Stave River 270 330 131 365Pitt River 100 100 107 368Alouette River 7 5 3 4Coquitlam River 19 20 4 10
Notes:1. Tabulated flows at Hope based on preliminary updated rating curve, equivalent to WSC curve in effect from 1964 to 1967. Final adopted curve slightly different giving peak flows of 11,043 m3/s for 1999, 10,552 m3/s for 2002; and 10,847 m3/s for 2007. (Negligible effect on calibration validation)2. Flows upstream of Mission do not necessarily equal flows at Mission but correspond to best estimates
Peak flow (m3/s)Location
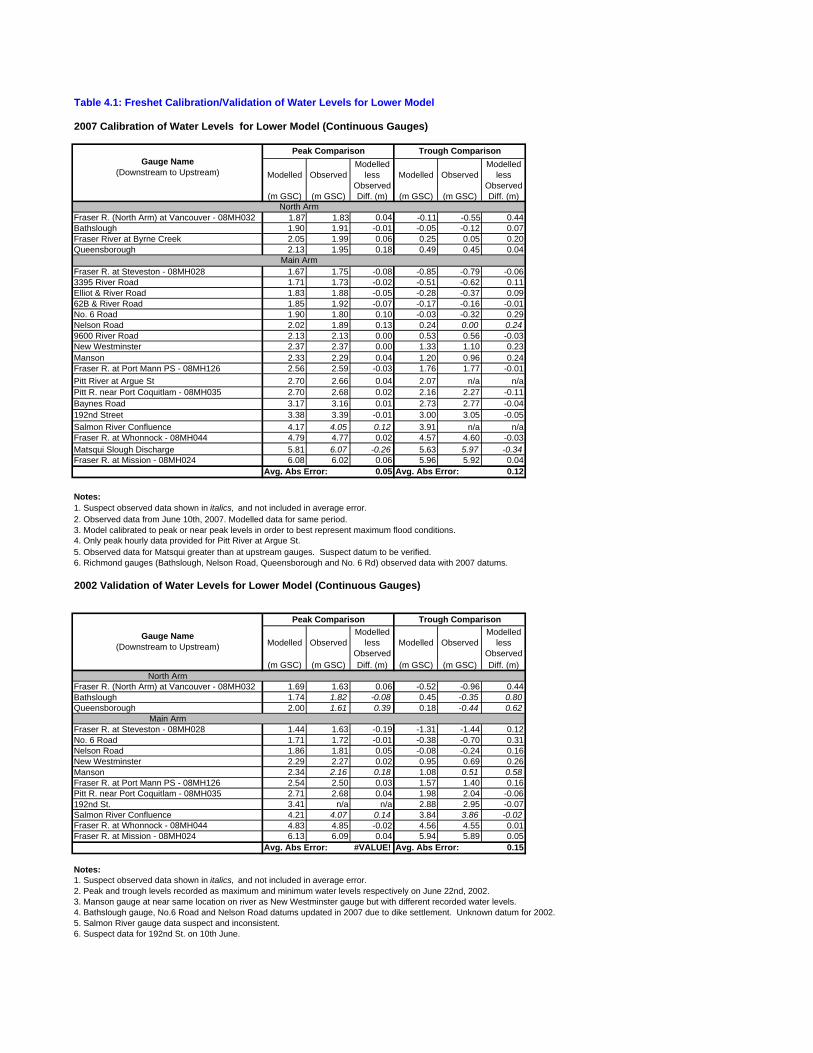
Table 4.1: Freshet Calibration/Validation of Water Levels for Lower Model
2007 Calibration of Water Levels for Lower Model (Continuous Gauges)
Modelled Observed Modelled
less Observed
Modelled Observed Modelled
less Observed
(m GSC) (m GSC) Diff. (m) (m GSC) (m GSC) Diff. (m)
Fraser R. (North Arm) at Vancouver - 08MH032 1.87 1.83 0.04 -0.11 -0.55 0.44Bathslough 1.90 1.91 -0.01 -0.05 -0.12 0.07Fraser River at Byrne Creek 2.05 1.99 0.06 0.25 0.05 0.20Queensborough 2.13 1.95 0.18 0.49 0.45 0.04
Fraser R. at Steveston - 08MH028 1.67 1.75 -0.08 -0.85 -0.79 -0.063395 River Road 1.71 1.73 -0.02 -0.51 -0.62 0.11Elliot & River Road 1.83 1.88 -0.05 -0.28 -0.37 0.0962B & River Road 1.85 1.92 -0.07 -0.17 -0.16 -0.01No. 6 Road 1.90 1.80 0.10 -0.03 -0.32 0.29Nelson Road 2.02 1.89 0.13 0.24 0.00 0.249600 River Road 2.13 2.13 0.00 0.53 0.56 -0.03New Westminster 2.37 2.37 0.00 1.33 1.10 0.23Manson 2.33 2.29 0.04 1.20 0.96 0.24Fraser R. at Port Mann PS - 08MH126 2.56 2.59 -0.03 1.76 1.77 -0.01Pitt River at Argue St 2.70 2.66 0.04 2.07 n/a n/aPitt R. near Port Coquitlam - 08MH035 2.70 2.68 0.02 2.16 2.27 -0.11Baynes Road 3.17 3.16 0.01 2.73 2.77 -0.04192nd Street 3.38 3.39 -0.01 3.00 3.05 -0.05Salmon River Confluence 4.17 4.05 0.12 3.91 n/a n/aFraser R. at Whonnock - 08MH044 4.79 4.77 0.02 4.57 4.60 -0.03Matsqui Slough Discharge 5.81 6.07 -0.26 5.63 5.97 -0.34Fraser R. at Mission - 08MH024 6.08 6.02 0.06 5.96 5.92 0.04
Avg. Abs Error: 0.05 Avg. Abs Error: 0.12
Notes:1. Suspect observed data shown in italics, and not included in average error.2. Observed data from June 10th, 2007. Modelled data for same period.3. Model calibrated to peak or near peak levels in order to best represent maximum flood conditions.4. Only peak hourly data provided for Pitt River at Argue St.5. Observed data for Matsqui greater than at upstream gauges. Suspect datum to be verified.6. Richmond gauges (Bathslough, Nelson Road, Queensborough and No. 6 Rd) observed data with 2007 datums.
2002 Validation of Water Levels for Lower Model (Continuous Gauges)
Modelled Observed Modelled
less Observed
Modelled Observed Modelled
less Observed
(m GSC) (m GSC) Diff. (m) (m GSC) (m GSC) Diff. (m)North Arm
Fraser R. (North Arm) at Vancouver - 08MH032 1.69 1.63 0.06 -0.52 -0.96 0.44Bathslough 1.74 1.82 -0.08 0.45 -0.35 0.80Queensborough 2.00 1.61 0.39 0.18 -0.44 0.62
Main ArmFraser R. at Steveston - 08MH028 1.44 1.63 -0.19 -1.31 -1.44 0.12No. 6 Road 1.71 1.72 -0.01 -0.38 -0.70 0.31Nelson Road 1.86 1.81 0.05 -0.08 -0.24 0.16New Westminster 2.29 2.27 0.02 0.95 0.69 0.26Manson 2.34 2.16 0.18 1.08 0.51 0.58Fraser R. at Port Mann PS - 08MH126 2.54 2.50 0.03 1.57 1.40 0.16Pitt R. near Port Coquitlam - 08MH035 2.71 2.68 0.04 1.98 2.04 -0.06192nd St. 3.41 n/a n/a 2.88 2.95 -0.07Salmon River Confluence 4.21 4.07 0.14 3.84 3.86 -0.02Fraser R. at Whonnock - 08MH044 4.83 4.85 -0.02 4.56 4.55 0.01Fraser R. at Mission - 08MH024 6.13 6.09 0.04 5.94 5.89 0.05
Avg. Abs Error: #VALUE! Avg. Abs Error: 0.15
Notes:1. Suspect observed data shown in italics, and not included in average error.2. Peak and trough levels recorded as maximum and minimum water levels respectively on June 22nd, 2002.3. Manson gauge at near same location on river as New Westminster gauge but with different recorded water levels.4. Bathslough gauge, No.6 Road and Nelson Road datums updated in 2007 due to dike settlement. Unknown datum for 2002.5. Salmon River gauge data suspect and inconsistent.6. Suspect data for 192nd St. on 10th June.
Gauge Name (Downstream to Upstream)
Peak Comparison Trough Comparison
Main Arm
Peak Comparison Trough ComparisonGauge Name
(Downstream to Upstream)
North Arm
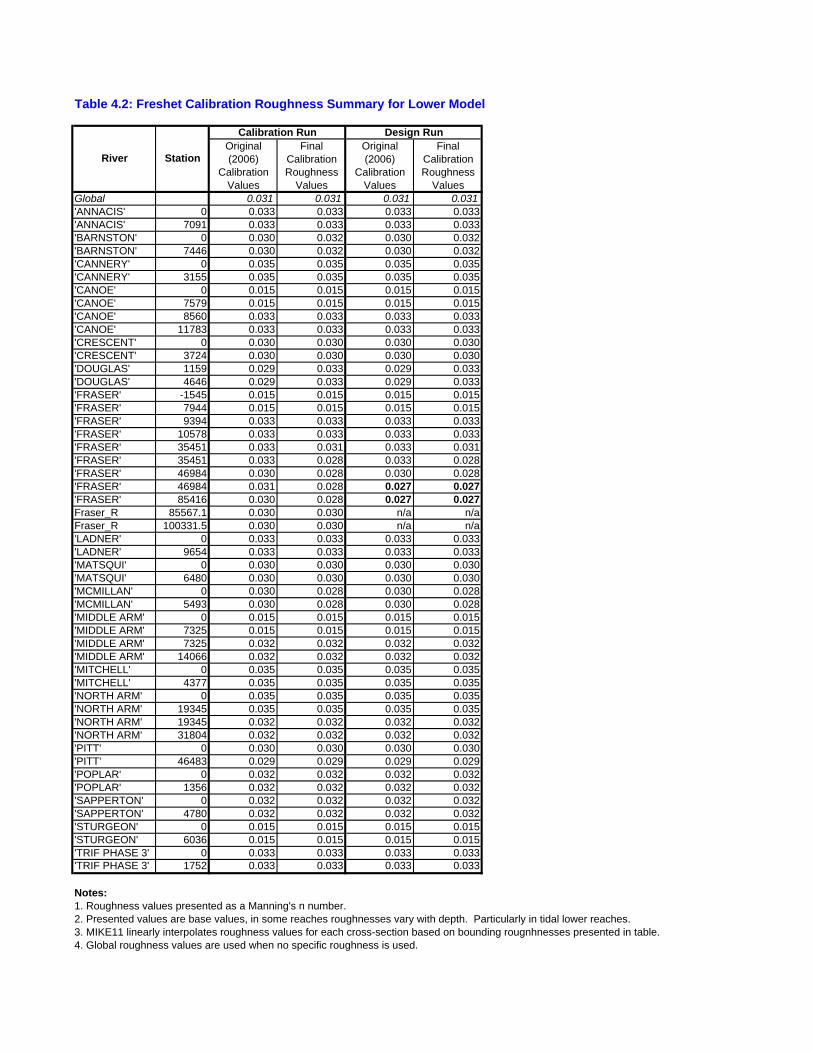
Table 4.2: Freshet Calibration Roughness Summary for Lower Model
Original (2006)
Calibration Values
Final Calibration Roughness
Values
Original (2006)
Calibration Values
Final Calibration Roughness
ValuesGlobal 0.031 0.031 0.031 0.031'ANNACIS' 0 0.033 0.033 0.033 0.033'ANNACIS' 7091 0.033 0.033 0.033 0.033'BARNSTON' 0 0.030 0.032 0.030 0.032'BARNSTON' 7446 0.030 0.032 0.030 0.032'CANNERY' 0 0.035 0.035 0.035 0.035'CANNERY' 3155 0.035 0.035 0.035 0.035'CANOE' 0 0.015 0.015 0.015 0.015'CANOE' 7579 0.015 0.015 0.015 0.015'CANOE' 8560 0.033 0.033 0.033 0.033'CANOE' 11783 0.033 0.033 0.033 0.033'CRESCENT' 0 0.030 0.030 0.030 0.030'CRESCENT' 3724 0.030 0.030 0.030 0.030'DOUGLAS' 1159 0.029 0.033 0.029 0.033'DOUGLAS' 4646 0.029 0.033 0.029 0.033'FRASER' -1545 0.015 0.015 0.015 0.015'FRASER' 7944 0.015 0.015 0.015 0.015'FRASER' 9394 0.033 0.033 0.033 0.033'FRASER' 10578 0.033 0.033 0.033 0.033'FRASER' 35451 0.033 0.031 0.033 0.031'FRASER' 35451 0.033 0.028 0.033 0.028'FRASER' 46984 0.030 0.028 0.030 0.028'FRASER' 46984 0.031 0.028 0.027 0.027'FRASER' 85416 0.030 0.028 0.027 0.027Fraser_R 85567.1 0.030 0.030 n/a n/aFraser_R 100331.5 0.030 0.030 n/a n/a'LADNER' 0 0.033 0.033 0.033 0.033'LADNER' 9654 0.033 0.033 0.033 0.033'MATSQUI' 0 0.030 0.030 0.030 0.030'MATSQUI' 6480 0.030 0.030 0.030 0.030'MCMILLAN' 0 0.030 0.028 0.030 0.028'MCMILLAN' 5493 0.030 0.028 0.030 0.028'MIDDLE ARM' 0 0.015 0.015 0.015 0.015'MIDDLE ARM' 7325 0.015 0.015 0.015 0.015'MIDDLE ARM' 7325 0.032 0.032 0.032 0.032'MIDDLE ARM' 14066 0.032 0.032 0.032 0.032'MITCHELL' 0 0.035 0.035 0.035 0.035'MITCHELL' 4377 0.035 0.035 0.035 0.035'NORTH ARM' 0 0.035 0.035 0.035 0.035'NORTH ARM' 19345 0.035 0.035 0.035 0.035'NORTH ARM' 19345 0.032 0.032 0.032 0.032'NORTH ARM' 31804 0.032 0.032 0.032 0.032'PITT' 0 0.030 0.030 0.030 0.030'PITT' 46483 0.029 0.029 0.029 0.029'POPLAR' 0 0.032 0.032 0.032 0.032'POPLAR' 1356 0.032 0.032 0.032 0.032'SAPPERTON' 0 0.032 0.032 0.032 0.032'SAPPERTON' 4780 0.032 0.032 0.032 0.032'STURGEON' 0 0.015 0.015 0.015 0.015'STURGEON' 6036 0.015 0.015 0.015 0.015'TRIF PHASE 3' 0 0.033 0.033 0.033 0.033'TRIF PHASE 3' 1752 0.033 0.033 0.033 0.033
Notes:1. Roughness values presented as a Manning's n number.2. Presented values are base values, in some reaches roughnesses vary with depth. Particularly in tidal lower reaches.3. MIKE11 linearly interpolates roughness values for each cross-section based on bounding rougnhnesses presented in table.4. Global roughness values are used when no specific roughness is used.
Design RunCalibration Run
River Station

Table 4.3: Freshet Calibration/Validation of Flows for Lower Model
2007 Validation of Flow Splits
1 2 3 1 2 3 1 2 35 Fraser Douglas 72% 29% 67% 34%6 Fraser North Arm Annacis 78% 10% 9% 83% 9% 6%7 Fraser Ladner 92% 8% 94% 6%8 Ladner Canoe 77% 23% 97% 3%9 Fraser Cannery Sturgeon 84% 2% 14% 91% 2% 7%
10 North Arm Mid Arm 53% 50% 91% 11%
Notes:1. Flows measured by PWGSC between June 11th and 14th, 2007.2. Modelled results at same time/date as observed data.3. All percentages refer to split at each junction, not total Fraser flow.4. Flow splits in lower reaches of mainstem are very sensitive to time of measurement relative to tidal cycle.5. Where data available, percentages are based on split flows relative to measured flow above splitand therefore do not necessarily add up to exactly 100%.
2002 Validation of Flow Splits
1 2 3 1 2 3 1 2 3 1 2 3 1 2 31 Fraser Matsqui 71% 29% 74% 26% 73% 27% 74% 26%2 Fraser Crescent 90% 10% 90% 10% 90% 10% 90% 10%3 Fraser McMillan 94% 6% 94% 6% 94% 6% 94% 6%4 Fraser Barnston 70% 30% 75% 25% 75% 25% 75% 25%
5 Fraser Douglas 70% 30% 64% 36% 62% 38% 66% 34%6 Fraser North Arm Annacis 80% 10% 10% 82% 11% 8% 78% 12% 9% 85% 9% 6%7 Fraser Ladner 90% 10% 89% 11% 89% 11% 93% 7%8 Ladner Canoe 41% 59% 82% 18% 72% 28% 98% 2%9 Fraser Cannery Sturgeon 84% 2% 14% 89% 2% 9% 77% 4% 19% 97% 0% 3%
10 North Arm Mid Arm 44% 56% 81% 16% 70% 29% 98% 2%
Notes:1. Flows measured by PWGSC in May/June 2002.2. Splits #7 and #10 were measured during winter low flow conditions and are approximate only3. Downstream of trifurcation, percentages refer to split at each junction, not total Fraser flow4. Flow splits in lower reaches of mainstem are very sensitive to time of measurement relative to tidal cycle.
Observed Split
Split # Channels Observed Split
Modelled Split
June 11-14th At measured timeChannelsSplit #
Modelled SplitApprox. 6000 cms Average over time At High Tide (June At Low Tide (June

Table 4.4: Freshet Calibration/Validation of Water Levels Summary for Upper Model
1999 Calibration of Water Levels for Upper Model
Modelled Observed Modelled
less Observed
(m GSC) (m GSC) Diff. (m)Dewdney PS 8:55 6.72 6.75 -0.03Robson PS 10:20 7.17 7.22 -0.05McGillivray Slough PS 11:00 7.67 7.61 0.06Collinson PS 10:45 7.64 7.60 0.04Quaamitch Slough 10:40 8.06 8.03 0.03Chilliwack Creek PS (Wolfe Road) 11:30 8.76 8.76 0.00Hope Slough at Young St. n/a 9.24 9.14 0.10Bell Dam 11:20 9.38 9.37 0.01Minto Landing Area (Bell Slough) 10:30 11.01 10.97 0.04Harrison Mills (Kilby) 8:00 11.81 11.80 0.01Scowlitz (Harrison Bay) 8:20 11.88 11.88 0.00Duncan Bateson PS 8:25 11.91 11.92 -0.01Carey Point 10:00 13.47 13.42 0.05Hammersley PS 7:15 14.17 14.13 0.04Chip (Camp-Hope) Intake n/a 16.65 16.78 -0.13Agassiz-Rosedale Bridge North 6:20 17.00 16.86 0.14Agassiz-Rosedale Bridge South 8:50 16.99 17.00 -0.01Maria Slough 6:05 19.24 19.31 -0.07Herrling Island 8:25 20.63 20.55 0.08Johnson Slough 5:55 26.89 26.87 0.02Wahleach(Jones) Creek 8:40 27.01 27.06 -0.05
Avg. Abs Error: 0.05
Notes:1. Some gauges (Cuthbert, Seabird Island and Tranmer) have no reported data on 23rd.2. The two Agassiz bridge gauges and the Chip intake gauge are in close proximity, though report very different values.3. Location of data reported for Seabird Island gauge uncertain.4. When observed time unknown, modelled data extracted at 12:00 PM.
2007 Validation of Water Levels for Upper Model
Modelled Observed Modelled
less Observed
(m GSC) (m GSC) Diff. (m)Dewdney PS Continuous 6.45 6.47 -0.02Robson PS 13:40 6.86 6.90 -0.04McGillivray Slough PS 8:00 7.39 7.37 0.02Collinson PS 8:00 7.41 7.33 0.08Quaamitch Slough 14:10 7.80 7.74 0.06Chilliwack Creek PS (Wolfe Road) 8:00 8.60 8.49 0.11Hope Slough at Young St. 8:00 9.11 8.95 0.16Bell Dam 14:20 8.98 6.88 2.10Minto Landing Area (Bell Slough) 8:00 10.91 10.79 0.12Harrison Mills (Kilby) 8:14 11.71 11.58 0.13Duncan Bateson PS 7:53 11.80 11.68 0.12Harrison R. below Morris Creek - 08MG022 Continuous 11.89 11.77 0.12Carey Point 8:00 13.40 13.21 0.19Hammersley PS 7:44 14.10 13.91 0.19Chip (Camp-Hope) Intake 8:00 16.60 16.74 -0.14Agassiz-Rosedale Bridge North 9:44 16.93 16.87 0.06Agassiz-Rosedale Bridge South 10:18 16.93 16.97 -0.04Cuthbert Road 10:08 19.13 19.08 0.05Maria Slough 10:23 19.12 19.12 0.00Herrling Island 10:00 20.57 20.65 -0.08Johnson Slough 7:50 26.81 26.83 -0.02Wahleach Powerhouse Continuous 17.96 17.62 0.34Wahleach (Jones) Creek 9:35 26.94 26.95 -0.01
Avg. Abs Error: 0.08
Notes:1. Suspect data shown in italics, and not included in average error.2. Modelled data for staff gauges reported at observed time.3. Modelled and observed data for continuous gauges reported as peak flow on June 10th, 2007.4. Downstream boundary condition set to WSC reported levels at Mission.5. Observed data at Bell Dam possibly reported for upstream side of dam.6. No datum shift to GSC available for Wahleach Powerhouse. Observed data irregular.
Gauge Name (Downstream to Upstream)
Observed Time
(10th June)
Gauge Name (Downstream to Upstream)
Observed Time
(23rd June)

Table 4.5: Calibration Roughness Summary for Upper Model
(Continued)
River Station 2001 Model
2007 Model River Station 2001
Model2007
ModelGlobal 0.032 VEDDER_R 0 0.028 0.035AGASSIZ_CHEAM 0 0.1 0.038 VEDDER_R 6690 0.028 0.035AGASSIZ_CHEAM 5056 0.1 0.038 SUMAS_R 0 0.028 0.035DND_N 0 0.1 0.040 SUMAS_R 3050 0.028 0.035DND_N 5425 0.1 0.040 SC_110624R 166.3 0.028 0.038DND_S 0 0.1 0.040 SC_110624R 2819 0.028 0.038DND_S 2000 0.1 0.040 HARRISON_R 0 0.033 0.035EC_RES_76 0 0.1 0.035 HARRISON_R 9000 0.034 0.035EC_RES_76 2421 0.1 0.035 HARRISON_R 11700 0.045 0.030FP_121054R 0 0.032 0.040 HARRISON_R 14800 0.06 0.030FP_121054R 1451 0.032 0.040 HARRISON_R 17844.6 0.06 0.030FP_123058L 0 0.1 0.035 FRASER_R 85400 0.029 0.031FP_123058L 1981 0.1 0.035 FRASER_R 100000 0.029 0.032FP_124155R 0 0.1 0.040 FRASER_R 102000 0.0275 0.032FP_124155R 1943 0.1 0.040 FRASER_R 114000 0.0275 0.033FP_125294R 0 0.1 0.035 FRASER_R 115000 0.03 0.033FP_125294R 1266 0.1 0.035 FRASER_R 115370 0.031 0.035FP_135366R 0 0.1 0.035 FRASER_R 115783 0.04 0.035FP_135366R 1574 0.1 0.035 FRASER_R 115979 0.045 0.035GREYELL_I 0 0.1 0.055 FRASER_R 116184 0.055 0.035GREYELL_I 2966 0.1 0.055 FRASER_R 116399 0.1 0.035HERRLING_I 0 0.1 0.050 FRASER_R 116640 0.1 0.035HERRLING_I 6485 0.1 0.050 FRASER_R 116921 0.093 0.035HOG_I 0 0.1 0.040 FRASER_R 117196 0.05 0.035HOG_I 2833 0.1 0.040 FRASER_R 117515 0.043 0.035HOPE_S 0 0.1 0.030 FRASER_R 117640 0.043 0.035HOPE_S 3766 0.1 0.030 FRASER_R 118000 0.033 0.035ISLAND_D 0 0.1 0.060 FRASER_R 124000 0.032 0.036ISLAND_D 1626 0.1 0.060 FRASER_R 125000 0.032 0.033MINTO_I 0 0.1 0.060 FRASER_R 127885 0.033 0.030MINTO_I 4601 0.1 0.060 FRASER_R 128051 0.039 0.030PETERS_IR1 0 0.1 0.060 FRASER_R 128295 0.039 0.030PETERS_IR1 1760 0.1 0.060 FRASER_R 128730 0.039 0.029PETERS_IR2 0 0.1 0.060 FRASER_R 129135 0.033 0.029PETERS_IR2 2480 0.1 0.060 FRASER_R 129500 0.033 0.029QUEENS_I 0 0.1 0.060 FRASER_R 131000 0.03 0.030QUEENS_I 3437 0.1 0.060 FRASER_R 154447 0.032 0.035SEABIRD_N 0 0.1 0.040 GREYELL_S 0 0.032 0.030SEABIRD_N 8413 0.1 0.040 GREYELL_S 4200 0.032 0.030SEABIRD_S 218.7 0.1 0.040 GREYELL_S 4220 0.0512 0.033SEABIRD_S 7953 0.1 0.040 GREYELL_S 4947 0.0512 0.033SKWAY_IR5 0 0.1 0.032 SC_110122R 0 0.032 0.043SKWAY_IR5 3760 0.1 0.032 SC_110122R 1323 0.032 0.043SC_132593L 0 0.033 0.030 SC_110122R 1720 0.096 0.050SC_132593L 9535 0.033 0.030 SC_110122R 2414 0.096 0.060SC_132852L 0 0.032 0.035 SC_110122R 3009 0.032 0.060SC_132852L 1793 0.032 0.035 SC_124986R 0 0.032 0.035SC_140481L 0 0.032 0.035 SC_124986R 1664 0.032 0.035SC_140481L 3174 0.032 0.035 SC_124986R 2000 0.0416 0.035SC_146171L 0 0.032 0.035 SC_124986R 2414 0.0416 0.035SC_146171L 3420 0.032 0.035 SC_130239R 130 0.032 0.032SC_149184R 0 0.0325 0.030 SC_130239R 1500 0.032 0.032SC_149184R 2200 0.0325 0.030 SC_130239R 1840 0.048 0.032SC_MARIA_621L 0 0.034 0.045 SC_130239R 2223 0.048 0.032SC_MARIA_621L 2128 0.034 0.045 Strawberry 0.037MARIA_S 0 0.028 0.045 Strawberry 0.037MARIA_S 3925 0.028 0.045 Nicomen 0 0.035MINTO_C 0 0.033 0.032 Nicomen 1738 0.035MINTO_C 4507 0.033 0.032 HarrisonLake 0 0.020MINTO_C 5017 0.044 0.032 HarrisonLake 56000 0.020MINTO_C 5502 0.044 0.032 FRASER_R 122000 0.035SC_107131L 0 0.028 0.025 FRASER_R 122000 0.036SC_107131L 3248 0.028 0.025 SC_122760L 0 0.040
SC_122760L 6322 0.040
Notes:1. 2001 model refers to UMA model.2. 2007 model refers to recalibrated model with updated inflow at Hope and Harrison.3. Roughness values presented as a Manning's n coefficient.4. Presented values are base values, in some reaches roughnesses vary with distance across river.5. MIKE11 linearly interpolates roughness values for each cross-section based on bounding rougnhnesses presented in table.6. Global roughness values are used when no specific roughness are input.7. Some new reaches and new reach roughnesses added for 2007 model.

Table 4.6: 2007 Freshet Validation of Water Levels for Merged Model
Modelled Observed Modelled
less Observed
(m GSC) (m GSC) Diff. (m)Fraser R. (North Arm) at Vancouver - 08MH032 Continuous 1.87 1.83 0.04Bathslough Continuous 1.91 1.91 0.00Fraser River at Byrne Creek Continuous 2.04 1.99 0.05Queensborough Continuous 2.13 1.95 0.18Fraser R. at Steveston - 08MH028 Continuous 1.67 1.75 -0.083395 River Road Continuous 1.72 1.73 -0.01Elliot & River Road Continuous 1.84 1.88 -0.0462B & River Road Continuous 1.86 1.92 -0.06No. 6 Road Continuous 1.92 1.80 0.12Nelson Road Continuous 2.03 1.89 0.149600 River Road Continuous 2.14 2.13 0.01New Westminster Continuous 2.41 2.37 0.04Manson Continuous 2.37 2.29 0.08Fraser R. at Port Mann PS - 08MH126 Continuous 2.61 2.59 0.02Pitt River at Argue St Continuous 2.75 2.66 0.09Pitt R. near Port Coquitlam - 08MH035 Continuous 2.75 2.68 0.07Baynes Road Continuous 3.23 3.16 0.07192nd Street Continuous 3.45 3.39 0.06Salmon River Confluence Continuous 3.69 4.05 -0.36Fraser R. at Whonnock - 08MH044 Continuous 4.86 4.77 0.09Matsqui Slough Discharge Continuous 5.88 6.07 -0.19Fraser R. at Mission - 08MH024 Continuous 6.14 6.02 0.12Dewdney PS Continuous 6.57 6.47 0.10Robson PS 13:40 6.94 6.90 0.04McGillivray Slough PS 8:00 7.44 7.37 0.07Collinson PS 8:00 7.46 7.33 0.13Quaamitch Slough 14:10 7.80 7.74 0.06Chilliwack Creek PS (Wolfe Road) 8:00 8.58 8.49 0.09Hope Slough at Young St. 8:00 9.08 8.95 0.13Bell Dam 14:20 8.94 6.88 2.06Minto Landing Area (Bell Slough) 8:00 10.86 10.79 0.07Harrison Mills (Kilby) 8:14 11.61 11.58 0.03Duncan Bateson PS 7:53 11.67 11.68 -0.01Harrison R. below Morris Creek - 08MG022 Continuous 11.75 11.77 -0.02Carey Point 8:00 13.37 13.21 0.16Hammersley PS 7:44 14.07 13.91 0.16Chip (Camp-Hope) Intake 8:00 16.60 16.74 -0.14Agassiz-Rosedale Bridge North 9:44 16.93 16.87 0.06Agassiz-Rosedale Bridge South 10:18 16.93 16.97 -0.04Cuthbert Road 10:08 19.15 19.08 0.07Maria Slough 10:23 19.15 19.12 0.03Herrling Island 10:00 20.57 20.65 -0.08Johnson Slough 7:50 26.83 26.83 0.00Wahleach Powerhouse Continuous 17.96 17.62 0.34Wahleach (Jones) Creek 9:35 26.93 26.95 -0.02
Avg. Abs Error: 0.08
Notes:1. Suspect data shown in italics, and not included in average error.2. Modelled data for staff gauges reported at observed time.3. Modelled and observed data for continuous gauge reported as peak flow on June 10th, 2007.4. Only peak hourly data provided for Pitt River at Argue St.5. Observed data for Matsqui greater than at upstream gauges. Suspect datum to be verified.6. Richmond gauges (Bathslough, Nelson Road, Queensborough and No. 6 Rd) observed data with 2007 datums.7. Observed data at Bell Dam possibly reported for upstream side of dam.8. No datum shift to GSC available for Wahleach Powerhouse. Observed data irregular.9. Values vary slightly from separate lower and upper models due to slight differences in inflows, particularly for Harrison system.
Gauge Type/ Observed
Time (10th June)
Gauge Name (Downstream to Upstream)
Peak Comparison

Table 5.1: Design Profile Comparisons for Lower Model (Historic and 2007 Updated)
2007 Modelled WL
1969 Calculated WL Difference
(m GSC) (m GSC) (m)
City of Vancouver West end UBC 'NORTH ARM' 1238 2.88 2.62 0.26Burnaby border 'NORTH ARM' 22157 3.03 2.68 0.35
City of Richmond Sea Island: McDonald Slough 'NORTH ARM' 9913 2.88 2.62 0.26Sea Island: West end at Middle Arm 'MIDDLE ARM' 6788 2.88 2.62 0.26Middle and North Arm Confluence 'MIDDLE ARM' 14066 2.89 2.62 0.27Terra Nova Park at Middle Arm 'MIDDLE ARM' 7834 2.88 2.62 0.26New Westminster border 'NORTH ARM' 28105 3.14 3.10 0.04
City of Burnaby Vancouver border 'NORTH ARM' 22157 3.03 2.68 0.35New Westminster border 'NORTH ARM' 28761 3.14 3.17 -0.03
City of New WestminsteBurnaby border 'NORTH ARM' 28761 3.14 3.17 -0.03Coquitlam border 'FRASER' 37528 4.22 3.95 0.27
City of Coquitlam Burnaby border 'FRASER' 37528 4.22 3.95 0.27Port Coquitlam border 'FRASER' 42617 4.67 4.37 0.30
City of Port Coquitlam Coquitlam border 'FRASER' 42617 4.67 4.37 0.30Pitt and Fraser Rivers confluence 'DOUGLAS' 2988 4.92 4.50 0.42Pitt River at De Bouville Slough 'PITT' 7342 4.92 4.57 0.35
District of Pitt MeadowsPitt River at Sheridan Hill 'PITT' 10817 4.92 4.57 0.35Pitt and Fraser Rivers confluence 'DOUGLAS' 2988 4.92 4.50 0.42Maple Ridge border 'FRASER' 53954 6.00 5.11 0.89
District of Maple Ridge Pitt Meadows border 'FRASER' 53954 6.00 5.11 0.89Whonnock Creek 'FRASER' 71256 7.70 6.71 0.99Mission border 'FRASER' 73842 7.90 7.00 0.90
District of Mission Maple Ridge border 'FRASER' 73842 7.90 7.00 0.90Silverdale Creek 'FRASER' 80578 8.48 7.50 0.98Mission bridge 'FRASER' 85182 8.87 7.91 0.96
Corporation of Delta Roberts Bank at Canoe Pass 'CANOE' 8065 2.86 2.59 0.27Massey Tunnel 'FRASER' 18117 2.92 2.65 0.27Surrey border 'FRASER' 31926 3.54 3.60 -0.06Westham Island: Roberts Bank at Canoe Pass 'CANOE' 8065 2.86 2.59 0.27Westham Island: Reifel Island at Ladner Reach 'FRASER' 9650 2.84 2.59 0.25Westham Island: Upstream end 'LADNER' 4506 2.87 2.59 0.28
City of Richmond Steveston, Garry Point Park 'FRASER' 7589 2.84 2.59 0.25Massey Tunnel 'FRASER' 18117 2.92 2.71 0.21New Westminster Border 'ANNACIS' 3136 3.31 3.50 -0.19
City of New WestminsteCity of Richmond Border 'ANNACIS' 3136 3.31 3.50 -0.19Trifurcation 'FRASER' 34089 3.82 3.60 0.22
City of Surrey Delta border 'FRASER' 31926 3.54 3.60 -0.06Township of Langley border 'BARNSTON' 6011 5.83 5.05 0.78
Barnston Diking DistrictBarnston Island: downstream end 'BARNSTON' 0 5.27 4.75 0.52Barnston Island: upstream end 'BARNSTON' 7446 5.96 5.11 0.85
Township of Langley Surrey border 'BARNSTON' 6011 5.83 5.05 0.78Jacob-Haldi Bridge 'MCMILLAN' 2644 6.94 5.95 0.99Abbotsford border 'FRASER' 70804 7.66 7.00 0.66
City of Abbotsford Langley border 'FRASER' 70804 7.66 7.00 0.66Mission Bridge 'FRASER' 85182 8.87 7.91 0.96
Notes:1. Historic calculated water levels were obtained from profile drawings and MOE maps and are approximate for the locations indicated.2. Modelled water levels are based on smoothed profile.3. Water levels below chainage 28369 are based on winter design condition (200-year, 95% confidence tide event).4. Water levels above chainage 28369 are based on freshet design condition (reoccurance of 1894 event).
North Fraser
South Fraser
Municipality/Diking District Location MIKE 11 Chainage
Design Flood

Table 5.1 Cont: Design Profile Comparisons for Lower Model (Original and Updated)
2007 Modelled WL
2006 Modelled WL Difference
(m GSC) (m GSC) (m)
City of Vancouver West end UBC 'NORTH ARM' 1238 2.88 2.88 0.00Burnaby border 'NORTH ARM' 22157 3.03 3.03 0.00
City of Richmond Sea Island: McDonald Slough 'NORTH ARM' 9913 2.88 2.88 0.00Sea Island: West end at Middle Arm 'MIDDLE ARM' 6788 2.88 2.89 -0.01Middle and North Arm Confluence 'MIDDLE ARM' 14066 2.89 2.89 0.00Terra Nova Park at Middle Arm 'MIDDLE ARM' 7834 2.88 2.89 -0.01New Westminster border 'NORTH ARM' 28105 3.14 3.14 0.00
City of Burnaby Vancouver border 'NORTH ARM' 22157 3.03 3.03 0.00New Westminster border 'NORTH ARM' 28761 3.14 3.26 -0.12
City of New WestminsteBurnaby border 'NORTH ARM' 28761 3.14 3.26 -0.12Coquitlam border 'FRASER' 37528 4.22 4.24 -0.02
City of Coquitlam Burnaby border 'FRASER' 37528 4.22 4.24 -0.02Port Coquitlam border 'FRASER' 42617 4.67 4.83 -0.16
City of Port Coquitlam Coquitlam border 'FRASER' 42617 4.67 4.83 -0.16Pitt and Fraser Rivers confluence 'DOUGLAS' 2988 4.92 5.08 -0.16Pitt River at De Bouville Slough 'PITT' 7342 4.92 4.90 0.02
District of Pitt MeadowsPitt River at Sheridan Hill 'PITT' 10817 4.92 4.90 0.02Pitt and Fraser Rivers confluence 'DOUGLAS' 2988 4.92 5.08 -0.16Maple Ridge border 'FRASER' 53954 6.00 6.05 -0.06
District of Maple Ridge Pitt Meadows border 'FRASER' 53954 6.00 6.05 -0.06Whonnock Creek 'FRASER' 71256 7.70 7.69 0.00Mission border 'FRASER' 73842 7.90 7.96 -0.06
District of Mission Maple Ridge border 'FRASER' 73842 7.90 7.96 -0.06Silverdale Creek 'FRASER' 80578 8.48 8.51 -0.03Mission bridge 'FRASER' 85182 8.87 8.88 -0.01
Corporation of Delta Roberts Bank at Canoe Pass 'CANOE' 8065 2.86 2.87 0.00Massey Tunnel 'FRASER' 18117 2.92 2.93 -0.01Surrey border 'FRASER' 31926 3.54 3.58 -0.04Westham Island: Roberts Bank at Canoe Pass 'CANOE' 8065 2.86 2.87 0.00Westham Island: Reifel Island at Ladner Reach 'FRASER' 9650 2.84 2.84 0.00Westham Island: Upstream end 'LADNER' 4506 2.87 2.88 0.00
City of Richmond Steveston, Garry Point Park 'FRASER' 7589 2.84 2.84 0.00Massey Tunnel 'FRASER' 18117 2.92 2.93 -0.01New Westminster Border 'ANNACIS' 3136 3.31 3.23 0.08
City of New WestminsteCity of Richmond Border 'ANNACIS' 3136 3.31 3.23 0.08Trifurcation 'FRASER' 34089 3.82 3.84 -0.02
City of Surrey Delta border 'FRASER' 31926 3.54 3.58 -0.04Township of Langley border 'BARNSTON' 6011 5.83 5.91 -0.09
Barnston Diking DistrictBarnston Island: downstream end 'BARNSTON' 0 5.27 5.43 -0.16Barnston Island: upstream end 'BARNSTON' 7446 5.96 6.03 -0.07
Township of Langley Surrey border 'BARNSTON' 6011 5.83 5.91 -0.09Jacob-Haldi Bridge 'MCMILLAN' 2644 6.94 6.97 -0.03Abbotsford border 'FRASER' 70804 7.66 7.65 0.01
City of Abbotsford Langley border 'FRASER' 70804 7.66 7.65 0.01Mission Bridge 'FRASER' 85182 8.87 8.88 -0.01
Notes:1. 2006 model as presented in Final Report of December 20062. Modelled water levels are based on smoothed profile.3. 2007 water levels below chainage 28369 are based on winter design condition (200-year, 95% confidence tide event).4. 2007 water levels above chainage 28369 are based on freshet design condition (reoccurance of 1894 event).
North Fraser
South Fraser
Municipality/Diking District Location MIKE 11 Chainage
Design Flood

Table 5.2: Design Profile for Upper Model (1969, 2001 and 2007 Updated)
2007 Modelled WL
2001 Modelled WL Difference 1969
Calculated WL Difference
(m GSC) (m GSC) (m) (m GSC) (m)
District of Mission Mission Bridge FRASER_R 85400 8.87 7.99 0.88 7.89 0.98FVRD Electoral Area G border FRASER_R 89872 9.41 8.51 0.89 8.57 0.83
FVRD Mission border FRASER_R 89872 9.41 8.51 0.89 8.57 0.83Electoral Area G Downstream end Nicomen Island FRASER_R 95540 9.99 9.13 0.87 9.06 0.93
FVRD Electoral Area C border FRASER_R 107234 11.10 10.46 0.64 9.96 1.14FVRD FVRD Electoral Area G border FRASER_R 107234 11.10 10.46 0.64 9.96 1.14Electoral Area C District of Kent border (Harrison River) FRASER_R 117387 13.70 13.52 0.17 12.84 0.85
Harrison River at Lake HARRISON_R 17845 13.93 13.81 0.12District of Kent FVRD Electoral Area C border FRASER_R 117387 13.70 13.52 0.17 12.84 0.85
Hammersley Pump Station FRASER_R 124155 15.90 15.86 0.04 15.36 0.55Upstream of Agassiz Bridge FRASER_R 131184 18.78 18.90 -0.12 18.74 0.04Maria Slough MARIA_S 0 20.29 20.42 -0.13
Seabird First Nation Maria Slough MARIA_S 0 20.29 20.42 -0.13Upstream end Seabird Island FRASER_R 147935 26.88 27.05 -0.17 27.58 -0.70
FVRD Upstream end Seabird Island FRASER_R 147935 26.88 27.05 -0.17 27.58 -0.70Electoral District C Laidlaw FRASER_R 154447 31.72 31.44 0.28 31.51 0.21
City of Abbotsford Mission Bridge FRASER_R 85400 8.87 7.99 0.88 7.89 0.98FVRD Electoral Area H border FRASER_R 92864 9.72 8.84 0.88 8.85 0.87
FVRD Abbotsford border FRASER_R 92864 9.72 8.84 0.88 8.85 0.87Electoral Area H Chilliwack border FRASER_R 99944 10.47 9.61 0.86 9.43 1.04City of Chilliwack FVRD Electoral Area H border FRASER_R 99944 10.47 9.61 0.86 9.43 1.04
Minto Landing MINTO_C 3073 13.23 12.75 0.48FVRD Electoral Area D border SC_122760L 6322 18.54 18.53 0.02
FVRD Chilliwack border SC_122760L 6322 18.54 18.53 0.02Electoral Area D Upstream of Agassiz Bridge FRASER_R 131184 18.78 18.90 -0.12 18.74 0.04
FVRD Electoral Area B border FRASER_R 145700 25.65 25.52 0.14 26.23 -0.58FVRD FVRD Electoral Area D border FRASER_R 145700 25.65 25.52 0.14 26.23 -0.58Electoral Area B Laidlaw FRASER_R 154447 31.72 31.44 0.28 31.51 0.21
Notes:1. 2001 model refers to UMA model.2. 2007 model refers to recalibrated and smoothed model with updated inflow at Hope and Harrison.3. 1969 model obtained from MOE profile and maps, profile extrapolated from km 135 to Hope Gauge at km 1683. Difference is calculated as 2007 model less 2001, 1969 models.4. Water level reported upstream of Agassiz bridge to eliminate local structure losses affecting profile.
Design Flood
North Fraser
South Fraser
Municipality/Diking District Location MIKE 11 Chainage

Table 5.2 Cont: Design Profile for Upper Model (2006 and 2007 Updated)
2007 Modelled WL
2006 Modelled WL Difference
(m GSC) (m GSC) (m)
District of Mission Mission Bridge FRASER_R 85400 8.87 8.89 -0.02FVRD Electoral Area G border FRASER_R 89872 9.41 9.34 0.06
FVRD Mission border FRASER_R 89872 9.41 9.34 0.06Electoral Area G Downstream end Nicomen Island FRASER_R 95540 9.99 9.88 0.12
FVRD Electoral Area C border FRASER_R 107234 11.10 11.00 0.09FVRD FVRD Electoral Area G border FRASER_R 107234 11.10 11.00 0.09Electoral Area C District of Kent border (Harrison River) FRASER_R 117387 13.70 13.69 0.01
Harrison Lake HARRISON_R 17845 13.93 13.96 -0.03District of Kent FVRD Electoral Area C border FRASER_R 117387 13.70 13.69 0.01
Hammersley Pump Station FRASER_R 124155 15.90 15.92 -0.02Upstream of Agassiz Bridge FRASER_R 131184 18.78 18.92 -0.13Maria Slough MARIA_S 0 20.75 20.42 0.32
Seabird First Nation Maria Slough MARIA_S 0 20.75 20.42 0.32Upstream end Seabird Island FRASER_R 147935 26.88 27.05 -0.17
FVRD Upstream end Seabird Island FRASER_R 147935 26.88 27.05 -0.17Electoral District C Laidlaw FRASER_R 154447 31.72 31.44 0.28
City of Abbotsford Mission Bridge FRASER_R 85400 8.87 8.89 -0.02FVRD Electoral Area H border FRASER_R 92864 9.72 9.62 0.10
FVRD Abbotsford border FRASER_R 92864 9.72 9.62 0.10Electoral Area H Chilliwack border FRASER_R 99944 10.47 10.29 0.18City of Chilliwack FVRD Electoral Area H border FRASER_R 99944 10.47 10.29 0.18
Minto Landing MINTO_C 3073 13.23 12.98 0.25FVRD Electoral Area D border SC_122760L 6322 18.54 18.54 0.00
FVRD Chilliwack border SC_122760L 6322 18.54 18.54 0.00Electoral Area D Upstream of Agassiz Bridge FRASER_R 131184 18.78 18.92 -0.13
FVRD Electoral Area B border FRASER_R 145700 25.65 25.52 0.14FVRD FVRD Electoral Area D border FRASER_R 145700 25.65 25.52 0.14Electoral Area B Laidlaw FRASER_R 154447 31.72 31.44 0.28
Notes:1. 2006 model refers to original 2001 UMA model with updated downstream boundary condition at Mission of 8.9 m.2. 2007 model refers to recalibrated and smoothed model with updated inflow at Hope and Harrison.3. Water level reported upstream of Agassiz bridge to eliminate local structure losses affecting profile.
North Fraser
South Fraser
Municipality/Diking District Location
Design FloodMIKE 11 Chainage

Table 7.1: Dike Information Sources
Dike Name Source Year Drawing No.District of Maple Ridge 2007 34743-10LiDAR 2005 34743-10
Barnston Island Dike LiDAR 2005 34743-13Chilliwack Dike City of Chilliwack 1998 34743-4CNR Track, Glover Road to Armstrong Road Township of Langley 2003 34743-9Coquitlam Dike Underhill & Underhill / MOE 2006 34743-12Dewdney Dike Dewdney Area Improvement District 1989, 2007 34743-8Fort Langley Dike LiDAR 2005 34743-9Glen Valley East Wing Dike FRFCP Operation & Maintenance Manual 1989 34743-9
FRFCP Operation & Maintenance Manual 1988 34743-9Township of Langley 2000 34743-9
Kent A Dike District of Kent 1996 34743-3Kent B Dike District of Kent 1996 34743-3Kent C Dike District of Kent 1996 34743-3Kent D Dike Eaton Land Surveying Ltd. 2007 34743-3Marina Gardens Dike Corporation of Delta 1999, 2000 34743-18Matsqui A Dike City of Abbotsford 2007 34743-6Matsqui B Dike City of Abbotsford 2007 34743-6Mission A Dike District of Mission 2007 34743-8Mission B Dike District of Mission 2007 34743-8New Westminster (Queensborough Dike) FRFCP Operation & Maintenance Manual 1976 34743-14Nicomen Island Dike Nicomen Island Improvement District 1999 34743-7
ISL Engineering and Land Services Ltd. 2007 34743-11FRFCP Operation & Maintenance Manual 1986 34743-11
Pitt Meadows Middle Dike District of Pitt Meadows 2003 34743-11Pitt Meadows North Dike District of Pitt Meadows 2003 34743-11
District of Pitt Meadows 2003 34743-10ISL Engineering and Land Services Ltd. 2007 34743-10LiDAR 2005 34743-11District of Pitt Meadows 1960 34743-11
Port Coquitlam Dike Associated Engineering 2007 34743-12Richmond North Dike FRFCP Contract Drawings 1974 34743-15Richmond South Dike FRFCP Contract Drawings 1977 34743-16River Road Dike Corporation of Delta 1999, 2000 34743-17Silverdale Dike District of Mission 2007 34743-8Surrey Dike City of Surrey 2003 34743-13
City of Abbotsford 1999 34743-5City of Chilliwack 2007 34743-5Township of Chilliwack 1973, 1999 34743-5City of Chilliwack 2007 34743-5
West Langley Dike Township of Langley 2001 34743-9Westham Island Dike Corporation of Delta 1999, 2000 34743-18Young Road Dike City of Chilliwack 1998 34743-4Young Road to Chilliwack Mountain Dike City of Chilliwack 2007 34743-4
Vedder River - Right Bank
Albion Dike
Glen Valley West Wing Dike
Pitt Polder Dike
Vedder River - Left Bank
Pitt Dike North of Alouette River
Pitt Meadows South Dike
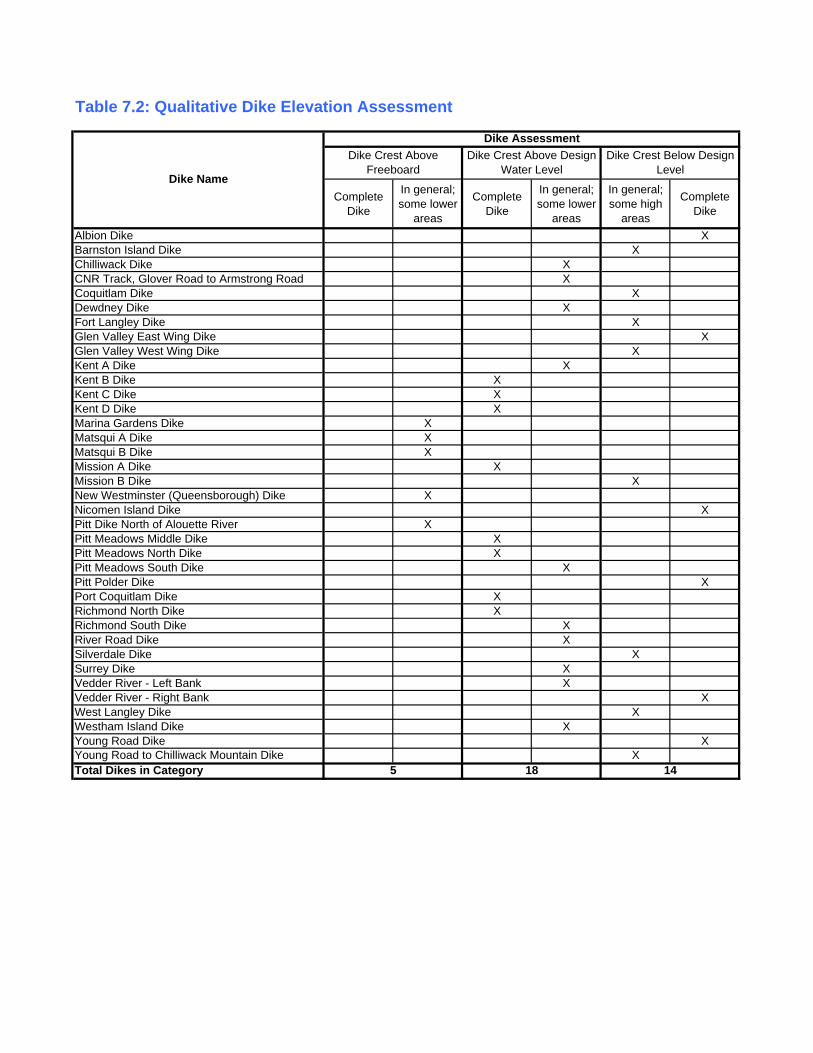
Table 7.2: Qualitative Dike Elevation Assessment
Complete Dike
In general; some lower
areas
Complete Dike
In general; some lower
areas
In general; some high
areas
Complete Dike
Albion Dike XBarnston Island Dike XChilliwack Dike XCNR Track, Glover Road to Armstrong Road XCoquitlam Dike XDewdney Dike XFort Langley Dike XGlen Valley East Wing Dike XGlen Valley West Wing Dike XKent A Dike XKent B Dike XKent C Dike XKent D Dike XMarina Gardens Dike XMatsqui A Dike XMatsqui B Dike XMission A Dike XMission B Dike XNew Westminster (Queensborough) Dike XNicomen Island Dike XPitt Dike North of Alouette River XPitt Meadows Middle Dike XPitt Meadows North Dike XPitt Meadows South Dike XPitt Polder Dike XPort Coquitlam Dike XRichmond North Dike XRichmond South Dike XRiver Road Dike XSilverdale Dike XSurrey Dike XVedder River - Left Bank XVedder River - Right Bank XWest Langley Dike XWestham Island Dike XYoung Road Dike XYoung Road to Chilliwack Mountain Dike XTotal Dikes in Category
Dike Name
5 18 14
Dike Crest Above Freeboard
Dike Crest Above Design Water Level
Dike Crest Below Design Level
Dike Assessment

Table 8.1: Inflows to Upper Model for development of Municipal Water Level Reference Tables
Design Inflow
2007 Calibration
Inflow
Design Inflow
2007 Calibration
Inflowm3/s m3/s
FRASER_R 85400 8.87 m Hydrograph n/a n/a 6 m 6.5 m 7 m 7.5 m 8 m 8.5 m 9 mFRASER_R 154447 17000 10830 88.5% 86.7% 86.7% 9705 86.7% 10702 87.0% 11940 87.4% 13148 87.8% 14435 88.1% 15687 88.5% 17018NICOMEN_S 1738 112 14 0.6% 0.1% 0.1% 13 0.1% 14 0.2% 27 0.3% 44 0.4% 64 0.5% 86 0.6% 112DND_S 2000 0 0 0.0% 0.0% 0.0% 0 0.0% 0 0.0% 0 0.0% 0 0.0% 0 0.0% 0 0.0% 0DND_N 5425 0 0 0.0% 0.0% 0.0% 0 0.0% 0 0.0% 0 0.0% 0 0.0% 0 0.0% 0 0.0% 0HOPE_S 3766 0 0 0.0% 0.0% 0.0% 0 0.0% 0 0.0% 0 0.0% 0 0.0% 0 0.0% 0 0.0% 0MARIA_S 3925 0 0 0.0% 0.0% 0.0% 0 0.0% 0 0.0% 0 0.0% 0 0.0% 0 0.0% 0 0.0% 0VEDDER_R 6690 390 267 2.0% 2.1% 2.1% 239 2.1% 264 2.1% 291 2.1% 315 2.1% 341 2.1% 365 2.0% 390SEABIRD_N 8413 0 0 0.0% 0.0% 0.0% 0 0.0% 0 0.0% 0 0.0% 0 0.0% 0 0.0% 0 0.0% 0FRASER_R 154243 85 54 0.4% 0.4% 0.4% 48 0.4% 53 0.4% 60 0.4% 66 0.4% 72 0.4% 78 0.4% 85SUMAS_R 2984 30 4 0.2% 0.0% 0.0% 4 0.0% 4 0.1% 8 0.1% 12 0.1% 17 0.1% 23 0.2% 30FRASER_R 153856 168 7 0.9% 0.1% 0.1% 6 0.1% 7 0.2% 28 0.4% 55 0.5% 89 0.7% 125 0.9% 168HarrisonLake 56000 1300 1273 6.8% 10.2% 10.2% 1141 10.2% 1258 9.6% 1312 8.9% 1337 8.2% 1344 7.5% 1332 6.8% 1301Harrison_R 5500 120 49 0.6% 0.4% 0.4% 44 0.4% 48 0.4% 60 0.5% 72 0.5% 87 0.6% 103 0.6% 120Sum 19205 12498 100% 100% 100% 11200 100% 12350 100% 13725 100% 15050 100% 16450 100% 17800 100% 19225
Notes:1. Total flow at Mission based on Lower Model rating curve at Mission.2. Inflow to all other boundaries based on relative inflow in design and 2007 calibration models and on total flow at Mission
Percentages and Flows for Family of InflowsInflow Percentage of Flow
1922511200 12350 13725 15050Boundary
m3/s m3/s m3/sm3/s m3/s m3/s m3/s
16450 17800

FIGURES

4.0
4.5
5.0
5.5
6.0
6.5
7.0
7.5
8.0
8.5
1911 1924 1938 1952 1965 1979 1993 2006
Gau
ge H
eigh
t (m
)
2000400060008000
Flow (cms):
Figure 3.1
nhcFraser River at Hope
Specific Gauge Curve based on WSC Rating Curves
March 2008 Figure 3.1

4
5
6
7
8
9
10
0 2000 4000 6000 8000 10000 12000
Flow (m3/s)
Gau
ge H
eigh
t (m
)
1948 Curve 1987 Curve
2007 Measurements 1964-67 Curve
2000-06 Measurements 2007 Curve Figure 3.1
nhcFraser River at Hope
Rating Curves and 2000-2007 Flow Measurments
March 2008 Figure 3.2
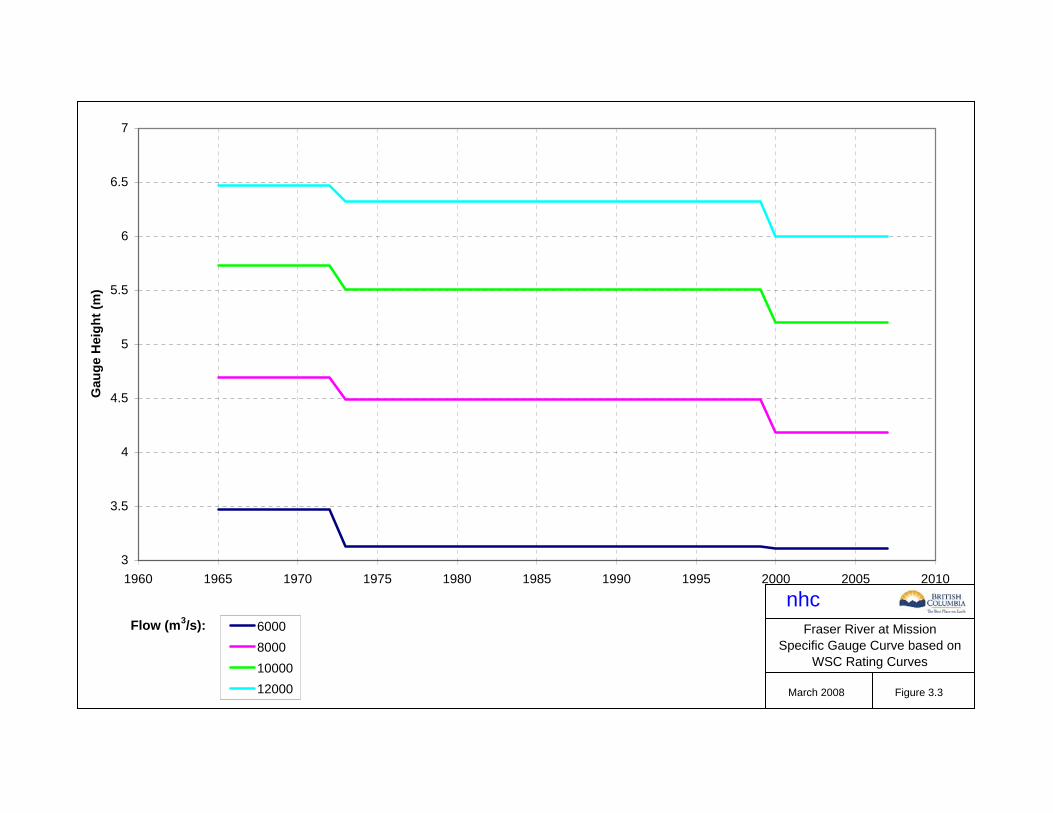
3
3.5
4
4.5
5
5.5
6
6.5
7
1960 1965 1970 1975 1980 1985 1990 1995 2000 2005 2010
Gau
ge H
eigh
t (m
)
600080001000012000
Flow (m3/s):
Figure 3.1
nhcFraser River at Mission
Specific Gauge Curve based on WSC Rating Curves
March 2008 Figure 3.3
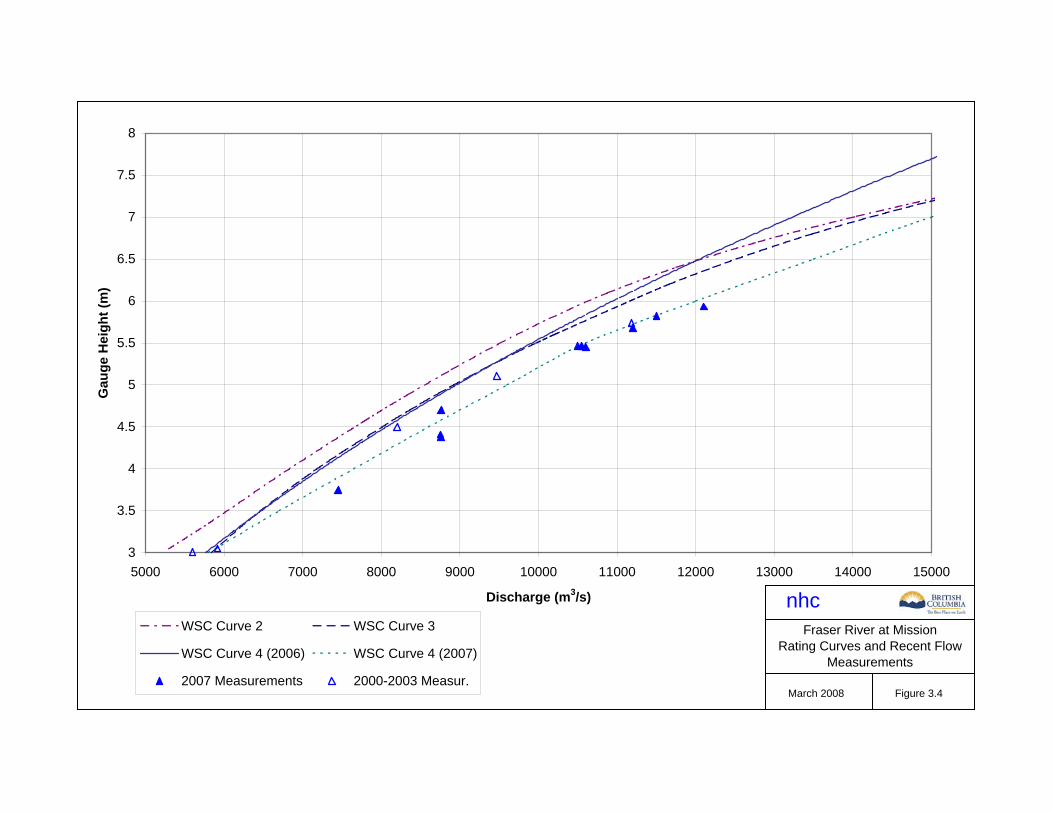
3
3.5
4
4.5
5
5.5
6
6.5
7
7.5
8
5000 6000 7000 8000 9000 10000 11000 12000 13000 14000 15000
Discharge (m3/s)
Gau
ge H
eigh
t (m
)
WSC Curve 2 WSC Curve 3
WSC Curve 4 (2006) WSC Curve 4 (2007)
2007 Measurements 2000-2003 Measur. Figure 3.1
nhcFraser River at Mission
Rating Curves and Recent Flow Measurements
March 2008 Figure 3.4

5000
6000
7000
8000
9000
10000
11000
12000
13000
15-May 20-May 25-May 30-May 4-Jun 9-Jun 14-Jun 19-Jun 24-Jun 29-Jun
Flow
(m3 /s
)
Hope Hope MeasurementsMission Mission MeasurementsSum of U/S Flows
Figure 3.1
nhcFraser River 2007
Corrected Flow Hydrographs
March 2008 Figure 3.5a
5000
6000
7000
8000
9000
10000
11000
12000
13000
15-May 20-May 25-May 30-May 4-Jun 9-Jun 14-Jun 19-Jun 24-Jun 29-Jun
Flow
(m3 /s
)
Hope Hope Measurements
Mission Mission Measurements
Sum of U/S Flows Figure 3.1
nhcFraser River 2007
Uncorrected Flow Hydrographs
March 2008 Figure 3.5b

6000
7000
8000
9000
10000
11000
12000
13000
1-Jun 6-Jun 11-Jun 16-Jun 21-Jun 26-Jun 1-Jul 6-Jul 11-Jul 16-Jul
Flow
(m3 /s
)
HopeSum of InflowsMissionMission Measurements
Figure 3.1
nhcFraser River 2002
Corrected Flow Hydrographs
March 2008 Figure 3.6a
6000
7000
8000
9000
10000
11000
12000
13000
1-Jun 6-Jun 11-Jun 16-Jun 21-Jun 26-Jun 1-Jul 6-Jul 11-Jul 16-Jul
Flow
(m3 /s
)
HopeSum of InflowsMissionMission Measurements
Figure 3.1
nhcFraser River 2002
Unorrected Flow Hydrographs
March 2008 Figure 3.6b

6000
7000
8000
9000
10000
11000
12000
13000
2-Jun 7-Jun 12-Jun 17-Jun 22-Jun 27-Jun 2-Jul 7-Jul 12-Jul
Flow
(m3 /s
)
Hope Hope MeasurementMission Mission MeasurementSum of Inflows
Figure 3.1
nhcFraser River 1999
Corrected Flow Hydrographs
March 2008 Figure 3.7a
6000
7000
8000
9000
10000
11000
12000
13000
2-Jun 7-Jun 12-Jun 17-Jun 22-Jun 27-Jun 2-Jul 7-Jul 12-Jul
Flow
(m3 /s
)
Hope Hope Measurement
Mission Mission Measurement
Sum of Inflows Figure 3.1
nhcFraser River 1999
Uncorrected Flow Hydrographs
March 2008 Figure 3.7b
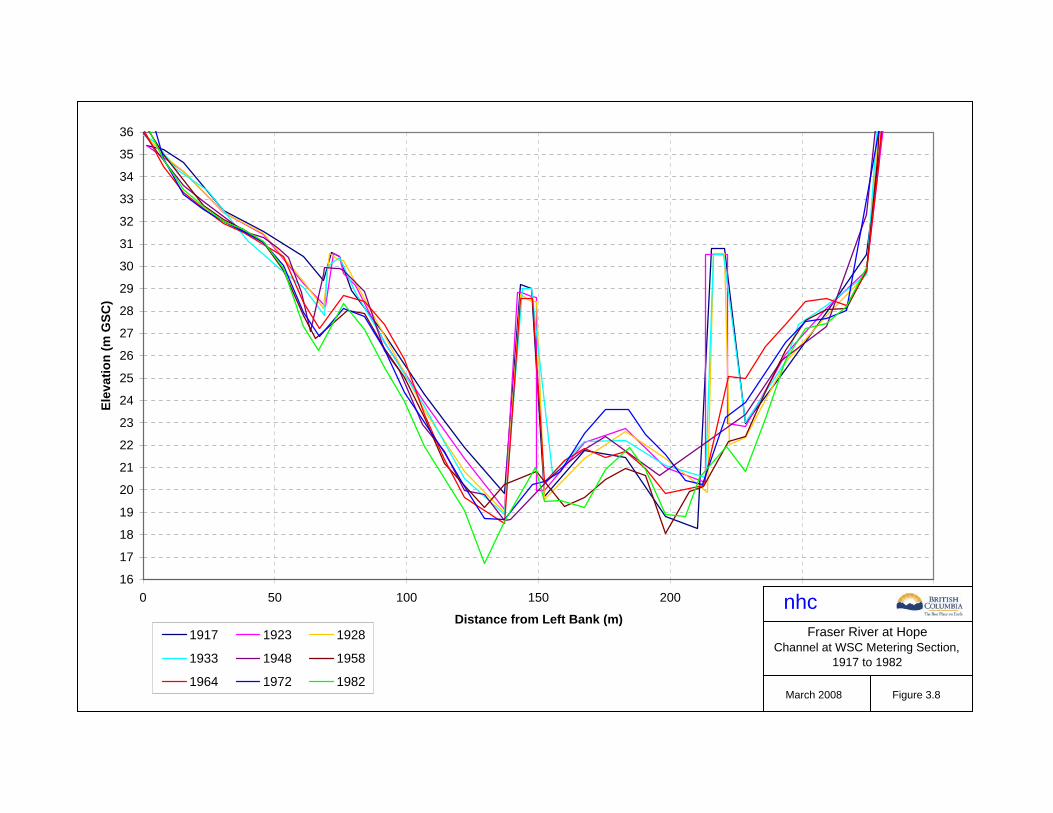
16
17
18
19
20
21
22
23
24
25
26
27
28
29
30
31
32
33
34
35
36
0 50 100 150 200 250 300
Distance from Left Bank (m)
Elev
atio
n (m
GSC
)
1917 1923 1928
1933 1948 1958
1964 1972 1982
nhcFraser River at Hope
Channel at WSC Metering Section, 1917 to 1982
March 2008 Figure 3.8

18
20
22
24
26
28
30
32
34
36
0 20 40 60 80 100 120 140 160 180 200 220 240 260
Distance from Left Bank (m)
Bed
Ele
vatio
n (m
GSC
)
29-Sep-01 16-Sep-00 28-Aug-9910-Sep-98 25-Jan-98 28-Aug-9719-Aug-96 2-Jul-95 3-Aug-943-Jun-93 22-Aug-92 25-Nov-91June 91 Dec 90 6-Jun-9021-Nov-89 18-Jun-89 29-Nov-888-May-86 30-Apr-85 Aug 84July 83
nhcFraser River at Hope
MOT Bridge Soundings - 30 m Upstream of Bridge Centreline
March 2008 Figure 3.9

-12
-10
-8
-6
-4
-2
0
2
4
6
0 100 200 300 400 500 600 700 800
Stationing from Left Bank (m)
Surv
eyed
Bed
Lev
el (m
GSC
)
2007 - Downstream
MIKE11 Section - Downstream
2007 - Upstream
MIKE11 Section - Upstream
nhcBathymetry Comparisons
Oak Street Bridge
March 2008 Figure 3.10

-10
-8
-6
-4
-2
0
2
4
6
0 100 200 300 400 500 600 700 800
Stationing from Left Bank (m)
Surv
eyed
Bed
Lev
el (m
GSC
)
2007 - Downstream
MIKE11 Section - Downstream
2007 - Upstream
MIKE11 Section - Upstream
nhcBathymetry Comparisons
Knight Street Bridge
March 2008 Figure 3.11
Notes:1. MIKE11 upstream and downstream sections based on same survey line.2. 2007 downstream section located 62 m upstream of MIKE11 section. No data available at MIKE11 section.3. 2007 upstream section located 31 m downstream of MIKE11 section. No data available at MIKE11 section.

-12
-10
-8
-6
-4
-2
0
2
4
6
8
0 50 100 150 200 250 300
Stationing from Left Bank (m)
Surv
eyed
Bed
Lev
el (m
GSC
)
2007 Survey Section
MIKE11 Section
nhcBathymetry ComparisonsQueensborough Bridge
March 2008 Figure 3.12

-20
-15
-10
-5
0
5
10
0 200 400 600 800 1000 1200 1400 1600
Stationing from Left Bank (m)
Surv
eyed
Bed
Lev
el (m
GSC
)
2007 Survey Section MIKE11 Section
nhcBathymetry Comparisons
Port Mann Bridge
March 2008 Figure 3.13
Notes:1. 2007 section located 120 m downstream of MIKE11 section. No data available at MIKE11 section.

-15
-10
-5
0
5
10
0 100 200 300 400 500 600 700 800 900 1000
Stationing from Left Bank (m)
Surv
eyed
Bed
Lev
el (m
GSC
)
2007 - Downstream
MIKE11 Section - Downstream
2007 - Upstream
MIKE11 Section - Upstream
nhcBathymetry Comparisons
Mission Road Bridge
March 2008 Figure 3.14
Notes:1. 2007 downstream section located 107 m upstream of MIKE11 section. No data available at MIKE11 section.2. 2007 upstream section located 160 m downstream of MIKE11 section. No data available at MIKE11 section.

0.026
0.027
0.028
0.029
0.030
0.031
0.032
0.033
6000 8000 10000 12000 14000 16000 18000
Flow (m3/s)
Man
ning
's R
ough
ness
Coe
ffici
ent
1972 & 1974 WSC Measurements
2007 Model Calibration/Verification
1950 Model Calibration/Verification
1948 Upper bound n-value
1948 Lower bound n-value
1948 Best est. n-valueRange of 2007Calibration Flows
Figure 3.1
nhcFraser River at MissionRoughness versus Flow
March 2008 Figure 4.1

Roughness revised due to model changes and additional data collected during 2007 freshet. All roughness values lie within theoretical bounds.
Model extended upstream to end of Harrison Lake to
reduce backwater influence on inflow boundary
NetworkBoundary
Flows adjusted (decreased) based on new rating curve
Hydraulic Loss
Water levels adjusted based on new lower model
Some simplification of network and of cross-
sections introduced to reduce unrealistic hydraulic losses
Specific hydraulic losses added at contractions, expansions and bends
Some gauge locations respecified in the models based on 2007 field assessment
Model solution algorithm changed from diffusive wave to fully hydrodynamic Figure 4.2
nhc
March 2008 Figure 4.2
Upper Model MIKE11 Updates

Harrison Lake at Harrison Hotsprings
10.0
10.5
11.0
11.5
12.0
12.5
13.0
1-Jun 3-Jun 5-Jun 7-Jun 9-Jun 11-Jun 13-Jun 15-Jun
Wat
er L
evel
(m G
SC)
Observed Modelled
nhcMerged Fraser Model
2007 Calibration
March 2008 Figure 4.3
Note: Inflows to Harrison Lake estimated

0.00
1.00
2.00
3.00
4.00
5.00
6.00
7.00
8.00
9.00
10.00
0 10 20 30 40 50 60 70 80 90
Chainage (km)
Wat
er L
evel
(m G
SC)
2007 Design Profile
2006 Design Profile
Stev
esto
n
New
Wes
tmin
ster
Port
Man
n
Mis
sion
nhcDesign Profile
Lower Model
March 2008 Figure 5.1
Who
nnoc
k

5.00
10.00
15.00
20.00
25.00
30.00
35.00
80 90 100 110 120 130 140 150 160
Chainage (km)
Wat
er L
evel
(m G
SC)
2007 Profile
2001 Profile
nhcDesign Profile
Upper Model
March 2008 Figure 5.2

DRAWINGS


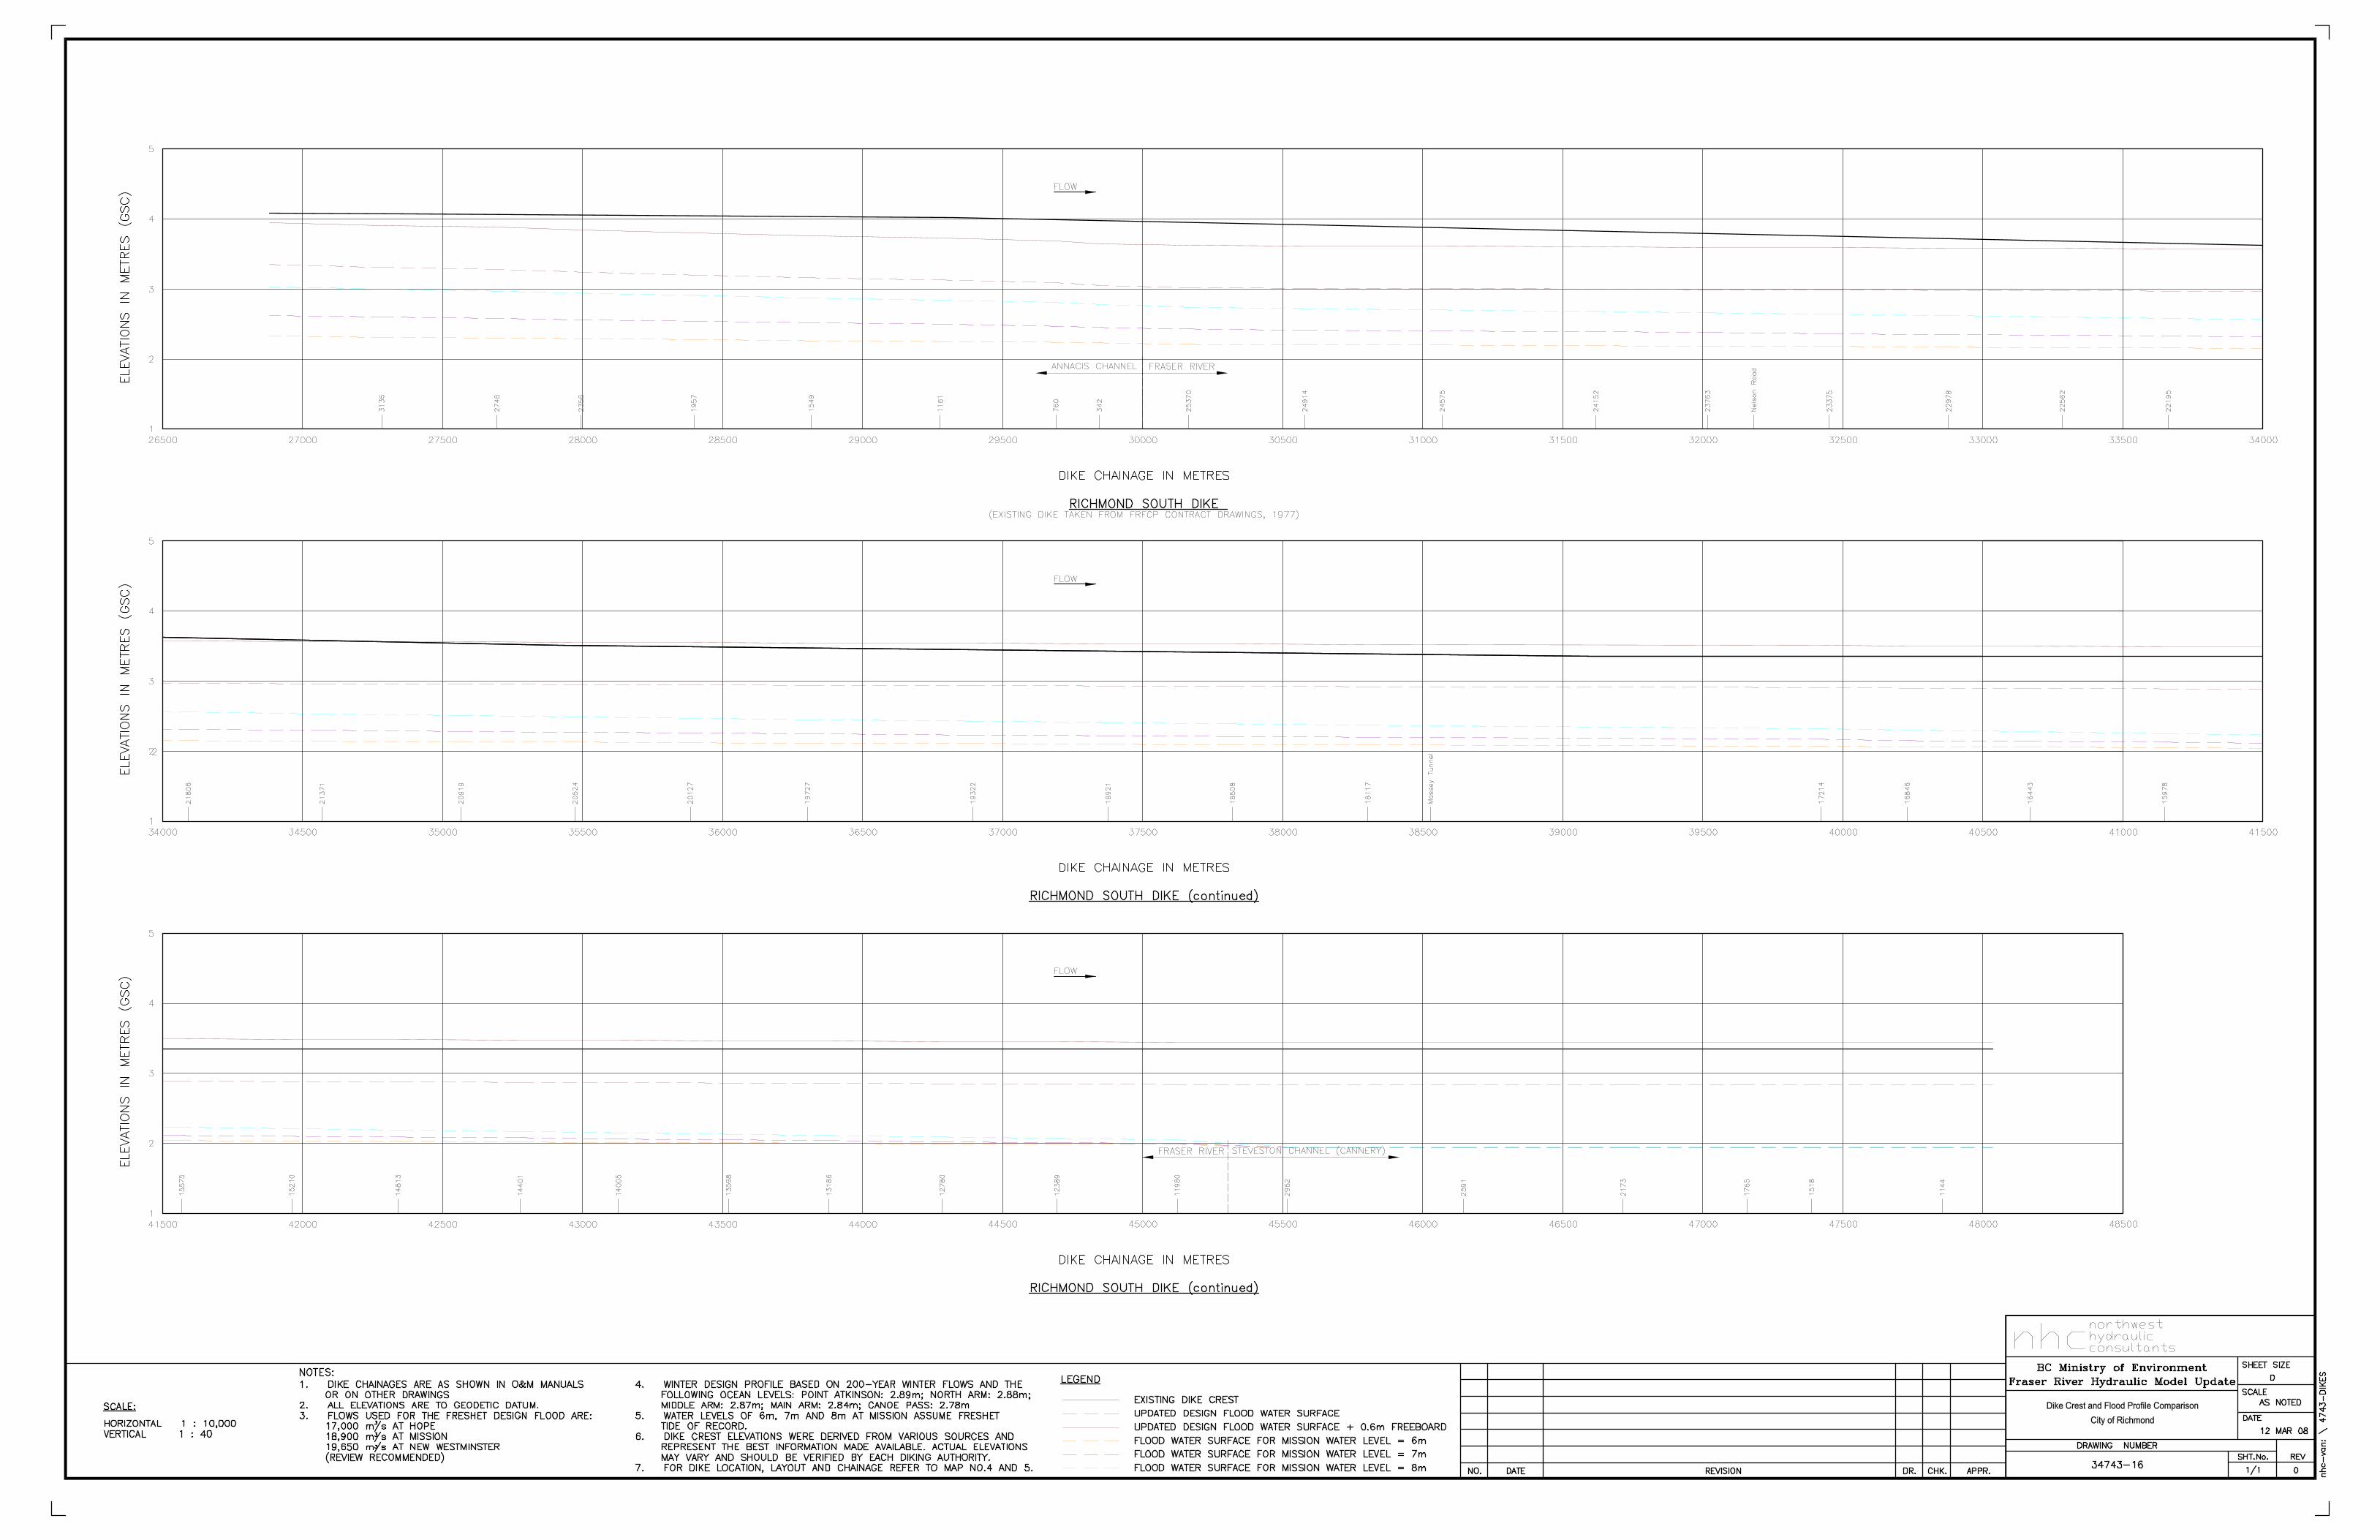


APPENDIX A
WSC INFORMATION

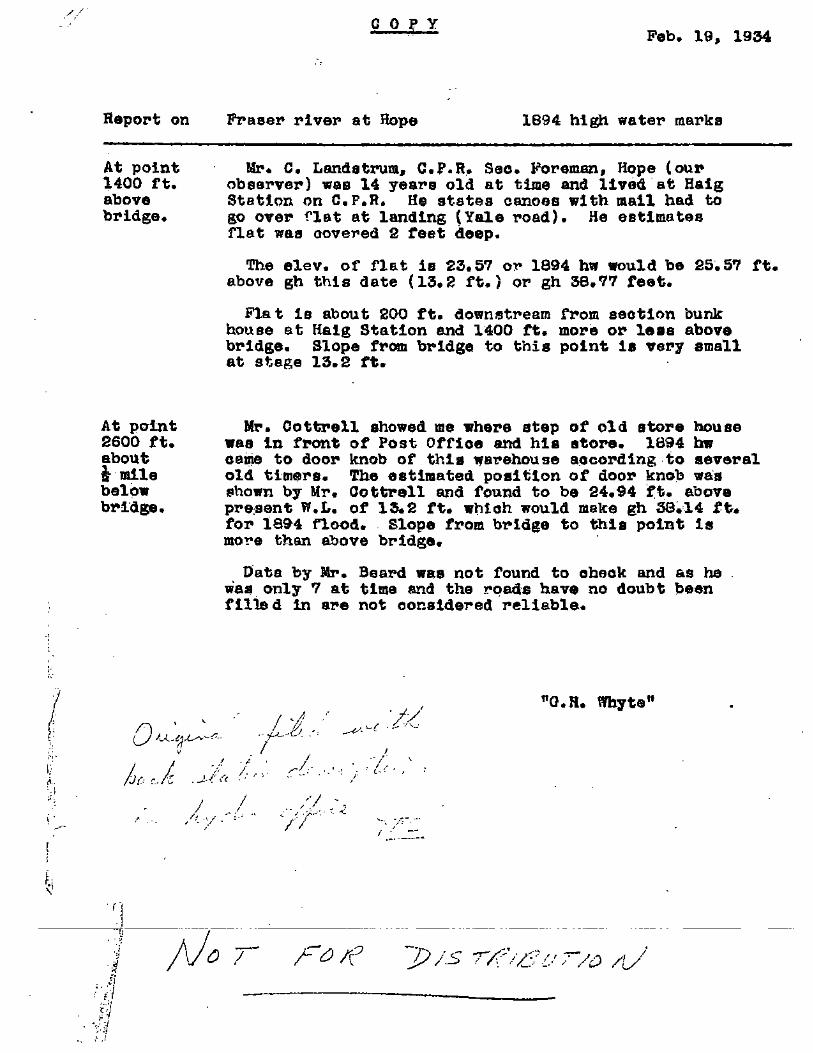

Environment Canada Environnement Canada Meteorological Service of Canada 201 - 401 Burrard St. Vancouver, BC V6C 3S5 Your file Votre référence November 16, 2007 Our file Notre reference Bruce Letvak, Head, Hydrology Programs & Standards Science and Information Branch BC Ministry of Environment PO Box 9358 Station Provincial Government Victoria V8W 9M2 Dear Mr. Letvak: Re: Fraser Flows at Hope and Mission gauges and Harrison River at Lake outlet Water Survey of Canada (WSC) wishes to reply to some of the statements made by Northwest Hydraulic Consultants (NHC) in their Memorandum of September 20th, 2007 to Ron Henry of MOE Surrey. Our purpose is three-fold; to correct some inaccuracies, to place the historical record in context and finally to try to define the questions that must be addressed if monitoring on the Fraser River is to provide information that can support modeling activities. Please see the following attachment. We look forward to working with you to improve our delivery of information and services to stakeholders based on the priorities you identify. Sincerely Yours Bruno Tassone, P. Eng. Manager, Water Survey Division Meteorological Service of Canada 201 - 401 Burrard St. Vancouver, BC V6C 3S5 Tel (604) 664-4003 Fax (604) 664-9004

Fraser Flows at Hope and Mission gauges and Harrison River at Lake outlet Measurement History The description of the history of measurements collected at Hope and Mission since 1989 was not fully accurate. For example, the memorandum states that no measurements were collected at Mission between 1989 and 1998 where as 17 measurements were collected during this period. Table 1 lists the measurements conducted at Hope and Mission from 1989 to the present day. While the picture presented by NHC may not have been fully accurate, it is clear that the number of measurements collected is not sufficient to clearly resolve the morphological dynamics of the river. There are two main reasons for this deficiency; firstly a reduction in funding to the program resulted in the loss of the infrastructure, in the form of boats and staff, required to deliver a monitoring program by conventional means. Secondly, in the absence of the ability to conduct conventional current meter measurements alternative technologies were being developed and employed. These new technologies, Moving Boat and ADCP, were in their infancy; hence protocols were evolving as were the experience and knowledge of our staff. We make these points not to justify our shortcomings but to emphasize our position that the delivery of high quality data for the Fraser River requires adequate dedicated resources in terms of trained staff, appropriate technology and equipment infrastructure. Fraser River at Hope Rating Curve The NHC Memorandum states that the 2007 measurements collected at Fraser River at Hope conform more closely to the 1964 curve than the current curve from 1987. While in a strictly numerical sense this is true it is worth considering the confidence bounds of WSC data and how they should be interpreted. WSC publishes data to a precision of ± 5%. This is not a computed confidence interval but a blanket estimate of uncertainty applied to all data which includes measurement error as well variability in the rating relation. While this estimate rests on sound knowledge and experimentation the actual precision of WSC data is dependent on site specific factors as well the efficacy of our methodology. The conditions at Fraser River at Hope can be considered extreme. At high flow the river is deep and fast; all measurements, be they conventional with a 300lb weight or ADCP measurements from a jet boat, are challenging to conduct. As NHC demonstrate in their memorandum, within-event hysterisis effects alone can introduce uncertainty on the order of ±5%. When evaluating whether a new rating curve should be applied at a particular station WSC considers whether a pervasive morphological change has occurred which will be detected by subsequent measurements. Given the characteristics of the Hope measurement site a suite of measurements is required to identify such a change. The history of measurements collected at Hope since 2001 indicates a shift in the curve due to aggradation that has occurred in the channel. Consequently a new curve, Curve #9, was drawn. This curve is based on the trend of the 17 measurements collected during this period, not on two measurements collected during 2007 which minimally exceed the ±5% criteria. Future considerations Precision of WSC Data The Fraser River Hydraulic Model is an important addition to the body of knowledge regarding the Fraser River and will become a valuable management tool. WSC fully supports this effort and wishes to provide the highest quality data possible.
2

It would be useful to determine the confidence level of discharge measurements, as well as discharges predicted by rating curves, which is required by NHC to support the water level predictions. This would allow WSC to assess the feasibility and cost of providing data to this level of precision. WSC publishes computed discharges to a precision of ±5%. The Fraser River Hydraulic model uses WSC discharge data as its primary input for calibration as well as the upstream boundary condition. The precision of water levels predicted by the model are dependent to some extent on the precision of the WSC discharge data. If the rating curve at Mission were used in reverse, to predict a water level, the uncertainty in the discharge would translate to an uncertainty band around the water level prediction. A discharge of 10 000 m³/s ±5% would translate to an uncertainty band of 0.5m around the water level prediction. While this may not be a fully valid analogy it would be prudent to ensure that the precision of the water level prediction made by the model is not assumed to be better than the precision of the calibration data. Real-time data considerations When the model is used in forecast mode care should be taken when comparing modeled water levels to observed water levels obtained via WSC’s real time web site. Water levels can drift from the reference datum for several reasons, such as orifice movements or sedimentation restricting intakes to wells. The real time data is uncorrected and subject to revision if station visits reveal a discrepancy between the water level at the reference gauge and the recorder. For example, in figure 3 of the NHC memorandum the water level observation collected on June 11 at15:50 in conjunction with the measurement plots 0.031m lower than the real-time water level. Once a correction has been applied to account for sensor drift, however, these two water levels are coincident. If the Fraser River Hydraulic Model is dependent on real time WSC data and if the validity of the model predictions is dependent on the quality of WSC real time data it may be necessary to perform quality assurance more frequently than normal WSC operations prescribe. Naturally, increased resources would be required to deliver an enhanced level of service. As mentioned by NHC, the discharge data for Harrison River requires correction for backwater effects from the Fraser during the freshet. WSC intends to develop a facility to enable this correction to be performed in near real time such that corrected discharge for Harrison River will be available on the real time site with a six or twelve hour delay. Alternate hydrometric methods for estimating discharge WSC generally estimates discharge using the stage-discharge method. Here a rating relation is derived between the river stage and the measured discharge. Stage, the depth of the river above a datum, is monitored continuously and the rating relation is used to estimate discharge. While this method is well established and widely used it is not the only method available. At Mission the tidal influence introduces variability into the rating relation. NHC modeled fluctuations in discharge caused by tidal fluctuations which the stage-discharge method could not replicate as it assumes a single possible discharge for each water level. It may be prudent to test the use of an index velocity model for computing discharge at this station. This method involves using an acoustic velocity meter to continuously monitor velocity, relating the velocity in an index volume to mean channel velocity and then calculating discharge based on the velocity and channel area. Channel area is computed from the measured stage. This method still requires calibration by numerous discharge measurements over the
3

range of expected flows and the model precision of the discharge prediction remains at ± 5%. As the velocity is monitored quasi-continuously the temporal resolution of the discharge data is improved and the influence of tidal backwater is removed as water level is not used to calculate discharge. It will likely take at least two field seasons to fully test and compare these methods. Acoustic velocity meters and the index velocity model have been used with success in numerous locations in Canada and the US. The conditions at Fraser River at Mission are suitable for the deployment of the equipment and execution of the technique. Table 1. History of measurements at Fraser River at Hope and Fraser River at Mission
Year Fraser River at Mission Discharge (m³/s) n 1989 5170, 6400, 7930, 4590, 4740 5 1990 7540, 10200, 7980, 3 1991 6980, 5860 2 1992 3140 1 1993 9425, 7530, 5026 3 1997 9852 1 1998 4902, 4003 2 1999 4774, 11045, 7887, 7068 4 2000 4287, 8203, 3920 3 2001 5916 1 2002 9469, 11183, 3053, 3 2003 2358, 5599, 2 2004 2370, 1 2005 5248 1 2006 4422, 2366, 2680, 3 2007 7450, 10500, 10548, 10600, 11200, 12100, 11500, 8760, 8751, 8755, 10
Year Fraser River at Hope Discharge (m³/s) n 1990 889, 5490, 8050, 6720 4 1991 971, 5030, 5100 3 1992 2140, 2150, 5620, 858 4 1993 1580 1 1994 753 1 1997 9728, 8324, 1848 3 1998 3314, 4038 2 1999 4587, 10626, 5388, 1543 4 2000 7631, 3339, 748 3 2001 4957, 1233 2 2002 3044, 7783, 8961 3 2003 882, 3320, 2440 3 2004 2680 1 2005 4760 1 2006 6150, 1750 2 2007 6240, 9830, 10300, 7400, 7123 5
4

APPENDIX B
CALIBRATION/VALIDATION PLOTS FOR LOWER MODEL
2007 Calibration 2002 Validation Plot
Number Gauge Name Plot Number Gauge Name
B-1 Fraser River (North Arm) at Vancouver B-29 Fraser River (North Arm) at Vancouver B-2 Bathslough B-30 Bathslough B-3 Fraser River at Byrne Creek B-31 Fraser River at Steveston (08MH028) B-4 Queensborough B-32 No. 6 Road B-5 Fraser River at Steveston (08MH028) B-33 Nelson Road B-6 3395 River Road B-34 New Westminster B-7 Elliott and River Road B-35 Manson B-8 62B and River Road B-36 Fraser River at Port Mann (08MH126) B-9 No. 6 Road B-37 Pitt River near Port Coquitlam (08MH035) B-10 Nelson Road B-38 192nd Street B-11 9600 River Road B-39 Salmon River Confluence B-12 New Westminster B-40 Fraser River at Whonnock (08MH044) B-13 Manson B-41 Fraser River at Mission (08MH024) B-14 Fraser River at Port Mann (08MH126) B-15 Pitt River at Argue Street B-16 Pitt River near Port Coquitlam (08MH035) B-17 Baynes Road B-18 192nd Street B-19 Yorkson PS B-20 GEB Burnco B-21 Salmon River Confluence B-22 Salmon River PS B-23 Albion Ferry Dock B-24 Fraser River at Whonnock (08MH044) B-25 Silverdale PS B-26 McLennan Creek PS B-27 Matsqui Slough B-28 Fraser River at Mission (08MH024)

Fraser River (North Arm) at Vancouver (08MH032)
-1.50
-1.00
-0.50
0.00
0.50
1.00
1.50
2.00
2.50
7-Jun 8-Jun 9-Jun 10-Jun 11-Jun 12-Jun 13-Jun 14-Jun
Wat
er L
evel
(m G
SC)
Observed Modelled
nhcLower Fraser Model
2007 Calibration
March 2008 Figure B.1

Bathslough
-1.00
-0.50
0.00
0.50
1.00
1.50
2.00
2.50
7-Jun 8-Jun 9-Jun 10-Jun 11-Jun 12-Jun 13-Jun 14-Jun
Wat
er L
evel
(m G
SC)
Observed Modelled
nhcLower Fraser Model
2007 Calibration
March 2008 Figure B.2

Fraser River at Byrne Creek
-1.00
-0.50
0.00
0.50
1.00
1.50
2.00
2.50
7-Jun 8-Jun 9-Jun 10-Jun 11-Jun 12-Jun 13-Jun 14-Jun
Wat
er L
evel
(m G
SC)
Observed Modelled
nhcLower Fraser Model
2007 Calibration
March 2008 Figure B.3

Queensborough
0.00
0.50
1.00
1.50
2.00
2.50
7-Jun 8-Jun 9-Jun 10-Jun 11-Jun 12-Jun 13-Jun 14-Jun
Wat
er L
evel
(m G
SC)
Observed Modelled
nhcLower Fraser Model
2007 Calibration
March 2008 Figure B.4

Fraser River at Steveston (08MH028)
-2.00
-1.50
-1.00
-0.50
0.00
0.50
1.00
1.50
2.00
7-Jun 8-Jun 9-Jun 10-Jun 11-Jun 12-Jun 13-Jun 14-Jun
Wat
er L
evel
(m G
SC)
Observed Modelled
nhcLower Fraser Model
2007 Calibration
March 2008 Figure B.5
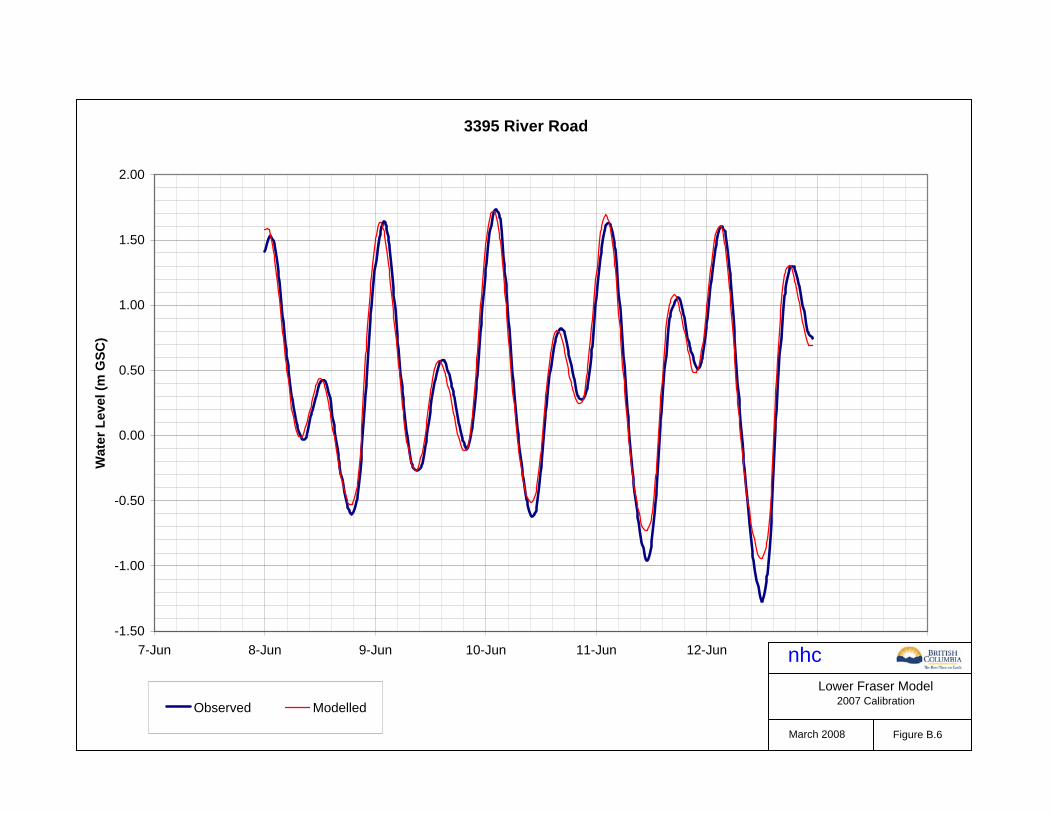
3395 River Road
-1.50
-1.00
-0.50
0.00
0.50
1.00
1.50
2.00
7-Jun 8-Jun 9-Jun 10-Jun 11-Jun 12-Jun 13-Jun 14-Jun
Wat
er L
evel
(m G
SC)
Observed Modelled
nhcLower Fraser Model
2007 Calibration
March 2008 Figure B.6
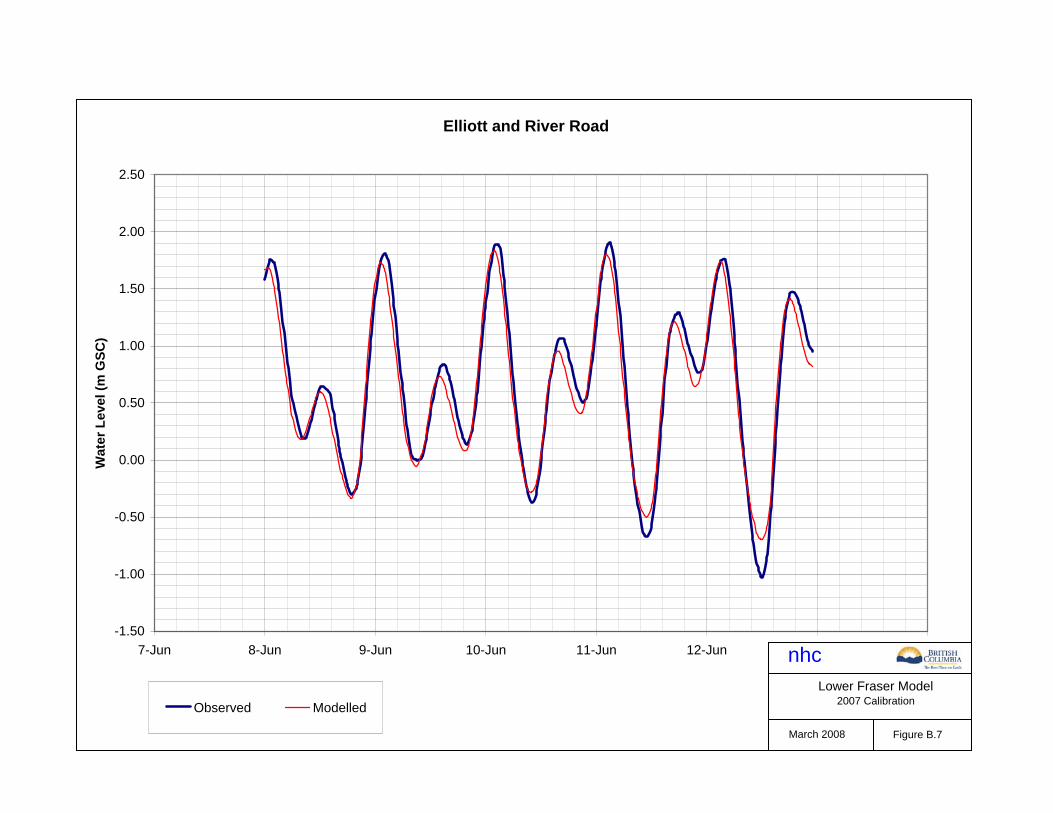
Elliott and River Road
-1.50
-1.00
-0.50
0.00
0.50
1.00
1.50
2.00
2.50
7-Jun 8-Jun 9-Jun 10-Jun 11-Jun 12-Jun 13-Jun 14-Jun
Wat
er L
evel
(m G
SC)
Observed Modelled
nhcLower Fraser Model
2007 Calibration
March 2008 Figure B.7

62B and River Road
-1.00
-0.50
0.00
0.50
1.00
1.50
2.00
2.50
7-Jun 8-Jun 9-Jun 10-Jun 11-Jun 12-Jun 13-Jun 14-Jun
Wat
er L
evel
(m G
SC)
Observed Modelled
nhcLower Fraser Model
2007 Calibration
March 2008 Figure B.8

No. 6 Road
-1.50
-1.00
-0.50
0.00
0.50
1.00
1.50
2.00
2.50
7-Jun 8-Jun 9-Jun 10-Jun 11-Jun 12-Jun 13-Jun 14-Jun
Wat
er L
evel
(m G
SC)
Observed Modelled
nhcLower Fraser Model
2007 Calibration
March 2008 Figure B.9

Nelson Road
-1.00
-0.50
0.00
0.50
1.00
1.50
2.00
2.50
7-Jun 8-Jun 9-Jun 10-Jun 11-Jun 12-Jun 13-Jun 14-Jun
Wat
er L
evel
(m G
SC)
Observed Modelled
nhcLower Fraser Model
2007 Calibration
March 2008 Figure B.10

9600 River Road
0.00
0.50
1.00
1.50
2.00
2.50
7-Jun 8-Jun 9-Jun 10-Jun 11-Jun 12-Jun 13-Jun 14-Jun
Wat
er L
evel
(m G
SC)
Observed Modelled
nhcLower Fraser Model
2007 Calibration
March 2008 Figure B.11

New Westminster
0.00
0.50
1.00
1.50
2.00
2.50
3.00
7-Jun 8-Jun 9-Jun 10-Jun 11-Jun 12-Jun 13-Jun 14-Jun
Wat
er L
evel
(m G
SC)
Observed Modelled
nhcLower Fraser Model
2007 Calibration
March 2008 Figure B.12

Manson
0.00
0.50
1.00
1.50
2.00
2.50
7-Jun 8-Jun 9-Jun 10-Jun 11-Jun 12-Jun 13-Jun 14-Jun
Wat
er L
evel
(m G
SC)
Observed Modelled
nhcLower Fraser Model
2007 Calibration
March 2008 Figure B.13

Fraser River at Port Mann (08MH126)
1.00
1.20
1.40
1.60
1.80
2.00
2.20
2.40
2.60
2.80
7-Jun 8-Jun 9-Jun 10-Jun 11-Jun 12-Jun 13-Jun 14-Jun
Wat
er L
evel
(m G
SC)
Observed ContinuousObserved StaffModelled
nhcLower Fraser Model
2007 Calibration
March 2008 Figure B.14

Pitt River at Argue Street
1.50
1.70
1.90
2.10
2.30
2.50
2.70
2.90
7-Jun 8-Jun 9-Jun 10-Jun 11-Jun 12-Jun 13-Jun 14-Jun
Wat
er L
evel
(m G
SC)
Observed Modelled
nhcLower Fraser Model
2007 Calibration
March 2008 Figure B.15

Pitt River near Port Coquitlam (08MH035)
1.5
1.7
1.9
2.1
2.3
2.5
2.7
2.9
7-Jun 8-Jun 9-Jun 10-Jun 11-Jun 12-Jun 13-Jun 14-Jun
Wat
er L
evel
(m G
SC)
Observed Modelled
nhcLower Fraser Model
2007 Calibration
March 2008 FigureB.16

Baynes Road
2.00
2.20
2.40
2.60
2.80
3.00
3.20
3.40
7-Jun 8-Jun 9-Jun 10-Jun 11-Jun 12-Jun 13-Jun 14-Jun
Wat
er L
evel
(m G
SC)
Observed Modelled
nhcLower Fraser Model
2007 Calibration
March 2008 Figure B.17

192nd Street
2.50
2.60
2.70
2.80
2.90
3.00
3.10
3.20
3.30
3.40
3.50
7-Jun 8-Jun 9-Jun 10-Jun 11-Jun 12-Jun 13-Jun 14-Jun
Wat
er L
evel
(m G
SC)
Observed Modelled
nhcLower Fraser Model
2007 Calibration
March 2008 Figure B.18

Yorkson PS
2.50
2.70
2.90
3.10
3.30
3.50
3.70
7-Jun 8-Jun 9-Jun 10-Jun 11-Jun 12-Jun 13-Jun 14-Jun
Wat
er L
evel
(m G
SC)
Observed Modelled
nhcLower Fraser Model
2007 Calibration
March 2008 Figure B.19

GEB Burnco
2.50
2.70
2.90
3.10
3.30
3.50
3.70
3.90
7-Jun 8-Jun 9-Jun 10-Jun 11-Jun 12-Jun 13-Jun 14-Jun
Wat
er L
evel
(m G
SC)
Observed Modelled
nhcLower Fraser Model
2007 Calibration
March 2008 Figure B.20
Note: Data from GEB Burnco gauge read hourly during workday.

Salmon River Confluence
3.60
3.70
3.80
3.90
4.00
4.10
4.20
4.30
4.40
7-Jun 8-Jun 9-Jun 10-Jun 11-Jun 12-Jun 13-Jun 14-Jun
Wat
er L
evel
(m G
SC)
Observed Modelled
nhcLower Fraser Model
2007 Calibration
March 2008 Figure B.21
Note: Significant data removed from data set.

Salmon River PS
3.60
3.70
3.80
3.90
4.00
4.10
4.20
4.30
7-Jun 8-Jun 9-Jun 10-Jun 11-Jun 12-Jun 13-Jun 14-Jun
Wat
er L
evel
(m G
SC)
Observed Modelled
nhcLower Fraser Model
2007 Calibration
March 2008 Figure B.22

Albion Ferry Dock
3.70
3.80
3.90
4.00
4.10
4.20
4.30
7-Jun 8-Jun 9-Jun 10-Jun 11-Jun 12-Jun 13-Jun 14-Jun
Wat
er L
evel
(m G
SC)
Observed Modelled
nhcLower Fraser Model
2007 Calibration
March 2008 FigureB.23

Fraser River at Whonnock (08MH044)
4.30
4.40
4.50
4.60
4.70
4.80
4.90
7-Jun 8-Jun 9-Jun 10-Jun 11-Jun 12-Jun 13-Jun 14-Jun
Wat
er L
evel
(m G
SC)
Observed Modelled
nhcLower Fraser Model
2007 Calibration
March 2008 Figure B.24

Silverdale PS
4.80
4.90
5.00
5.10
5.20
5.30
5.40
7-Jun 8-Jun 9-Jun 10-Jun 11-Jun 12-Jun 13-Jun 14-Jun
Wat
er L
evel
(m G
SC)
Observed Modelled
nhcLower Fraser Model
2007 Calibration
March 2008 Figure B.25

McLennan Creek PS
5.20
5.30
5.40
5.50
5.60
5.70
5.80
5.90
6.00
6.10
6.20
7-Jun 8-Jun 9-Jun 10-Jun 11-Jun 12-Jun 13-Jun 14-Jun
Wat
er L
evel
(m G
SC)
Observed Modelled
nhcLower Fraser Model
2007 Calibration
March 2008 Figure B.26
Note: Observed data for McLennan Creek PS gauge higher than for upstream gauges. Suspect datum to be verified.
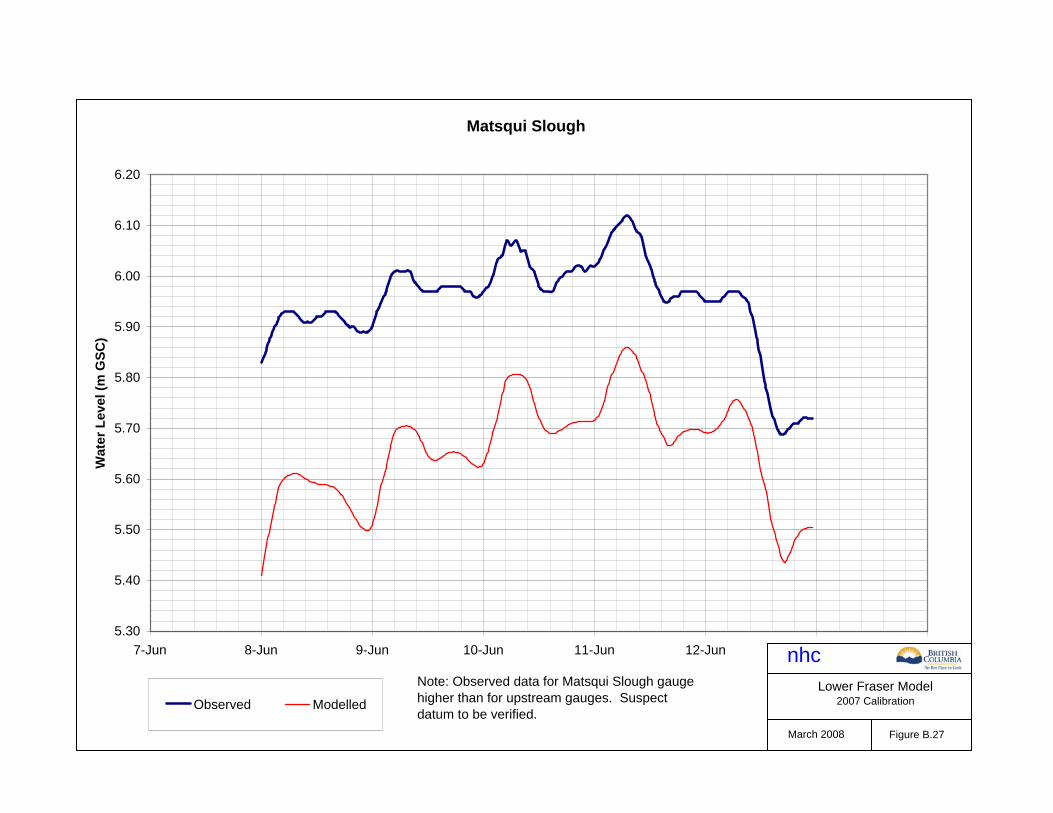
Matsqui Slough
5.30
5.40
5.50
5.60
5.70
5.80
5.90
6.00
6.10
6.20
7-Jun 8-Jun 9-Jun 10-Jun 11-Jun 12-Jun 13-Jun 14-Jun
Wat
er L
evel
(m G
SC)
Observed Modelled
nhcLower Fraser Model
2007 Calibration
March 2008 Figure B.27
Note: Observed data for Matsqui Slough gauge higher than for upstream gauges. Suspect datum to be verified.

Fraser River at Mission (08MH024)
5.65
5.70
5.75
5.80
5.85
5.90
5.95
6.00
6.05
6.10
6.15
7-Jun 8-Jun 9-Jun 10-Jun 11-Jun 12-Jun 13-Jun 14-Jun
Wat
er L
evel
(m G
SC)
Observed ContinuousObserved StaffModelled
nhcLower Fraser Model
2007 Calibration
March 2008 Figure B.28
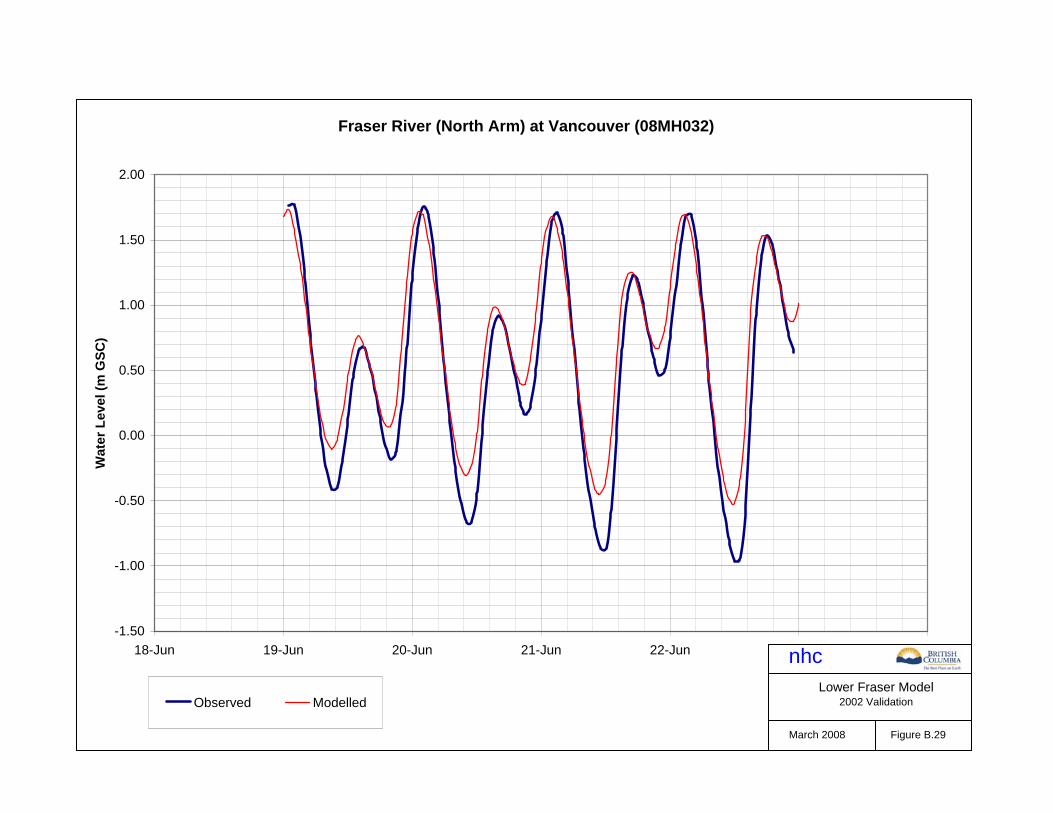
Fraser River (North Arm) at Vancouver (08MH032)
-1.50
-1.00
-0.50
0.00
0.50
1.00
1.50
2.00
18-Jun 19-Jun 20-Jun 21-Jun 22-Jun 23-Jun 24-Jun
Wat
er L
evel
(m G
SC)
Observed Modelled
nhcLower Fraser Model
2002 Validation
March 2008 Figure B.29

Bathslough
-1.00
-0.50
0.00
0.50
1.00
1.50
2.00
2.50
18-Jun 19-Jun 20-Jun 21-Jun 22-Jun 23-Jun 24-Jun
Wat
er L
evel
(m G
SC)
Observed Modelled
nhcLower Fraser Model
2002 Validation
March 2008 Figure B.30
Note: Bathslough gauge datum updated in 2007 due to dike settlement. Unknown datum in 2002.

Fraser River at Steveston (08MH028)
-2.00
-1.50
-1.00
-0.50
0.00
0.50
1.00
1.50
2.00
18-Jun 19-Jun 20-Jun 21-Jun 22-Jun 23-Jun 24-Jun
Wat
er L
evel
(m G
SC)
Observed Modelled
nhcLower Fraser Model
2002 Validation
March 2008 Figure B.31

No. 6 Road
-1.00
-0.50
0.00
0.50
1.00
1.50
2.00
18-Jun 19-Jun 20-Jun 21-Jun 22-Jun 23-Jun 24-Jun
Wat
er L
evel
(m G
SC)
Observed Modelled
nhcLower Fraser Model
2002 Validation
March 2008 Figure B.32
Note: No. 6 Road gauge datum updated in 2007 due to dike settlement. Unknown datum in 2002.

Nelson Road
-0.50
0.00
0.50
1.00
1.50
2.00
18-Jun 19-Jun 20-Jun 21-Jun 22-Jun 23-Jun 24-Jun
Wat
er L
evel
(m G
SC)
Observed Modelled
nhcLower Fraser Model
2002 Validation
March 2008 Figure B.33
Note: Nelson Road gauge datum updatedin 2007 due to dike settlement. Unknown datum in 2002.

New Westminster
0.50
0.70
0.90
1.10
1.30
1.50
1.70
1.90
2.10
2.30
2.50
18-Jun 19-Jun 20-Jun 21-Jun 22-Jun 23-Jun 24-Jun
Wat
er L
evel
(m G
SC)
Observed Modelled
nhcLower Fraser Model
2002 Validation
March 2008 Figure B.34

Manson
0.00
0.50
1.00
1.50
2.00
2.50
18-Jun 19-Jun 20-Jun 21-Jun 22-Jun 23-Jun 24-Jun
Wat
er L
evel
(m G
SC)
Observed Modelled
nhcLower Fraser Model
2002 Validation
March 2008 Figure B.35
Note: Manson gauge is near same location as New Westminster gauge but shows different recorded levels.

Fraser River at Port Mann (08MH126)
1.00
1.20
1.40
1.60
1.80
2.00
2.20
2.40
2.60
2.80
18-Jun 19-Jun 20-Jun 21-Jun 22-Jun 23-Jun 24-Jun
Wat
er L
evel
(m G
SC)
Observed Modelled
nhcLower Fraser Model
2002 Validation
March 2008 Figure B.36

Pitt River near Port Coquitlam (08MH035)
1.90
2.00
2.10
2.20
2.30
2.40
2.50
2.60
2.70
2.80
18-Jun 19-Jun 20-Jun 21-Jun 22-Jun 23-Jun 24-Jun
Wat
er L
evel
(m G
SC)
Observed Modelled
nhcLower Fraser Model
2002 Validation
March 2008 Figure B.37
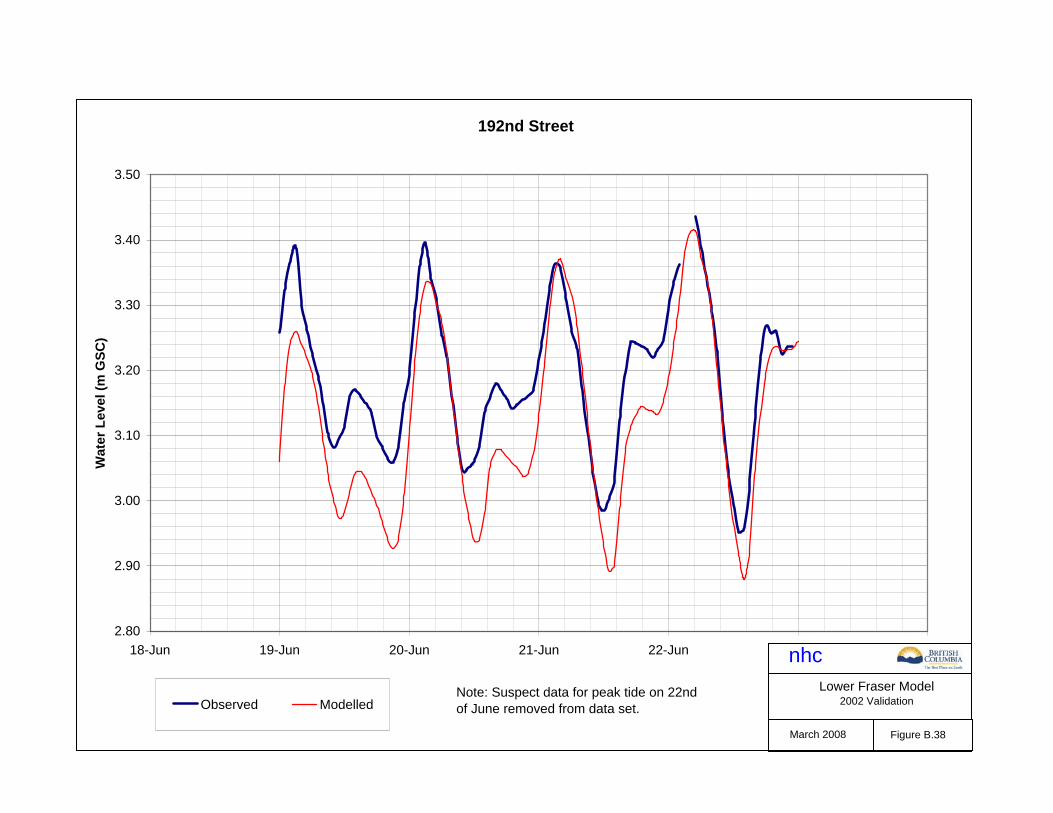
192nd Street
2.80
2.90
3.00
3.10
3.20
3.30
3.40
3.50
18-Jun 19-Jun 20-Jun 21-Jun 22-Jun 23-Jun 24-Jun
Wat
er L
evel
(m G
SC)
Observed Modelled
nhcLower Fraser Model
2002 Validation
March 2008 Figure B.38
Note: Suspect data for peak tide on 22nd of June removed from data set.

Salmon River Confluence
3.70
3.80
3.90
4.00
4.10
4.20
4.30
18-Jun 19-Jun 20-Jun 21-Jun 22-Jun 23-Jun 24-Jun
Wat
er L
evel
(m G
SC)
Observed Modelled
nhcLower Fraser Model
2002 Validation
March 2008 Figure B.39
Note: Salmon River Confluence gauge not reading peak levels correctly.

Fraser River at Whonnock (08MH044)
4.50
4.55
4.60
4.65
4.70
4.75
4.80
4.85
4.90
18-Jun 19-Jun 20-Jun 21-Jun 22-Jun 23-Jun 24-Jun
Wat
er L
evel
(m G
SC)
Observed Modelled
nhcLower Fraser Model
2002 Validation
March 2008 Figure B.40

Fraser River at Mission (08MH024)
5.85
5.90
5.95
6.00
6.05
6.10
6.15
18-Jun 19-Jun 20-Jun 21-Jun 22-Jun 23-Jun 24-Jun
Wat
er L
evel
(m G
SC)
Observed Modelled
nhcLower Fraser Model
2002 Validation
March 2008 Figure B.41

APPENDIX C
ROUGHNESS FROM ADCP DATA

1
SCOPE AND APPROACH This memo summarizes the results of a novel approach to estimate riverbed roughness from velocity data collected in the Fraser River at Mission using Acoustic Doppler Current Profilers (ADCP) mounted on moving boats. Roughness height (ks) and shear velocity (u*) are computed by log-fitting measured vertical velocity profiles u(z) as shown in Figure 1, using the equation:
⎟⎟⎠
⎞⎜⎜⎝
⎛=
skz
uzu 30log
4.01
*)(
Where z is the vertical coordinate measured from the bed upwards. The main challenge of this approach is the high level of noise in the data (Figure 1) caused by turbulent fluctuations. Using ADCP data requires the application of an averaging strategy in order to filter-out the noise. At some verticals, unphysical values of negative shear velocity (u* < 0) can occur. Sime et al. (2006) discarded those negative values and found the resulting shear stress (and shear velocity) to be overestimated, concluding that it was not advisable to log-fit shear velocity for estimating bed roughness or bed shear stress. In the new approach introduced here, first a number of vertical ADCP measurements (ensembles) are averaged laterally using a span-wise averaging step (Δs); then these averaged vertically are used to compute u* . Finally, the transect-averaged shear velocity U* is found simply by arithmetically averaging all the computed u* values, including the negative ones. Manning’s roughness n is computed as:
gH
UUn
6/1*⎟⎠⎞
⎜⎝⎛=
where, U and H are the ADCP transect-averaged values of flow velocity and water depth respectively.
nhc
memorandum
northwest hydraulic
consultants
30 Gostick PlaceNorth Vancouver, BC
V7M 3G3, CanadaTel: 604-980-6011Fax: 604-980-9264
email: [email protected]
To: FILE Date: 5-Feb-2008
From: Jose (Pepe) Vasquez (nhc) No. Pages: 7
CC: Project No.: 3-4743
Ref. No.: Re: Roughness from ADCP Data
Fraser River Hydraulic Model Update

nhc
ADCP Roughness at Mission Fraser River Hydraulic Model Update 2
DATA AND RESULTS Figure 2 shows the Manning’s roughness values computed from ADCP data collected in the Fraser River at Mission by Water Survey of Canada (WSC) on June 5, 6, 11, 12 and 18, 2007 (circles); and by nhc on June 7, 2007 (diamonds). A total of 35 flow measurements collected by WSC were used to compute roughness, the average discharge and roughness values for each day are shown in Table 1. Five measurements collected by nhc were also used for the same purpose, the results for each discharge are shown in Table 2. The results from nhc ADCP data are consistently lower than those computed from WSC data (Figure 1). The average Manning’s roughness for WSC data is n = 0.038 ± 0.003 (Table 1); while for nhc data it is n = 0.031 ± 0.002 (Table 2). The reason for this discrepancy is unclear, but it is probably a consequence of the different ADCP instrument settings used during the field surveys (Figure 3) and missing ensembles in nhc data (Figure 4). Notably, the bin size used by WSC’s ADCP was 50 cm; while nhc’s ADCP used half that value. Values in Tables 1 and 2 were computed from data post-processed by the program ADCP XP (Kim et al. 2007). This program can use different lateral span-wise averaging steps (Δs) to compute both shear velocities u* and depth-averaged flow velocities u. The computed Manning’s roughness is quite sensitive to Δs. For the WSC data, Δs = 2.0 m was adopted for both u and u*. For nhc’s data, because of several missing pings (Figure 4), ADCP XP crashed if Δs < 6.0 m, therefore Δs = 6.0 m was adopted for u*. u was computed without lateral averaging; which led to a lower (negatively biased) transect-averaged velocity U for nch results; which may be another source for discrepancy between the results derived from the two data sets. The roughness values from the WSC –although positively biased- show a weak decrease with discharge (Figure 2, Table 2). The minimum roughness is achieved during the peak flow. Post-peak roughness appears to remain lower than pre-peak values; as if the peak flow had smoothed bedforms. However, these subtle changes in roughness are in the range of the computed scatter and hence are too small to be conclusive. The new approach introduced here for estimating roughness appears promising, as no other quick approach for measuring roughness in the field presently exists. Since this method uses ADCP data collected from routine flow measurements, no additional field effort is required. Considering the high level of noise in the data, the resulting coefficient of variation (CoV) shown in Tables 1 and 2 is not excessively high, proving the results are consistent, although biased. This attempt to calculate roughness identified limitations with the available data. It is recommended that additional ADCP measurements be performed to investigate the effects of instrument settings on the results, especially the bin size. Measurements using fixed ADCPs (e.g. boat anchored or tethered to the bridge) are also recommended to eliminate turbulent noise by long time-averaging.

nhc
ADCP Roughness at Mission Fraser River Hydraulic Model Update 3
REFERENCES Kim, D., Muste, M., Weber, L. and Asman, R. (2007). “Getting to know AdcpXP: ADCP eXtended Processing”. IIHR- Hydroscience & Engineering, University of Iowa. Sime, L.C., Ferguson, R.I. and Church, M. (2007). “Estimating shear stress from moving boat acoustic Doppler velocity measurements in a large gravel bed river”. Water Resources Research, Vol. 43, W03418, doi:10.1029/2006WR005069.
Table 1. Daily averaged results for WSC data (2007).
Survey Spanwise Discharge Manning's Date step (m) (m3/s) Roughness
May 24 2 7445 0.039 June 5 2 10526 0.038 June 6 2 11303 0.039
June 11 2 12147 0.035 June 12 2 11463 0.037 June 18 2 8760 0.037 mean 0.038 st. dev 0.003 CoV 7%
Table 2. Summary of results for nhc data (June 7, 2007).
Transect Spanwise Discharge Manning's Number step (m) (m3/s) Roughness140906 6 10983 0.030 142004 6 11276 0.035 143938 6 11347 0.031 145422 6 11009 0.028 150026 6 11362 0.030
mean 0.031 st. dev 0.002 CoV 8%
st. dev. = standard deviation CoV = coefficient of variation = (st. dev.) / (mean)

nhc
ADCP Roughness at Mission Fraser River Hydraulic Model Update 4
a) Transverse depth-averaged velocity profile
b) Vertical velocity profiles u(z)
Figure 1 Examples of (a) depth-averaged transverse velocity profiles and (b) vertical velocity profiles measured by ADCP in the Fraser River at Mission (WSC Transect 08mh024_20070611002).
z

nhc
ADCP Roughness at Mission Fraser River Hydraulic Model Update 5
ADCP Roughness Fraser River at Mission
0.000
0.005
0.010
0.015
0.020
0.025
0.030
0.035
0.040
0.045
0.050
6000 7000 8000 9000 10000 11000 12000 13000
Discharge (m3/s)
Man
ning
's n
nhc June 7 25-May 6-Jun 5-Jun 11-Jun 12-Jun 18-Jun
3-4743\ADCP\ADCP_Mission_WSC+nhc.xls
June 11
June 7
May 25 June 5 June 6June 18
June 12
Figure 2 Manning’s roughness, Fraser River at Mission, computed from 2007 ADCP data (diamonds are nhc data and circles WSC data).

nhc
ADCP Roughness at Mission Fraser River Hydraulic Model Update 6
Figure 3 ADCP configuration settings for both WSC and nhc instruments. BX = maximum tracking depth [1/10 m]; WN = number of depth cells; WS = bin size [cm]; TP = time between pings [1/100 s]; WV = maximum relative velocity between boat and water [cm/s].
WSC
nhc

nhc
ADCP Roughness at Mission Fraser River Hydraulic Model Update 7
.
Figure 4 Example of ADCP transects surveyed by nhc.
140906
150026
145422

APPENDIX D
CALIBRATION/VALIDATION PLOTS FOR UPPER MODEL
1999 Calibration 2007 Validation Plot
Number Gauge Name Plot Number Gauge Name
D-1 Dewdney PS D-22 Fraser River at Mission (08MH024) D-2 Robson PS D-23 Dewdney PS D-3 McGillivray Slough PS D-24 Robson PS D-4 Collinson PS D-25 McGillivray Slough PS D-5 Quaamitch Slough D-26 Collinson PS D-6 Chilliwack Creek PS (Wolfe Road) D-27 Quaamitch Slough D-7 Hope Slough at Young Street D-28 Chilliwack Creek PS (Wolfe Road) D-8 Bell Dam D-29 Hope Slough at Young Street D-9 Minto Landing Area (Bell Slough) D-30 Bell Dam D-10 Harrison Mills (Kilby) D-31 Minto Landing Area (Bell Slough) D-11 Scowlitz (Harrison Bay) D-32 Harrison Mills (Kilby) D-12 Duncan Bateson PS D-33 Duncan Bateson PS D-13 Carey Point D-34 Harrison River below Morris Creek D-14 Hammersley PS D-35 Carey Point D-15 Chip (Camp-Hope) Intake D-36 Hammersley PS D-16 Agassiz-Rosedale Bridge D-37 Chip (Camp-Hope) Intake D-17 Maria Slough D-38 Agassiz-Rosedale Bridge D-18 Herrling Island D-39 Cuthbert Road D-19 Seabird Island D-40 Maria Slough D-20 Johnson Slough D-41 Herrling Island D-21 Wahleach (Jones Creek) D-42 Johnson Slough
D-43 Wahleach Powerhouse D-44 Wahleach (Jones Creek)

Dewdney PS
6.00
6.10
6.20
6.30
6.40
6.50
6.60
6.70
6.80
6.90
7.00
17-Jun 18-Jun 19-Jun 20-Jun 21-Jun 22-Jun 23-Jun 24-Jun 25-Jun 26-Jun
Wat
er L
evel
(m G
SC)
Observed Modelled
nhcUpper Fraser Model
1999 Calibration
March 2008 Figure D.1

Robson PS
6.40
6.50
6.60
6.70
6.80
6.90
7.00
7.10
7.20
7.30
17-Jun 18-Jun 19-Jun 20-Jun 21-Jun 22-Jun 23-Jun 24-Jun 25-Jun 26-Jun
Wat
er L
evel
(m G
SC)
Observed Modelled
nhcUpper Fraser Model
1999 Calibration
March 2008 Figure D.2

McGillivray Slough PS
6.90
7.00
7.10
7.20
7.30
7.40
7.50
7.60
7.70
17-Jun 18-Jun 19-Jun 20-Jun 21-Jun 22-Jun 23-Jun 24-Jun 25-Jun 26-Jun
Wat
er L
evel
(m G
SC)
Observed Modelled
nhcUpper Fraser Model
1999 Calibration
March 2008 Figure D.3

Collinson PS
7.00
7.10
7.20
7.30
7.40
7.50
7.60
7.70
7.80
17-Jun 18-Jun 19-Jun 20-Jun 21-Jun 22-Jun 23-Jun 24-Jun 25-Jun 26-Jun
Wat
er L
evel
(m G
SC)
Observed Modelled
nhcUpper Fraser Model
1999 Calibration
March 2008 Figure D.4

Quaamitch Slough
7.30
7.40
7.50
7.60
7.70
7.80
7.90
8.00
8.10
17-Jun 18-Jun 19-Jun 20-Jun 21-Jun 22-Jun 23-Jun 24-Jun 25-Jun 26-Jun
Wat
er L
evel
(m G
SC)
Observed Modelled
nhcUpper Fraser Model
1999 Calibration
March 2008 Figure D.5

Chilliwack Creek PS (Wolfe Road)
8.00
8.50
9.00
9.50
10.00
10.50
17-Jun 18-Jun 19-Jun 20-Jun 21-Jun 22-Jun 23-Jun 24-Jun 25-Jun 26-Jun
Wat
er L
evel
(m G
SC)
Observed Modelled
nhcUpper Fraser Model
1999 Calibration
March 2008 Figure D.6
Note: Suspect data recorded on 20th and 21st. Pump station may have been operating.

Hope Slough at Young Street
8.70
8.80
8.90
9.00
9.10
9.20
9.30
17-Jun 18-Jun 19-Jun 20-Jun 21-Jun 22-Jun 23-Jun 24-Jun 25-Jun 26-Jun
Wat
er L
evel
(m G
SC)
Observed Modelled
nhcUpper Fraser Model
1999 Calibration
March 2008 Figure D.7

Bell Dam
6.00
6.50
7.00
7.50
8.00
8.50
9.00
9.50
10.00
17-Jun 18-Jun 19-Jun 20-Jun 21-Jun 22-Jun 23-Jun 24-Jun 25-Jun 26-Jun
Wat
er L
evel
(m G
SC)
Observed Modelled
nhcUpper Fraser Model
1999 Calibration
March 2008 Figure D.8

Minto Landing Area (Bell Slough)
10.50
10.60
10.70
10.80
10.90
11.00
11.10
17-Jun 18-Jun 19-Jun 20-Jun 21-Jun 22-Jun 23-Jun 24-Jun 25-Jun 26-Jun
Wat
er L
evel
(m G
SC)
Observed Modelled
nhcUpper Fraser Model
1999 Calibration
March 2008 Figure D.9

Harrison Mills (Kilby)
11.20
11.30
11.40
11.50
11.60
11.70
11.80
11.90
17-Jun 18-Jun 19-Jun 20-Jun 21-Jun 22-Jun 23-Jun 24-Jun 25-Jun 26-Jun
Wat
er L
evel
(m G
SC)
Observed Modelled
nhcUpper Fraser Model
1999 Calibration
March 2008 Figure D.10

Scowlitz (Harrison Bay)
11.40
11.45
11.50
11.55
11.60
11.65
11.70
11.75
11.80
11.85
11.90
11.95
17-Jun 18-Jun 19-Jun 20-Jun 21-Jun 22-Jun 23-Jun 24-Jun 25-Jun 26-Jun
Wat
er L
evel
(m G
SC)
Observed Modelled
nhcUpper Fraser Model
1999 Calibration
March 2008 Figure D.11

Duncan Bateson PS
11.40
11.50
11.60
11.70
11.80
11.90
12.00
17-Jun 18-Jun 19-Jun 20-Jun 21-Jun 22-Jun 23-Jun 24-Jun 25-Jun 26-Jun
Wat
er L
evel
(m G
SC)
Observed Modelled
nhcUpper Fraser Model
1999 Calibration
March 2008 Figure D.12
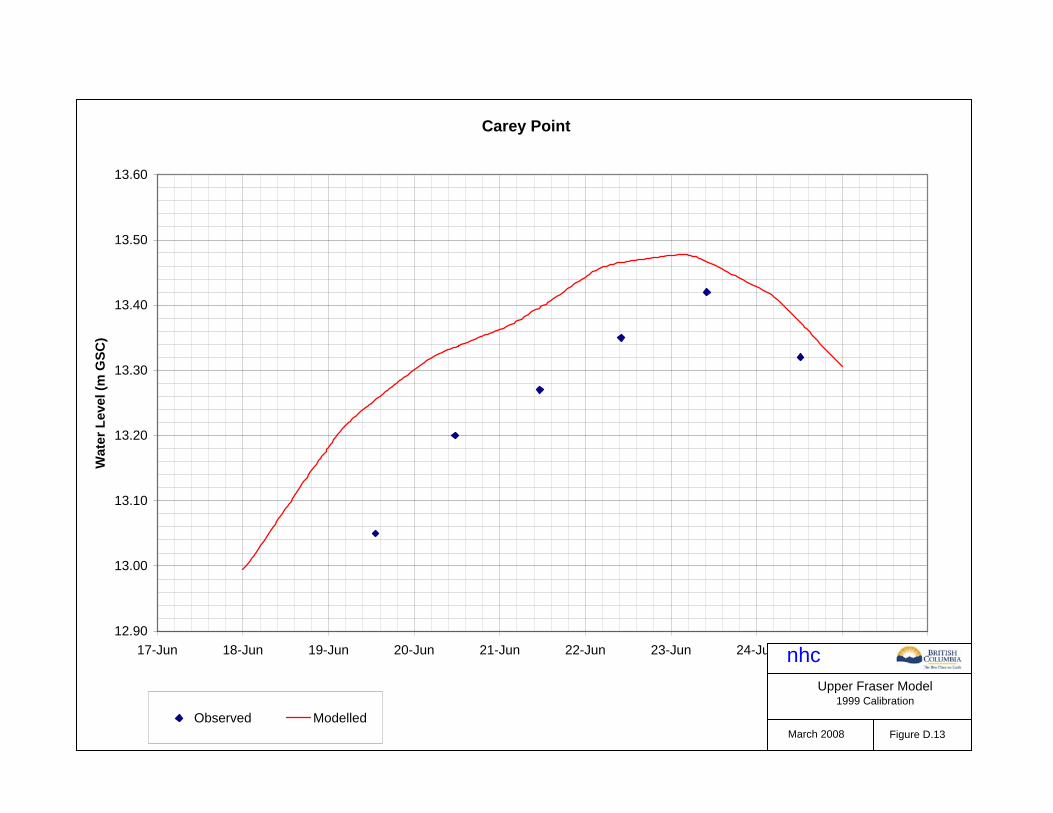
Carey Point
12.90
13.00
13.10
13.20
13.30
13.40
13.50
13.60
17-Jun 18-Jun 19-Jun 20-Jun 21-Jun 22-Jun 23-Jun 24-Jun 25-Jun 26-Jun
Wat
er L
evel
(m G
SC)
Observed Modelled
nhcUpper Fraser Model
1999 Calibration
March 2008 Figure D.13
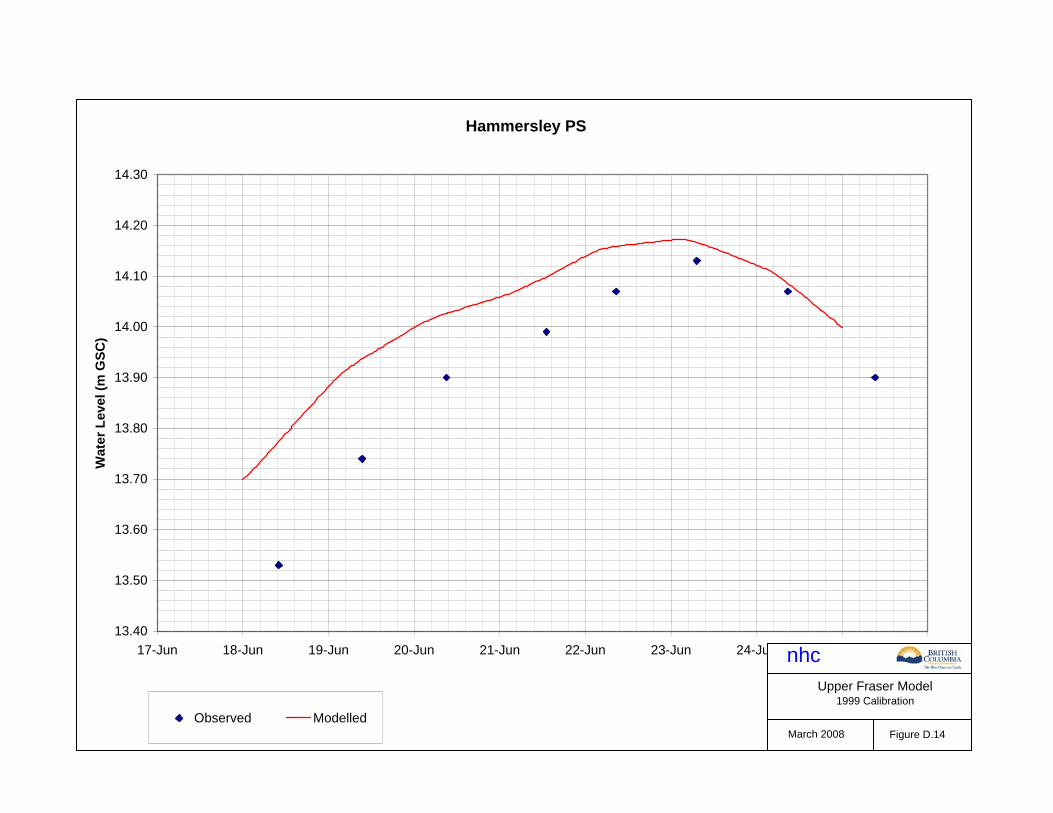
Hammersley PS
13.40
13.50
13.60
13.70
13.80
13.90
14.00
14.10
14.20
14.30
17-Jun 18-Jun 19-Jun 20-Jun 21-Jun 22-Jun 23-Jun 24-Jun 25-Jun 26-Jun
Wat
er L
evel
(m G
SC)
Observed Modelled
nhcUpper Fraser Model
1999 Calibration
March 2008 Figure D.14

Chip (Camp-Hope) Intake
16.10
16.20
16.30
16.40
16.50
16.60
16.70
16.80
16.90
17-Jun 18-Jun 19-Jun 20-Jun 21-Jun 22-Jun 23-Jun 24-Jun 25-Jun 26-Jun
Wat
er L
evel
(m G
SC)
Observed Modelled
nhcUpper Fraser Model
1999 Calibration
March 2008 Figure D.15

Agassiz-Rosedale Bridge
16.55
16.60
16.65
16.70
16.75
16.80
16.85
16.90
16.95
17.00
17.05
17-Jun 18-Jun 19-Jun 20-Jun 21-Jun 22-Jun 23-Jun 24-Jun 25-Jun 26-Jun
Wat
er L
evel
(m G
SC)
Observed - North Observed - South Modelled
nhcUpper Fraser Model
1999 Calibration
March 2008 Figure D.16

Maria Slough
18.50
18.60
18.70
18.80
18.90
19.00
19.10
19.20
19.30
19.40
17-Jun 18-Jun 19-Jun 20-Jun 21-Jun 22-Jun 23-Jun 24-Jun 25-Jun 26-Jun
Wat
er L
evel
(m G
SC)
Observed Modelled
nhcUpper Fraser Model
1999 Calibration
March 2008 Figure D.17
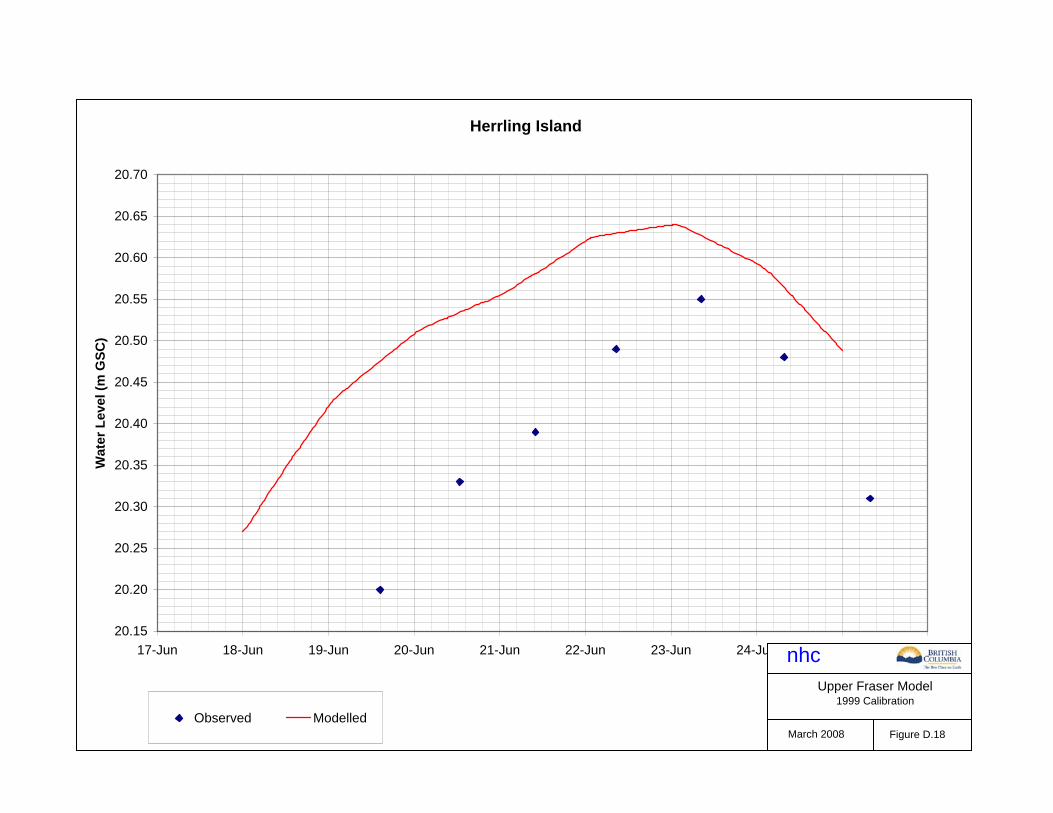
Herrling Island
20.15
20.20
20.25
20.30
20.35
20.40
20.45
20.50
20.55
20.60
20.65
20.70
17-Jun 18-Jun 19-Jun 20-Jun 21-Jun 22-Jun 23-Jun 24-Jun 25-Jun 26-Jun
Wat
er L
evel
(m G
SC)
Observed Modelled
nhcUpper Fraser Model
1999 Calibration
March 2008 Figure D.18
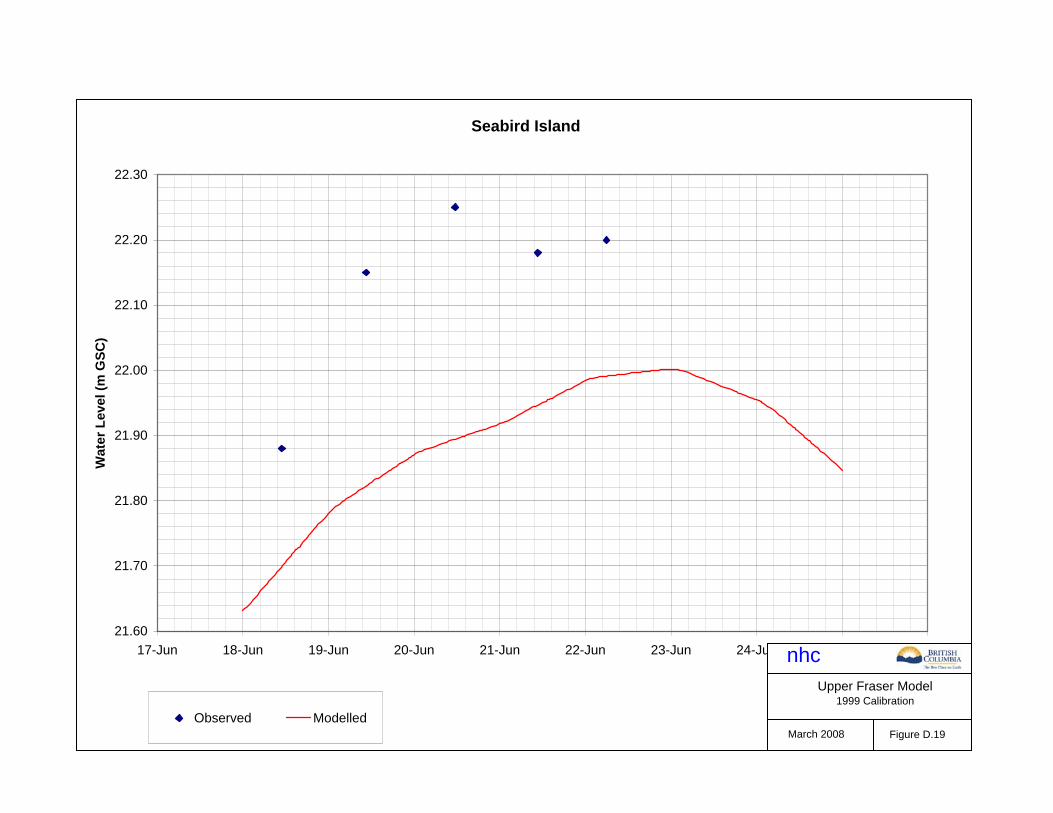
Seabird Island
21.60
21.70
21.80
21.90
22.00
22.10
22.20
22.30
17-Jun 18-Jun 19-Jun 20-Jun 21-Jun 22-Jun 23-Jun 24-Jun 25-Jun 26-Jun
Wat
er L
evel
(m G
SC)
Observed Modelled
nhcUpper Fraser Model
1999 Calibration
March 2008 Figure D.19

Johnson Slough
26.20
26.30
26.40
26.50
26.60
26.70
26.80
26.90
27.00
17-Jun 18-Jun 19-Jun 20-Jun 21-Jun 22-Jun 23-Jun 24-Jun 25-Jun 26-Jun
Wat
er L
evel
(m G
SC)
Observed Modelled
nhcUpper Fraser Model
1999 Calibration
March 2008 Figure D.20

Wahleach (Jones Creek)
26.40
26.50
26.60
26.70
26.80
26.90
27.00
27.10
17-Jun 18-Jun 19-Jun 20-Jun 21-Jun 22-Jun 23-Jun 24-Jun 25-Jun 26-Jun
Wat
er L
evel
(m G
SC)
Observed Modelled
nhcUpper Fraser Model
1999 Calibration
March 2008 Figure D.21

Fraser River at Mission (08MH024)
5.65
5.70
5.75
5.80
5.85
5.90
5.95
6.00
6.05
6.10
6.15
7-Jun 8-Jun 9-Jun 10-Jun 11-Jun 12-Jun 13-Jun 14-Jun
Wat
er L
evel
(m G
SC)
Observed Modelled
nhcUpper Fraser Model
2007 Validation
March 2008 Figure D.22
Note: Observed data used as boundary condition for downstream end of Upper Fraser River model.

Dewdney PS
6.05
6.10
6.15
6.20
6.25
6.30
6.35
6.40
6.45
6.50
6.55
7-Jun 8-Jun 9-Jun 10-Jun 11-Jun 12-Jun 13-Jun 14-Jun
Wat
er L
evel
(m G
SC)
Observed Modelled
nhcUpper Fraser Model
2007 Validation
March 2008 Figure D.23

Robson PS
6.50
6.55
6.60
6.65
6.70
6.75
6.80
6.85
6.90
6.95
7.00
7-Jun 8-Jun 9-Jun 10-Jun 11-Jun 12-Jun 13-Jun 14-Jun
Wat
er L
evel
(m G
SC)
Observed Modelled
nhcUpper Fraser Model
2007 Validation
March 2008 Figure D.24

McGillivray Slough PS
6.95
7.00
7.05
7.10
7.15
7.20
7.25
7.30
7.35
7.40
7.45
7-Jun 8-Jun 9-Jun 10-Jun 11-Jun 12-Jun 13-Jun 14-Jun
Wat
er L
evel
(m G
SC)
Observed Modelled
nhcUpper Fraser Model
2007 Validation
February 2008 Figure D.25

Collinson PS
6.95
7.00
7.05
7.10
7.15
7.20
7.25
7.30
7.35
7.40
7.45
7-Jun 8-Jun 9-Jun 10-Jun 11-Jun 12-Jun 13-Jun 14-Jun
Wat
er L
evel
(m G
SC)
Observed Modelled
nhcUpper Fraser Model
2007 Validation
March 2008 Figure D.26

Quaamitch Slough
7.40
7.45
7.50
7.55
7.60
7.65
7.70
7.75
7.80
7.85
7.90
7-Jun 8-Jun 9-Jun 10-Jun 11-Jun 12-Jun 13-Jun 14-Jun
Wat
er L
evel
(m G
SC)
Observed Modelled
nhcUpper Fraser Model
2007 Validation
March 2008 Figure D.27

Chilliwack Creek PS (Wolfe Road)
8.10
8.20
8.30
8.40
8.50
8.60
8.70
7-Jun 8-Jun 9-Jun 10-Jun 11-Jun 12-Jun 13-Jun 14-Jun
Wat
er L
evel
(m G
SC)
Observed Modelled
nhcUpper Fraser Model
2007 Validation
March 2008 Figure D.28

Hope Slough at Young Street
8.60
8.70
8.80
8.90
9.00
9.10
9.20
7-Jun 8-Jun 9-Jun 10-Jun 11-Jun 12-Jun 13-Jun 14-Jun
Wat
er L
evel
(m G
SC)
Observed Modelled
nhcUpper Fraser Model
2007 Validation
March 2008 Figure D.29

Bell Dam
6.00
6.50
7.00
7.50
8.00
8.50
9.00
9.50
7-Jun 8-Jun 9-Jun 10-Jun 11-Jun 12-Jun 13-Jun 14-Jun
Wat
er L
evel
(m G
SC)
Observed Modelled
nhcUpper Fraser Model
2007 Validation
March 2008 Figure D.30
Note: Observed data for Bell Dam gauge possibly reported for upstream side of dam.

Minto Landing Area (Bell Slough)
10.30
10.40
10.50
10.60
10.70
10.80
10.90
11.00
7-Jun 8-Jun 9-Jun 10-Jun 11-Jun 12-Jun 13-Jun 14-Jun
Wat
er L
evel
(m G
SC)
Observed Modelled
nhcUpper Fraser Model
2007 Validation
March 2008 Figure D.31

Harrison Mills (Kilby)
11.30
11.35
11.40
11.45
11.50
11.55
11.60
11.65
11.70
11.75
7-Jun 8-Jun 9-Jun 10-Jun 11-Jun 12-Jun 13-Jun 14-Jun
Wat
er L
evel
(m G
SC)
Observed Modelled
nhcUpper Fraser Model
2007 Validation
March 2008 Figure D.32

Duncan Bateson PS
11.45
11.50
11.55
11.60
11.65
11.70
11.75
11.80
11.85
7-Jun 8-Jun 9-Jun 10-Jun 11-Jun 12-Jun 13-Jun 14-Jun
Wat
er L
evel
(m G
SC)
Observed Modelled
nhcUpper Fraser Model
2007 Validation
March 2008 Figure D.33

Harrison River below Morris Creek (08MG022)
11.50
11.55
11.60
11.65
11.70
11.75
11.80
11.85
11.90
11.95
7-Jun 8-Jun 9-Jun 10-Jun 11-Jun 12-Jun 13-Jun 14-Jun
Wat
er L
evel
(m G
SC)
Observed Modelled
nhcUpper Fraser Model
2007 Validation
March 2008 Figure D.34

Carey Point
12.95
13.00
13.05
13.10
13.15
13.20
13.25
13.30
13.35
13.40
13.45
7-Jun 8-Jun 9-Jun 10-Jun 11-Jun 12-Jun 13-Jun 14-Jun
Wat
er L
evel
(m G
SC)
Observed Modelled
nhcUpper Fraser Model
2007 Validation
March 2008 Figure D.35
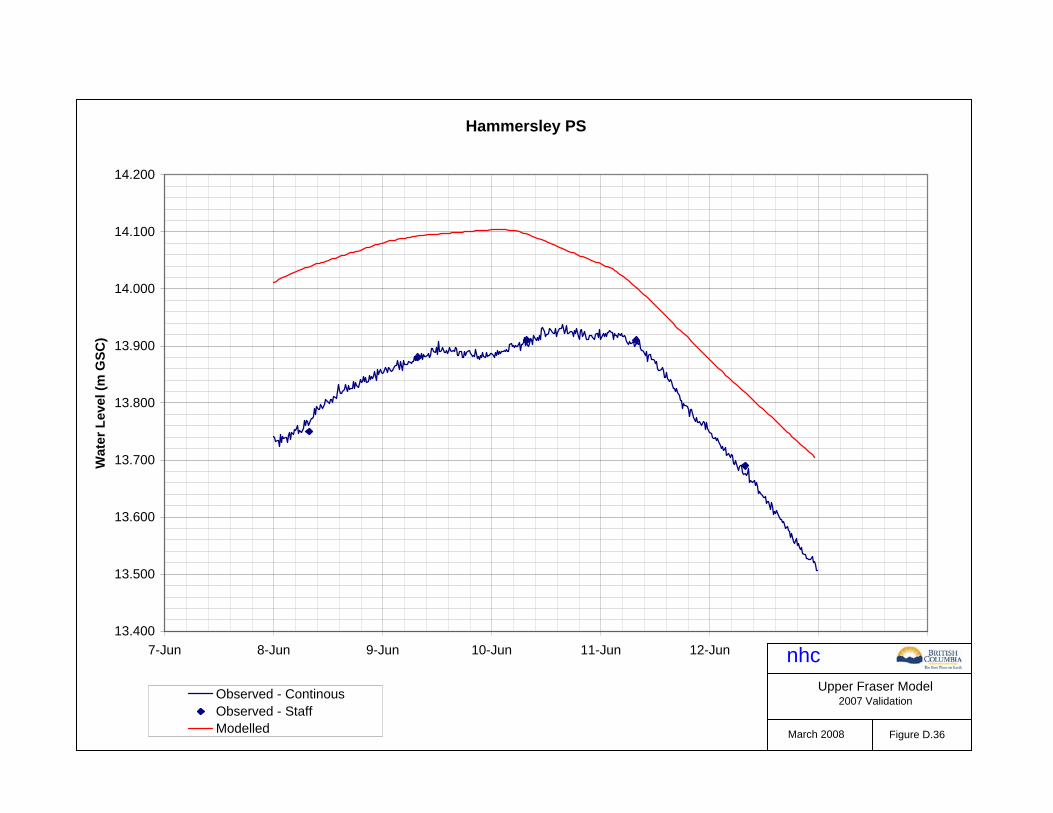
Hammersley PS
13.400
13.500
13.600
13.700
13.800
13.900
14.000
14.100
14.200
7-Jun 8-Jun 9-Jun 10-Jun 11-Jun 12-Jun 13-Jun 14-Jun
Wat
er L
evel
(m G
SC)
Observed - ContinousObserved - StaffModelled
nhcUpper Fraser Model
2007 Validation
March 2008 Figure D.36

Chip (Camp-Hope) Intake
16.10
16.20
16.30
16.40
16.50
16.60
16.70
16.80
7-Jun 8-Jun 9-Jun 10-Jun 11-Jun 12-Jun 13-Jun 14-Jun
Wat
er L
evel
(m G
SC)
Observed Modelled
nhcUpper Fraser Model
2007 Validation
March 2008 Figure D.37

Agassiz-Rosedale Bridge
16.50
16.55
16.60
16.65
16.70
16.75
16.80
16.85
16.90
16.95
17.00
7-Jun 8-Jun 9-Jun 10-Jun 11-Jun 12-Jun 13-Jun 14-Jun
Wat
er L
evel
(m G
SC)
Observed - North Observed - South Modelled
nhcUpper Fraser Model
2007 Validation
March 2008 Figure D.38

Cuthbert Road
18.60
18.70
18.80
18.90
19.00
19.10
19.20
7-Jun 8-Jun 9-Jun 10-Jun 11-Jun 12-Jun 13-Jun 14-Jun
Wat
er L
evel
(m G
SC)
Observed Modelled
nhcUpper Fraser Model
2007 Validation
March 2008 Figure D.39

Maria Slough
18.60
18.70
18.80
18.90
19.00
19.10
19.20
7-Jun 8-Jun 9-Jun 10-Jun 11-Jun 12-Jun 13-Jun 14-Jun
Wat
er L
evel
(m G
SC)
Observed Modelled
nhcUpper Fraser Model
2007 Validation
March 2008 Figure D.40

Herrling Island
20.20
20.25
20.30
20.35
20.40
20.45
20.50
20.55
20.60
20.65
20.70
7-Jun 8-Jun 9-Jun 10-Jun 11-Jun 12-Jun 13-Jun 14-Jun
Wat
er L
evel
(m G
SC)
Observed Modelled
nhcUpper Fraser Model
2007 Validation
March 2008 Figure D.41

Johnson Slough
26.30
26.40
26.50
26.60
26.70
26.80
26.90
7-Jun 8-Jun 9-Jun 10-Jun 11-Jun 12-Jun 13-Jun 14-Jun
Wat
er L
evel
(m G
SC)
Observed Modelled
nhcUpper Fraser Model
2007 Validation
March 2008 Figure D.42

Wahleach Powerhouse
16.00
16.50
17.00
17.50
18.00
18.50
19.00
19.50
7-Jun 8-Jun 9-Jun 10-Jun 11-Jun 12-Jun 13-Jun 14-Jun
Wat
er L
evel
(m G
SC)
Observed Modelled
nhcLower Fraser Model
2007 Calibration
March 2008 Figure D.43
Note: Unknown datum and irregular data for Wahleach Powerhouse.

Wahleach (Jones Creek)
26.50
26.55
26.60
26.65
26.70
26.75
26.80
26.85
26.90
26.95
27.00
7-Jun 8-Jun 9-Jun 10-Jun 11-Jun 12-Jun 13-Jun 14-Jun
Wat
er L
evel
(m G
SC)
Observed Modelled
nhcUpper Fraser Model
2007 Validation
March 2008 Figure D.44
APPENDIX E
SENSITIVITY ANALYSES FOR LOWER MODEL
(TABLES AND CHARTS)
Tables Charts
Number Name Number Name
E-1 Roughness Sensitivity E-1 Roughness Sensitivity E-2 Inflow Sensitivity E-2 Inflow Sensitivity E-3 Ocean Level Sensitivity E-3 Ocean Level Sensitivity

Table E.1: Roughness Sensitivity for Lower Model (Freshet Design Condition) By Muncipality
(m GSC) Diff. (m) Diff. (m) Diff. (m)
City of Vancouver West end UBC 'NORTH ARM' 1238 1.56 0.00 0.00 0.00Burnaby border 'NORTH ARM' 22157 2.57 0.22 0.45 -0.20
City of Richmond Sea Island: McDonald Slough 'NORTH ARM' 9913 1.68 0.04 0.10 -0.05Sea Island: West end at Middle Arm 'MIDDLE ARM' 6788 1.51 0.00 0.00 0.00Middle and North Arm Confluence 'MIDDLE ARM' 14066 1.90 0.11 0.23 -0.10Terra Nova Park at Middle Arm 'MIDDLE ARM' 7834 1.51 0.00 0.00 -0.01New Westminster border 'NORTH ARM' 28105 3.12 0.33 0.65 -0.30
City of Burnaby Vancouver border 'NORTH ARM' 22157 2.57 0.22 0.45 -0.20New Westminster border 'NORTH ARM' 28761 3.14 0.33 0.67 -0.31
City of New Westminster Burnaby border 'NORTH ARM' 28761 3.14 0.33 0.67 -0.31Coquitlam border 'FRASER' 37528 4.09 0.40 0.78 -0.41
City of Coquitlam Burnaby border 'FRASER' 37528 4.09 0.40 0.78 -0.41Port Coquitlam border 'FRASER' 42617 4.65 0.44 0.85 -0.45
City of Port Coquitlam Coquitlam border 'FRASER' 42617 4.65 0.44 0.85 -0.45Pitt and Fraser Rivers confluence 'DOUGLAS' 2988 4.74 0.47 0.89 -0.48Pitt River at De Bouville Slough 'PITT' 7342 4.71 0.44 0.82 -0.48
District of Pitt Meadows Pitt River at Sheridan Hill 'PITT' 10817 4.71 0.43 0.82 -0.47Pitt and Fraser Rivers confluence 'DOUGLAS' 2988 4.74 0.47 0.89 -0.48Maple Ridge border 'FRASER' 53954 6.00 0.49 0.92 -0.52
District of Maple Ridge Pitt Meadows border 'FRASER' 53954 6.00 0.49 0.92 -0.52Whonnock Creek 'FRASER' 71256 7.46 0.58 1.11 -0.66Mission border 'FRASER' 73842 7.90 0.57 1.10 -0.65
District of Mission Maple Ridge border 'FRASER' 73842 7.90 0.57 1.10 -0.65Silverdale Creek 'FRASER' 80578 8.40 0.60 1.16 -0.68Mission bridge 'FRASER' 85182 8.87 0.58 1.13 -0.65
Corporation of Delta Roberts Bank at Canoe Pass 'CANOE' 8065 1.42 0.00 0.01 0.00Massey Tunnel 'FRASER' 18117 2.16 0.17 0.35 -0.15Surrey border 'FRASER' 31926 3.52 0.36 0.70 -0.33Westham Island: Roberts Bank at Canoe Pass 'CANOE' 8065 1.42 0.00 0.01 0.00Westham Island: Reifel Island at Ladner Reach 'FRASER' 9650 1.55 0.02 0.04 -0.02Westham Island: Upstream end 'LADNER' 4506 1.81 0.07 0.17 -0.06
City of Richmond Steveston, Garry Point Park 'FRASER' 7589 1.50 0.01 0.02 -0.01Massey Tunnel 'FRASER' 18117 2.16 0.17 0.35 -0.15New Westminster Border 'ANNACIS' 3136 3.11 0.33 0.64 -0.29
City of New Westminster City of Richmond Border 'ANNACIS' 3136 3.11 0.33 0.64 -0.29Trifurcation 'FRASER' 34089 3.57 0.39 0.75 -0.35
City of Surrey Delta border 'FRASER' 31926 3.52 0.36 0.70 -0.33Township of Langley border 'BARNSTON' 6011 5.72 0.50 0.94 -0.53
Barnston Diking District Barnston Island: downstream end 'BARNSTON' 0 5.27 0.47 0.89 -0.49Barnston Island: upstream end 'BARNSTON' 7446 5.87 0.50 0.94 -0.53
Township of Langley Surrey border 'BARNSTON' 6011 5.72 0.50 0.94 -0.53Jacob-Haldi Bridge 'MCMILLAN' 2644 7.11 0.50 0.98 -0.68Abbotsford border 'FRASER' 70804 7.58 0.56 1.09 -0.64
City of Abbotsford Langley border 'FRASER' 70804 7.58 0.56 1.09 -0.64Mission Bridge 'FRASER' 85182 8.87 0.58 1.13 -0.65
Notes:1. Difference is calculated as scenario model less base model water level.2. All levels are based on freshet design condition.3. Values show un-smoothed results direct from model and may differ from design profile.4. Percentage increases in roughness refer to a global increase to Manning's n.5. All boundary conditions the same as for base design profile.
South Fraser
Base Model +10% nMunicipality/Diking
District Location MIKE 11 Chainage
North Fraser
-10% n+20% n

Table E.2: Inflow Sensitivity for Lower Model (Freshet Design Condition) By Muncipality
(m GSC) Diff. (m) Diff. (m)
City of Vancouver West end UBC 'NORTH ARM' 1238 1.56 0.00 0.00Burnaby border 'NORTH ARM' 22157 2.57 0.23 -0.22
City of Richmond Sea Island: McDonald Slough 'NORTH ARM' 9913 1.68 0.04 -0.05Sea Island: West end at Middle Arm 'MIDDLE ARM' 6788 1.51 0.00 0.00Middle and North Arm Confluence 'MIDDLE ARM' 14066 1.90 0.10 -0.10Terra Nova Park at Middle Arm 'MIDDLE ARM' 7834 1.51 0.00 0.00New Westminster border 'NORTH ARM' 28105 3.12 0.32 -0.32
City of Burnaby Vancouver border 'NORTH ARM' 22157 2.57 0.23 -0.22New Westminster border 'NORTH ARM' 28761 3.14 0.32 -0.32
City of New Westminster Burnaby border 'NORTH ARM' 28761 3.14 0.32 -0.32Coquitlam border 'FRASER' 37528 4.09 0.45 -0.46
City of Coquitlam Burnaby border 'FRASER' 37528 4.09 0.45 -0.46Port Coquitlam border 'FRASER' 42617 4.65 0.50 -0.53
City of Port Coquitlam Coquitlam border 'FRASER' 42617 4.65 0.50 -0.53Pitt and Fraser Rivers confluence 'DOUGLAS' 2988 4.74 0.50 -0.54Pitt River at De Bouville Slough 'PITT' 7342 4.71 0.48 -0.50
District of Pitt Meadows Pitt River at Sheridan Hill 'PITT' 10817 4.71 0.48 -0.50Pitt and Fraser Rivers confluence 'DOUGLAS' 2988 4.74 0.50 -0.54Maple Ridge border 'FRASER' 53954 6.00 0.54 -0.60
District of Maple Ridge Pitt Meadows border 'FRASER' 53954 6.00 0.54 -0.60Whonnock Creek 'FRASER' 71256 7.46 0.58 -0.68Mission border 'FRASER' 73842 7.90 0.61 -0.70
District of Mission Maple Ridge border 'FRASER' 73842 7.90 0.61 -0.70Silverdale Creek 'FRASER' 80578 8.40 0.63 -0.72Mission bridge 'FRASER' 85182 8.87 0.63 -0.71
Corporation of Delta Roberts Bank at Canoe Pass 'CANOE' 8065 1.42 0.00 0.00Massey Tunnel 'FRASER' 18117 2.16 0.17 -0.14Surrey border 'FRASER' 31926 3.52 0.39 -0.38Westham Island: Roberts Bank at Canoe Pass 'CANOE' 8065 1.42 0.00 0.00Westham Island: Reifel Island at Ladner Reach 'FRASER' 9650 1.55 0.01 -0.01Westham Island: Upstream end 'LADNER' 4506 1.81 0.08 -0.07
City of Richmond Steveston, Garry Point Park 'FRASER' 7589 1.50 0.00 0.00Massey Tunnel 'FRASER' 18117 2.16 0.17 -0.14New Westminster Border 'ANNACIS' 3136 3.11 0.35 -0.31
City of New Westminster City of Richmond Border 'ANNACIS' 3136 3.11 0.35 -0.31Trifurcation 'FRASER' 34089 3.57 0.40 -0.39
City of Surrey Delta border 'FRASER' 31926 3.52 0.39 -0.38Township of Langley border 'BARNSTON' 6011 5.72 0.53 -0.58
Barnston Diking District Barnston Island: downstream end 'BARNSTON' 0 5.27 0.52 -0.57Barnston Island: upstream end 'BARNSTON' 7446 5.87 0.54 -0.59
Township of Langley Surrey border 'BARNSTON' 6011 5.72 0.53 -0.58Jacob-Haldi Bridge 'MCMILLAN' 2644 7.11 0.54 -0.73Abbotsford border 'FRASER' 70804 7.58 0.60 -0.69
City of Abbotsford Langley border 'FRASER' 70804 7.58 0.60 -0.69Mission Bridge 'FRASER' 85182 8.87 0.63 -0.71
Notes:1. Difference is calculated as scenario model less base model water level.2. All levels are based on freshet design condition.3. Values show un-smoothed results direct from Model and may differ from design profile.4. Percentage increases in flow refer to global increases to all five inflow boundaries.5. Downstream boundary condition and roughness values the same as for base design profile.
MIKE 11 ChainageMunicipality/Diking District Location
North Fraser
South Fraser
Base Model
+10% Inflow
-10% Inflow

Table E.3: Downstream Boundary Condition Sensitivity for Lower Model (Freshet Design Condition) By Muncipality
(m GSC) Diff. (m)
City of Vancouver West end UBC 'NORTH ARM' 1238 1.56 0.60Burnaby border 'NORTH ARM' 22157 2.57 0.40
City of Richmond Sea Island: McDonald Slough 'NORTH ARM' 9913 1.68 0.54Sea Island: West end at Middle Arm 'MIDDLE ARM' 6788 1.51 0.62Middle and North Arm Confluence 'MIDDLE ARM' 14066 1.90 0.49Terra Nova Park at Middle Arm 'MIDDLE ARM' 7834 1.51 0.62New Westminster border 'NORTH ARM' 28105 3.12 0.34
City of Burnaby Vancouver border 'NORTH ARM' 22157 2.57 0.40New Westminster border 'NORTH ARM' 28761 3.14 0.33
City of New Westminster Burnaby border 'NORTH ARM' 28761 3.14 0.33Coquitlam border 'FRASER' 37528 4.09 0.28
City of Coquitlam Burnaby border 'FRASER' 37528 4.09 0.28Port Coquitlam border 'FRASER' 42617 4.65 0.22
City of Port Coquitlam Coquitlam border 'FRASER' 42617 4.65 0.22Pitt and Fraser Rivers confluence 'DOUGLAS' 2988 4.74 0.21Pitt River at De Bouville Slough 'PITT' 7342 4.71 0.22
District of Pitt Meadows Pitt River at Sheridan Hill 'PITT' 10817 4.71 0.22Pitt and Fraser Rivers confluence 'DOUGLAS' 2988 4.74 0.21Maple Ridge border 'FRASER' 53954 6.00 0.14
District of Maple Ridge Pitt Meadows border 'FRASER' 53954 6.00 0.14Whonnock Creek 'FRASER' 71256 7.46 0.09Mission border 'FRASER' 73842 7.90 0.09
District of Mission Maple Ridge border 'FRASER' 73842 7.90 0.09Silverdale Creek 'FRASER' 80578 8.40 0.08Mission bridge 'FRASER' 85182 8.87 0.07
Corporation of Delta Roberts Bank at Canoe Pass 'CANOE' 8065 1.42 0.62Massey Tunnel 'FRASER' 18117 2.16 0.47Surrey border 'FRASER' 31926 3.52 0.30Westham Island: Roberts Bank at Canoe Pass 'CANOE' 8065 1.42 0.62Westham Island: Reifel Island at Ladner Reach 'FRASER' 9650 1.55 0.59Westham Island: Upstream end 'LADNER' 4506 1.81 0.53
City of Richmond Steveston, Garry Point Park 'FRASER' 7589 1.50 0.60Massey Tunnel 'FRASER' 18117 2.16 0.47New Westminster Border 'ANNACIS' 3136 3.11 0.34
City of New Westminster City of Richmond Border 'ANNACIS' 3136 3.11 0.34Trifurcation 'FRASER' 34089 3.57 0.29
City of Surrey Delta border 'FRASER' 31926 3.52 0.30Township of Langley border 'BARNSTON' 6011 5.72 0.15
Barnston Diking District Barnston Island: downstream end 'BARNSTON' 0 5.27 0.18Barnston Island: upstream end 'BARNSTON' 7446 5.87 0.15
Township of Langley Surrey border 'BARNSTON' 6011 5.72 0.15Jacob-Haldi Bridge 'MCMILLAN' 2644 7.11 0.11Abbotsford border 'FRASER' 70804 7.58 0.09
City of Abbotsford Langley border 'FRASER' 70804 7.58 0.09Mission Bridge 'FRASER' 85182 8.87 0.07
Notes:1. Difference is calculated as scenario model less base model water level.2. All levels are based on freshet design condition.3. Values show un-smoothed results direct from Model and may differ from design profile.4. Downstream boundary condition increased by 0.6 m to represent possible sea level rise and delta settlement condition.5. Upstream boundary conditions and roughness values the same as for base design profile.
Municipality/Diking District
North Fraser
South Fraser
Location MIKE 11 ChainageBase Model
+0.6 m at Ocean

0.00
2.00
4.00
6.00
8.00
10.00
12.00
0 10 20 30 40 50 60 70 80 90
Chainage (km)
Wat
er L
evel
(m G
SC)
Base Event (Freshet Design)+10% Manning's n+20% Manning's n-10% Manning's n
Stev
esto
n
New
Wes
tmin
ster
Port
Man
n
Mis
sion
nhcRoughness Sensitivity
Lower Model
March 2008 Figure E.1
Who
nnoc
k

0.00
1.00
2.00
3.00
4.00
5.00
6.00
7.00
8.00
9.00
10.00
0 10 20 30 40 50 60 70 80 90
Chainage (km)
Wat
er L
evel
(m G
SC)
Base Event (Freshet Design)+10% Inflow-10% Inflow
Stev
esto
n
New
Wes
tmin
ster
Port
Man
n Mis
sion
nhcInflow Sensitivity
Lower Model
March 2008 Figure E.2
Who
nnoc
k

0.00
1.00
2.00
3.00
4.00
5.00
6.00
7.00
8.00
9.00
10.00
0 10 20 30 40 50 60 70 80 90
Chainage (km)
Wat
er L
evel
(m G
SC)
Base Event (Freshet Design)
+0.6 m (GW)
Stev
esto
n
New
Wes
tmin
ster
Port
Man
n
Mis
sion
nhcOcean Level Sensitivity
Lower Model
March 2008 Figure E.3
Who
nnoc
k

APPENDIX F
SENSITIVITY ANALYSES FOR UPPER MODEL
(TABLES AND CHARTS)
Tables Charts
Number Name Number Name
F-1 Roughness Sensitivity F-1 Roughness Sensitivity F-2 Inflow Sensitivity F-2 Inflow Sensitivity F-3 Downstream Boundary Sensitivity F-3 Downstream Boundary Sensitivity

Table F.1: Roughness Sensitivity for Upper Model
(m GSC) Diff. (m) Diff. (m) Diff. (m)
District of Mission Mission Bridge FRASER_R 85400 8.87 0.00 0.00 0.00FVRD Electoral Area G border FRASER_R 89872 9.38 0.10 0.21 -0.09
FVRD Mission border FRASER_R 89872 9.38 0.10 0.21 -0.09Electoral Area G Downstream end Nicomen Island FRASER_R 95540 9.99 0.19 0.40 -0.18
FVRD Electoral Area C border FRASER_R 107234 11.01 0.30 0.59 -0.30FVRD FVRD Electoral Area G border FRASER_R 107234 11.01 0.30 0.59 -0.30Electoral Area C District of Kent border (Harrison River) FRASER_R 117387 13.73 0.30 0.60 -0.31
Harrison Lake HARRISON_R 17845 13.93 0.31 0.61 -0.31District of Kent FVRD Electoral Area C border FRASER_R 117387 13.73 0.30 0.60 -0.31
Hammersley Pump Station FRASER_R 124155 15.87 0.39 0.76 -0.41Upstream of Agassiz Bridge FRASER_R 131184 18.67 0.37 0.73 -0.38Maria Slough MARIA_S 0 20.33 0.34 0.66 -0.35
Seabird First Nation Maria Slough MARIA_S 0 20.33 0.34 0.66 -0.35Upstream end Seabird Island FRASER_R 147935 26.88 0.36 0.67 -0.41
FVRD Upstream end Seabird Island FRASER_R 147935 26.88 0.36 0.67 -0.41Electoral District C Laidlaw FRASER_R 154447 31.72 0.38 0.73 -0.41
City of Abbotsford Mission Bridge FRASER_R 85400 8.87 0.00 0.00 0.00FVRD Electoral Area H border FRASER_R 92864 9.69 0.15 0.31 -0.14
FVRD Abbotsford border FRASER_R 92864 9.69 0.15 0.31 -0.14Electoral Area H Chilliwack border FRASER_R 99944 10.48 0.25 0.51 -0.24City of Chilliwack FVRD Electoral Area H border FRASER_R 99944 10.48 0.25 0.51 -0.24
Minto Landing MINTO_C 3073 13.06 0.35 0.69 -0.37FVRD Electoral Area D border SC_122760L 6322 18.54 0.34 0.68 -0.35
FVRD Chilliwack border SC_122760L 6322 18.54 0.34 0.68 -0.35Electoral Area D Upstream of Agassiz Bridge FRASER_R 131184 18.67 0.37 0.73 -0.38
FVRD Electoral Area B border FRASER_R 145700 25.65 0.30 0.57 -0.34FVRD FVRD Electoral Area D border FRASER_R 145700 25.65 0.30 0.57 -0.34Electoral Area B Laidlaw FRASER_R 154447 31.72 0.38 0.73 -0.41
Notes:1. Difference is calculated as scenario model less base model water level.2. Percentage increases in roughness refer to a global increase to Manning's n.3. All boundary conditions the same as for base design profile.
North Fraser
-10% n+20% nBase Model +10% nMunicipality/Diking
District Location MIKE 11 Chainage
South Fraser
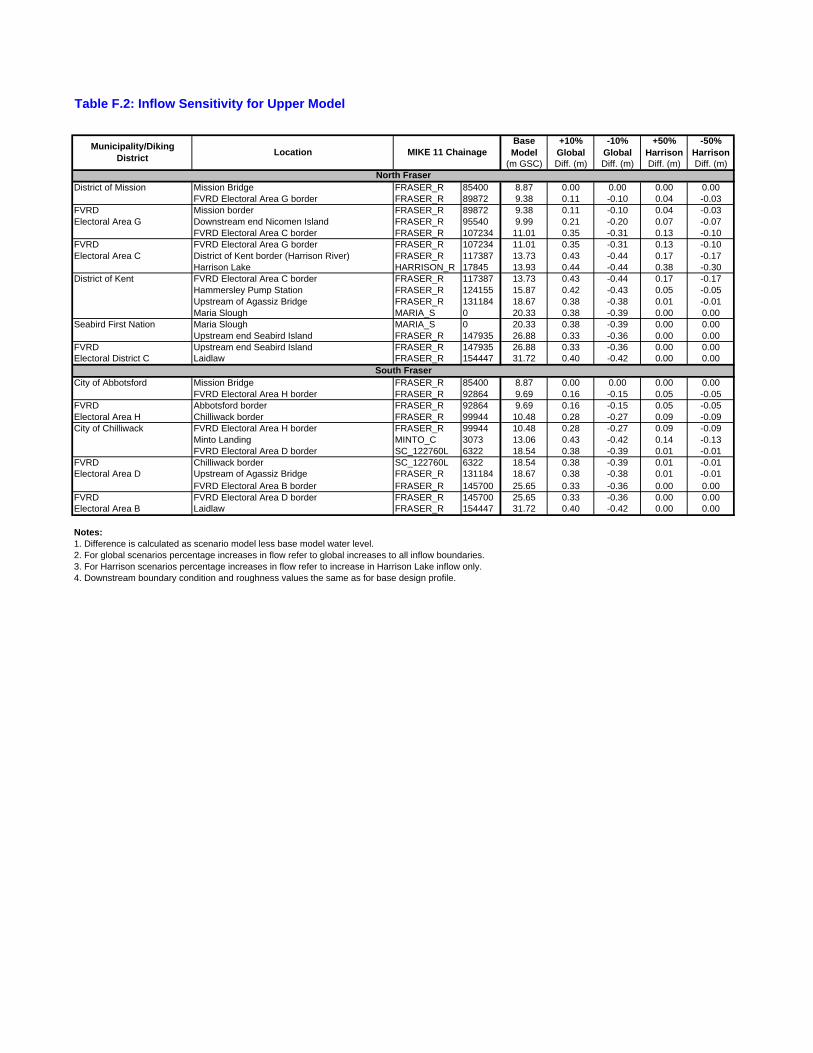
Table F.2: Inflow Sensitivity for Upper Model
(m GSC) Diff. (m) Diff. (m) Diff. (m) Diff. (m)
District of Mission Mission Bridge FRASER_R 85400 8.87 0.00 0.00 0.00 0.00FVRD Electoral Area G border FRASER_R 89872 9.38 0.11 -0.10 0.04 -0.03
FVRD Mission border FRASER_R 89872 9.38 0.11 -0.10 0.04 -0.03Electoral Area G Downstream end Nicomen Island FRASER_R 95540 9.99 0.21 -0.20 0.07 -0.07
FVRD Electoral Area C border FRASER_R 107234 11.01 0.35 -0.31 0.13 -0.10FVRD FVRD Electoral Area G border FRASER_R 107234 11.01 0.35 -0.31 0.13 -0.10Electoral Area C District of Kent border (Harrison River) FRASER_R 117387 13.73 0.43 -0.44 0.17 -0.17
Harrison Lake HARRISON_R 17845 13.93 0.44 -0.44 0.38 -0.30District of Kent FVRD Electoral Area C border FRASER_R 117387 13.73 0.43 -0.44 0.17 -0.17
Hammersley Pump Station FRASER_R 124155 15.87 0.42 -0.43 0.05 -0.05Upstream of Agassiz Bridge FRASER_R 131184 18.67 0.38 -0.38 0.01 -0.01Maria Slough MARIA_S 0 20.33 0.38 -0.39 0.00 0.00
Seabird First Nation Maria Slough MARIA_S 0 20.33 0.38 -0.39 0.00 0.00Upstream end Seabird Island FRASER_R 147935 26.88 0.33 -0.36 0.00 0.00
FVRD Upstream end Seabird Island FRASER_R 147935 26.88 0.33 -0.36 0.00 0.00Electoral District C Laidlaw FRASER_R 154447 31.72 0.40 -0.42 0.00 0.00
City of Abbotsford Mission Bridge FRASER_R 85400 8.87 0.00 0.00 0.00 0.00FVRD Electoral Area H border FRASER_R 92864 9.69 0.16 -0.15 0.05 -0.05
FVRD Abbotsford border FRASER_R 92864 9.69 0.16 -0.15 0.05 -0.05Electoral Area H Chilliwack border FRASER_R 99944 10.48 0.28 -0.27 0.09 -0.09City of Chilliwack FVRD Electoral Area H border FRASER_R 99944 10.48 0.28 -0.27 0.09 -0.09
Minto Landing MINTO_C 3073 13.06 0.43 -0.42 0.14 -0.13FVRD Electoral Area D border SC_122760L 6322 18.54 0.38 -0.39 0.01 -0.01
FVRD Chilliwack border SC_122760L 6322 18.54 0.38 -0.39 0.01 -0.01Electoral Area D Upstream of Agassiz Bridge FRASER_R 131184 18.67 0.38 -0.38 0.01 -0.01
FVRD Electoral Area B border FRASER_R 145700 25.65 0.33 -0.36 0.00 0.00FVRD FVRD Electoral Area D border FRASER_R 145700 25.65 0.33 -0.36 0.00 0.00Electoral Area B Laidlaw FRASER_R 154447 31.72 0.40 -0.42 0.00 0.00
Notes:1. Difference is calculated as scenario model less base model water level.2. For global scenarios percentage increases in flow refer to global increases to all inflow boundaries.3. For Harrison scenarios percentage increases in flow refer to increase in Harrison Lake inflow only.4. Downstream boundary condition and roughness values the same as for base design profile.
South Fraser
-10% Global
+50% Harrison
Base Model
+10% Global
-50% HarrisonMunicipality/Diking
District
North Fraser
MIKE 11 ChainageLocation

Table F.3: Downstream Boundary Condition Sensitivity for Upper Model
(m GSC) Diff. (m) Diff. (m)
District of Mission Mission Bridge FRASER_R 85400 8.87 1.00 -1.00FVRD Electoral Area G border FRASER_R 89872 9.38 0.92 -0.90
FVRD Mission border FRASER_R 89872 9.38 0.92 -0.90Electoral Area G Downstream end Nicomen Island FRASER_R 95540 9.99 0.81 -0.76
FVRD Electoral Area C border FRASER_R 107234 11.01 0.63 -0.50FVRD FVRD Electoral Area G border FRASER_R 107234 11.01 0.63 -0.50Electoral Area C District of Kent border (Harrison River) FRASER_R 117387 13.73 0.22 -0.14
Harrison Lake HARRISON_R 17845 13.93 0.21 -0.13District of Kent FVRD Electoral Area C border FRASER_R 117387 13.73 0.22 -0.14
Hammersley Pump Station FRASER_R 124155 15.87 0.08 -0.04Upstream of Agassiz Bridge FRASER_R 131184 18.67 0.02 -0.01Maria Slough MARIA_S 0 20.33 0.00 0.01
Seabird First Nation Maria Slough MARIA_S 0 20.33 0.00 0.01Upstream end Seabird Island FRASER_R 147935 26.88 0.00 0.00
FVRD Upstream end Seabird Island FRASER_R 147935 26.88 0.00 0.00Electoral District C Laidlaw FRASER_R 154447 31.72 0.00 0.00
City of Abbotsford Mission Bridge FRASER_R 85400 8.87 1.00 -1.00FVRD Electoral Area H border FRASER_R 92864 9.69 0.86 -0.82
FVRD Abbotsford border FRASER_R 92864 9.69 0.86 -0.82Electoral Area H Chilliwack border FRASER_R 99944 10.48 0.72 -0.65City of Chilliwack FVRD Electoral Area H border FRASER_R 99944 10.48 0.72 -0.65
Minto Landing MINTO_C 3073 13.06 0.28 -0.18FVRD Electoral Area D border SC_122760L 6322 18.54 0.02 -0.01
FVRD Chilliwack border SC_122760L 6322 18.54 0.02 -0.01Electoral Area D Upstream of Agassiz Bridge FRASER_R 131184 18.67 0.02 -0.01
FVRD Electoral Area B border FRASER_R 145700 25.65 0.00 0.00FVRD FVRD Electoral Area D border FRASER_R 145700 25.65 0.00 0.00Electoral Area B Laidlaw FRASER_R 154447 31.72 0.00 0.00
Notes:1. Difference is calculated as scenario model less base model water level.2. Upstream boundary conditions and roughness values the same as for base design profile.
North Fraser
South Fraser
Base Model
+1m @ Mission
-1m @ MissionLocation MIKE 11 ChainageMunicipality/Diking
District

5.00
10.00
15.00
20.00
25.00
30.00
35.00
80 90 100 110 120 130 140 150 160
Chainage (km)
Wat
er L
evel
(m G
SC)
Base Profile+10% Manning's n+20% Manning's n-10% Manning's n
nhcRoughness Sensitivity
Upper Model
March 2008 Figure F.1

5.00
10.00
15.00
20.00
25.00
30.00
35.00
80 90 100 110 120 130 140 150 160
Chainage (km)
Wat
er L
evel
(m G
SC)
Base Profile
+10% Global Inflow
-10% Global Inflow
+50% Harrison Inflow
-50% Harrison Inflow
nhcInflow Sensitivity
Upper Model
March 2008 Figure F.2

5.00
10.00
15.00
20.00
25.00
30.00
35.00
80 90 100 110 120 130 140 150 160
Chainage (km)
Wat
er L
evel
(m G
SC)
Base Profile+1m @ Mission-1m @ Mission
nhcDownstream Boundary Sensitivity
Upper Model
March 2008 Figure F.3

APPENDIX G
RAILWAY EMBANKMENT BREACH AT SEABIRD ISLAND

1
1 INTRODUCTION Seabird Island is located near the upstream end of the MIKE11 model, and is bounded by the Fraser River on the east side and by Maria Slough on the west side. The island is divided along its length by a CPR railway embankment which acts as a dike. There is concern that if a breach of this embankment were to occur, water levels on the land side near the downstream end of the island could be higher than on the river side. UMA (2000) modelled several breach scenarios, of which one was presented in their report. Breach modelling was not undertaken as part of the 2007-2008 model update. However, the risk of flood levels exceeding computed Fraser River design levels was briefly reviewed as outlined below.
2 BACKGROUND Embankment breach scenarios on Seabird Island were initially studied by Hay&Company (1992) as part of a study carried out for INAC to develop flood construction levels for Seabird Island I.R.0. Hay&Company modelled a breach at the upstream end of the island causing water to pond behind the embankment at the downstream end, as a result of Fraser River backwater and flow blockage at the Highway #7 and CPR Bridge openings near the exit of Maria Slough. The modelled water level (ponded elevation) for this scenario was 22.4 m GSC and was based on a 200-year design flow of 15,400 m3/s at Hope.
The UMA 2000 work showed that as a result of a breach, water levels in Maria Slough upstream of the Highway #7 Bridge could be approximately 0.5 m higher in the slough than water levels resulting from local inflow to the Slough and backwater from the Fraser.
In March 2006, nhc completed a flood construction level assessment for the Seabird Island band for a new subdivision on the Island. Previous reporting was reviewed and a physical assessment of the embankment was made. The report concluded that a breach at the upstream end of the
nhc
memorandum
northwest hydraulic
consultants
30 Gostick PlaceNorth Vancouver, BC
V7M 3G3, CanadaTel: 604-980-6011Fax: 604-980-9264
email: [email protected]
To: Ron Henry Date: 12-Feb-2008
From: Tamsin Lyle, Monica Mannerström (nhc) No. Pages: 2
CC: Project No.: 34743
Ref. No.: Re: Fraser River Hydraulic Model Update
Railway Embankment Breach at Seabird Island

nhc
Fraser River Hydraulic Model Update Railway Embankment Breach at Seabird Island 2
island was unlikely to occur. However, some spilling over the embankment could result if Fraser River water levels ever exceeded the top of railroad elevation.
3 BREACH ASSESSMENT According to the updated model, the Maria Slough design water level at Station 0+000 of Kent A Dike is 21.2 m. (The crest elevation of the dike in this location is 21.5 m). The dike starts at the Highway 7 Bridge, downstream of the CPR crossing. The top-of-railway elevation at the Maria Slough crossing is 21.9 m.
If, in the unlikely event, a major breach of the embankment were to occur at some upstream location on Seabird Island, it is conceivable that water levels on the land side of the embankment could be higher than those on the river side if the CPR and Highway 7 Bridge openings became severely blocked and could not be cleared out. The same could potentially happen in other locations in the Fraser Valley where dikes or embankments may trap water on the land side, raising flood levels beyond those modelled for the main or side channels.
Detailed breach modelling typically requires two-dimensional modelling along with extensive topographic data of the floodplain and detailed surveys of dikes and embankments. This work was outside the scope of the present study and breach modelling was not undertaken.
REFERENCES Hay&Company 1992. Fraser River Floodplain Mapping Seabird Island I.R. and Peters Island
IR. 1 and 2. Prepared for Indian and Northern Affairs Canada.
nhc 2006. Sebird Island I.R. Flood Construction Level Assessment. Prepared for Seabird Indian Band.
UMA 2000. Fraser River Gravel Rreach Hydraulic Modelling Study. Prepared for the City of Chilliwack.

APPENDIX H
MUNICIPAL WATER LEVEL REFERENCE TABLES

Table H.1: Typical Water Levels for Various Water Levels at Mission (Lower Model)
Water Level at MissionCorresponding Inflow
Tidal Condition Min Max Min Max Min Max Min Max Min Max Min Max Min Max
City of Vancouver West end UBC 'NORTH ARM' 1238 -2.82 1.95 -2.82 1.95 -2.82 1.95 -2.82 1.95 -2.82 1.95 -2.82 1.95 -2.82 1.95Burnaby border 'NORTH ARM' 22157 -0.29 2.19 -0.06 2.26 0.23 2.34 0.53 2.46 0.84 2.59 1.14 2.72 1.42 2.86
City of Richmond Sea Island: McDonald Slough 'NORTH ARM' 9913 -1.97 1.92 -1.88 1.92 -1.77 1.95 -1.66 1.96 -1.55 1.98 -1.44 2.01 -1.32 2.03Sea Island: West end at Middle Arm 'MIDDLE ARM' 6788 -1.27 1.91 -1.25 1.91 -1.20 1.91 -1.17 1.90 -1.11 1.90 -1.07 1.90 -1.02 1.90Middle and North Arm Confluence 'MIDDLE ARM' 14066 -0.97 1.99 -0.82 2.01 -0.61 2.05 -0.39 2.08 -0.18 2.12 0.02 2.18 0.21 2.23Terra Nova Park at Middle Arm 'MIDDLE ARM' 7834 -1.09 1.91 -1.03 1.90 -0.98 1.90 -0.92 1.90 -0.84 1.90 -0.77 1.89 -0.70 1.89New Westminster border 'NORTH ARM' 28105 0.23 2.32 0.49 2.44 0.82 2.58 1.18 2.74 1.57 2.95 1.92 3.13 2.27 3.34
City of Burnaby Vancouver border 'NORTH ARM' 22157 -0.29 2.19 -0.06 2.26 0.23 2.34 0.53 2.46 0.84 2.59 1.14 2.72 1.42 2.86New Westminster border 'NORTH ARM' 28761 0.26 2.32 0.53 2.44 0.86 2.59 1.22 2.75 1.61 2.95 1.96 3.14 2.30 3.35
City of New Westminster Burnaby border 'NORTH ARM' 28761 0.26 2.32 0.53 2.44 0.86 2.59 1.22 2.75 1.61 2.95 1.96 3.14 2.30 3.35Coquitlam border 'FRASER' 37528 1.15 2.56 1.49 2.73 1.93 3.00 2.37 3.26 2.80 3.58 3.21 3.89 3.63 4.21
City of Coquitlam Burnaby border 'FRASER' 37528 1.15 2.56 1.49 2.73 1.93 3.00 2.37 3.26 2.80 3.58 3.21 3.89 3.63 4.21Port Coquitlam border 'FRASER' 42617 1.79 2.79 2.16 3.03 2.62 3.36 3.06 3.70 3.52 4.06 3.94 4.43 4.38 4.78
City of Port Coquitlam Coquitlam border 'FRASER' 42617 1.79 2.79 2.16 3.03 2.62 3.36 3.06 3.70 3.52 4.06 3.94 4.43 4.38 4.78Pitt and Fraser Rivers confluence 'DOUGLAS' 2988 1.93 2.83 2.30 3.09 2.76 3.43 3.19 3.77 3.65 4.14 4.06 4.51 4.47 4.88Pitt River at De Bouville Slough 'PITT' 7342 2.03 2.78 2.37 3.04 2.80 3.39 3.23 3.73 3.67 4.11 4.08 4.47 4.43 4.85
District of Pitt Meadows Pitt River at Sheridan Hill 'PITT' 10817 2.04 2.80 2.38 3.06 2.81 3.39 3.23 3.74 3.66 4.12 4.07 4.48 4.44 4.86Pitt and Fraser Rivers confluence 'DOUGLAS' 2988 1.93 2.83 2.30 3.09 2.76 3.43 3.19 3.77 3.65 4.14 4.06 4.51 4.47 4.88Maple Ridge border 'FRASER' 53954 3.09 3.69 3.53 4.04 4.02 4.45 4.49 4.86 4.99 5.30 5.43 5.73 5.82 6.13
District of Maple Ridge Pitt Meadows border 'FRASER' 53954 3.09 3.69 3.53 4.04 4.02 4.45 4.49 4.86 4.99 5.30 5.43 5.73 5.82 6.13Whonnock Creek 'FRASER' 71256 4.42 4.79 4.92 5.22 5.41 5.67 5.91 6.13 6.42 6.65 6.88 7.11 7.34 7.59Mission border 'FRASER' 73842 4.78 5.10 5.29 5.57 5.80 6.04 6.32 6.52 6.84 7.06 7.32 7.54 7.80 8.04
District of Mission Maple Ridge border 'FRASER' 73842 4.78 5.10 5.29 5.57 5.80 6.04 6.32 6.52 6.84 7.06 7.32 7.54 7.80 8.04Silverdale Creek 'FRASER' 80578 5.20 5.49 5.73 5.98 6.25 6.46 6.79 6.96 7.32 7.53 7.82 8.03 8.32 8.54Mission bridge 'FRASER' 85182 5.74 6.00 6.30 6.50 6.82 7.00 7.34 7.50 7.87 8.00 8.32 8.50 8.81 9.00
6 m 6.5 mMIKE 11 Chainage
Municipality/Diking District Location
9 m11200 cms 12350 cms 13725 cms 15050 cms
7 m 7.5 m 8 m
North Fraser
8.5 m16450 cms 17800 cms 19225 cms

Table H.1 (Continued): Typical Water Levels for Various Water Levels at Mission (Lower Model)
Water Level at MissionCorresponding Inflow
Tidal Condition Min Max Min Max Min Max Min Max Min Max Min Max Min MaxSouth Fraser
Corporation of Delta Roberts Bank at Canoe Pass 'CANOE' 8065 -1.34 1.96 -1.28 1.96 -1.21 1.96 -1.15 1.96 -1.09 1.95 -1.02 1.94 -0.94 1.94Massey Tunnel 'FRASER' 18117 -0.69 2.10 -0.51 2.13 -0.34 2.18 -0.18 2.26 0.00 2.34 0.18 2.41 0.40 2.51Surrey border 'FRASER' 31926 0.64 2.39 0.92 2.54 1.27 2.73 1.64 2.95 2.06 3.19 2.44 3.44 2.82 3.70Westham Island: Roberts Bank at Cano'CANOE' 8065 -1.34 1.96 -1.28 1.96 -1.21 1.96 -1.15 1.96 -1.09 1.95 -1.02 1.94 -0.94 1.94Westham Island: Reifel Island at Ladne'FRASER' 9650 -1.54 1.94 -1.42 1.94 -1.32 1.94 -1.23 1.95 -1.15 1.96 -1.06 1.96 -0.96 1.97Westham Island: Upstream end 'LADNER' 4506 -1.04 2.05 -0.89 2.06 -0.74 2.08 -0.61 2.11 -0.47 2.14 -0.33 2.17 -0.16 2.21
City of Richmond Steveston, Garry Point Park 'FRASER' 7589 -1.70 1.91 -1.60 1.91 -1.52 1.91 -1.44 1.91 -1.37 1.91 -1.30 1.91 -1.22 1.91Massey Tunnel 'FRASER' 18117 -0.69 2.10 -0.51 2.13 -0.34 2.18 -0.18 2.26 0.00 2.34 0.18 2.41 0.40 2.51New Westminster Border 'ANNACIS' 3136 0.26 2.29 0.50 2.39 0.83 2.54 1.15 2.73 1.49 2.94 1.84 3.13 2.19 3.34
City of New Westminster City of Richmond Border 'ANNACIS' 3136 0.26 2.29 0.50 2.39 0.83 2.54 1.15 2.73 1.49 2.94 1.84 3.13 2.19 3.34Trifurcation 'FRASER' 34089 0.65 2.40 0.94 2.55 1.32 2.75 1.72 2.97 2.14 3.23 2.52 3.48 2.91 3.74
City of Surrey Delta border 'FRASER' 31926 0.64 2.39 0.92 2.54 1.27 2.73 1.64 2.95 2.06 3.19 2.44 3.44 2.82 3.70Township of Langley border 'BARNSTON' 6011 2.84 3.51 3.27 3.84 3.76 4.24 4.23 4.63 4.71 5.05 5.15 5.46 5.53 5.85
Barnston Diking District Barnston Island: downstream end 'BARNSTON' 0 0.77 2.42 1.06 2.58 1.43 2.78 1.82 3.02 2.24 3.28 2.63 3.54 3.01 3.81Barnston Island: upstream end 'BARNSTON' 7446 2.97 3.60 3.41 3.94 3.89 4.35 4.37 4.75 4.86 5.18 5.30 5.60 5.68 6.00
Township of Langley Surrey border 'BARNSTON' 6011 2.84 3.51 3.27 3.84 3.76 4.24 4.23 4.63 4.71 5.05 5.15 5.46 5.53 5.85Jacob-Haldi Bridge 'MCMILLAN' 2644 3.86 4.33 4.36 4.76 4.89 5.22 5.41 5.71 5.98 6.29 6.44 6.72 6.95 7.25Abbotsford border 'FRASER' 70804 4.47 4.84 4.98 5.29 5.49 5.75 6.00 6.22 6.52 6.75 6.99 7.23 7.46 7.71
City of Abbotsford Langley border 'FRASER' 70804 4.47 4.84 4.98 5.29 5.49 5.75 6.00 6.22 6.52 6.75 6.99 7.23 7.46 7.71Mission Bridge 'FRASER' 85182 5.74 6.00 6.30 6.50 6.82 7.00 7.34 7.50 7.87 8.00 8.32 8.50 8.81 9.00
Notes:1. All water levels estimated using MIKE11 model.2. Inflow boundary condition at Mission estimated from MIKE11 rating curve for Mission.3. Downstream boundary condition based on highest recorded tide level from June 24th, 1982.4. Maximum and Minimum expected water levels shown for 24.6 hour tidal cycle around the June 24th peak.5. Roughness values for New Westminster to Mission reach vary linearly for flows between calibration flow (12000 cms) and design flow (18900 cms)
Caution:This data is provided for planning purposes only and is subject to variation related to actual inflows and tide levels and to local changes to the river. This data does not replace water level estimates from real-time modelling.
LocationMunicipality/Diking District 11200 cms 12350 cms 13725 cms
7 m6 m 6.5 m 7.5 m 8 m 8.5 m 9 mMIKE 11 Chainage 15050 cms 16450 cms 17800 cms 19225 cms

Table H.2: Typical Water Levels for Various Water Levels at Mission (Upper Model)
Water Level at Mission 6 m 6.5 m 7 m 7.5 m 8 m 8.5 m 9 mCorresponding Inflow at Hope 9750 cms 10750 cms 12000 cms 13225 cms 14525 cms 15775 cms 17125 cms
District of Mission Mission Bridge FRASER_R 85400 6.00 6.50 7.00 7.50 8.00 8.50 9.00FVRD Electoral Area G border FRASER_R 89872 6.31 6.84 7.38 7.91 8.45 8.97 9.50
FVRD Mission border FRASER_R 89872 6.31 6.84 7.38 7.91 8.45 8.97 9.50Electoral Area G Downstream end Nicomen Island FRASER_R 95540 6.78 7.33 7.90 8.45 9.01 9.55 10.10
FVRD Electoral Area C border FRASER_R 107234 8.04 8.52 9.05 9.55 10.07 10.57 11.09FVRD FVRD Electoral Area G border FRASER_R 107234 8.04 8.52 9.05 9.55 10.07 10.57 11.09Electoral Area C District of Kent border (Harrison River) FRASER_R 117387 11.36 11.76 12.18 12.57 12.97 13.36 13.76
Harrison River at Lake HARRISON_R17845 11.83 12.20 12.57 12.91 13.26 13.60 13.96District of Kent FVRD Electoral Area C border FRASER_R 117387 11.36 11.76 12.18 12.57 12.97 13.36 13.76
Hammersley Pump Station FRASER_R 124155 13.76 14.09 14.47 14.82 15.18 15.52 15.88Upstream of Agassiz Bridge FRASER_R 131184 16.72 17.04 17.42 17.75 18.07 18.36 18.67Maria Slough MARIA_S 0 18.35 18.68 19.05 19.39 19.72 20.02 20.33
Seabird First Nation Maria Slough MARIA_S 0 18.35 18.68 19.05 19.39 19.72 20.02 20.33Upstream end Seabird Island FRASER_R 147935 25.00 25.31 25.66 25.98 26.30 26.59 26.88
FVRD Upstream end Seabird Island FRASER_R 147935 25.00 25.31 25.66 25.98 26.30 26.59 26.88Electoral District C Laidlaw FRASER_R 154447 29.40 29.78 30.24 30.64 31.04 31.38 31.72
City of Abbotsford Mission Bridge FRASER_R 85400 6.00 6.50 7.00 7.50 8.00 8.50 9.00FVRD Electoral Area H border FRASER_R 92864 6.55 7.09 7.64 8.18 8.73 9.26 9.80
FVRD Abbotsford border FRASER_R 92864 6.55 7.09 7.64 8.18 8.73 9.26 9.80Electoral Area H Chilliwack border FRASER_R 99944 7.20 7.76 8.34 8.90 9.47 10.02 10.57City of Chilliwack FVRD Electoral Area H border FRASER_R 99944 7.20 7.76 8.34 8.90 9.47 10.02 10.57
Minto Landing MINTO_C 3073 10.59 10.98 11.42 11.84 12.26 12.67 13.10FVRD Electoral Area D border SC_122760L 6322 16.59 16.91 17.28 17.61 17.93 18.23 18.55
FVRD Chilliwack border SC_122760L 6322 16.59 16.91 17.28 17.61 17.93 18.23 18.55Electoral Area D Upstream of Agassiz Bridge FRASER_R 131184 16.72 17.04 17.42 17.75 18.07 18.36 18.67
FVRD Electoral Area B border FRASER_R 145700 23.78 24.10 24.45 24.77 25.08 25.37 25.66FVRD FVRD Electoral Area D border FRASER_R 145700 23.78 24.10 24.45 24.77 25.08 25.37 25.66Electoral Area B Laidlaw FRASER_R 154447 29.40 29.78 30.24 30.64 31.04 31.38 31.72
Notes:1. All water levels estimated using MIKE11 model.2. Inflow boundary condition at Hope based on total expected flow at Mission from rating Curve.3. Downstream boundary condition based on scenario.4. Maximum and Minimum expected water levels shown for 24.6 hour tidal cycle around the June 24th peak.
Caution:This data is provided for planning purposes only and is subject to variation related to actual inflows and tide levels and to local changes to the river. This data does not replace water level estimates from real-time modelling.
South Fraser
Municipality/Diking District Location MIKE 11
ChainageNorth Fraser

Table H.3: Typical Water Levels at Gauge Locations for Various Water Levels at Mission by Gauge
Water Level at Mission 6 m 6.5 m 7 m 7.5 m 8 m 8.5 m 9 mCorresponding Inflow at Hope 9750 10750 12000 13225 14525 15775 17125
Corresponding Inflow at Mission 11200 12350 13725 15050 16450 17800 19225Bath Slough Continuous 'NORTH ARM' 18172 2.10 2.14 2.21 2.31 2.41 2.51 2.62Fraser River at Byrne Creek Continuous 'NORTH ARM' 23736 2.22 2.30 2.40 2.52 2.65 2.80 2.94Queensborough Continuous 'NORTH ARM' 26666 2.30 2.41 2.53 2.68 2.87 3.04 3.22CNW Fraser River Pile and Dredge Staff 'NORTH ARM' 29537 2.35 2.49 2.63 2.82 3.03 3.24 3.47Fraser R. at Steveston - 08MH028 Continuous 'FRASER' 9163 1.94 1.93 1.94 1.94 1.95 1.95 1.963395 River Road Continuous 'CANOE' 10617 2.01 2.02 2.05 2.07 2.08 2.11 2.16Elliot & River Road Continuous 'LADNER' 7584 2.08 2.11 2.16 2.21 2.27 2.33 2.4062B & River Road Continuous 'FRASER' 18117 2.10 2.13 2.18 2.26 2.34 2.41 2.51No. 6 Road Continuous 'FRASER' 19322 2.13 2.18 2.25 2.34 2.44 2.55 2.67Nelson Road Continuous 'FRASER' 24152 2.21 2.28 2.38 2.53 2.69 2.84 3.009600 River Road Continuous 'FRASER' 29120 2.27 2.39 2.54 2.72 2.92 3.11 3.32Carter PS (Queensborough) Staff 'ANNACIS' 4845 2.31 2.46 2.61 2.81 3.03 3.24 3.46New Westminster Continuous 'FRASER' 35451 2.48 2.66 2.90 3.16 3.46 3.75 4.05Manson Continuous 'FRASER' 34655 2.45 2.62 2.84 3.09 3.37 3.64 3.93CNW Quayside Staff 'FRASER' 34655 2.45 2.62 2.84 3.09 3.37 3.64 3.93CNW Winvan Staff 'SAPPERTON' 1206 2.58 2.78 3.05 3.34 3.67 3.99 4.32Fraser R. at Port Mann PS - 08MH126 Continuous/Staff 'FRASER' 41158 2.64 2.87 3.16 3.46 3.81 4.15 4.49Pitt River at Argue St Continuous 'DOUGLAS' 1973 2.81 3.05 3.38 3.72 4.09 4.45 4.80Kennedy Slough PS Staff 'PITT' 2760 2.84 3.09 3.43 3.77 4.15 4.52 4.88Coquitlam, Gauge on outlet structure Staff 'PITT' 7714 2.78 3.05 3.39 3.74 4.11 4.47 4.85Baynes Road Continuous 'FRASER' 50737 3.27 3.58 3.96 4.33 4.74 5.14 5.52192nd Street Continuous 'BARNSTON' 5613 3.47 3.80 4.20 4.58 5.01 5.41 5.80Yorkson Staff 'BARNSTON' 6772 3.56 3.89 4.29 4.69 5.12 5.53 5.93GEB Burnco Continuous 'FRASER' 53954 3.69 4.04 4.45 4.86 5.30 5.73 6.13Salmon River Confluence Continuous 'MCMILLAN' 1016 4.21 4.62 5.07 5.51 5.98 6.46 6.86Salmon River PS Staff 'MCMILLAN' 1669 4.25 4.66 5.11 5.54 6.00 6.49 6.87Albion Ferry Dock Staff 'FRASER' 63234 4.25 4.66 5.10 5.55 6.05 6.51 6.97Glen Valley PS Staff 'CRESCENT' 381 4.88 5.33 5.79 6.27 6.80 7.28 7.76Fraser R. at Whonnock - 08MH044 Continuous 'FRASER' 70006 4.79 5.23 5.69 6.16 6.68 7.15 7.63Silverdale PS Staff 'FRASER' 76811 5.23 5.70 6.17 6.66 7.20 7.68 8.18McLennan Creek PS Staff 'MATSQUI' 4284 5.60 6.11 6.61 7.12 7.69 8.20 8.72Matsqui Slough Discharge Continuous 'MATSQUI' 5620 5.74 6.24 6.73 7.23 7.80 8.30 8.81Fraser R. at Mission - 08MH024 Continuous/Staff 'FRASER' 85182 6.00 6.50 7.00 7.50 8.00 8.50 9.00Dewdney PS Continuous FRASER_R 90676 6.37 6.91 7.45 7.99 8.53 9.07 9.60Robson PS Staff STRAWBERRY_S 372 6.79 7.34 7.91 8.47 9.04 9.59 10.14McGillivray Slough PS Staff SUMAS_R 3050 7.23 7.79 8.37 8.94 9.51 10.08 10.63Collinson PS Staff VEDDER_R 2828 7.30 7.84 8.42 8.97 9.53 10.11 10.66Quaamitch Slough Staff SC_102218R 1677 7.62 8.15 8.72 9.26 9.81 10.34 10.88Chilliwack Creek PS (Wolfe Road) Staff SKWAY_IR5 0 8.35 8.81 9.31 9.80 10.31 10.80 11.31Bell Dam Staff SC_110122R 0 8.75 9.17 9.65 10.10 10.58 11.04 11.52Hope Slough at Young St. Staff HOPE_S 3060 8.86 9.27 9.73 10.19 10.65 11.11 11.58Minto Landing Area (Bell Slough) Staff MINTO_C 3073 10.59 10.98 11.42 11.84 12.26 12.67 13.10Harrison R. at Harrison Mills - 08MG014 Continuous/Staff HARRISON_R 1084 11.39 11.78 12.20 12.59 12.99 13.38 13.77Duncan Bateson PS Staff HARRISON_R 4627.8 11.49 11.89 12.31 12.69 13.09 13.46 13.85Harrison R. below Morris Creek - 08MG022 Continuous HARRISON_R 9248.8 11.58 11.97 12.37 12.74 13.12 13.49 13.87Carey Point Staff GREYELL_S 45.1 13.06 13.40 13.79 14.16 14.54 14.90 15.27Hammersley PS Staff FRASER_R 124155 13.76 14.09 14.47 14.82 15.18 15.52 15.88Limbert Road Staff FP_124155R 1943 14.21 14.52 14.88 15.21 15.56 15.88 16.22915m West of Gill Road Staff GREYELL_S 3931 13.58 13.91 14.28 14.64 15.01 15.39 15.79650m West of Gill Road Staff GREYELL_S 4368 14.72 15.04 15.40 15.74 16.11 16.43 16.76Chip (Camp-Hope) Intake Staff SC_122760L 5713 16.28 16.59 16.95 17.28 17.60 17.91 18.22Agassiz-Rosedale Bridge Staff FRASER_R 131022 16.63 16.92 17.27 17.58 17.88 18.17 18.47Tranmer Plant Staff AGASSIZ_CHEAM 4590 17.80 18.11 18.40 18.67 18.96 19.24 19.53Wahleach Powerhouse Continuous SC_132593L 2210 17.59 17.93 18.31 18.65 18.98 19.28 19.59Maria Slough Staff MARIA_S 1648 18.75 19.11 19.65 20.10 20.49 20.81 21.15Cuthbert Road Staff MARIA_S 3097 18.75 19.11 19.66 20.11 20.50 20.82 21.17Herrling Island Staff SC_132593L 8029 20.26 20.51 20.79 21.03 21.27 21.50 21.74Seabird Island Staff FRASER_R 142256 21.68 21.93 22.22 22.49 22.75 22.99 23.23Johnson Slough Staff SC_149184R 1093 26.47 26.81 27.21 27.59 27.97 28.31 28.65Wahleach (Jones) Creek Staff FRASER_R 150935 26.63 26.94 27.31 27.66 28.01 28.33 28.65
Notes:1. All water levels estimated using MIKE11 model.2. Inflow boundary condition at Mission estimated from MIKE11 rating curve for Mission. Inflow boundary condition at Hope based on total expected flow at Mission from rating Curve. Reported in cms.3. Downstream boundary condition based on highest recorded tide level from June 24th, 1982.4. Maximum and Minimum expected water levels shown for 24.6 hour tidal cycle around the June 24th peak.5. If there are both staff and continous gauges at a location, only one gauge is reported.6. All flows reported in m3/s and all water levels reported in m GSC.7. Roughness values for New Westminster to Mission reach vary linearly for flows between calibration flow (12000 cms) and design flow (18900 cms).
Caution:This data is provided for planning purposes only and is subject to variation related to actual inflows and tide levels and to local changes to the river. This data does not replace water level estimates from real-time modelling.
Gauge Type MIKE 11 ChainageGauge Name (Downstream to Upstream)

APPENDIX I
DESIGN WATER LEVELS LISTED BY GAUGE

Table I.1: Design Profile for Lower Model by Gauge
(m GSC)Bath Slough Continuous 'NORTH ARM' 18172 2.96Fraser River at Byrne Creek Continuous 'NORTH ARM' 23736 3.06Queensborough Continuous 'NORTH ARM' 26666 3.12CNW Fraser River Pile and Dredge Staff 'NORTH ARM' 29537 3.25Fraser R. at Steveston - 08MH028 Continuous 'FRASER' 9163 2.843395 River Road Continuous 'CANOE' 10617 2.87Elliot & River Road Continuous 'LADNER' 7584 2.9062B & River Road Continuous 'FRASER' 18117 2.92No. 6 Road Continuous 'FRASER' 19322 2.94Nelson Road Continuous 'FRASER' 24152 3.009600 River Road Continuous 'FRASER' 29120 3.17Carter PS (Queensborough) Staff 'ANNACIS' 4845 3.47New Westminster Continuous 'FRASER' 35451 3.99Manson Continuous 'FRASER' 34655 3.89CNW Quayside Staff 'FRASER' 34655 3.89CNW Winvan Staff 'SAPPERTON' 1206 4.18Fraser R. at Port Mann PS - 08MH126 Continuous/Staff 'FRASER' 41158 4.54Pitt River at Argue St Continuous 'DOUGLAS' 1973 4.82Kennedy Slough PS Staff 'PITT' 2760 4.92Coquitlam, Gauge on outlet structure Staff 'PITT' 7714 4.92Baynes Road Continuous 'FRASER' 50737 5.56192nd Street Continuous 'BARNSTON' 5613 5.79Yorkson Staff 'BARNSTON' 6772 5.90GEB Burnco Continuous 'FRASER' 53954 6.00Salmon River Confluence Continuous 'MCMILLAN' 1016 6.79Salmon River PS Staff 'MCMILLAN' 1669 6.85Albion Ferry Dock Staff 'FRASER' 63234 6.94Glen Valley PS Staff 'CRESCENT' 381 7.70Fraser R. at Whonnock - 08MH044 Continuous 'FRASER' 70006 7.59Silverdale PS Staff 'FRASER' 76811 8.16McLennan Creek PS Staff 'MATSQUI' 4284 8.61Matsqui Slough Discharge Continuous 'MATSQUI' 5620 8.70Fraser R. at Mission - 08MH024 Continuous/Staff 'FRASER' 85182 8.87
Notes:1. Modelled water levels are based on smoothed profile.2. Water levels below chainage 28369 are based on winter design condition (200-year, 95% confidence tide event)3. Water levels above chainage 28369 are based on freshet design condition (reoccurance of 1894 event).
Gauge (Downstream to Upstream) Gauge Type MIKE 11 Chainage
Design Profile

Table I-2: Design Profile for Upper Model by Gauge
(m GSC)Dewdney PS Continuous FRASER_R 90676 9.49Robson PS Staff STRAWBERRY_S 372 10.06McGillivray Slough PS Staff SUMAS_R 3050 10.54Collinson PS Staff VEDDER_R 2828 10.56Quaamitch Slough Staff SC_102218R 1677 10.78Chilliwack Creek PS (Wolfe Road) Staff SKWAY_IR5 0 11.27Bell Dam Staff SC_110122R 0 11.47Hope Slough at Young St. Staff HOPE_S 3060 11.55Minto Landing Area (Bell Slough) Staff MINTO_C 3073 13.23Harrison R. at Harrison Mills - 08MG014 Continuous/Staff HARRISON_R 1084 13.78Duncan Bateson PS Staff HARRISON_R 4627.8 13.82Harrison R. below Morris Creek - 08MG022 Continuous HARRISON_R 9248.8 13.84Carey Point Staff GREYELL_S 45.1 15.27Hammersley PS Staff FRASER_R 124155 15.90Limbert Road Staff FP_124155R 1943 16.45915m West of Gill Road Staff GREYELL_S 3931 16.79650m West of Gill Road Staff GREYELL_S 4368 16.96Chip (Camp-Hope) Intake Staff SC_122760L 5713 18.25Agassiz-Rosedale Bridge Staff FRASER_R 131022 18.73Tranmer Plant Staff AGASSIZ_CHEAM 4590 19.87Wahleach Powerhouse Continuous SC_132593L 2210 19.58Maria Slough Staff MARIA_S 1648 21.15Cuthbert Road Staff MARIA_S 3097 21.17Herrling Island Staff SC_132593L 8029 21.73Seabird Island Staff FRASER_R 142256 23.30Johnson Slough Staff SC_149184R 1093 28.95Wahleach (Jones) Creek Staff FRASER_R 150935 28.65
Gauge Name (Downstream to Upstream) Gauge Type MIKE 11 Chainage Design Flood