Embed Size (px)
Citation preview
The Use of Whole Grains and Low Glycemic Index Diets in the Management of Type-2
Diabetes
Baillie McKenzie
NUTR 481-Fall 2013
2
Introduction
Type-2 Diabetes Mellitus (T2DM) is the most commonly diagnosed form of diabetes,1
accounting for 90-95% of patients diagnosed.2 T2DM is a disease that occurs slowly overtime
and can ultimately lead to insulin resistance (where fat, liver, and muscle cells fail to respond to
insulin properly). The leading factor for the development of T2DM is being overweight or obese,
BMI ≥25 or ≥30 respectively.3 Between 2009-2010, 35 percent of men and women in the U.S.
were obese and adults aged 60 or older were found to more likely be obese than younger adults.4
There are many other causes of T2DM such as family history, physical inactivity, poor diet, the
older aged population, or certain population groups such as African Americans, Hispanic
Americans, Native Americans, and Asian Americans/Pacific Islanders.5-6
Currently, there are about 350 million people worldwide diagnosed with T2DM.7 In 2012,
79 million people were estimated to have pre-diabetes, a condition in which patients exhibit
impaired glucose tolerance (IGT) and impaired fasting glycemia (IFG)8, in America.9-11 It is
estimated that one in twelve Americans are diagnosed with diabetes, one in four don’t know they
have it, and one in three are at risk for T2DM.12 According to the Centers for Disease Control
and Treatment, one in every three adults in the United States had pre-diabetes in 2010,13 18.8
million were diagnosed with T2DM, and seven million were undiagnosed.14
Medical nutrition therapy (MNT) has been one of the main approaches for lifestyle
modification in the management of diabetes.7,14 The main goal for MNT for patients with
diabetes is lowering of blood glucose levels.14 Some approaches to lowering blood glucose levels
include diets rich in whole grains or low in glycemic index levels diets. 1,6-8,14-17
3
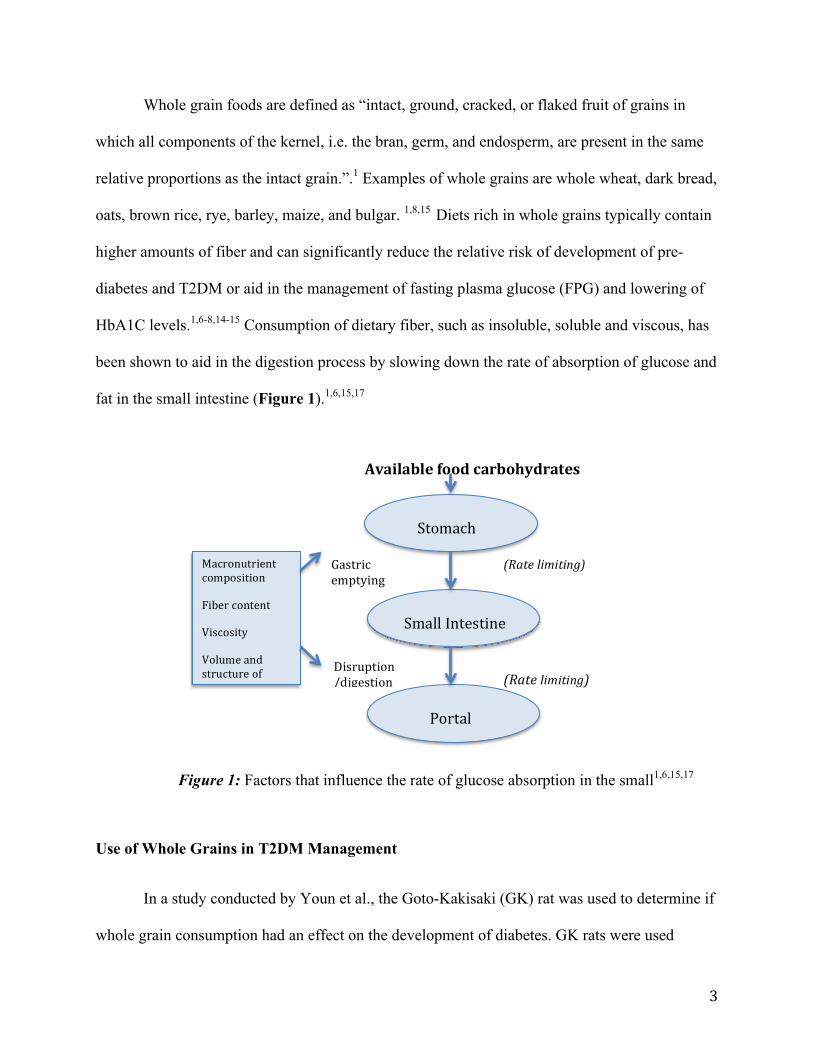
Whole grain foods are defined as “intact, ground, cracked, or flaked fruit of grains in
which all components of the kernel, i.e. the bran, germ, and endosperm, are present in the same
relative proportions as the intact grain.”.1 Examples of whole grains are whole wheat, dark bread,
oats, brown rice, rye, barley, maize, and bulgar. 1,8,15 Diets rich in whole grains typically contain
higher amounts of fiber and can significantly reduce the relative risk of development of pre-
diabetes and T2DM or aid in the management of fasting plasma glucose (FPG) and lowering of
HbA1C levels.1,6-8,14-15 Consumption of dietary fiber, such as insoluble, soluble and viscous, has
been shown to aid in the digestion process by slowing down the rate of absorption of glucose and
fat in the small intestine (Figure 1).1,6,15,17
Use of Whole Grains in T2DM Management
In a study conducted by Youn et al., the Goto-Kakisaki (GK) rat was used to determine if
whole grain consumption had an effect on the development of diabetes. GK rats were used
Disruption/digestion
Macronutrient composition
Fiber content
Viscosity
Volume and structure of the food
Gastric emptying
Stomach
Small Intestine
Portal Circulation
(Rate limiting)
(Rate limiting)
Available food carbohydrates
Figure 1: Factors that influence the rate of glucose absorption in the small1,6,15,17
4
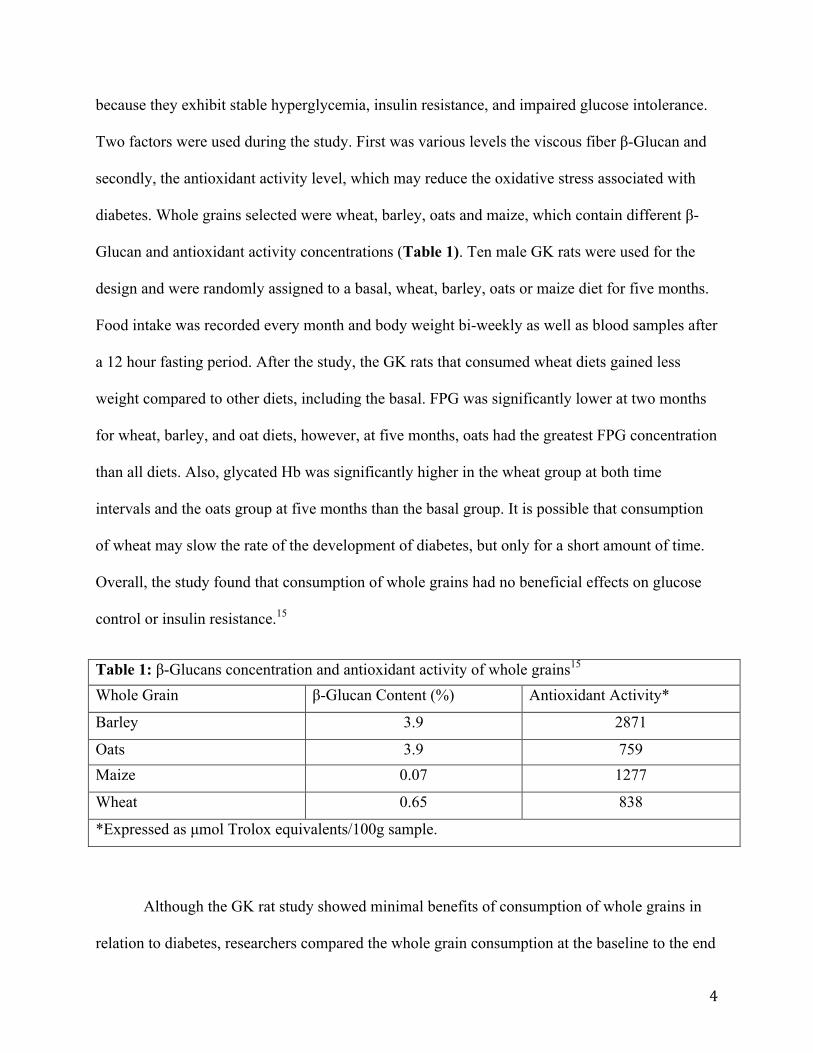
because they exhibit stable hyperglycemia, insulin resistance, and impaired glucose intolerance.
Two factors were used during the study. First was various levels the viscous fiber β-Glucan and
secondly, the antioxidant activity level, which may reduce the oxidative stress associated with
diabetes. Whole grains selected were wheat, barley, oats and maize, which contain different β-
Glucan and antioxidant activity concentrations (Table 1). Ten male GK rats were used for the
design and were randomly assigned to a basal, wheat, barley, oats or maize diet for five months.
Food intake was recorded every month and body weight bi-weekly as well as blood samples after
a 12 hour fasting period. After the study, the GK rats that consumed wheat diets gained less
weight compared to other diets, including the basal. FPG was significantly lower at two months
for wheat, barley, and oat diets, however, at five months, oats had the greatest FPG concentration
than all diets. Also, glycated Hb was significantly higher in the wheat group at both time
intervals and the oats group at five months than the basal group. It is possible that consumption
of wheat may slow the rate of the development of diabetes, but only for a short amount of time.
Overall, the study found that consumption of whole grains had no beneficial effects on glucose
control or insulin resistance.15
Table 1: β-Glucans concentration and antioxidant activity of whole grains15
Whole Grain β-Glucan Content (%) Antioxidant Activity*
Barley 3.9 2871
Oats 3.9 759 Maize 0.07 1277
Wheat 0.65 838
*Expressed as µmol Trolox equivalents/100g sample.
Although the GK rat study showed minimal benefits of consumption of whole grains in
relation to diabetes, researchers compared the whole grain consumption at the baseline to the end
5
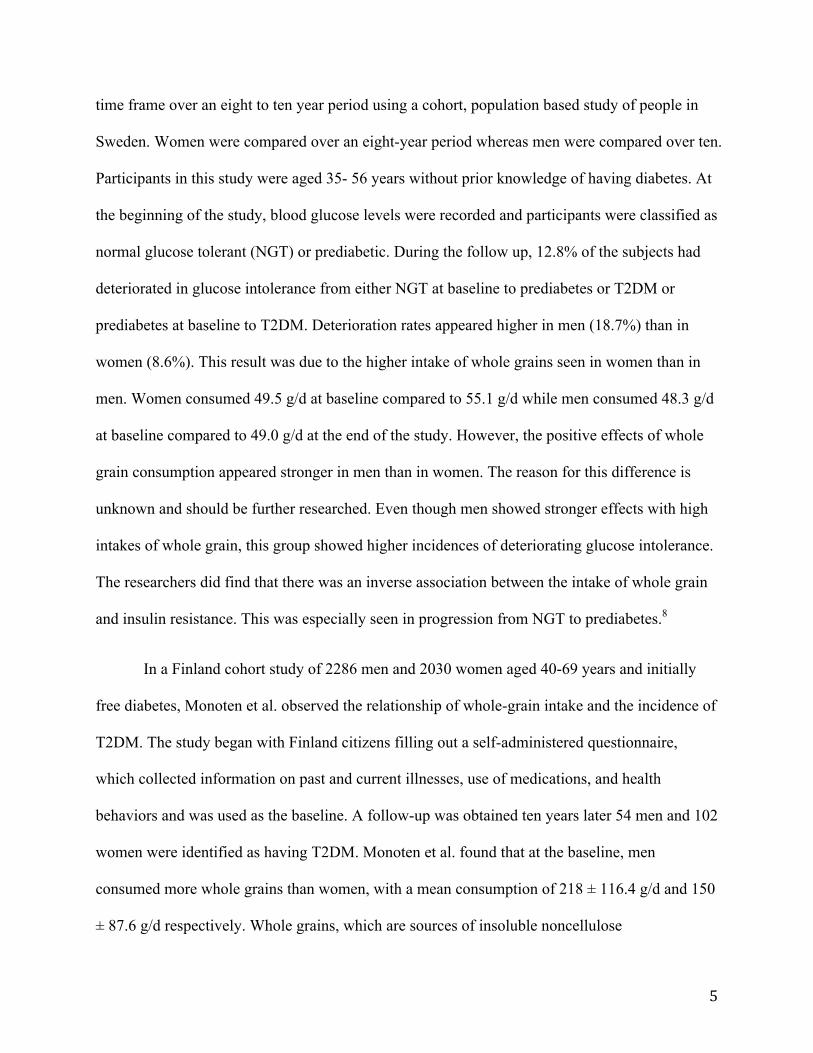
time frame over an eight to ten year period using a cohort, population based study of people in
Sweden. Women were compared over an eight-year period whereas men were compared over ten.
Participants in this study were aged 35- 56 years without prior knowledge of having diabetes. At
the beginning of the study, blood glucose levels were recorded and participants were classified as
normal glucose tolerant (NGT) or prediabetic. During the follow up, 12.8% of the subjects had
deteriorated in glucose intolerance from either NGT at baseline to prediabetes or T2DM or
prediabetes at baseline to T2DM. Deterioration rates appeared higher in men (18.7%) than in
women (8.6%). This result was due to the higher intake of whole grains seen in women than in
men. Women consumed 49.5 g/d at baseline compared to 55.1 g/d while men consumed 48.3 g/d
at baseline compared to 49.0 g/d at the end of the study. However, the positive effects of whole
grain consumption appeared stronger in men than in women. The reason for this difference is
unknown and should be further researched. Even though men showed stronger effects with high
intakes of whole grain, this group showed higher incidences of deteriorating glucose intolerance.
The researchers did find that there was an inverse association between the intake of whole grain
and insulin resistance. This was especially seen in progression from NGT to prediabetes.8
In a Finland cohort study of 2286 men and 2030 women aged 40-69 years and initially
free diabetes, Monoten et al. observed the relationship of whole-grain intake and the incidence of
T2DM. The study began with Finland citizens filling out a self-administered questionnaire,
which collected information on past and current illnesses, use of medications, and health
behaviors and was used as the baseline. A follow-up was obtained ten years later 54 men and 102
women were identified as having T2DM. Monoten et al. found that at the baseline, men
consumed more whole grains than women, with a mean consumption of 218 ± 116.4 g/d and 150
± 87.6 g/d respectively. Whole grains, which are sources of insoluble noncellulose
6
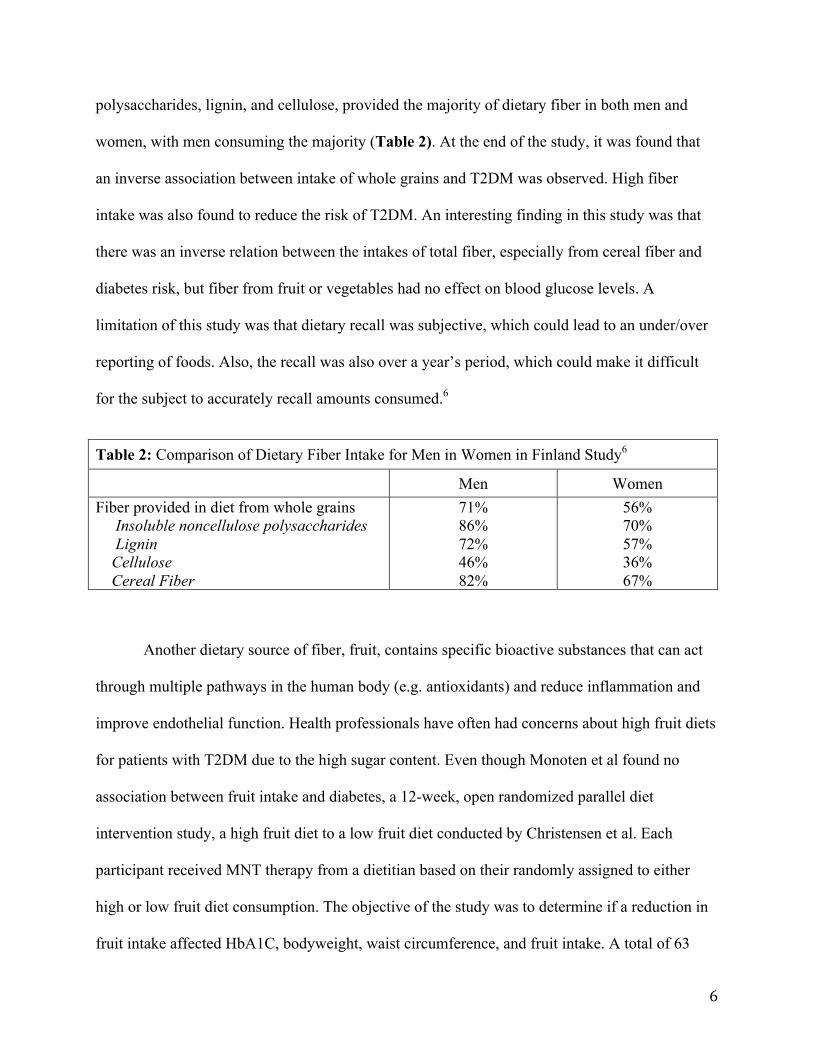
polysaccharides, lignin, and cellulose, provided the majority of dietary fiber in both men and
women, with men consuming the majority (Table 2). At the end of the study, it was found that
an inverse association between intake of whole grains and T2DM was observed. High fiber
intake was also found to reduce the risk of T2DM. An interesting finding in this study was that
there was an inverse relation between the intakes of total fiber, especially from cereal fiber and
diabetes risk, but fiber from fruit or vegetables had no effect on blood glucose levels. A
limitation of this study was that dietary recall was subjective, which could lead to an under/over
reporting of foods. Also, the recall was also over a year’s period, which could make it difficult
for the subject to accurately recall amounts consumed.6
Table 2: Comparison of Dietary Fiber Intake for Men in Women in Finland Study6
Men Women Fiber provided in diet from whole grains Insoluble noncellulose polysaccharides Lignin Cellulose Cereal Fiber
71% 86% 72% 46% 82%
56% 70% 57% 36% 67%
Another dietary source of fiber, fruit, contains specific bioactive substances that can act
through multiple pathways in the human body (e.g. antioxidants) and reduce inflammation and
improve endothelial function. Health professionals have often had concerns about high fruit diets
for patients with T2DM due to the high sugar content. Even though Monoten et al found no
association between fruit intake and diabetes, a 12-week, open randomized parallel diet
intervention study, a high fruit diet to a low fruit diet conducted by Christensen et al. Each
participant received MNT therapy from a dietitian based on their randomly assigned to either
high or low fruit diet consumption. The objective of the study was to determine if a reduction in
fruit intake affected HbA1C, bodyweight, waist circumference, and fruit intake. A total of 63
7
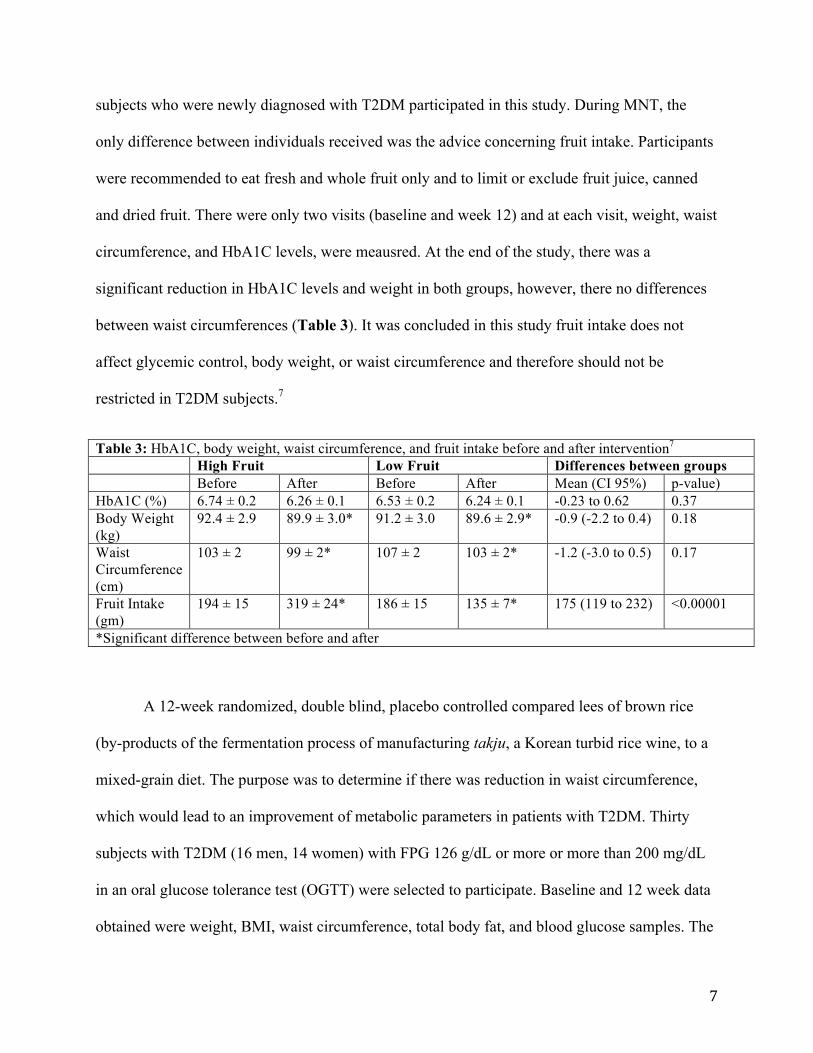
subjects who were newly diagnosed with T2DM participated in this study. During MNT, the
only difference between individuals received was the advice concerning fruit intake. Participants
were recommended to eat fresh and whole fruit only and to limit or exclude fruit juice, canned
and dried fruit. There were only two visits (baseline and week 12) and at each visit, weight, waist
circumference, and HbA1C levels, were meausred. At the end of the study, there was a
significant reduction in HbA1C levels and weight in both groups, however, there no differences
between waist circumferences (Table 3). It was concluded in this study fruit intake does not
affect glycemic control, body weight, or waist circumference and therefore should not be
restricted in T2DM subjects.7
Table 3: HbA1C, body weight, waist circumference, and fruit intake before and after intervention7
High Fruit Low Fruit Differences between groups Before After Before After Mean (CI 95%) p-value) HbA1C (%) 6.74 ± 0.2 6.26 ± 0.1 6.53 ± 0.2 6.24 ± 0.1 -0.23 to 0.62 0.37 Body Weight (kg)
92.4 ± 2.9 89.9 ± 3.0* 91.2 ± 3.0 89.6 ± 2.9* -0.9 (-2.2 to 0.4) 0.18
Waist Circumference (cm)
103 ± 2 99 ± 2* 107 ± 2 103 ± 2* -1.2 (-3.0 to 0.5) 0.17
Fruit Intake (gm)
194 ± 15 319 ± 24* 186 ± 15 135 ± 7* 175 (119 to 232) <0.00001
*Significant difference between before and after
A 12-week randomized, double blind, placebo controlled compared lees of brown rice
(by-products of the fermentation process of manufacturing takju, a Korean turbid rice wine, to a
mixed-grain diet. The purpose was to determine if there was reduction in waist circumference,
which would lead to an improvement of metabolic parameters in patients with T2DM. Thirty
subjects with T2DM (16 men, 14 women) with FPG 126 g/dL or more or more than 200 mg/dL
in an oral glucose tolerance test (OGTT) were selected to participate. Baseline and 12 week data
obtained were weight, BMI, waist circumference, total body fat, and blood glucose samples. The
8
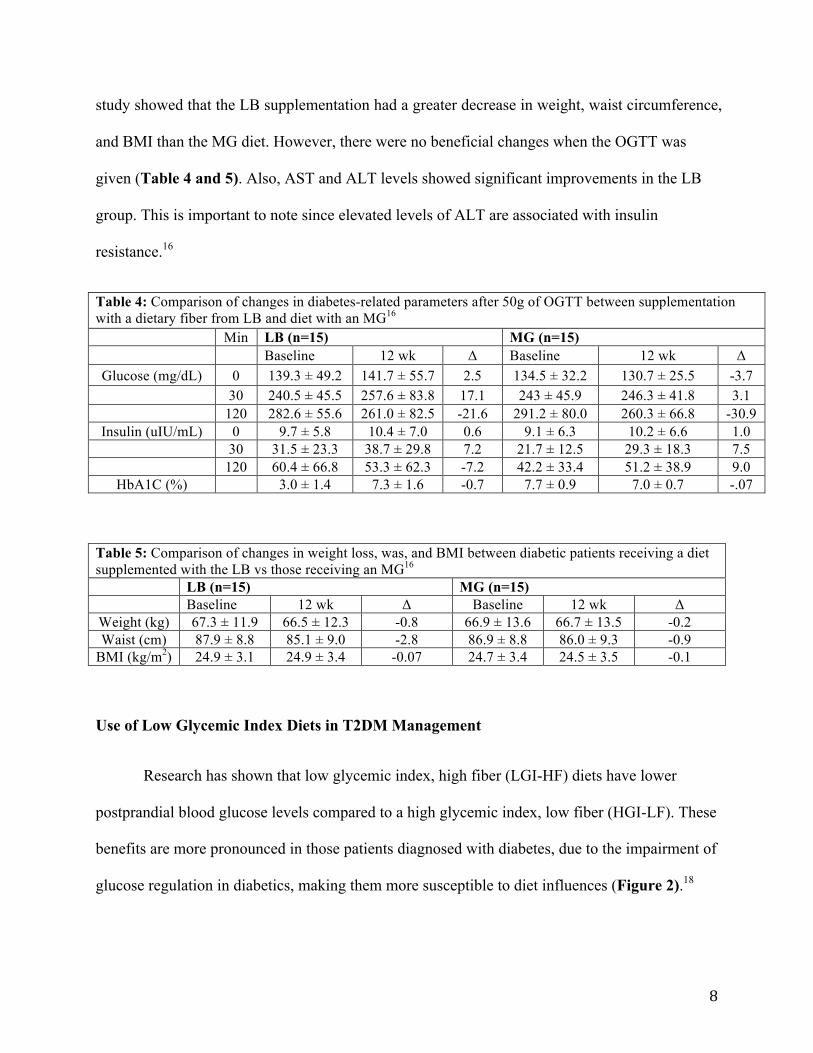
study showed that the LB supplementation had a greater decrease in weight, waist circumference,
and BMI than the MG diet. However, there were no beneficial changes when the OGTT was
given (Table 4 and 5). Also, AST and ALT levels showed significant improvements in the LB
group. This is important to note since elevated levels of ALT are associated with insulin
resistance.16
Table 4: Comparison of changes in diabetes-related parameters after 50g of OGTT between supplementation with a dietary fiber from LB and diet with an MG16
Min LB (n=15) MG (n=15) Baseline 12 wk Δ Baseline 12 wk Δ
Glucose (mg/dL) 0 139.3 ± 49.2 141.7 ± 55.7 2.5 134.5 ± 32.2 130.7 ± 25.5 -3.7 30 240.5 ± 45.5 257.6 ± 83.8 17.1 243 ± 45.9 246.3 ± 41.8 3.1
120 282.6 ± 55.6 261.0 ± 82.5 -21.6 291.2 ± 80.0 260.3 ± 66.8 -30.9 Insulin (uIU/mL) 0 9.7 ± 5.8 10.4 ± 7.0 0.6 9.1 ± 6.3 10.2 ± 6.6 1.0
30 31.5 ± 23.3 38.7 ± 29.8 7.2 21.7 ± 12.5 29.3 ± 18.3 7.5 120 60.4 ± 66.8 53.3 ± 62.3 -7.2 42.2 ± 33.4 51.2 ± 38.9 9.0
HbA1C (%) 3.0 ± 1.4 7.3 ± 1.6 -0.7 7.7 ± 0.9 7.0 ± 0.7 -.07
Table 5: Comparison of changes in weight loss, was, and BMI between diabetic patients receiving a diet supplemented with the LB vs those receiving an MG16
LB (n=15) MG (n=15) Baseline 12 wk Δ Baseline 12 wk Δ
Weight (kg) 67.3 ± 11.9 66.5 ± 12.3 -0.8 66.9 ± 13.6 66.7 ± 13.5 -0.2 Waist (cm) 87.9 ± 8.8 85.1 ± 9.0 -2.8 86.9 ± 8.8 86.0 ± 9.3 -0.9
BMI (kg/m2) 24.9 ± 3.1 24.9 ± 3.4 -0.07 24.7 ± 3.4 24.5 ± 3.5 -0.1
Use of Low Glycemic Index Diets in T2DM Management
Research has shown that low glycemic index, high fiber (LGI-HF) diets have lower
postprandial blood glucose levels compared to a high glycemic index, low fiber (HGI-LF). These
benefits are more pronounced in those patients diagnosed with diabetes, due to the impairment of
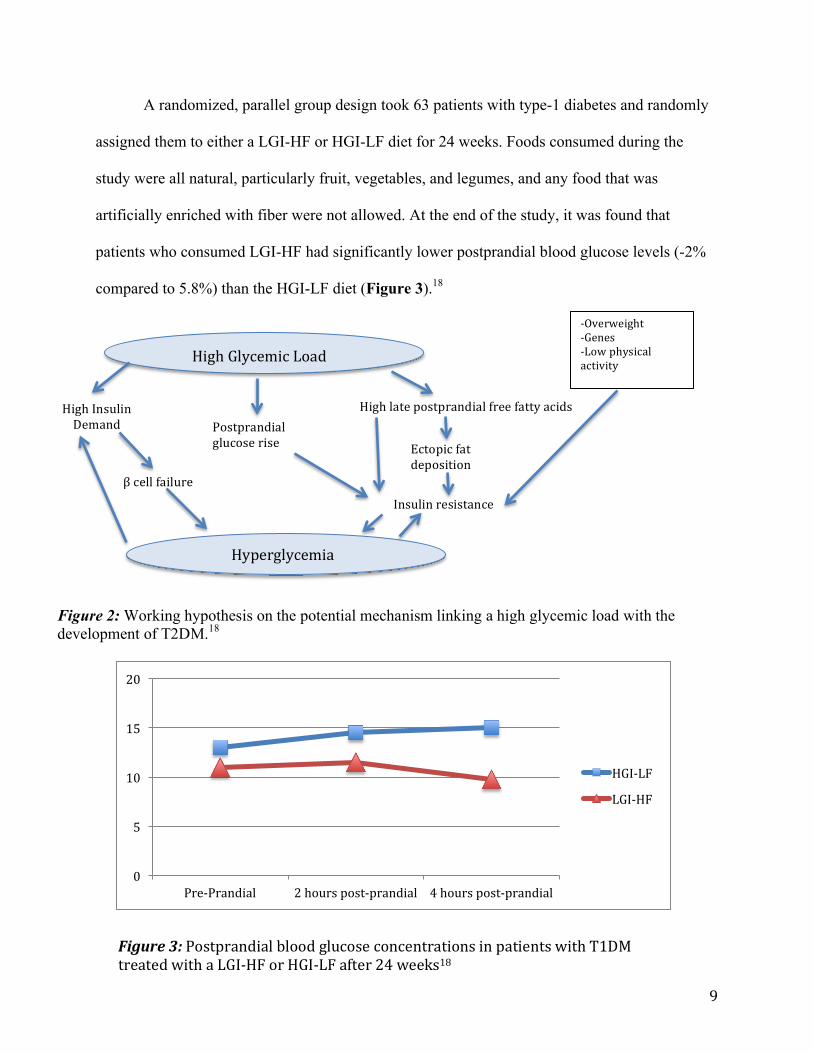
glucose regulation in diabetics, making them more susceptible to diet influences (Figure 2).18
9
A randomized, parallel group design took 63 patients with type-1 diabetes and randomly
assigned them to either a LGI-HF or HGI-LF diet for 24 weeks. Foods consumed during the
study were all natural, particularly fruit, vegetables, and legumes, and any food that was
artificially enriched with fiber were not allowed. At the end of the study, it was found that
patients who consumed LGI-HF had significantly lower postprandial blood glucose levels (-2%
compared to 5.8%) than the HGI-LF diet (Figure 3).18
High Glycemic Load
High Insulin Demand Postprandial
glucose rise
High late postprandial free fatty acids
Ectopic fat deposition
Insulin resistance
-‐Overweight -‐Genes -‐Low physical activity
β cell failure
Hyperglycemia
Figure 2: Working hypothesis on the potential mechanism linking a high glycemic load with the development of T2DM.18
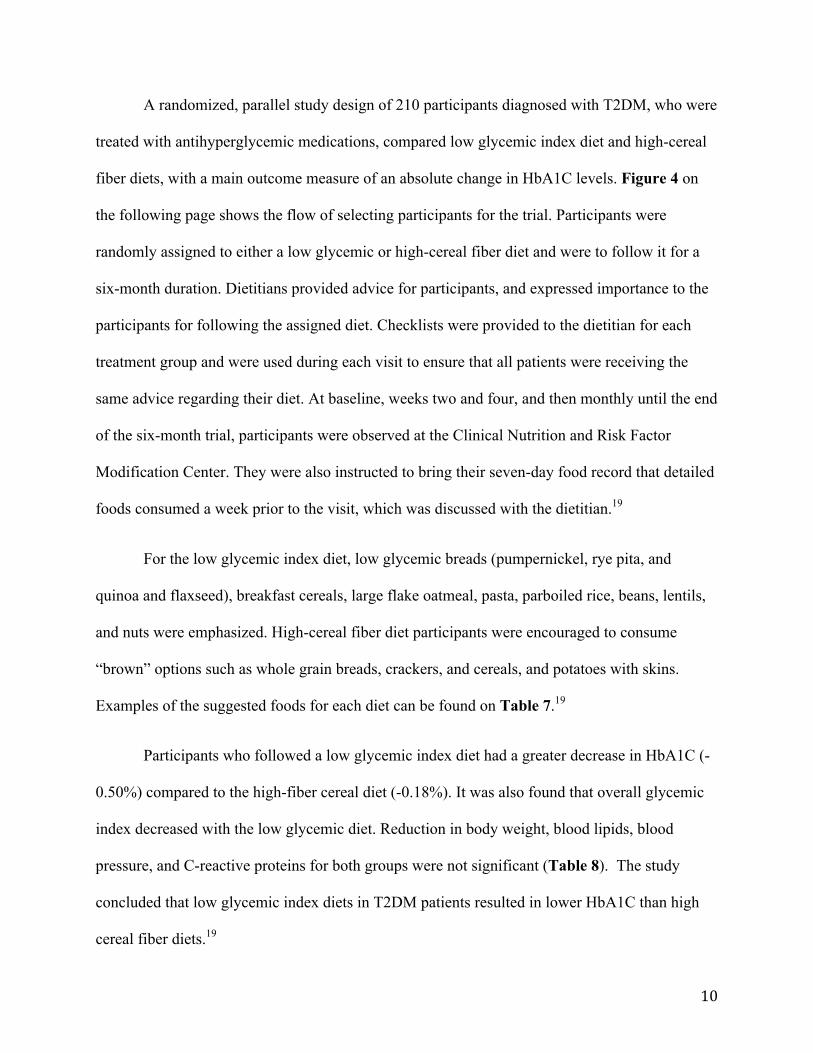
Figure 3: Postprandial blood glucose concentrations in patients with T1DM treated with a LGI-‐HF or HGI-‐LF after 24 weeks18
0
5
10
15
20
Pre-‐Prandial 2 hours post-‐prandial 4 hours post-‐prandial
HGI-‐LF
LGI-‐HF
10
A randomized, parallel study design of 210 participants diagnosed with T2DM, who were
treated with antihyperglycemic medications, compared low glycemic index diet and high-cereal
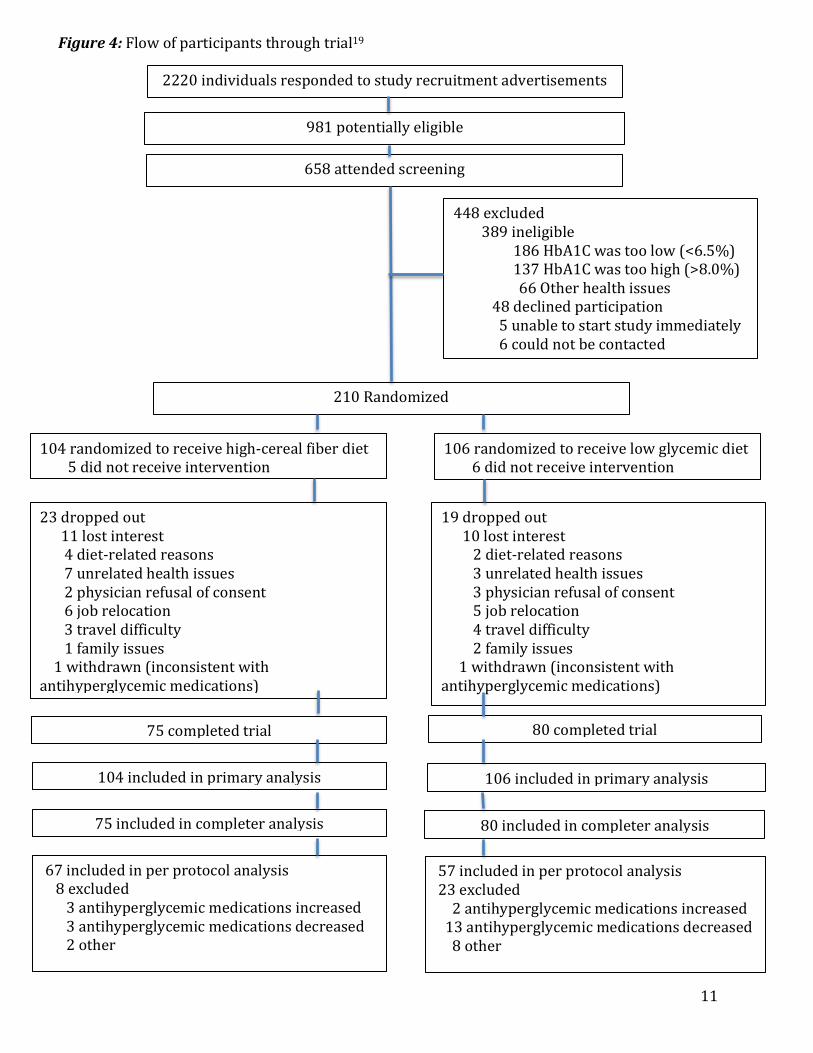
fiber diets, with a main outcome measure of an absolute change in HbA1C levels. Figure 4 on
the following page shows the flow of selecting participants for the trial. Participants were
randomly assigned to either a low glycemic or high-cereal fiber diet and were to follow it for a
six-month duration. Dietitians provided advice for participants, and expressed importance to the
participants for following the assigned diet. Checklists were provided to the dietitian for each
treatment group and were used during each visit to ensure that all patients were receiving the
same advice regarding their diet. At baseline, weeks two and four, and then monthly until the end
of the six-month trial, participants were observed at the Clinical Nutrition and Risk Factor
Modification Center. They were also instructed to bring their seven-day food record that detailed
foods consumed a week prior to the visit, which was discussed with the dietitian.19
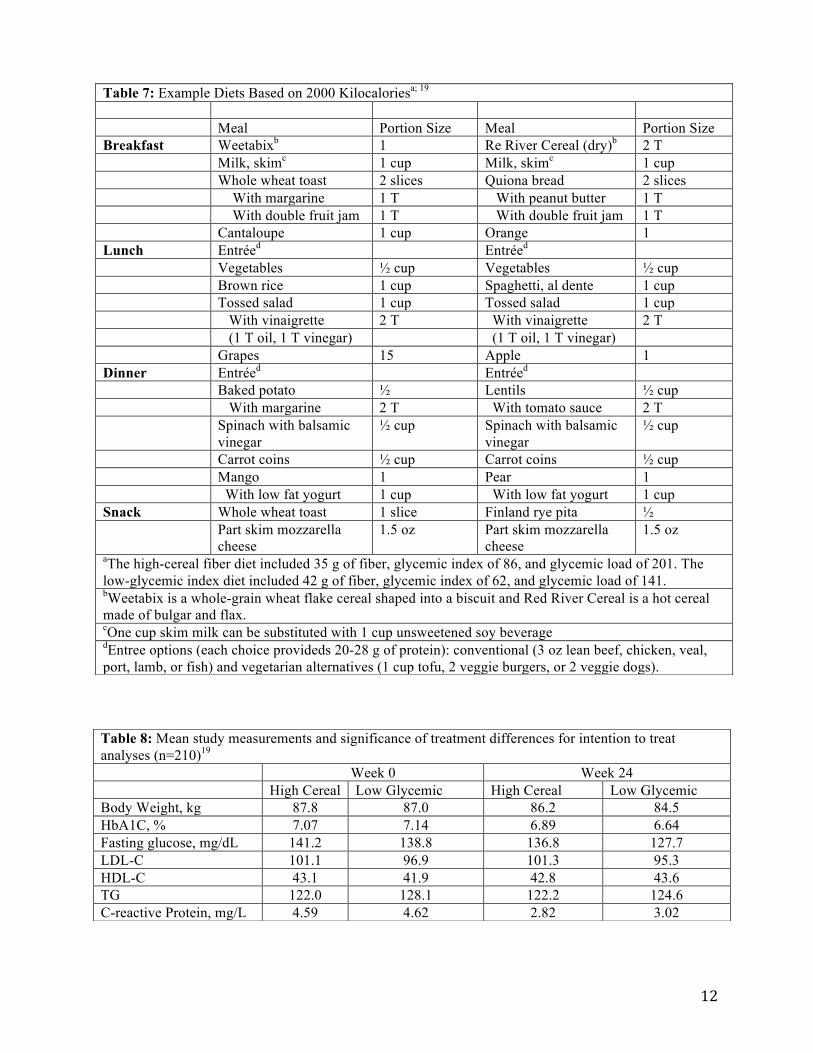
For the low glycemic index diet, low glycemic breads (pumpernickel, rye pita, and
quinoa and flaxseed), breakfast cereals, large flake oatmeal, pasta, parboiled rice, beans, lentils,
and nuts were emphasized. High-cereal fiber diet participants were encouraged to consume
“brown” options such as whole grain breads, crackers, and cereals, and potatoes with skins.
Examples of the suggested foods for each diet can be found on Table 7.19
Participants who followed a low glycemic index diet had a greater decrease in HbA1C (-
0.50%) compared to the high-fiber cereal diet (-0.18%). It was also found that overall glycemic
index decreased with the low glycemic diet. Reduction in body weight, blood lipids, blood
pressure, and C-reactive proteins for both groups were not significant (Table 8). The study
concluded that low glycemic index diets in T2DM patients resulted in lower HbA1C than high
cereal fiber diets.19
11
2220 individuals responded to study recruitment advertisements
981 potentially eligible
658 attended screening
448 excluded 389 ineligible 186 HbA1C was too low (<6.5%) 137 HbA1C was too high (>8.0%) 66 Other health issues 48 declined participation 5 unable to start study immediately 6 could not be contacted
210 Randomized
104 randomized to receive high-‐cereal fiber diet 5 did not receive intervention
106 randomized to receive low glycemic diet 6 did not receive intervention
23 dropped out 11 lost interest 4 diet-‐related reasons 7 unrelated health issues 2 physician refusal of consent 6 job relocation 3 travel difficulty 1 family issues 1 withdrawn (inconsistent with antihyperglycemic medications)
19 dropped out 10 lost interest 2 diet-‐related reasons 3 unrelated health issues 3 physician refusal of consent 5 job relocation 4 travel difficulty 2 family issues 1 withdrawn (inconsistent with antihyperglycemic medications)
75 completed trial 80 completed trial
104 included in primary analysis
75 included in completer analysis
106 included in primary analysis
80 included in completer analysis
67 included in per protocol analysis 8 excluded 3 antihyperglycemic medications increased 3 antihyperglycemic medications decreased 2 other
57 included in per protocol analysis 23 excluded 2 antihyperglycemic medications increased 13 antihyperglycemic medications decreased 8 other
Figure 4: Flow of participants through trial19
12
Table 7: Example Diets Based on 2000 Kilocaloriesa; 19
Meal Portion Size Meal Portion Size Breakfast Weetabixb 1 Re River Cereal (dry)b 2 T Milk, skimc 1 cup Milk, skimc 1 cup Whole wheat toast 2 slices Quiona bread 2 slices With margarine 1 T With peanut butter 1 T With double fruit jam 1 T With double fruit jam 1 T Cantaloupe 1 cup Orange 1 Lunch Entréed Entréed Vegetables ½ cup Vegetables ½ cup Brown rice 1 cup Spaghetti, al dente 1 cup Tossed salad 1 cup Tossed salad 1 cup With vinaigrette 2 T With vinaigrette 2 T (1 T oil, 1 T vinegar) (1 T oil, 1 T vinegar) Grapes 15 Apple 1 Dinner Entréed Entréed Baked potato ½ Lentils ½ cup With margarine 2 T With tomato sauce 2 T Spinach with balsamic
vinegar ½ cup Spinach with balsamic
vinegar ½ cup
Carrot coins ½ cup Carrot coins ½ cup Mango 1 Pear 1 With low fat yogurt 1 cup With low fat yogurt 1 cup Snack Whole wheat toast 1 slice Finland rye pita ½ Part skim mozzarella
cheese 1.5 oz Part skim mozzarella
cheese 1.5 oz
aThe high-cereal fiber diet included 35 g of fiber, glycemic index of 86, and glycemic load of 201. The low-glycemic index diet included 42 g of fiber, glycemic index of 62, and glycemic load of 141. bWeetabix is a whole-grain wheat flake cereal shaped into a biscuit and Red River Cereal is a hot cereal made of bulgar and flax. cOne cup skim milk can be substituted with 1 cup unsweetened soy beverage dEntree options (each choice provideds 20-28 g of protein): conventional (3 oz lean beef, chicken, veal, port, lamb, or fish) and vegetarian alternatives (1 cup tofu, 2 veggie burgers, or 2 veggie dogs).
Table 8: Mean study measurements and significance of treatment differences for intention to treat analyses (n=210)19
Week 0 Week 24 High Cereal Low Glycemic High Cereal Low Glycemic Body Weight, kg 87.8 87.0 86.2 84.5 HbA1C, % 7.07 7.14 6.89 6.64 Fasting glucose, mg/dL 141.2 138.8 136.8 127.7 LDL-C 101.1 96.9 101.3 95.3 HDL-C 43.1 41.9 42.8 43.6 TG 122.0 128.1 122.2 124.6 C-reactive Protein, mg/L 4.59 4.62 2.82 3.02
13
Discussion
Research shows an inverse association exists with the consumption whole grains and risk
of diabetes. However, many of the studies providing evidence had multiple limitations such as a
small sample size, short time frame, or use of subjective data that could lead to the under/over
reporting of certain food groups. These studies also didn’t have statistically significant data that
supported that whole grain consumption had any benefits in improving FPG or HbA1C levels.
Longer studies with more subjects should be conducted to support the hypothesis that whole
grain diets have statistically significant beneficial effects in the improvement of blood glucose
levels, insulin resistance, or on markers of oxidative stress.6-8,15 There is strong evidence to
support whole grain diets may reduce the risk of developing T2DM and should be increased for
those who are at higher risk or have prediabetes.1,6,8,14-16
Fiber from sources from sources such as fruit show no association between intake and
diabetes risk.6-7 Since there is no effect on diabetes risk or improving blood glucose levels, intake
of fruits should not be restricted in individuals who have T2DM.
Low glycemic index diets have shown a greater reduction in blood glucose levels
compared to high fiber diets.18-19 as well as a greater weight loss.19 These studies consisted of a
larger number of participants as well as a longer time frame. This allowed accurate interpretation
of HbA1C levels in patients (HbA1C is representative of overall glycemic control over a 12-
week period14 and most studies did not go a full 12-weeks). The only limitation was that
participants in the Jenkins et al. study (largest study) were on antihyperglycemic medications.
This could have impacted the study in determining whether or not low glycemic index diets
actually improved blood glucose levels.
14
Conclusion
Based on current research, use of low glycemic diets may be used in reducing blood
glucose levels in patients with T2DM. The use of high fiber diets has shown no long-term
beneficial effects in diabetes treatment, but there is evidence that this diet may reduce the risk of
T2DM.
15
References
1. Ye EQ, Chacko SA, Chou EL, Kugizaki M, Liu S. Greater Whole-Grain Intake is
Associated with Lower Risk of Type 2 Diabetes, Cardiovascular Disease, and Weight
Gain. Journal of Nutrition 2012 May;1304-13.
2. American Diabetes Association. Facts about Type 2 [report on the Internet]. Alexandria
(VA): ADA; 2013 [cited 2013 Oct 23];. Available from:
http://www.diabetes.org/diabetes-basics/type-2/facts-about-type-2.html
3. A. (n.d.). Advocate. Prevention. Retrieved October 10, 2013, from
http://www.diabetes.org/advocate/our-priorities/prevention/
4. N. (2012, January). Prevalence of Obesity in the United States, 2009-2010. Centers for
Disease Control and Treatment. Retrieved October 10, 2013, from
http://www.cdc.gov/nchs/data/databriefs/db82.pdf
5. Medline Plus. The National Library of Medicine [Internet]. Bethesda (MD). Type 2
Diabetes; 2013 [cited 2013 Oct 17]; [about 3 screens]. Available from:
http://www.nlm.nih.gov/medlineplus/ency/article/000313.htm
6. Montonen J, Knekt P, Jarvinen R, Aromaa A, Reunanen A. Whole-grain and fiber intake
and the incidence of type 2 diabetes. Am J Clin Nutr 2003 Jan;77:622-9.
7. Christensen AS, Viggers L, Hasselstrom K, Gregerson S. Effect of restriction on
glycemic control in patients with type 2 diabetes-a randomized trial. Nutrition Journal
2013;12(29):1-6.
8. Wirstrom T, Hilding A, Gu HF, Ostenson CG, Bjorklund A. Consumption of whole grain
reduces risk of deteriorating glucose tolerance, including progression to prediabetes. Am
J Clin Nutr 2013 Jan;97(1):179-87.
16
9. C. (2013). H.R.1257 - Preventing Diabetes in Medicare Act of 2013. Congress. Retrieved
October 10, 2013, from http://beta.congress.gov/bill/113th/house-bill/1257/text
10. A. (2013, September). The Preventing Diabetes in Medicare Act (H.R. 1257). Academy
of Nutrition and Dietetics. Retrieved October 10, 2013, from http://www.eatright.org/
Members/legislation/
11. C. (2011). National Diabetes Fact Sheet: National Estimates and General Information on
Diabetes and Prediabetes in the United States, 2011. Centers for Disease Control and
Treatment. Retrieved October 10, 2013, from http://www.cdc.gov/diabetes/pubs/
pdf/ndfs_2011.pdf
12. A. (n.d.). Diabetes by the Numbers: Stop Diabetes® American Diabetes Association.
Stop Diabetes. Retrieved October 10, 2013, from http://www.stopdiabetes.com/get-the-
facts/diabetes-by-the-numbers.html
13. C. (2011). National Health Expenditure Data. Centers for Medicare & Medicaid Services.
Retrieved October 10, 2013, from http://www.cms.gov/Research-Statistics-Data-and-
Systems/Statistics-Trends-and-Reports/NationalHealthExpendData/index.html
14. Post RE, Mainous AG, King DE, Simpson KN. Dietary Fiber for the Treatment of Type 2
Diabetes Mellitus: A Meta-Analysis. J Am Board Fam Med 2012;25:16-23.
15. Youn M, Csallany AS, Gallaher DD. Whole grain consumption has a modest effect on
the development of diabetes in the goto-kakisaki rat. Br J Nutr 2012 Jan;107(2):192-201.
16. Kim TH, Kim EK, Lee MS, Lee HK, Hwang WS, Choe SJ, Kim TY, Han SJ, Kim HJ,
Kim DJ, et al. Intake of brown rice lees reduces waist circumference and improves
metabolic parameters in type 2 diabetes. Nutr Res 2011 Feb;31(2):131-8.
17
17. Bajorek SA, Morello CM. Effects of Dietary Fiber and Low Glycemic Index Diet on
Glucose Control in Subjects with Type 2 Diabetes Mellitus. The Annals of
Pharmaeotheraoy 2010 Nov;44:1786-92.
18. Riccardi G, Rivellese AA, Giacco R. Role of glycemic index and glycemic load in the
healthy state, in prediabetes, and in diabetes. Am J Clin Nutr. 2008;87(suppl):269s-74s.
19. Jenkins DJA, Kendall CWC, McKeown-Eyssen G, Josse RG, Silverberg J, Booth GL,
Vidgen E, Josse AR, Ngyuen TH, Corrigan S, Banach MS, Ares S, Mitchell S, Emam A,
Augustin LSA, Parker TL, Leiter LA. Effect of a Low-Glycemic Index or High-Cereal
Fiber Diet on Type 2 Diabetes: A Randomized Trial. JAMA 2008;300(23):2742-53.


![[Shinobi] Bleach 481](https://img.pdfslide.us/doc/110x75/568c36c51a28ab0235994a49/shinobi-bleach-481.jpg)