Embed Size (px)
Citation preview
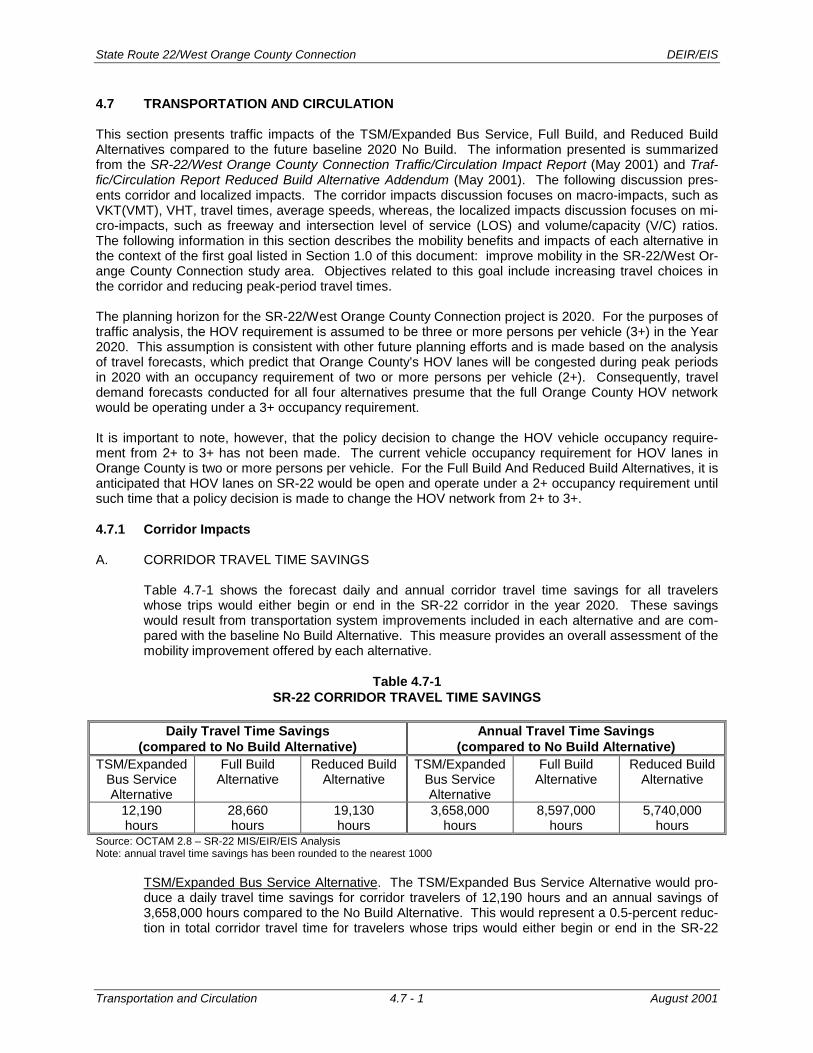
State Route 22/West Orange County Connection DEIR/EIS
Transportation and Circulation 4.7 - 1 August 2001
4.7 TRANSPORTATION AND CIRCULATION
This section presents traffic impacts of the TSM/Expanded Bus Service, Full Build, and Reduced BuildAlternatives compared to the future baseline 2020 No Build. The information presented is summarizedfrom the SR-22/West Orange County Connection Traffic/Circulation Impact Report (May 2001) and Traf-fic/Circulation Report Reduced Build Alternative Addendum (May 2001). The following discussion pres-ents corridor and localized impacts. The corridor impacts discussion focuses on macro-impacts, such asVKT(VMT), VHT, travel times, average speeds, whereas, the localized impacts discussion focuses on mi-cro-impacts, such as freeway and intersection level of service (LOS) and volume/capacity (V/C) ratios.The following information in this section describes the mobility benefits and impacts of each alternative inthe context of the first goal listed in Section 1.0 of this document: improve mobility in the SR-22/West Or-ange County Connection study area. Objectives related to this goal include increasing travel choices inthe corridor and reducing peak-period travel times.
The planning horizon for the SR-22/West Orange County Connection project is 2020. For the purposes oftraffic analysis, the HOV requirement is assumed to be three or more persons per vehicle (3+) in the Year2020. This assumption is consistent with other future planning efforts and is made based on the analysisof travel forecasts, which predict that Orange County’s HOV lanes will be congested during peak periodsin 2020 with an occupancy requirement of two or more persons per vehicle (2+). Consequently, traveldemand forecasts conducted for all four alternatives presume that the full Orange County HOV networkwould be operating under a 3+ occupancy requirement.
It is important to note, however, that the policy decision to change the HOV vehicle occupancy require-ment from 2+ to 3+ has not been made. The current vehicle occupancy requirement for HOV lanes inOrange County is two or more persons per vehicle. For the Full Build And Reduced Build Alternatives, it isanticipated that HOV lanes on SR-22 would be open and operate under a 2+ occupancy requirement untilsuch time that a policy decision is made to change the HOV network from 2+ to 3+.
4.7.1 Corridor Impacts
A. CORRIDOR TRAVEL TIME SAVINGS
Table 4.7-1 shows the forecast daily and annual corridor travel time savings for all travelerswhose trips would either begin or end in the SR-22 corridor in the year 2020. These savingswould result from transportation system improvements included in each alternative and are com-pared with the baseline No Build Alternative. This measure provides an overall assessment of themobility improvement offered by each alternative.
Table 4.7-1SR-22 CORRIDOR TRAVEL TIME SAVINGS
Daily Travel Time Savings(compared to No Build Alternative)
Annual Travel Time Savings(compared to No Build Alternative)
TSM/ExpandedBus ServiceAlternative
Full BuildAlternative
Reduced BuildAlternative
TSM/ExpandedBus ServiceAlternative
Full BuildAlternative
Reduced BuildAlternative
12,190hours
28,660hours
19,130hours
3,658,000hours
8,597,000hours
5,740,000hours
Source: OCTAM 2.8 – SR-22 MIS/EIR/EIS AnalysisNote: annual travel time savings has been rounded to the nearest 1000
TSM/Expanded Bus Service Alternative. The TSM/Expanded Bus Service Alternative would pro-duce a daily travel time savings for corridor travelers of 12,190 hours and an annual savings of3,658,000 hours compared to the No Build Alternative. This would represent a 0.5-percent reduc-tion in total corridor travel time for travelers whose trips would either begin or end in the SR-22
State Route 22/West Orange County Connection DEIR/EIS
Transportation and Circulation 4.7 - 2 August 2001
corridor. These savings would be generated based upon the arterial street improvements in-cluded in this alternative and the shift of travelers from auto to transit.
Full Build Alternative. The Full Build Alternative would produce the largest travel time savings ofthe three alternatives, 28,660 daily hours and 8,597,000 annual hours as compared to the NoBuild Alternative. This would represent a 1.1-percent reduction in total corridor travel time fortravelers whose trips would either begin or end in the SR-22 corridor. This only paints a part ofthe picture since more vehicles benefit from increased mobility through the corridor (see CorridorVMT below). These savings would be generated based upon the addition of HOV lanes and HOVlane connectors to the corridor, which would improve travel times for HOV lane users. In addition,a shift in vehicles to the HOV lanes would allow traffic on the SR-22 mixed-flow lanes to movesomewhat faster, reducing travel times. Finally, the addition of an arterial street on the formerPacific Electric right-of-way would provide reduced travel times for some travelers.
Reduced Build Alternative. The Reduced Build Alternative would produce the second largest cor-ridor travel time savings. It would produce daily travel time savings for corridor travelers of 19,130hours and an annual savings of 5,740,000 hours compared to the No Build Alternative. Thiswould represent a 0.7-percent reduction in total corridor travel time for travelers whose trips wouldeither begin or end in the SR-22 corridor. These savings would be generated based upon the ad-dition of HOV lanes to the corridor, which would improve travel times for HOV lane users. In addi-tion, a shift of vehicles to the HOV lanes would allow traffic on the SR-22 mixed-flow lanes tomove somewhat faster, reducing travel times. Since these features of the Reduced Build Alterna-tive are less extensive than the Full Build Alternative, this alternative would generate smaller traveltime savings.
B. CORRIDOR VKT (VMT) AND VHT
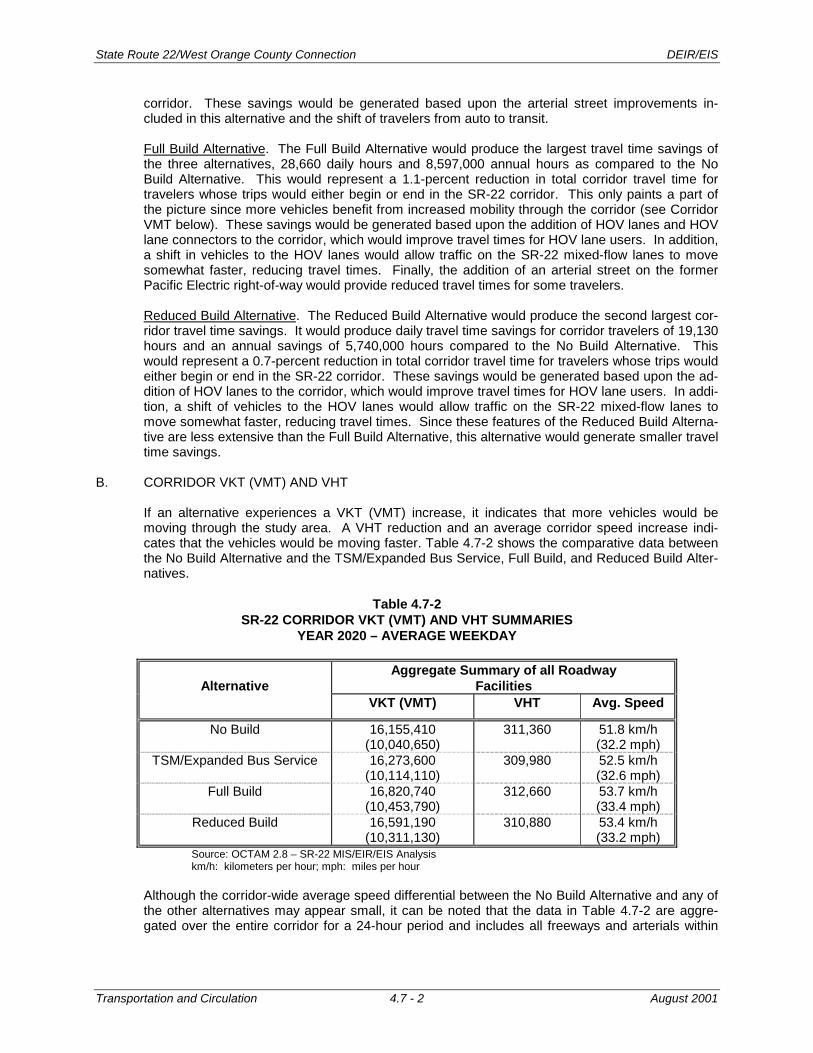
If an alternative experiences a VKT (VMT) increase, it indicates that more vehicles would bemoving through the study area. A VHT reduction and an average corridor speed increase indi-cates that the vehicles would be moving faster. Table 4.7-2 shows the comparative data betweenthe No Build Alternative and the TSM/Expanded Bus Service, Full Build, and Reduced Build Alter-natives.
Table 4.7-2SR-22 CORRIDOR VKT (VMT) AND VHT SUMMARIES
YEAR 2020 – AVERAGE WEEKDAY
Aggregate Summary of all RoadwayFacilitiesAlternative
VKT (VMT) VHT Avg. Speed
No Build 16,155,410(10,040,650)
311,360 51.8 km/h(32.2 mph)
TSM/Expanded Bus Service 16,273,600(10,114,110)
309,980 52.5 km/h(32.6 mph)
Full Build 16,820,740(10,453,790)
312,660 53.7 km/h(33.4 mph)
Reduced Build 16,591,190(10,311,130)
310,880 53.4 km/h(33.2 mph)
Source: OCTAM 2.8 – SR-22 MIS/EIR/EIS Analysiskm/h: kilometers per hour; mph: miles per hour
Although the corridor-wide average speed differential between the No Build Alternative and any ofthe other alternatives may appear small, it can be noted that the data in Table 4.7-2 are aggre-gated over the entire corridor for a 24-hour period and includes all freeways and arterials within
State Route 22/West Orange County Connection DEIR/EIS
Transportation and Circulation 4.7 - 3 August 2001
the defined study area. The aggregation process has diluted some substantial speed benefitsgained during peak hours, in certain corridor areas, as shown in Table 4.7-3..
No Build Alternative. The No Build Alternative is used as the baseline to which the other alterna-tives are compared. This alternative has the highest VKT (VMT) at 16,155,410 (10,040,650),highest VHT at 311,360. The ratio of VKT (VMT) and VHT indicates an average speed of 51.8km/h (32.2 mph) for this alternative.
TSM/Expanded Bus Service Alternative. As seen in Table 4.7-2, this alternative would result in118,190 additional VKT (73,460 VMT). In addition, the VHT would be reduced by 1,380 hourscompared to the No Build Alternative. The ratio of VKT (VMT) and VHT indicates an averagespeed of 52.5 km/h (32.6 mph) for this alternative.
Full Build Alternative. This alternative would result in greater VKT (VMT) and VHT compared tothe No Build Alternative; VKT (VMT) would increase by approximately 665,000 (413,000), whileVHT would increase by approximately 1,300 over the No Build Alternative. The ratio of VKT (VMT)and VHT indicates an average speed of 53.7 km/h (33.4 mph) for this alternative.
Reduced Build Alternative. The Reduced Build Alternative would result in an additional travel ac-tivity of 435,000-VKT (270,000-VMT), and a reduction of 480 VHT over the No Build Alternative.The ratio of VKT (VMT) and VHT indicates an average speed of 53.4 km/h (33.2 mph) for this al-ternative.
C. PEAK PERFORMANCE AND SCREENLINE ANALYSIS
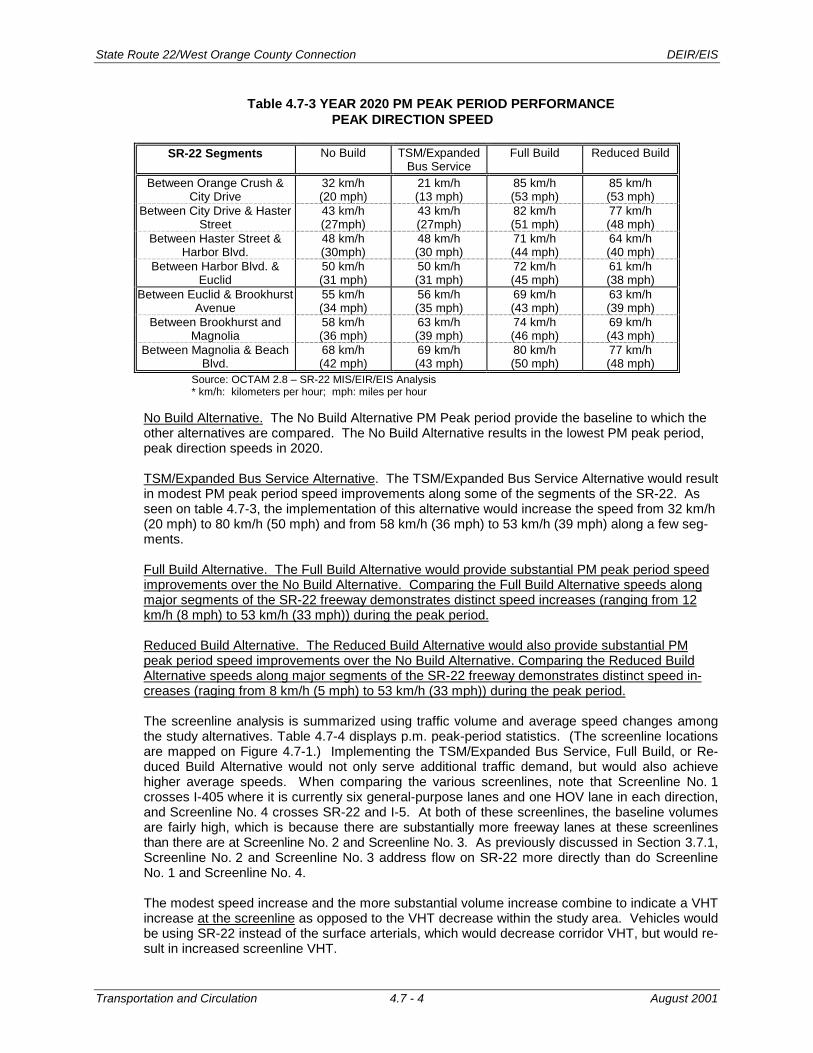
Table 4.7-3 provides a comparison of forecast year PM peak-period speeds along major seg-ments of the SR-22 freeway between the alternatives. As seen in table 4.7-3, implementing theTSM/Expanded Bus Service, Full Build or Reduced Build would achieve higher PM peak-period,peak direction travel speeds.
State Route 22/West Orange County Connection DEIR/EIS
Transportation and Circulation 4.7 - 4 August 2001
Table 4.7-3 YEAR 2020 PM PEAK PERIOD PERFORMANCE PEAK DIRECTION SPEED
SR-22 Segments No Build TSM/ExpandedBus Service
Full Build Reduced Build
Between Orange Crush &City Drive
32 km/h(20 mph)
21 km/h(13 mph)
85 km/h(53 mph)
85 km/h(53 mph)
Between City Drive & HasterStreet
43 km/h(27mph)
43 km/h(27mph)
82 km/h(51 mph)
77 km/h(48 mph)
Between Haster Street &Harbor Blvd.
48 km/h(30mph)
48 km/h(30 mph)
71 km/h(44 mph)
64 km/h(40 mph)
Between Harbor Blvd. &Euclid
50 km/h(31 mph)
50 km/h(31 mph)
72 km/h(45 mph)
61 km/h(38 mph)
Between Euclid & BrookhurstAvenue
55 km/h(34 mph)
56 km/h(35 mph)
69 km/h(43 mph)
63 km/h(39 mph)
Between Brookhurst andMagnolia
58 km/h(36 mph)
63 km/h(39 mph)
74 km/h(46 mph)
69 km/h(43 mph)
Between Magnolia & BeachBlvd.
68 km/h(42 mph)
69 km/h(43 mph)
80 km/h(50 mph)
77 km/h(48 mph)
Source: OCTAM 2.8 – SR-22 MIS/EIR/EIS Analysis* km/h: kilometers per hour; mph: miles per hour
No Build Alternative. The No Build Alternative PM Peak period provide the baseline to which theother alternatives are compared. The No Build Alternative results in the lowest PM peak period,peak direction speeds in 2020.
TSM/Expanded Bus Service Alternative. The TSM/Expanded Bus Service Alternative would resultin modest PM peak period speed improvements along some of the segments of the SR-22. Asseen on table 4.7-3, the implementation of this alternative would increase the speed from 32 km/h(20 mph) to 80 km/h (50 mph) and from 58 km/h (36 mph) to 53 km/h (39 mph) along a few seg-ments.
Full Build Alternative. The Full Build Alternative would provide substantial PM peak period speedimprovements over the No Build Alternative. Comparing the Full Build Alternative speeds alongmajor segments of the SR-22 freeway demonstrates distinct speed increases (ranging from 12km/h (8 mph) to 53 km/h (33 mph)) during the peak period.
Reduced Build Alternative. The Reduced Build Alternative would also provide substantial PMpeak period speed improvements over the No Build Alternative. Comparing the Reduced BuildAlternative speeds along major segments of the SR-22 freeway demonstrates distinct speed in-creases (raging from 8 km/h (5 mph) to 53 km/h (33 mph)) during the peak period.
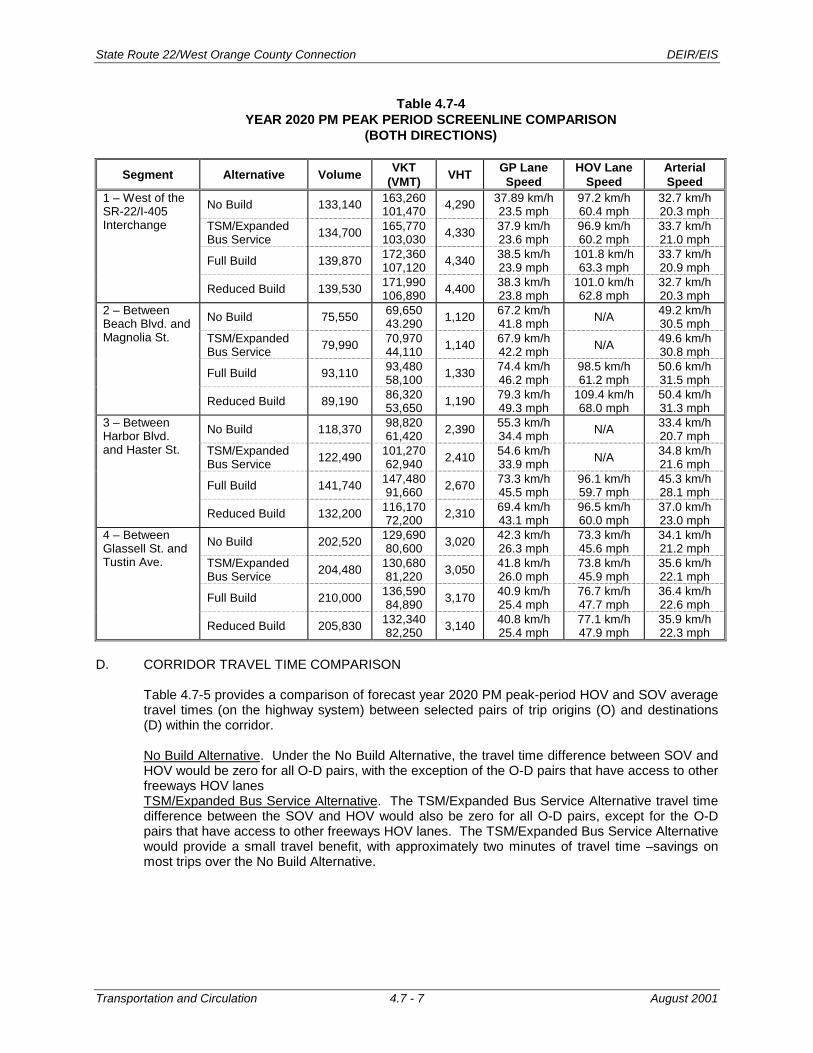
The screenline analysis is summarized using traffic volume and average speed changes amongthe study alternatives. Table 4.7-4 displays p.m. peak-period statistics. (The screenline locationsare mapped on Figure 4.7-1.) Implementing the TSM/Expanded Bus Service, Full Build, or Re-duced Build Alternative would not only serve additional traffic demand, but would also achievehigher average speeds. When comparing the various screenlines, note that Screenline No. 1crosses I-405 where it is currently six general-purpose lanes and one HOV lane in each direction,and Screenline No. 4 crosses SR-22 and I-5. At both of these screenlines, the baseline volumesare fairly high, which is because there are substantially more freeway lanes at these screenlinesthan there are at Screenline No. 2 and Screenline No. 3. As previously discussed in Section 3.7.1,Screenline No. 2 and Screenline No. 3 address flow on SR-22 more directly than do ScreenlineNo. 1 and Screenline No. 4.
The modest speed increase and the more substantial volume increase combine to indicate a VHTincrease at the screenline as opposed to the VHT decrease within the study area. Vehicles wouldbe using SR-22 instead of the surface arterials, which would decrease corridor VHT, but would re-sult in increased screenline VHT.
State Route 22/West Orange County Connection DEIR/EIS
Transportation and Circulation 4.7 - 5 August 2001
No Build Alternative. The No Build Alternative volume, VKT (VMT), VHT, and speed provide thebaseline to which the other alternatives are compared. The No Build Alternative results in thelowest screenline volumes, VKT (VMT), and VHT. In addition, the average screenline speeds arethe slowest.
TSM/Expanded Bus Service Alternative. As seen in Table 4.7-4, implementing theTSM/Expanded Bus Service Alternative would not only serve additional traffic demand, but wouldalso generally achieve higher average speeds. At Screenline Nos. 2 and 3, the vehicles movingacross the screenlines would increase by increase by three to six percent in the p.m. peak period,with average speeds increasing negligibly. The small speed benefit would be primarily a result ofthe induced mode shift (from auto to transit), relieving some freeway capacity, thereby resulting inreduced freeway congestion.
Full Build Alternative. The Full Build Alternative would serve substantially higher traffic volumes,During the p.m. peak period, traffic is forecast to increase by 23 percent at Screenline No. 2 and20 percent at Screenline No. 3. During the p.m. peak, the average speeds are forecast to in-crease on the freeway general purpose lanes by 3 percent at Screenline No. 2 and 36 percent atScreenline No. 3. The substantial travel speed improvement would be the result of additionalroadway capacity that would become available through the proposed HOV lane and the auxiliarylane improvements.
Reduced Build Alternative. At Screenlines Nos. 2 and 3, the Reduced Build Alternative wouldserve higher traffic volumes compared to the No Build Alternative, showing increases of eighteenand twelve percent. The average speeds in the general purpose lanes across the same twoscreenlines increase by eighteen and twenty-five percent on general purpose lanes. The sub-stantial travel speed improvement would be the result of additional roadway capacity that wouldbecome available through the proposed HOV lane and the auxiliary lane improvements.
State Route 22/West Orange County Connection DEIR/EIS
Transportation and Circulation 4.7 - 6 August 2001
Figure 4.7-1Screenline Locations
State Route 22/West Orange County Connection DEIR/EIS
Transportation and Circulation 4.7 - 7 August 2001
Table 4.7-4YEAR 2020 PM PEAK PERIOD SCREENLINE COMPARISON
(BOTH DIRECTIONS)
Segment Alternative Volume VKT(VMT) VHT GP Lane
SpeedHOV Lane
SpeedArterialSpeed
No Build 133,140 163,260101,470 4,290 37.89 km/h
23.5 mph97.2 km/h60.4 mph
32.7 km/h20.3 mph
TSM/ExpandedBus Service 134,700 165,770
103,030 4,330 37.9 km/h23.6 mph
96.9 km/h60.2 mph
33.7 km/h21.0 mph
Full Build 139,870 172,360107,120 4,340 38.5 km/h
23.9 mph101.8 km/h63.3 mph
33.7 km/h20.9 mph
1 – West of theSR-22/I-405Interchange
Reduced Build 139,530 171,990106,890 4,400 38.3 km/h
23.8 mph101.0 km/h62.8 mph
32.7 km/h20.3 mph
No Build 75,550 69,65043.290 1,120 67.2 km/h
41.8 mph N/A 49.2 km/h30.5 mph
TSM/ExpandedBus Service 79,990 70,970
44,110 1,140 67.9 km/h42.2 mph N/A 49.6 km/h
30.8 mph
Full Build 93,110 93,48058,100 1,330 74.4 km/h
46.2 mph98.5 km/h61.2 mph
50.6 km/h31.5 mph
2 – BetweenBeach Blvd. andMagnolia St.
Reduced Build 89,190 86,32053,650 1,190 79.3 km/h
49.3 mph109.4 km/h68.0 mph
50.4 km/h31.3 mph
No Build 118,370 98,82061,420 2,390 55.3 km/h
34.4 mph N/A 33.4 km/h20.7 mph
TSM/ExpandedBus Service 122,490 101,270
62,940 2,410 54.6 km/h33.9 mph N/A 34.8 km/h
21.6 mph
Full Build 141,740 147,48091,660 2,670 73.3 km/h
45.5 mph96.1 km/h59.7 mph
45.3 km/h28.1 mph
3 – BetweenHarbor Blvd.and Haster St.
Reduced Build 132,200 116,17072,200 2,310 69.4 km/h
43.1 mph96.5 km/h60.0 mph
37.0 km/h23.0 mph
No Build 202,520 129,69080,600 3,020 42.3 km/h
26.3 mph73.3 km/h45.6 mph
34.1 km/h21.2 mph
TSM/ExpandedBus Service 204,480 130,680
81,220 3,050 41.8 km/h26.0 mph
73.8 km/h45.9 mph
35.6 km/h22.1 mph
Full Build 210,000 136,59084,890 3,170 40.9 km/h
25.4 mph76.7 km/h47.7 mph
36.4 km/h22.6 mph
4 – BetweenGlassell St. andTustin Ave.
Reduced Build 205,830 132,34082,250 3,140 40.8 km/h
25.4 mph77.1 km/h47.9 mph
35.9 km/h22.3 mph
D. CORRIDOR TRAVEL TIME COMPARISON
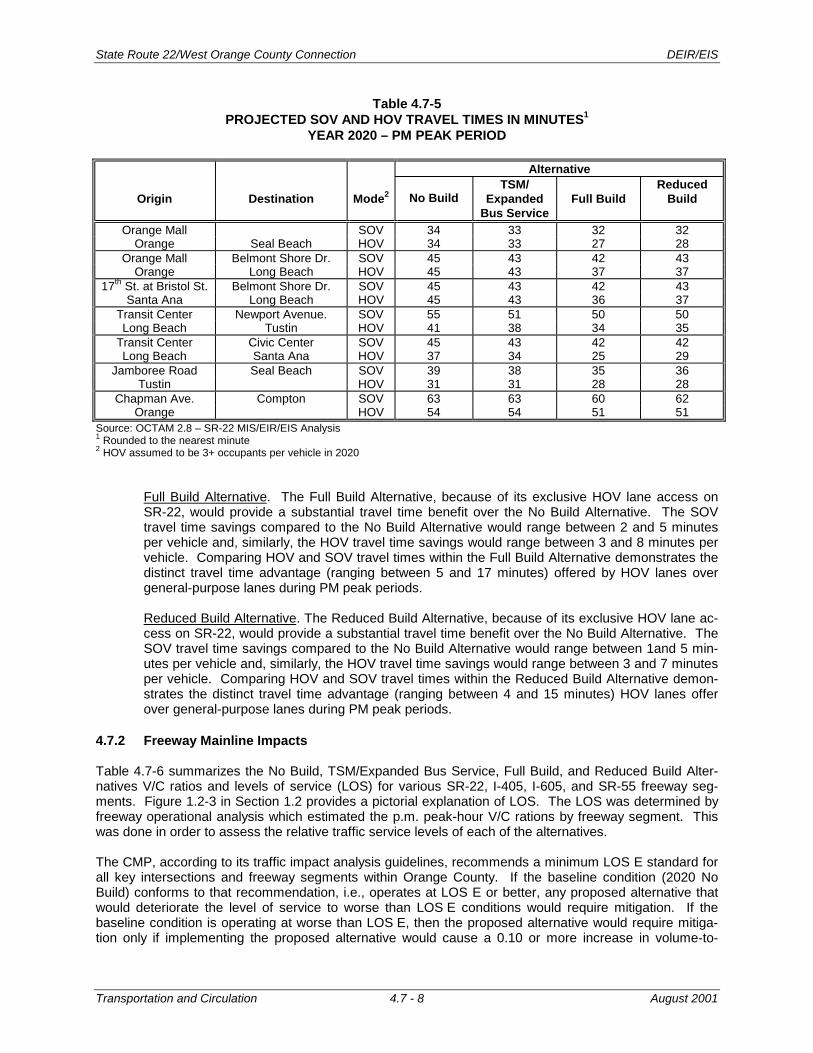
Table 4.7-5 provides a comparison of forecast year 2020 PM peak-period HOV and SOV averagetravel times (on the highway system) between selected pairs of trip origins (O) and destinations(D) within the corridor.
No Build Alternative. Under the No Build Alternative, the travel time difference between SOV andHOV would be zero for all O-D pairs, with the exception of the O-D pairs that have access to otherfreeways HOV lanesTSM/Expanded Bus Service Alternative. The TSM/Expanded Bus Service Alternative travel timedifference between the SOV and HOV would also be zero for all O-D pairs, except for the O-Dpairs that have access to other freeways HOV lanes. The TSM/Expanded Bus Service Alternativewould provide a small travel benefit, with approximately two minutes of travel time –savings onmost trips over the No Build Alternative.
State Route 22/West Orange County Connection DEIR/EIS
Transportation and Circulation 4.7 - 8 August 2001
Table 4.7-5PROJECTED SOV AND HOV TRAVEL TIMES IN MINUTES1
YEAR 2020 – PM PEAK PERIOD
Alternative
Origin Destination Mode2 No BuildTSM/
ExpandedBus Service
Full BuildReduced
Build
Orange Mall SOV 34 33 32 32Orange Seal Beach HOV 34 33 27 28
Orange Mall Belmont Shore Dr. SOV 45 43 42 43Orange Long Beach HOV 45 43 37 37
17th St. at Bristol St. Belmont Shore Dr. SOV 45 43 42 43Santa Ana Long Beach HOV 45 43 36 37
Transit Center Newport Avenue. SOV 55 51 50 50Long Beach Tustin HOV 41 38 34 35
Transit Center Civic Center SOV 45 43 42 42Long Beach Santa Ana HOV 37 34 25 29
Jamboree Road Seal Beach SOV 39 38 35 36Tustin HOV 31 31 28 28
Chapman Ave. Compton SOV 63 63 60 62Orange HOV 54 54 51 51
Source: OCTAM 2.8 – SR-22 MIS/EIR/EIS Analysis1 Rounded to the nearest minute2 HOV assumed to be 3+ occupants per vehicle in 2020
Full Build Alternative. The Full Build Alternative, because of its exclusive HOV lane access onSR-22, would provide a substantial travel time benefit over the No Build Alternative. The SOVtravel time savings compared to the No Build Alternative would range between 2 and 5 minutesper vehicle and, similarly, the HOV travel time savings would range between 3 and 8 minutes pervehicle. Comparing HOV and SOV travel times within the Full Build Alternative demonstrates thedistinct travel time advantage (ranging between 5 and 17 minutes) offered by HOV lanes overgeneral-purpose lanes during PM peak periods.
Reduced Build Alternative. The Reduced Build Alternative, because of its exclusive HOV lane ac-cess on SR-22, would provide a substantial travel time benefit over the No Build Alternative. TheSOV travel time savings compared to the No Build Alternative would range between 1and 5 min-utes per vehicle and, similarly, the HOV travel time savings would range between 3 and 7 minutesper vehicle. Comparing HOV and SOV travel times within the Reduced Build Alternative demon-strates the distinct travel time advantage (ranging between 4 and 15 minutes) HOV lanes offerover general-purpose lanes during PM peak periods.
4.7.2 Freeway Mainline Impacts
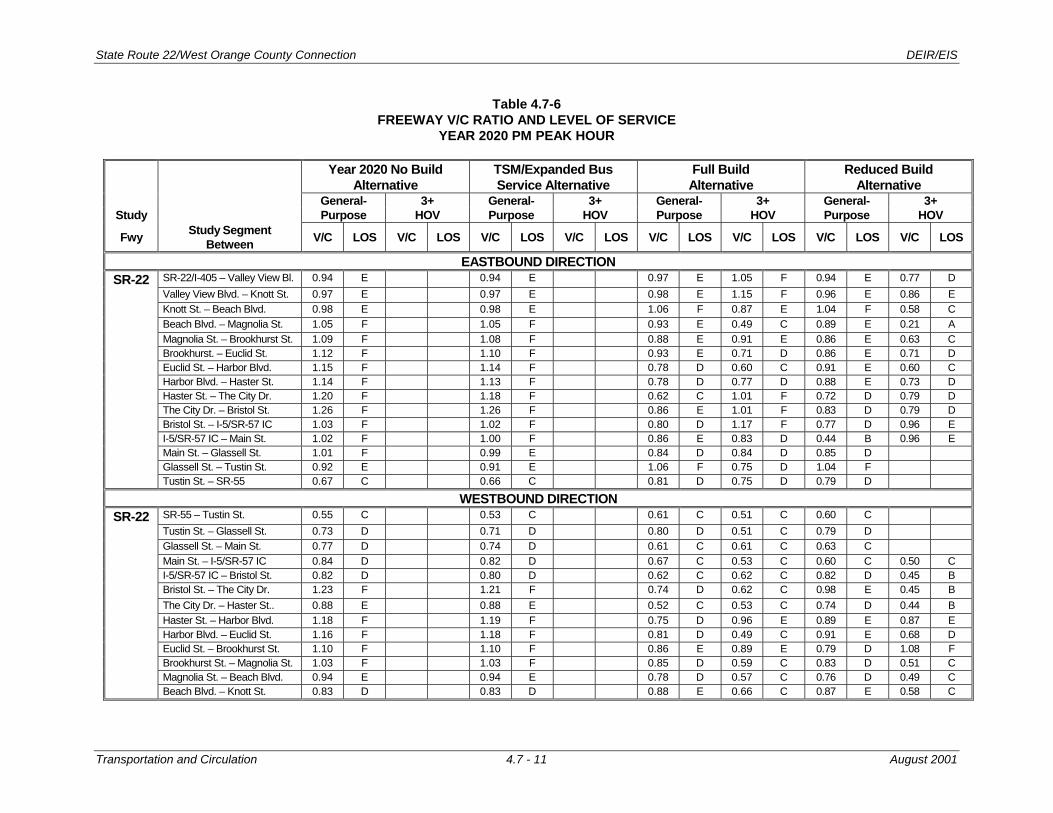
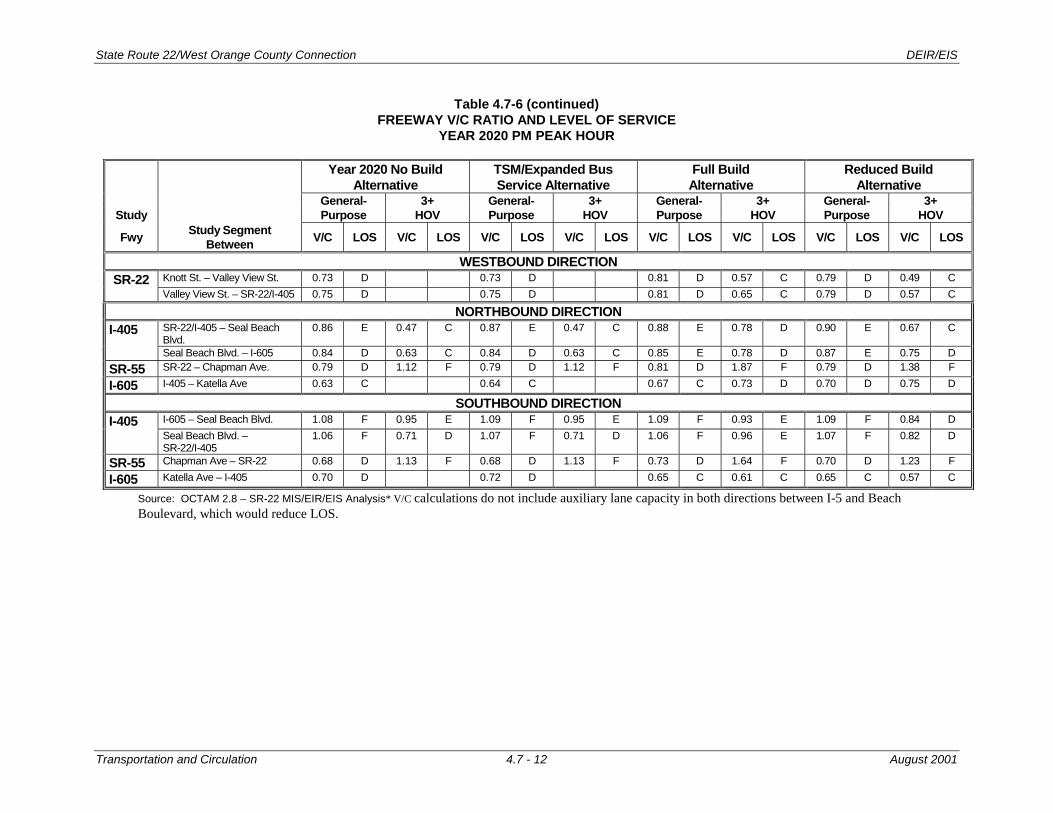
Table 4.7-6 summarizes the No Build, TSM/Expanded Bus Service, Full Build, and Reduced Build Alter-natives V/C ratios and levels of service (LOS) for various SR-22, I-405, I-605, and SR-55 freeway seg-ments. Figure 1.2-3 in Section 1.2 provides a pictorial explanation of LOS. The LOS was determined byfreeway operational analysis which estimated the p.m. peak-hour V/C rations by freeway segment. Thiswas done in order to assess the relative traffic service levels of each of the alternatives.
The CMP, according to its traffic impact analysis guidelines, recommends a minimum LOS E standard forall key intersections and freeway segments within Orange County. If the baseline condition (2020 NoBuild) conforms to that recommendation, i.e., operates at LOS E or better, any proposed alternative thatwould deteriorate the level of service to worse than LOS E conditions would require mitigation. If thebaseline condition is operating at worse than LOS E, then the proposed alternative would require mitiga-tion only if implementing the proposed alternative would cause a 0.10 or more increase in volume-to-
State Route 22/West Orange County Connection DEIR/EIS
Transportation and Circulation 4.7 - 9 August 2001
capacity (V/C) ratio over that of baseline condition (2020 No Build). If the V/C ratio increases less than0.10, no mitigation would be planned.
A. NO BUILD ALTERNATIVE
Under the No Build Alternative, 15 of the 30 SR-22 segments would operate at LOS F conditions.Traffic operation on I-405 would operate at LOS F in the two southbound segments. NorthboundI-405, as well as the I-605 and SR-55 segments in both directions, would be satisfactory (LOS Eor better).
B. TSM/EXPANDED BUS SERVICE ALTERNATIVE
Implementing the TSM/Expanded Bus Service Alternative would result in minor V/C ratio improve-ments, though the LOS would be similar to those for the No Build Alternative. Fourteen of the 30SR-22 segments would still operate at LOS F conditions, because this alternative would not addfreeway capacity. Traffic operations on I-405, I-605, and SR-55 study segments would be similar tothose under the No Build Alternative. The transit improvements proposed would induce some modeshift from auto to transit. However, the mode shift would not be substantial enough to reduce thedemand and achieve the desired LOS. Implementing this alternative would not cause any thresholdviolations.
C. FULL BUILD ALTERNATIVE
The Full Build Alternative would better serve the year 2020 peak-hour forecast traffic volumesthan the No Build or TSM/Expanded Bus Service Alternative. Only two of the thirty SR-22 gen-eral-purpose lane segments would operate at LOS F conditions. In both cases, these are seg-ments that are forecast to operate at LOS E in the No Build condition, thus resulting in a thresholdviolation. However, in both cases there are auxiliary lanes in these segments that are not in-cluded in the capacity calculation. These auxiliary lanes would improve the weaving section tooptimize the capacity of the mainline lanes, thus having a mitigating effect and reducing the levelof service to less than LOS F. Two SR-55 HOV lane segments would also result in threshold vio-lations (V/C increases from 1.12 to 1.87 northbound and from 1.13 to 1.64 southbound).
The SR-22 HOV lanes in both directions would generally operate in the LOS C to E range, exceptthe eastbound segments between I-405 and Knott Street and between Haster Street and theI-5/SR-57 interchange. In these sections, the HOV traffic volumes (in the 1,500- to 1,700-vehiclerange) would exceed the HOV 1,500 vehicles per hour lane capacity. The two-plus sensitivity analy-sis in shows that the two-plus HOV demand exceeds the capacity and supports the need for athree-plus occupancy policy in 2020.
The Full Build Alternative would not result in a substantial traffic operations impact on I-405, I-605,and SR-55 general-purpose lane study segments. Implementing the SR-22 HOV lane and par-ticularly the freeway-to-freeway connectors would induce higher volumes on the existing I-405 andSR-55 HOV lanes, resulting in higher V/C ratios and worse LOS, particularly on the SR-55 HOVlanes. The increased volumes in the HOV lanes on I-405 and SR-55 are in large part a result ofthe diversion of existing HOV trips in the general-purpose lanes or on the parallel arterials into theHOV lanes.
D. REDUCED BUILD ALTERNATIVE
Implementing the Reduced Build Alternative would better serve the year 2020 peak-hour forecasttraffic volumes than the No Build Alternative. Only two of the 30 SR-22 general-purpose lanesegments operate at LOS F conditions. Two SR-55 HOV lane segments would also result inthreshold violations (V/C increases from 1.12 to 1.38 northbound and from 1.13 to 1.23 south-bound).
State Route 22/West Orange County Connection DEIR/EIS
Transportation and Circulation 4.7 - 10 August 2001
The SR-22 HOV lanes would generally operate in the LOS C to E range, with a few locations oper-ating better (eastbound from Beach Boulevard to Magnolia Street and westbound between I-5/SR-57Interchange and Haster Street), and one location operating at a worse level of service (westboundbetween Euclid Street and Brookhurst Street). In this section, the HOV traffic volumes (in the 1,600-vehicle range) would exceed the 1,500 vehicles per hour HOV lane capacity.
The Reduced Build Alternative would not result in a substantial traffic operations impact on I-405,I-605, and SR-55 general-purpose lane study segments. Implementing the SR-22 HOV lane andparticularly the freeway-to-freeway connectors would induce higher volumes on the existing I-405and SR-55 HOV lanes, resulting in higher V/C ratios and worse LOS. This is true for I-405 andSR-55 because the availability of a SR-22 HOV lane (even without the SR-55 direct connection)would encourage HOVs to use the I-405 and SR-55 HOV lanes to access the SR-22 HOV lanes.The increased volumes in the HOV lanes on I-405 and SR-55 are in large part a result of the di-version of existing HOV trips in the general-purpose lanes or on the parallel arterials into the HOVlanes.
State Route 22/West Orange County Connection DEIR/EIS
Transportation and Circulation 4.7 - 11 August 2001
Table 4.7-6FREEWAY V/C RATIO AND LEVEL OF SERVICE
YEAR 2020 PM PEAK HOUR
Year 2020 No BuildAlternative
TSM/Expanded BusService Alternative
Full BuildAlternative
Reduced BuildAlternative
General- 3+ General- 3+ General- 3+ General- 3+Study Purpose HOV Purpose HOV Purpose HOV Purpose HOV
Fwy Study SegmentBetween V/C LOS V/C LOS V/C LOS V/C LOS V/C LOS V/C LOS V/C LOS V/C LOS
EASTBOUND DIRECTIONSR-22 SR-22/I-405 – Valley View Bl. 0.94 E 0.94 E 0.97 E 1.05 F 0.94 E 0.77 D
Valley View Blvd. – Knott St. 0.97 E 0.97 E 0.98 E 1.15 F 0.96 E 0.86 EKnott St. – Beach Blvd. 0.98 E 0.98 E 1.06 F 0.87 E 1.04 F 0.58 CBeach Blvd. – Magnolia St. 1.05 F 1.05 F 0.93 E 0.49 C 0.89 E 0.21 AMagnolia St. – Brookhurst St. 1.09 F 1.08 F 0.88 E 0.91 E 0.86 E 0.63 CBrookhurst. – Euclid St. 1.12 F 1.10 F 0.93 E 0.71 D 0.86 E 0.71 DEuclid St. – Harbor Blvd. 1.15 F 1.14 F 0.78 D 0.60 C 0.91 E 0.60 CHarbor Blvd. – Haster St. 1.14 F 1.13 F 0.78 D 0.77 D 0.88 E 0.73 DHaster St. – The City Dr. 1.20 F 1.18 F 0.62 C 1.01 F 0.72 D 0.79 DThe City Dr. – Bristol St. 1.26 F 1.26 F 0.86 E 1.01 F 0.83 D 0.79 DBristol St. – I-5/SR-57 IC 1.03 F 1.02 F 0.80 D 1.17 F 0.77 D 0.96 EI-5/SR-57 IC – Main St. 1.02 F 1.00 F 0.86 E 0.83 D 0.44 B 0.96 EMain St. – Glassell St. 1.01 F 0.99 E 0.84 D 0.84 D 0.85 DGlassell St. – Tustin St. 0.92 E 0.91 E 1.06 F 0.75 D 1.04 FTustin St. – SR-55 0.67 C 0.66 C 0.81 D 0.75 D 0.79 D
WESTBOUND DIRECTIONSR-22 SR-55 – Tustin St. 0.55 C 0.53 C 0.61 C 0.51 C 0.60 C
Tustin St. – Glassell St. 0.73 D 0.71 D 0.80 D 0.51 C 0.79 DGlassell St. – Main St. 0.77 D 0.74 D 0.61 C 0.61 C 0.63 CMain St. – I-5/SR-57 IC 0.84 D 0.82 D 0.67 C 0.53 C 0.60 C 0.50 CI-5/SR-57 IC – Bristol St. 0.82 D 0.80 D 0.62 C 0.62 C 0.82 D 0.45 BBristol St. – The City Dr. 1.23 F 1.21 F 0.74 D 0.62 C 0.98 E 0.45 BThe City Dr. – Haster St.. 0.88 E 0.88 E 0.52 C 0.53 C 0.74 D 0.44 BHaster St. – Harbor Blvd. 1.18 F 1.19 F 0.75 D 0.96 E 0.89 E 0.87 EHarbor Blvd. – Euclid St. 1.16 F 1.18 F 0.81 D 0.49 C 0.91 E 0.68 DEuclid St. – Brookhurst St. 1.10 F 1.10 F 0.86 E 0.89 E 0.79 D 1.08 FBrookhurst St. – Magnolia St. 1.03 F 1.03 F 0.85 D 0.59 C 0.83 D 0.51 CMagnolia St. – Beach Blvd. 0.94 E 0.94 E 0.78 D 0.57 C 0.76 D 0.49 CBeach Blvd. – Knott St. 0.83 D 0.83 D 0.88 E 0.66 C 0.87 E 0.58 C
State Route 22/West Orange County Connection DEIR/EIS
Transportation and Circulation 4.7 - 12 August 2001
Table 4.7-6 (continued)FREEWAY V/C RATIO AND LEVEL OF SERVICE
YEAR 2020 PM PEAK HOUR
Year 2020 No BuildAlternative
TSM/Expanded BusService Alternative
Full BuildAlternative
Reduced BuildAlternative
General- 3+ General- 3+ General- 3+ General- 3+Study Purpose HOV Purpose HOV Purpose HOV Purpose HOV
Fwy Study SegmentBetween V/C LOS V/C LOS V/C LOS V/C LOS V/C LOS V/C LOS V/C LOS V/C LOS
WESTBOUND DIRECTIONSR-22 Knott St. – Valley View St. 0.73 D 0.73 D 0.81 D 0.57 C 0.79 D 0.49 C
Valley View St. – SR-22/I-405 0.75 D 0.75 D 0.81 D 0.65 C 0.79 D 0.57 C
NORTHBOUND DIRECTIONI-405 SR-22/I-405 – Seal Beach
Blvd.0.86 E 0.47 C 0.87 E 0.47 C 0.88 E 0.78 D 0.90 E 0.67 C
Seal Beach Blvd. – I-605 0.84 D 0.63 C 0.84 D 0.63 C 0.85 E 0.78 D 0.87 E 0.75 DSR-55 SR-22 – Chapman Ave. 0.79 D 1.12 F 0.79 D 1.12 F 0.81 D 1.87 F 0.79 D 1.38 F
I-605 I-405 – Katella Ave 0.63 C 0.64 C 0.67 C 0.73 D 0.70 D 0.75 D
SOUTHBOUND DIRECTIONI-405 I-605 – Seal Beach Blvd. 1.08 F 0.95 E 1.09 F 0.95 E 1.09 F 0.93 E 1.09 F 0.84 D
Seal Beach Blvd. –SR-22/I-405
1.06 F 0.71 D 1.07 F 0.71 D 1.06 F 0.96 E 1.07 F 0.82 D
SR-55 Chapman Ave – SR-22 0.68 D 1.13 F 0.68 D 1.13 F 0.73 D 1.64 F 0.70 D 1.23 F
I-605 Katella Ave – I-405 0.70 D 0.72 D 0.65 C 0.61 C 0.65 C 0.57 C
Source: OCTAM 2.8 – SR-22 MIS/EIR/EIS Analysis* V/C calculations do not include auxiliary lane capacity in both directions between I-5 and BeachBoulevard, which would reduce LOS.
State Route 22/West Orange County Connection DEIR/EIS
Transportation and Circulation 4.7 - 13 August 2001
4.7.3 HOV Connector Impacts
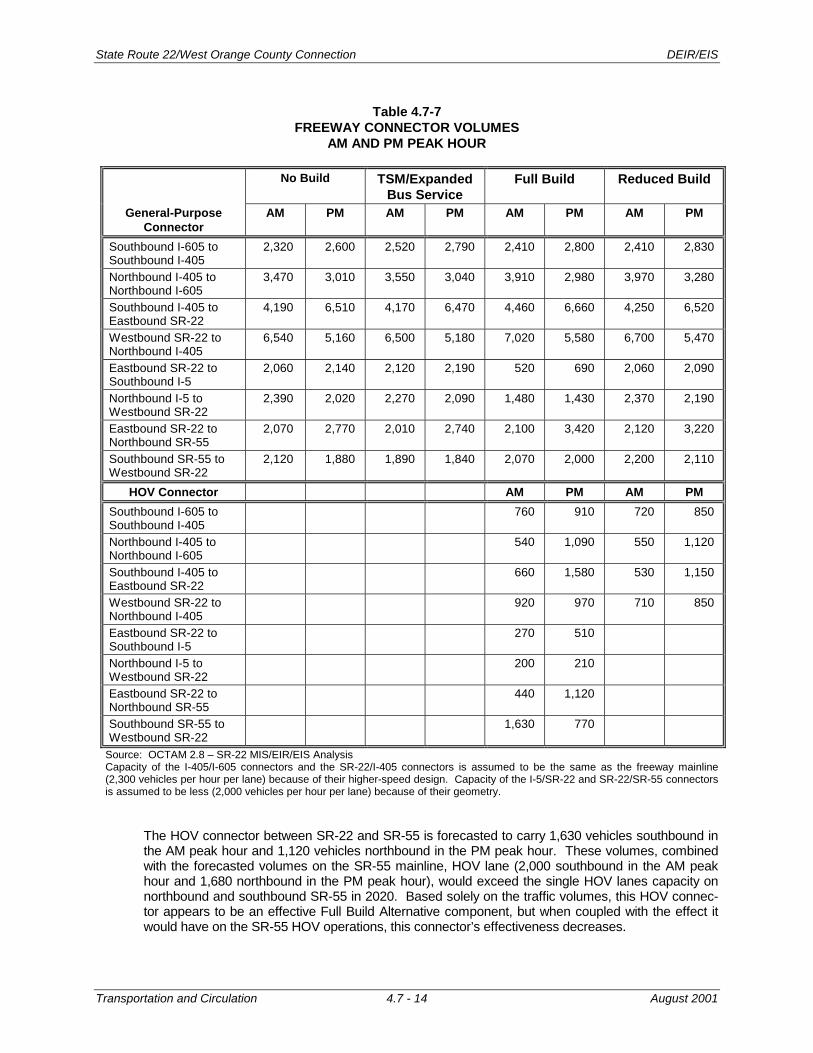
Table 4.7-7 lists the traffic volumes on the proposed HOV direct connectors and the associated general-purpose connectors.
A. NO BUILD ALTERNATIVE
The No Build Alternative does not include any HOV connectors and is the baseline to which theother alternatives are compared.
B. TSM/EXPANDED BUS SERVICE ALTERNATIVE
The TSM/Expanded Bus Service Alternative does not include HOV connectors. The general-purpose connector volumes vary only slightly compared to the No Build Alternative.
C. FULL BUILD ALTERNATIVE
The three general-purpose connector pairs (I-405/I-605, SR-22/I-405 and SR-22/SR-55) wouldexperience increased volumes with the construction of the HOV connectors. This would occurbecause the freeway mainline would be moving more smoothly and at a higher speed and it couldthus deliver more vehicles to the freeway connectors.
The fourth general-purpose connector pair (I-5/SR-22) would experience a substantial decrease inforecasted demand. This would primarily be a result of including the Pacific Electric Arterial in theFull Build Alternative.. The Pacific Electric Arterial would provide drivers an alternative to usingthe eastbound SR-22 to southbound I-5 general-purpose connector. So a fairly high percentageof the trips would be diverted to the Pacific Electric Arterial. However, the analysis indicates thatthe reverse movement (northbound I-5 to westbound SR-22) would not experience the same levelof trip diversion due to PE Arterial.
Of the four HOV connectors, the one connecting SR-22 and I-5 would carry the fewest vehicles inthe peak hour. It would carry less than 800 vehicles in the peak hour and would suffer from“empty lane syndrome.” For that reason, this connector would be considered a less effectivecomponent of the Full Build Alternative than the other connectors would.
State Route 22/West Orange County Connection DEIR/EIS
Transportation and Circulation 4.7 - 14 August 2001
Table 4.7-7FREEWAY CONNECTOR VOLUMES
AM AND PM PEAK HOUR
No Build TSM/ExpandedBus Service
Full Build Reduced Build
General-PurposeConnector
AM PM AM PM AM PM AM PM
Southbound I-605 toSouthbound I-405
2,320 2,600 2,520 2,790 2,410 2,800 2,410 2,830
Northbound I-405 toNorthbound I-605
3,470 3,010 3,550 3,040 3,910 2,980 3,970 3,280
Southbound I-405 toEastbound SR-22
4,190 6,510 4,170 6,470 4,460 6,660 4,250 6,520
Westbound SR-22 toNorthbound I-405
6,540 5,160 6,500 5,180 7,020 5,580 6,700 5,470
Eastbound SR-22 toSouthbound I-5
2,060 2,140 2,120 2,190 520 690 2,060 2,090
Northbound I-5 toWestbound SR-22
2,390 2,020 2,270 2,090 1,480 1,430 2,370 2,190
Eastbound SR-22 toNorthbound SR-55
2,070 2,770 2,010 2,740 2,100 3,420 2,120 3,220
Southbound SR-55 toWestbound SR-22
2,120 1,880 1,890 1,840 2,070 2,000 2,200 2,110
HOV Connector AM PM AM PMSouthbound I-605 toSouthbound I-405
760 910 720 850
Northbound I-405 toNorthbound I-605
540 1,090 550 1,120
Southbound I-405 toEastbound SR-22
660 1,580 530 1,150
Westbound SR-22 toNorthbound I-405
920 970 710 850
Eastbound SR-22 toSouthbound I-5
270 510
Northbound I-5 toWestbound SR-22
200 210
Eastbound SR-22 toNorthbound SR-55
440 1,120
Southbound SR-55 toWestbound SR-22
1,630 770
Source: OCTAM 2.8 – SR-22 MIS/EIR/EIS AnalysisCapacity of the I-405/I-605 connectors and the SR-22/I-405 connectors is assumed to be the same as the freeway mainline(2,300 vehicles per hour per lane) because of their higher-speed design. Capacity of the I-5/SR-22 and SR-22/SR-55 connectorsis assumed to be less (2,000 vehicles per hour per lane) because of their geometry.
The HOV connector between SR-22 and SR-55 is forecasted to carry 1,630 vehicles southbound inthe AM peak hour and 1,120 vehicles northbound in the PM peak hour. These volumes, combinedwith the forecasted volumes on the SR-55 mainline, HOV lane (2,000 southbound in the AM peakhour and 1,680 northbound in the PM peak hour), would exceed the single HOV lanes capacity onnorthbound and southbound SR-55 in 2020. Based solely on the traffic volumes, this HOV connec-tor appears to be an effective Full Build Alternative component, but when coupled with the effect itwould have on the SR-55 HOV operations, this connector’s effectiveness decreases.
State Route 22/West Orange County Connection DEIR/EIS
Transportation and Circulation 4.7 - 15 August 2001
The other two HOV connectors (I-605/I-405, SR-22/I-405) would meet the 800 vehicles minimumcriteria (in at least one peak hour) to avoid the empty lane syndrome perception, and would notexceed the 1,500 vehicles preferred maximum, when the connectors traffic flow could begin tobreak down. (The volume on the southbound I-405 to eastbound SR-22 HOV connector wouldactually exceed 1,500 in the PM peak hour, but by a margin small enough to be discounted.)
D. REDUCED BUILD ALTERNATIVE
The volumes on all four of the general-purpose connector pairs (I-605/I-405, SR-22/I-405,SR-22/I-5, SR-22/SR-55) would remain essentially the same as or increase slightly over the NoBuild Alternative if the Reduced Build Alternative is constructed. This would occur because thefreeway mainline would be moving more smoothly and at a higher speed and it could thus delivermore vehicles to the freeway connectors.
Both HOV connectors included in the Reduced Build Alternative (I-605/I-405, SR-22/I-405) wouldmeet the 800 vehicles minimum criteria (in at least one peak hour) to avoid the empty lane syn-drome perception, and would not exceed the 1,500 vehicles preferred maximum, at which pointthe connectors traffic flow could begin to break down.
4.7.4 Arterial Impacts
The study area arterials would also be affected by the proposed alternatives, as can be seen in Table4.7-8. Table 4.7-8 presents the study area arterials and connectors’ average daily traffic and levels ofservice, by alternative.
A. NO BUILD ALTERNATIVE
As can be seen in Table 4.7-8, the arterials’ LOS range from LOS B on Westminster Boule-vard/17th Street to LOS F on Fairview Street. The ADTs range from 12,000 (Fifth Street) to60,000 (Harbor Boulevard).
B. TSM/EXPANDED BUS SERVICE ALTERNATIVE
The TSM/Expanded Bus Service Alternative shows a mixed result in ADT volume changes oneast/west and north/south arterials. These volume changes are attributable to the componentsthat would address these main cross-county streets. These components include signal synchro-nization, changeable message signs, and closed-circuit surveillance. The TSM/Expanded BusService Alternative would have only a negligible impact on the SR-22/I-5 general-purpose con-nectors forecasted demand.
C. FULL BUILD ALTERNATIVE
The Full Build Alternative includes all the TSM/Expanded Bus Service Alternative elements andserves additional traffic to and from the proposed Pacific Electric Arterial. The Pacific Electric Ar-terial would provide direct free-flow access into downtown Santa Ana. It would serve forecastedtraffic demand of nearly 40,000 vehicles, with peak-hour traffic volumes ranging from 1,400 to1,800 vehicles in each direction. The Full Build Alternative would accommodate this additionaltraffic demand, without SR-22 operations deteriorating, primarily resulting from the additionalmixed-flow capacity that would become available from the mode shift to HOV lanes.

State Route 22/West Orange County Connection DEIR/EIS
Transportation and Circulation 4.7 - 16 August 2001
Table 4.7-8ARTERIAL AND FREEWAY CONNECTOR LEVEL OF SERVICE (LOS)
YEAR 2020
No Build TSM/Expanded Bus
Service
Full Build Reduced Build
Arterial ADT* LOS** ADT LOS** ADT* LOS** ADT* LOS**Newhope Street at West-minster Boulevard
29,100 C 30,000 C 28,500 C 31,600 D
Harbor Boulevard atWestminster Boulevard
60,000 C 57,100 C 56,600 C 62,200 D
Fairview Street at West-minster Boulevard
45,800 F 49,200 F 44,700 F 47,900 F
Westminster Boulevard/17th
Street at Fairview Avenue38,700 B 45,000 C 41,700 C 44,600 C
Fifth Street at Fairview Ave-nue
12,000 E 11,300 D 10,700 D 11,500 E
First Street at Fairview Ave-nue
44,100 C 43,000 C 34,800 B 41,800 C
Connector AM PM AM PM AM PM AM PMPHV***
2,060 2,140 2,120 2,190 520 690 2,060 2,090Eastbound SR-22to southbound I-5
LOS D D D D A A D D
PHV***
2,390 2,020 2,270 2,090 1,480 1,430 2,370 2,190Northbound I-5 towestbound SR-22
LOS F F F F E E F F
* ADT forecasts were derived from adjusted estimates of daily traffic demand provided by OCTA, December 1999** LOS presented above are for the PM peak hour.*** PHV = Peak Hour Volume. LOS was estimated using a capacity of 1500 vphpl for the connectors.
The study area arterials would show some change from implementing the Pacific Electric Arterial.ADT volumes on five of the six arterials evaluated would drop by 600 to 9,300 vehicles; onlyWestminster Boulevard/17th Street is forecast to have an ADT increase. LOS on five of the sixarterials would improve or remain unchanged from the No Build condition.
The vehicles using the Pacific Electric Arterial (39,900 per day) would include new trips, but agreater majority would be trips that were formerly on the freeway. This is evident from the fore-casted demand change on the eastbound SR-22 to southbound I-5 general-purpose connector.The AM and PM peak-hour volumes would decrease by approximately 1,500 vehicles, suggestingthat those vehicles would be using a different route, namely the Pacific Electric Arterial. (SeeSection 4.7.3 C, HOV Connector Impacts, Full Build Alternative, for additional discussion of theforecasted changes in demand on this connector.) However, the eastbound SR-22 to southboundI-5 connector is forecasted to operate below capacity in the No Build scenario without constructingthe Pacific Electric Arterial, so reducing the demand on it would not improve mobility on the con-nector.
D. REDUCED BUILD ALTERNATIVE
The Reduced Build Alternative shows an ADT volume increase on north/south arterials and a vol-ume reduction on two of three east/west arterials. The ADT volume increase in north-south arte-rials can mainly be attributed to the increased number of commuters using these streets to accessthe freeway in order to use the additional capacity created by the HOV lanes. In the Full Build Al-
State Route 22/West Orange County Connection DEIR/EIS
Transportation and Circulation 4.7 - 17 August 2001
ternative, PE Arterial is anticipated to carry this additional demand; therefore, other arterial streetsmay not experience increased traffic flows.
The Reduced Build Alternative would have only a negligible impact on the SR-22/I-5 general-purpose connectors forecasted demand because the Pacific Electric Arterial and associated con-nectors (which result in a noticeable difference on those connectors between the Full Build Alter-native and the No Build Alternative) are not part of the Reduced Build Alternative.
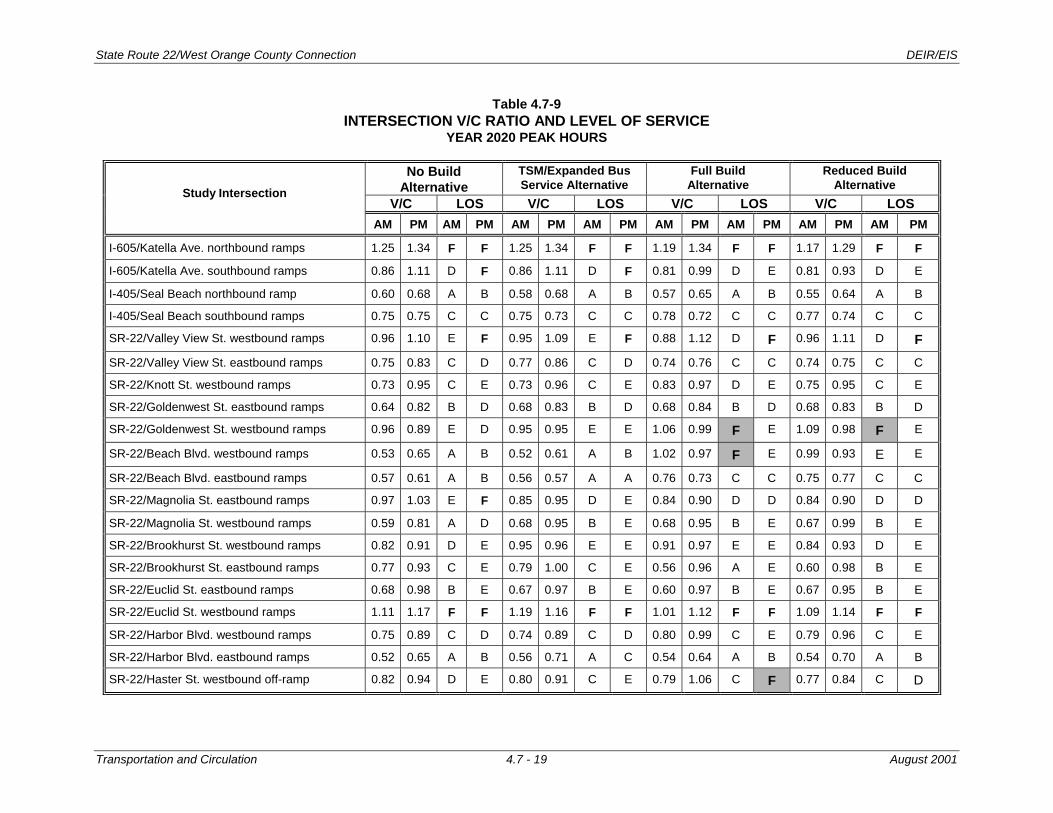
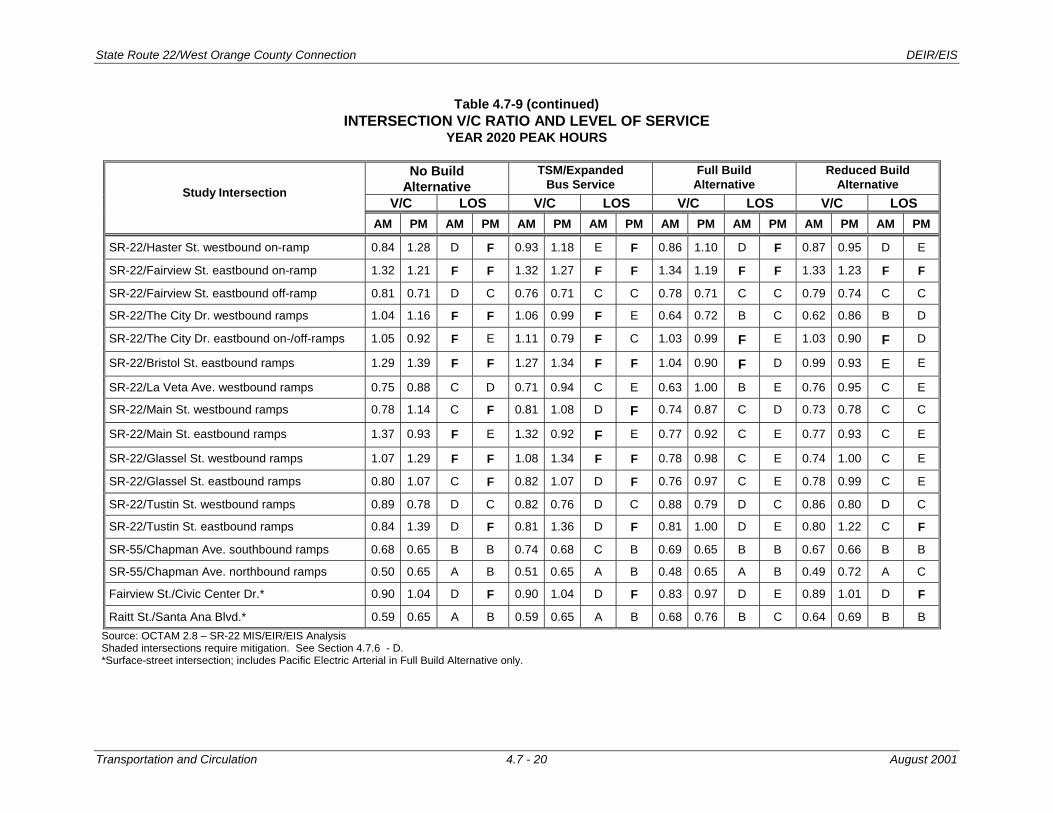
4.7.5 Intersection Impacts
Table 4.7-9 summarizes the intersection volume to capacity (V/C) ratio and LOS values for the studyalternatives.
A. NO BUILD ALTERNATIVE
Of the 37 intersections studied, 16, or approximately 43 percent, are projected to operate belowLOS E thresholds in the PM peak period (i.e., LOS F conditions). The most congested intersec-tions (V/C over 1.2) would be as follows:• I-605/Katella Avenue northbound on-/off-ramps• SR-22/Haster Street westbound on-ramp• SR-22/Fairview Street eastbound on-ramp• SR-22/Bristol Street eastbound on-/off-ramps• SR-22/Main Street/Town and Country Road eastbound on-/off-ramps• SR-22/Glassel Street westbound on-/off-ramps• SR-22/Tustin Street eastbound off-ramp
B. TSM/EXPANDED BUS SERVICE ALTERNATIVE
Under the TSM/Expanded Bus Service Alternative, the same 16 intersections would operate atLOS F conditions. However, almost two-thirds of the V/C ratio values are the same as or slightlylower than the No Build Alternative, ranging between 0.51 and 1.36. Although the 16 intersectionswould operate at LOS F, they still would not exceed the CMP threshold criteria, as identified inSection 4.7.2 of this report.
C. FULL BUILD ALTERNATIVE
Under the Full Build Alternative, of the 37 intersections, only ten would operate at LOS F condi-tions (27 percent). The V/C ratios would range between 0.48 and 1.34. Of the ten LOS F inter-sections, three would exceed CMP impact thresholds because: 1) they would deteriorate to LOS Fcompared to LOS E under the No Build Alternative, or 2) the intersection was already operating atLOS F and the V/C ratio would increase by more than 0.10. These intersections include:• Goldenwest Street/Garden Grove Boulevard westbound off-ramp• Beach Boulevard westbound off-ramp• Haster Street westbound off-ramp
These intersections would require mitigation (see Section 4.7.6). The deterioration of LOS at theBeach Boulevard westbound off-ramp would result from geometric changes proposed for theramps as part of the Full Build Alternative to replace the outdated four-quadrant cloverleaf inter-change. Additionally, 27 of the intersections would experience some operational improvementsunder the Full Build Alternative. This is most likely a result of the improved freeway LOS andspeed, encouraging drivers to stay on the freeway rather than exiting early and using the surfacestreet network for part of their trip.
Operations at the two intersections at which new Pacific Electric Arterial connections would beconstructed would not experience a negative impact. The Fairview Street and Civic Center Drive

State Route 22/West Orange County Connection DEIR/EIS
Transportation and Circulation 4.7 - 18 August 2001
intersection would improve from LOS F to LOS E in the PM as a result of adding the ramps to thePacific Electric Arterial.
D. REDUCED BUILD ALTERNATIVE
Under the Reduced Build Alternative, of the 37 intersections, only eight would operate at LOS Fconditions (22 percent). The V/C ratios would range between 0.49 and 1.33. The Reduced BuildAlternative would result in improvement of LOS at 16 intersections while deterioration would occurat 7 intersections. The deterioration of LOS at the Beach Boulevard westbound off-ramp wouldresult from geometric changes proposed for the ramps as part of the Reduced Build Alternative toreplace the outdated four-quadrant cloverleaf interchange. Of the eight LOS F intersections, onewould exceed CMP impact thresholds because it would deteriorate to LOS F in the AM peak pe-riod compared to LOS E under the No Build Alternative. This would occur at the GoldenwestStreet/Garden Grove Boulevard westbound off-ramp intersection. This intersection would requiremitigation (see Section 4.7.6). Additionally, 24 of the intersections would experience some opera-tional improvements. This is most likely a result of the improved freeway LOS and speed, en-couraging drivers to stay on the freeway rather than exiting early and using the surface street net-work for part of their trip.
State Route 22/West Orange County Connection DEIR/EIS
Transportation and Circulation 4.7 - 19 August 2001
Table 4.7-9INTERSECTION V/C RATIO AND LEVEL OF SERVICE
YEAR 2020 PEAK HOURS
No BuildAlternative
TSM/Expanded BusService Alternative
Full BuildAlternative
Reduced BuildAlternative
V/C LOS V/C LOS V/C LOS V/C LOSStudy Intersection
AM PM AM PM AM PM AM PM AM PM AM PM AM PM AM PM
I-605/Katella Ave. northbound ramps 1.25 1.34 F F 1.25 1.34 F F 1.19 1.34 F F 1.17 1.29 F F
I-605/Katella Ave. southbound ramps 0.86 1.11 D F 0.86 1.11 D F 0.81 0.99 D E 0.81 0.93 D E
I-405/Seal Beach northbound ramp 0.60 0.68 A B 0.58 0.68 A B 0.57 0.65 A B 0.55 0.64 A B
I-405/Seal Beach southbound ramps 0.75 0.75 C C 0.75 0.73 C C 0.78 0.72 C C 0.77 0.74 C C
SR-22/Valley View St. westbound ramps 0.96 1.10 E F 0.95 1.09 E F 0.88 1.12 D F 0.96 1.11 D FSR-22/Valley View St. eastbound ramps 0.75 0.83 C D 0.77 0.86 C D 0.74 0.76 C C 0.74 0.75 C C
SR-22/Knott St. westbound ramps 0.73 0.95 C E 0.73 0.96 C E 0.83 0.97 D E 0.75 0.95 C E
SR-22/Goldenwest St. eastbound ramps 0.64 0.82 B D 0.68 0.83 B D 0.68 0.84 B D 0.68 0.83 B D
SR-22/Goldenwest St. westbound ramps 0.96 0.89 E D 0.95 0.95 E E 1.06 0.99 F E 1.09 0.98 F E
SR-22/Beach Blvd. westbound ramps 0.53 0.65 A B 0.52 0.61 A B 1.02 0.97 F E 0.99 0.93 E E
SR-22/Beach Blvd. eastbound ramps 0.57 0.61 A B 0.56 0.57 A A 0.76 0.73 C C 0.75 0.77 C C
SR-22/Magnolia St. eastbound ramps 0.97 1.03 E F 0.85 0.95 D E 0.84 0.90 D D 0.84 0.90 D D
SR-22/Magnolia St. westbound ramps 0.59 0.81 A D 0.68 0.95 B E 0.68 0.95 B E 0.67 0.99 B E
SR-22/Brookhurst St. westbound ramps 0.82 0.91 D E 0.95 0.96 E E 0.91 0.97 E E 0.84 0.93 D E
SR-22/Brookhurst St. eastbound ramps 0.77 0.93 C E 0.79 1.00 C E 0.56 0.96 A E 0.60 0.98 B E
SR-22/Euclid St. eastbound ramps 0.68 0.98 B E 0.67 0.97 B E 0.60 0.97 B E 0.67 0.95 B E
SR-22/Euclid St. westbound ramps 1.11 1.17 F F 1.19 1.16 F F 1.01 1.12 F F 1.09 1.14 F F
SR-22/Harbor Blvd. westbound ramps 0.75 0.89 C D 0.74 0.89 C D 0.80 0.99 C E 0.79 0.96 C E
SR-22/Harbor Blvd. eastbound ramps 0.52 0.65 A B 0.56 0.71 A C 0.54 0.64 A B 0.54 0.70 A B
SR-22/Haster St. westbound off-ramp 0.82 0.94 D E 0.80 0.91 C E 0.79 1.06 C F 0.77 0.84 C D
State Route 22/West Orange County Connection DEIR/EIS
Transportation and Circulation 4.7 - 20 August 2001
Table 4.7-9 (continued)INTERSECTION V/C RATIO AND LEVEL OF SERVICE
YEAR 2020 PEAK HOURS
No BuildAlternative
TSM/ExpandedBus Service
Full BuildAlternative
Reduced BuildAlternative
V/C LOS V/C LOS V/C LOS V/C LOSStudy Intersection
AM PM AM PM AM PM AM PM AM PM AM PM AM PM AM PM
SR-22/Haster St. westbound on-ramp 0.84 1.28 D F 0.93 1.18 E F 0.86 1.10 D F 0.87 0.95 D E
SR-22/Fairview St. eastbound on-ramp 1.32 1.21 F F 1.32 1.27 F F 1.34 1.19 F F 1.33 1.23 F F
SR-22/Fairview St. eastbound off-ramp 0.81 0.71 D C 0.76 0.71 C C 0.78 0.71 C C 0.79 0.74 C C
SR-22/The City Dr. westbound ramps 1.04 1.16 F F 1.06 0.99 F E 0.64 0.72 B C 0.62 0.86 B D
SR-22/The City Dr. eastbound on-/off-ramps 1.05 0.92 F E 1.11 0.79 F C 1.03 0.99 F E 1.03 0.90 F D
SR-22/Bristol St. eastbound ramps 1.29 1.39 F F 1.27 1.34 F F 1.04 0.90 F D 0.99 0.93 E E
SR-22/La Veta Ave. westbound ramps 0.75 0.88 C D 0.71 0.94 C E 0.63 1.00 B E 0.76 0.95 C E
SR-22/Main St. westbound ramps 0.78 1.14 C F 0.81 1.08 D F 0.74 0.87 C D 0.73 0.78 C C
SR-22/Main St. eastbound ramps 1.37 0.93 F E 1.32 0.92 F E 0.77 0.92 C E 0.77 0.93 C E
SR-22/Glassel St. westbound ramps 1.07 1.29 F F 1.08 1.34 F F 0.78 0.98 C E 0.74 1.00 C E
SR-22/Glassel St. eastbound ramps 0.80 1.07 C F 0.82 1.07 D F 0.76 0.97 C E 0.78 0.99 C E
SR-22/Tustin St. westbound ramps 0.89 0.78 D C 0.82 0.76 D C 0.88 0.79 D C 0.86 0.80 D C
SR-22/Tustin St. eastbound ramps 0.84 1.39 D F 0.81 1.36 D F 0.81 1.00 D E 0.80 1.22 C F
SR-55/Chapman Ave. southbound ramps 0.68 0.65 B B 0.74 0.68 C B 0.69 0.65 B B 0.67 0.66 B B
SR-55/Chapman Ave. northbound ramps 0.50 0.65 A B 0.51 0.65 A B 0.48 0.65 A B 0.49 0.72 A C
Fairview St./Civic Center Dr.* 0.90 1.04 D F 0.90 1.04 D F 0.83 0.97 D E 0.89 1.01 D F
Raitt St./Santa Ana Blvd.* 0.59 0.65 A B 0.59 0.65 A B 0.68 0.76 B C 0.64 0.69 B BSource: OCTAM 2.8 – SR-22 MIS/EIR/EIS AnalysisShaded intersections require mitigation. See Section 4.7.6 - D.*Surface-street intersection; includes Pacific Electric Arterial in Full Build Alternative only.
State Route 22/West Orange County Connection
Transportation and Circulation 4.7 - 21 August 2001
Thresholds of Significance for CEQA:
• Insufficient capacity on SR-55 HOV facility for incoming SR-22 HOV traffic
A. NO BUILD ALTERNATIVE
The No Build Alternative would not have impacts on the SR-55 HOV facility due to a lack of ca-pacity for incoming SR-22 HOV traffic.
B. TSM/EXPANDED BUS SERVICE ALTERNATIVE
The TSM/Expanded Bus Service Alternative would not include any major capital improvements toSR-22, therefore, it would have negligible on the SR-55 HOV facility due to a lack of capacity forincoming SR-22 HOV traffic.
C. FULL BUILD ALTERNATIVE
Of the four proposed HOV connectors, only one, the SR-22/SR-55 connector, would result in anegative impact to the highway network. Implementation of this connector is projected to increasethe demand on SR-55 north of SR-22 to a level that would far exceed the capacity of a singleHOV lane. This impact would remain significant unless mitigated. To mitigate impacts to theSR-22/SR-55 HOV connector, it may be necessary to include an additional SR-55 HOV lane ineach direction north of SR-22 for some distance until the forecasted demand drops below the sin-gle HOV lane capacity. However, this is beyond the scope of the SR-22/West Orange CountyConnection project and will have to be investigated if the Full Build Alternative is the preferredone. Alternatively, the SR-22/SR-55 HOV connector could be eliminated, but this is inconsistentwith the Full Build Alternative.
D. REDUCED BUILD ALTERNATIVE
The Reduced Build Alternative has elements that are eliminated from the Full Build Alternative toreduce impacts such as environmental. Among the environmental impacts are the SR-22/SR-55HOV connector. As mentioned above, implementation of this connector is projected to increasethe demand on SR-55 north of SR-22 to a level that would far exceed the capacity of a singleHOV lane. Since this alternative does not include the SR-22/SR-55 HOV connector, it would nothave an impact on the SR-55 HOV facility resulting from incoming SR-22 HOV traffic.Since this alternative does not include the SR-22/SR-55 HOV connector, it would not have an im-pact on the SR-55 HOV facility resulting from incoming SR-22 HOV traffic.
4.7.6 Mitigation
Several intersections and freeway mainline segments under any study alternatives would operate belowthreshold criteria (below LOS E for freeway mainline segments and intersections). However, for allthreshold exceedances that would exist under the baseline conditions (No Build Alternative), others wouldneed to prepare a separate mitigation because these threshold exceedances would not be caused by thisproject’s proposed improvement strategies. The TSM/Expanded Bus Service, Full Build, or Reduced BuildAlternative’s projected threshold exceedances, beyond those predicted to occur with the No Build sce-nario, were evaluated. Alternative modifications have been identified to eliminate potential threshold crite-ria exceedances.
A. NO BUILD ALTERNATIVE
None planned.
B. TSM/EXPANDED BUS SERVICE ALTERNATIVE

State Route 22/West Orange County Connection
Transportation and Circulation 4.7 - 22 August 2001
None planned.
C. FULL BUILD ALTERNATIVE
To mitigate impacts to the SR-22/SR-55 HOV connector it would be necessary to include an addi-tional SR-55 HOV lane in each direction north of SR-22 for some distance until the forecasteddemand drops below the single HOV lane capacity. This is beyond the scope of the SR-22/WestOrange County Connection. Alternatively, the SR-22/SR-55 HOV connector could be eliminated,but this is inconsistent with the Full Build Alternative.
TRA-FB-1. Three intersections under the Full Build Alternative would exceed CMP threshold cri-teria. Additional lanes will be required at these intersections, as shown on Figure 4.7-2. Theseramp intersection modifications have been incorporated into the Full Build Alternative.
D. REDUCED BUILD ALTERNATIVE
TRA-RB-1. One intersection under the Reduced Build Alternative would exceed CMP thresholdcriteria. Additional lanes will be required at this intersection, as shown on Figure 4.7-3. This rampintersection modification has been incorporated into the Reduced Build Alternative.
As indicated in Table 4.7-6, increases in V/C ratios in the northbound and southbound HOV lanesof SR-55 would exceed the CMP threshold criteria. Providing a second HOV lane in either direc-tion is not recommended as an immediate mitigation measure, considering the recent widening ofSR-55 and the structure replacement/modification costs. Therefore, it is recommended to provideingress/egress points for vehicles from SR-22 at suitable distances from the interchange wherethe HOV volumes are lower and the CMP threshold criteria will not be violated.
4.7.7 Residual Impacts After Mitigation
This section discussed the residual impacts after implementing proposed mitigation. The only mitigationdiscussed in the intersection mitigation because the other mitigation components included alternativemodifications that resulted in reducing the impacts to below threshold levels.
A. NO BUILD ALTERNATIVE
None.
B. TSM/EXPANDED BUS SERVICE ALTERNATIVE
None.
C. FULL BUILD ALTERNATIVE
Because there is no feasible mitigation for the excess HOV traffic on SR-55 north and south ofSR-22, there would be a residual and substantial traffic impact under the Full Build Alternative.
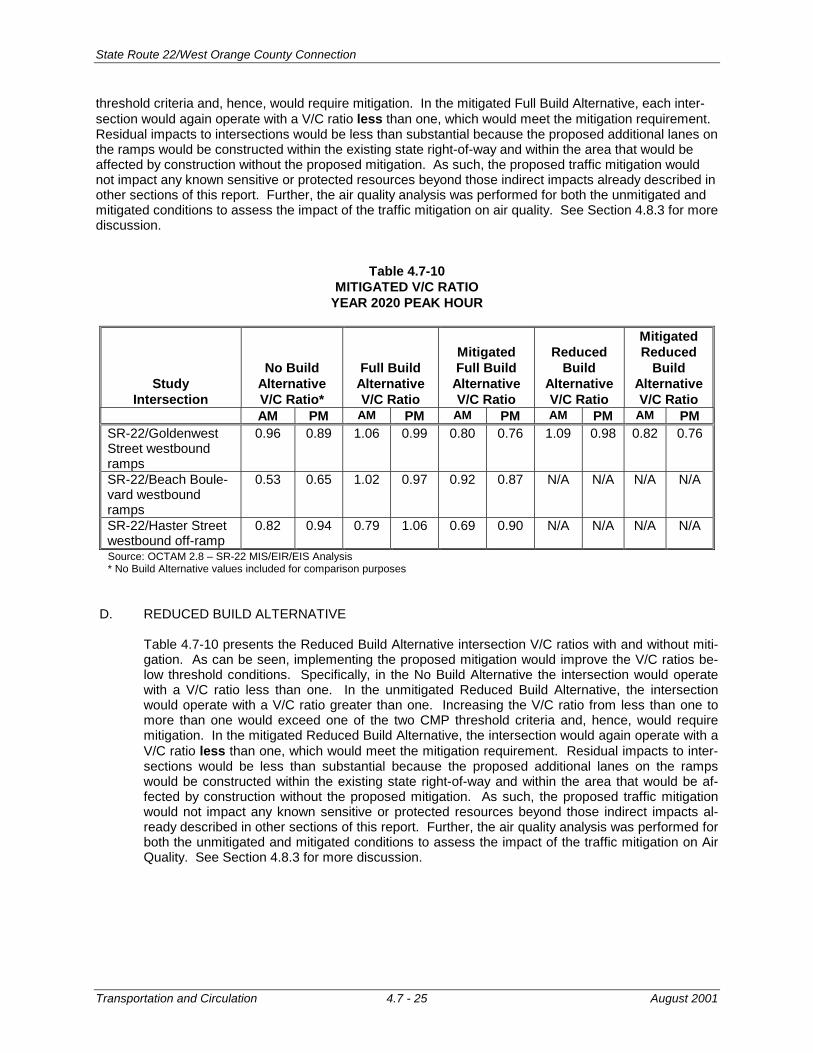
Table 4.7-10 presents the Full Build Alternative intersection V/C ratios with and without mitigation. As canbe seen, implementing the proposed mitigation would improve the V/C ratios below threshold conditions.Specifically, in the No Build Alternative all three intersections would operate with a V/C ratio less than one.In the unmitigated Full Build Alternative, each intersection would operate with a V/C ratio greater than one.Increasing the V/C ratio from less than one to more than one would exceed one of the two CMP
State Route 22/West Orange County Connection
Transportation and Circulation 4.7 - 23 August 2001
Figure 4.7-2Full Build Alternative Mitigation Intersection
State Route 22/West Orange County Connection
Transportation and Circulation 4.7 - 24 August 2001
Figure 4.7-3Reduced Build Alternative Mitigation Intersection
State Route 22/West Orange County Connection
Transportation and Circulation 4.7 - 25 August 2001
threshold criteria and, hence, would require mitigation. In the mitigated Full Build Alternative, each inter-section would again operate with a V/C ratio less than one, which would meet the mitigation requirement.Residual impacts to intersections would be less than substantial because the proposed additional lanes onthe ramps would be constructed within the existing state right-of-way and within the area that would beaffected by construction without the proposed mitigation. As such, the proposed traffic mitigation wouldnot impact any known sensitive or protected resources beyond those indirect impacts already described inother sections of this report. Further, the air quality analysis was performed for both the unmitigated andmitigated conditions to assess the impact of the traffic mitigation on air quality. See Section 4.8.3 for morediscussion.
Table 4.7-10MITIGATED V/C RATIO
YEAR 2020 PEAK HOUR
StudyIntersection
No BuildAlternativeV/C Ratio*
Full BuildAlternativeV/C Ratio
MitigatedFull Build
AlternativeV/C Ratio
ReducedBuild
AlternativeV/C Ratio
MitigatedReduced
BuildAlternativeV/C Ratio
AM PM AM PM AM PM AM PM AM PMSR-22/GoldenwestStreet westboundramps
0.96 0.89 1.06 0.99 0.80 0.76 1.09 0.98 0.82 0.76
SR-22/Beach Boule-vard westboundramps
0.53 0.65 1.02 0.97 0.92 0.87 N/A N/A N/A N/A
SR-22/Haster Streetwestbound off-ramp
0.82 0.94 0.79 1.06 0.69 0.90 N/A N/A N/A N/A
Source: OCTAM 2.8 – SR-22 MIS/EIR/EIS Analysis* No Build Alternative values included for comparison purposes
D. REDUCED BUILD ALTERNATIVE
Table 4.7-10 presents the Reduced Build Alternative intersection V/C ratios with and without miti-gation. As can be seen, implementing the proposed mitigation would improve the V/C ratios be-low threshold conditions. Specifically, in the No Build Alternative the intersection would operatewith a V/C ratio less than one. In the unmitigated Reduced Build Alternative, the intersectionwould operate with a V/C ratio greater than one. Increasing the V/C ratio from less than one tomore than one would exceed one of the two CMP threshold criteria and, hence, would requiremitigation. In the mitigated Reduced Build Alternative, the intersection would again operate with aV/C ratio less than one, which would meet the mitigation requirement. Residual impacts to inter-sections would be less than substantial because the proposed additional lanes on the rampswould be constructed within the existing state right-of-way and within the area that would be af-fected by construction without the proposed mitigation. As such, the proposed traffic mitigationwould not impact any known sensitive or protected resources beyond those indirect impacts al-ready described in other sections of this report. Further, the air quality analysis was performed forboth the unmitigated and mitigated conditions to assess the impact of the traffic mitigation on AirQuality. See Section 4.8.3 for more discussion.
State Route 22/West Orange County Connection
Transportation and Circulation 4.7 - 26 August 2001
This page intentionally blank