Embed Size (px)
Citation preview
4.6 A CASE EXAMPLE OF THE ROLE OF WARM-SECTORCONVECTION IN THE DEVELOPMENT OF MESOSCALE
BANDED SNOWFALL: 2003 NOVEMBER 22-24
Martin A. Baxter∗
Central Michigan UniversityMt. Pleasant, MI
Charles E. GravesSaint Louis University
St. Louis, MO
1. INTRODUCTION
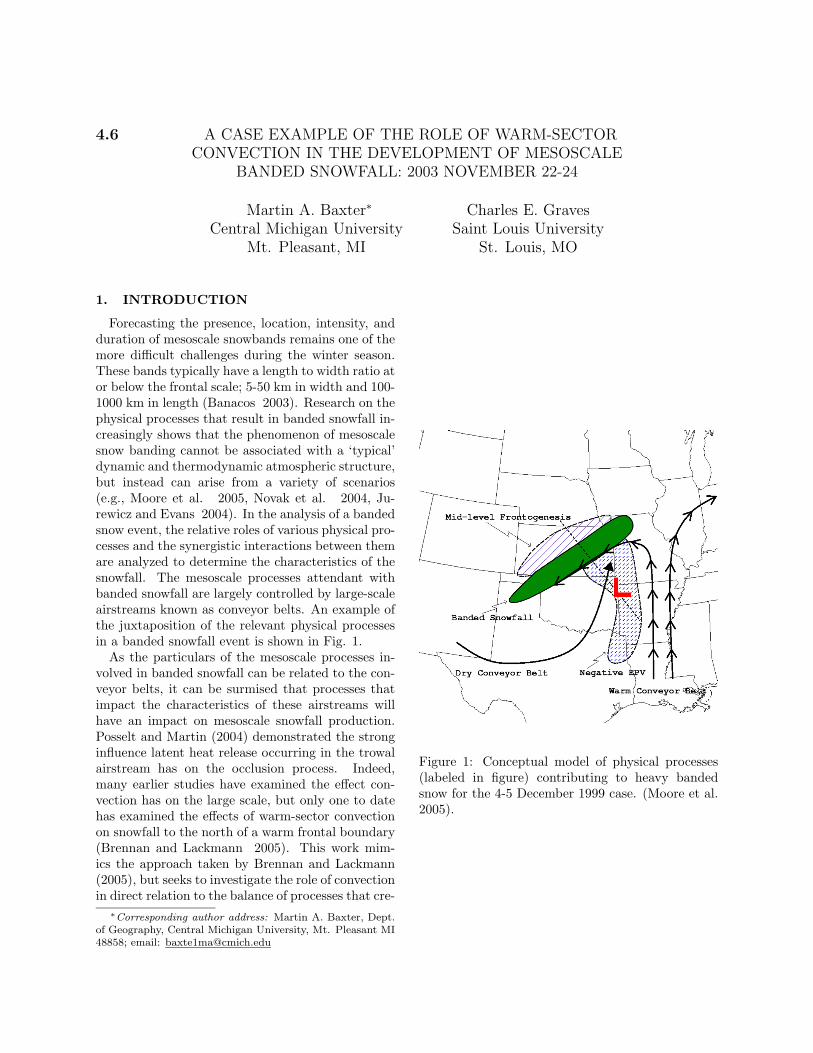
Forecasting the presence, location, intensity, andduration of mesoscale snowbands remains one of themore difficult challenges during the winter season.These bands typically have a length to width ratio ator below the frontal scale; 5-50 km in width and 100-1000 km in length (Banacos 2003). Research on thephysical processes that result in banded snowfall in-creasingly shows that the phenomenon of mesoscalesnow banding cannot be associated with a ‘typical’dynamic and thermodynamic atmospheric structure,but instead can arise from a variety of scenarios(e.g., Moore et al. 2005, Novak et al. 2004, Ju-rewicz and Evans 2004). In the analysis of a bandedsnow event, the relative roles of various physical pro-cesses and the synergistic interactions between themare analyzed to determine the characteristics of thesnowfall. The mesoscale processes attendant withbanded snowfall are largely controlled by large-scaleairstreams known as conveyor belts. An example ofthe juxtaposition of the relevant physical processesin a banded snowfall event is shown in Fig. 1.
As the particulars of the mesoscale processes in-volved in banded snowfall can be related to the con-veyor belts, it can be surmised that processes thatimpact the characteristics of these airstreams willhave an impact on mesoscale snowfall production.Posselt and Martin (2004) demonstrated the stronginfluence latent heat release occurring in the trowalairstream has on the occlusion process. Indeed,many earlier studies have examined the effect con-vection has on the large scale, but only one to datehas examined the effects of warm-sector convectionon snowfall to the north of a warm frontal boundary(Brennan and Lackmann 2005). This work mim-ics the approach taken by Brennan and Lackmann(2005), but seeks to investigate the role of convectionin direct relation to the balance of processes that cre-∗Corresponding author address: Martin A. Baxter, Dept.
of Geography, Central Michigan University, Mt. Pleasant MI48858; email: [email protected]
Figure 1: Conceptual model of physical processes(labeled in figure) contributing to heavy bandedsnow for the 4-5 December 1999 case. (Moore et al.2005).

Figure 2: Model domain configuration for 22-24November 2003 case.
ate banded snowfall. The fact that banded snowfallcan exist with or without convection suggests thatconvection to the south of a region of banded snow-fall may not always “steal” the moisture, an ideathat anecdotal evidence suggests many operationalforecasters hold true.
2. MODEL SIMULATION
Version 3.7 of the fifth-generation PennsylvaniaState University-National Center for AtmosphericResearch mesoscale model (MM5, Grell et al. (1995))was used to simulate this event. A 48-h simulationwas completed, spanning 1200 UTC 22 Nov 2003through 1200 UTC 24 Nov 2003. Three two-waynested domains were used, with resolutions of 36km, 12 km, and 4 km (Fig. 2). The innermost do-main was defined to include both the banded snow-fall and the convection. Vertical resolution consistedof 37 sigma levels. Parameterizations used were theReisner 2 explicit microphysics scheme, the Grell cu-mulus parameterization scheme, the MRF planetaryboundary layer scheme, the Dudhia cloud radiationscheme, and the five-layer soil model. No cumu-lus parameterization was used on the 4 km domain.Instantaneous temperature tendencies were outputfrom the cumulus and explicit microphysics schemes.Trajectories were computed using version 4 of RIP(Read-Interpolate-Plot; Stoelinga (2005)).
Initial conditions and lateral boundary conditionswere obtained from the North American RegionalReanalysis dataset. This data is archived every 3hours, and contains 32 km horizontal resolution with45 layers. The use of this dataset is advantageous, inthat it contains similar resolution to the outermostgrid and it allows the lateral boundary conditions tobe updated more frequently than with Eta analysis
data.
3. SYNOPTIC OVERVIEW
This system featured a broad area of snowfallthrough South Dakota, Minnesota, and Wisconsin.Maximum snowfall of 10 to 12 in was reported, alongwith winds as high as 40 kts, leading to blizzardconditions (NCDC 2006). Convection occured inthe form of a quasi-linear convective system (QLCS)that developed in Missouri and propagated north-ward and eastward over time. Severe weather wasreported with this convection, with thunderstormwinds of 70 kts and hail as large as 1 in (NCDC2006).
This case featured fairly strong, slowly evolvingupper level dynamics. At the initial time, zonal flowat 500 mb existed over much of the United States. Astraight jet streak was present at 300 mb over Kansasand Nebraska, extending northeast through Min-nesota and Wisconsin. A low-level thermal gradientis seen at the surface and 850 mb from Oklahomanortheast into Missouri, south of the upper-level jetstreak. A developing surface low is present along thefrontal boundary in the Texas panhandle. Throughthe remainder of the simulation, this low underwentcyclogenesis as the pattern at 500 mb became highlymeridional with the approach of a strong shortwavetrough and associated vorticity maximum. Furtherupper-level support for cyclogenesis was present inthe form of a jet streak that developed on the east-ward side of the shortwave trough. Simulated reflec-tivity at F2700 illustrates banded snowfall in Min-nesota and Wisconsin, with a QLCS to the southeast(Fig. 3). The simulation was very accurate with re-spect to the large scale dynamics and the convectivemode.
4. PV BUDGET
A PV budget was computed, using the methodsprovided by Raymond (1992) and Cammas et al.(1994), and used by Lackmann (2002) and Brennanand Lackmann (2005). The PV budget is useful inestablishing that PV anomalies were generated in-situ via diabatic processes, rather than due to hor-izontal or vertical advection. Budget calculationswere performed for F2100, four hours after the initi-ation of convection. Tendency terms are shown for700 mb, with model-output diabatic heating shownfor 650 mb, as it is known that PV anomalies de-velop beneath areas of maximum diabatic heating.Diabatic heating is concentrated along the axis ofthe QLCS, with a maximum value in excess of 20010−5 K s−1 in northern Missouri / west-central Illi-

Figure 3: MM5 simulated reflectivity on domainthree for 1500 UTC 23 Nov (F2700), in dBZ andsurface temperature (2◦C, solid).
nois (Fig. 4a). A maximum in PV of 1.25-1.50PVU (PVU = potential vorticity units = 10−6 Km2 kg−1 s−1) is seen just north of the maximum di-abatic heating, in southeastern Iowa. A secondaryPV maximum is seen ahead of the QLCS in east-central Illinois. The nonadvective PV tendency pro-vides the generation rate of PV due to diabatic pro-cesses (Fig. 4b). As expected, the nonadvective PVtendency is maximized along the QLCS, with a max-imum value of 2 PVU 3 hr−1 in the aforementionedregion of maximum diabatic heating. Positive val-ues of nonadvective PV tendency are seen through-out the length of the QLCS, with additional positivevalues near the secondary PV maximum in easternIllinois.
5. PV INVERSION
A nonlinear piecewise PV inversion based on themethodology devised by Davis and Emanuel (1991)was performed in order to quantify the impact of thediabatically produced PV on the flow and associatedmoisture transport. Mean state values of PV, θ, φ, ψwere computed from a 14-day MM5 simulation cen-tered on the 48 hr primary simulation spanning thetime period 0000 UTC 16 November 2003 through0000 UTC 30 November 2003. F2700 was selectedfor inversion (see Fig. 3). The inversion was per-formed on a 44 x 56 grid with a 36 km resolution.
Figure 4: MM5 domain one (a) 700 mb PV (scalebelow; shaded) and 650 mb diabatic heating (100 x10−5 K s−1; lines) and (b) 700 mb PV and nonad-vective PV tendency (0.5 PVU 3 hr−1; lines) at 0900UTC Nov 23 (F2100).
Figure 5: MM5 domain one (a) 600 mb perturba-tion PV (scale at bottom) and (b) 600 mb selectedperturbation PV (scale at bottom). Valid for 1500UTC 23 Nov (F2700).
Negative PV was set to a small positive value to en-sure numerical convergence. 19 levels were used inthe inversion, ranging from 1000 to 100 mb with aninterval of 50 mb. θ at 975 mb and 125 mb wasused for the lower and upper boundary conditions,respectively.
Since F2100, the area of convection and associ-ated PV has increased to the north, where it nowtakes on a less linear orientation (Fig. 5a). The per-turbation PV is primarily vertically continuous instructure, though magnitudes differ depending onthe level chosen. To examine the effects of the flowfield of only the perturbation PV due to convectionin the warm sector, a grid “mask” was created toisolate this PV (Fig. 5b). During the inversion, all

Figure 6: MM5 domain one (a) 900 mb perturbationheights (m) and winds (kts) and (b) percentage ofbalanced winds due to selected PV. Valid for 1500UTC 23 Nov (F2700).
PV in the domain outside of that selected was set tozero. In addition, all anticyclonic (negative) pertur-bation PV was set to zero. Selected PV over a 900to 500 mb layer was inverted.
The perturbation heights and winds at 900 mbresulting from the inversion of the selected PV areshown in Fig. 6a. Height falls of 20 m and an associ-ated cyclonic circulation are observed near the east-ern Upper Peninsula of Michigan. The wind fielddue to the inversion of the selected PV is comparedto the wind field due to the full (1000-100 mb) in-version of all PV in Fig. 6b. The height and windfields resulting from the selected PV must be viewedas a contribution to relevant physical processes, andnot in terms of absolutes. Southerly winds overLake Michigan contribute 20 to 30% of the total bal-anced flow, contributing to the northward transportof warm, moist, low-level air. North of Lake Su-perior, easterly winds also contribute 20 to 30% ofthe total balanced flow, enhancing the cold conveyorbelt (CCB).
The height falls and cyclonic circulation are notin the vicinity of the primary surface low, which isfurther to the southwest. The selected PV producesa secondary surface low that arises due to diabati-cally produced PV within the northward advancingQLCS. This secondary low is seen within the modelsimulation. This feature is slightly more apparentat F3000 rather than F2700, thus this time is shownin Fig. 7a. At F2700, the observed surface map in-dicates a secondary surface low over Lake Michigan(Fig. 7b), a testament to the validity of the modelsimulation and its ability to represent diabatic pro-cesses and their impacts.
Figure 7: (a) MM5 domain one mean sea level pres-sure (solid, 4 mb), surface temperatures (dashed;5◦F), and winds in knots at 1800 UTC 23 Nov(F3000). (b) NCEP surface analysis for 1500 UTC23 Nov (F2700).
6. TRAJECTORY ANALYSIS
Trajectory analysis was performed on the 4 kmdomain. A 500 x 300 km grid box containing 24trajectories was created in southern Wisconsin, anarea that convection eventually entered. Backwardtrajectories were released from 800 mb at this loca-tion every 15 min, with each trajectory spanning 8h. This analysis seeks to answer the question: For abox located in southern Wisconsin, how did the pathof the air entering this area change, and how did themoisture along this path change? Fig. 8 depicts theinitial and final values of q and rh as a function oftrajectory ending time (using values computed fromthe average of all trajectories). Following the periodof initial moistening of the pre-convective environ-ment, the air over southern Wisconsin was insensi-tive to changes in q at the initial points of the trajec-tory. This phenomenon occurs because the colder airto the north in the box will become saturated withless moisture than the warmer downstream environ-ment. This analysis enables us to quantitatively doc-ument the northward advance of moisture from theconvection to the area of snowfall.
Trajectory analysis is also used to analyze themoisture characteristics of the CCB. A trajectorywas found that passes through the precipitation justnorth of the strongest simulated reflectivities andsubsequently enters the area of maximum snowfall(Fig. 9). Simulated reflectivity is shown for F2800,with the location of the air along the trajectory indi-cated by the boldened arrow. A cross section alongthe yellow line in Fig. 9a is presented in Fig. 9b.The air along the trajectory at F2800 is in a region

Figure 8: MM5 domain three evolution of moistureusing the average of all trajectories, for (a) q (g kg−1)and (b) rh (%). Figure 9: MM5 domain three (a) trajectory and re-
flectivity for 1600 UTC 23 Nov (F2800) and (b) crosssection along line in (a), with q (shaded; scale atright), θ (solid, 3 K), and total precipitation mixingratio (dashed, 0.1 g kg−1).
of total precipitation mixing ratio of 0.4 g kg−1, in-dicating precipitation was falling from the columnencompassing this air. Based on this analysis, atleast some air entering the banded snow region didpass through the precipitation just north of the con-vection. Therefore, from this analysis, there is noevidence that the convection reduced the moistureavailable for the snowfall. Also of importance, thistrajectory is in the proper place and at the propertime to demonstrate the flow that was impacted bythe flow induced by the convection.
7. CONCLUSIONS
Results of a PV budget demonstrate that signifi-cant low-level PV anomalies are generated diabati-cally, and are subsequently advected northward withthe developing convection. Piecewise PV inversionof only the diabatically generated PV in the warmsector demonstrates that this PV contributed to thedevelopment of a diabatically induced surface lowthat was observed both in the model and in actual-ity. The inversion showed that the diabatically gen-erated PV enhanced the CCB and associated mois-ture transport.
A moisture analysis along trajectories analyzedhow the moisture associated with the developingconvection advanced to the north. Low-level mois-ture was advected northward to an area betweenthe convection and snowfall, and subsequently trav-eled from this area to provide a deep saturated layereven further north. Thus, saturation was maintainedalong the QLCS to the south and the snowfall to thenorth. Trajectories through the northern part of theconvective area and into the region of snowfall showthat any potential loss of condensate did not preventsnowfall from occurring.
8. ACKNOWLEDGEMENTS
Primary funding for this research is from NOAA-CSTAR under award number NA03-NWS4680019.The authors wish to thank Dr. Chris Davis for hisassistance in this research.
*
REFERENCES
Banacos, P. C., 2003: Short-range predictionof banded precipitation associated with de-formation and frontogenesis forcing. Preprints,Tenth Conf. on Mesoscale Processes, Amer. Me-teor. Soc., Portland, OR, CDROM, P1.7.
Brennan, M. J., and G. M. Lackmann, 2005: The in-fluence of incipient latent heat release on the pre-cipitation distribution of the 24-25 january 2000
u.s. east coast cyclone. Mon. Wea. Rev., 133,1913–1937.
Cammas, J.-P., D. Keyser, G. M. Lackmann, andJ. Molinari, 1994: Diabatic redistribution of po-tential vorticity accomplanying the developmentof an outflow jet within a strong extratropicalcyclone. Proc. Int. Symp. on the Life Cycles ofExtratropical Cyclones, Vol. II, Geophysical Insti-tute, University of Bergen, Bergen, Norway, 403-409.
Davis, C. A., and K. A. Emanuel, 1991:Potential vorticity diagnostics of cyclogenesis.Mon. Wea. Rev., 119, 1929–1952.
Grell, G. A., J. Dudhia, and D. R. Stauffer,1995: A description of the fifth generation pennstate/ncar mesoscale model (mm5). Tech. Rep.TN-398+STR, NCAR Technical Note.
Jurewicz, M. L., and M. S. Evans, 2004: A compar-ison of two banded, heavy snowstorms with verydifferent synoptic settings. Wea. Forecasting, 19,1011–1028.
Lackmann, G. L., 2002: Cold-frontal poten-tial vorticity maxima, the low-level jet, andmoisture transport in extratropical cyclones.Mon. Wea. Rev., 130, 59–74.
Moore, J. T., C. E. Graves, S. Ng, and J. L. Smith,2005: A process-oriented methodology towardsunderstanding the organization of an extensivemesoscale snow band: A diagnostic case study of4-5 december 1999. Wea. Forecasting, 20, 35–50.
NCDC, 2006: Storm data.Http://www.ncdc.noaa.gov/oa/climate/sd/.
Novak, D. R., L. F. Bosart, D. Keyser, and J. S.Waldstreicher, 2004: An observational study ofcold season-banded precipitatoin in northeast u.s.cyclones. Wea. Forecasting, 19, 993–1010.
Posselt, D. J., and J. E. Martin, 2004: The effectof latent heat release on the evolution of a warmoccluded thermal structure. Mon. Wea. Rev., 132,578–599.
Raymond, D. J., 1992: Nonlinear balance and po-tential vorticity thinking at large rossby number.Quart. J. R. Meteor. Soc., 118, 987–1015.
Stoelinga, M. T., 2005: A users’ guide to rip version4: A program for visualizing mesoscale model out-put. Available fromhttp://www.mmm.ucar.edu/mm5.