Embed Size (px)
Citation preview
45th Aerospace Sciences Meeting, January 8-11, 2007, Reno, Nevada
Numerical and Experimental Analysis of Plasma Flow
Control Over a Hump Model
Chuan He∗ and Thomas C. Corke†
University of Notre Dame, Notre Dame, IN 46556
Mehul P. Patel‡
Orbital Research Inc., Cleveland, OH 44103
Turbulent flow separation over a wall-mounted hump model and its control using plasma
actuators were studied numerically and experimentally. The hump model chosen in this
study was that used in a 2004 NASA Langley CFD validation workshop for turbulent
separation control using synthetic jets. The numerical simulations solved the Reynolds-
averaged Navier-Stokes equations using Fluent. Different turbulence models based on k-ε,
k-ω and SA were investigated. All turbulence models did a reasonable good job predicting
the overall features of the flow fields, but only the k-ε model agreed well with the exper-
imental data in terms of the skin friction coefficient. A body force model was used to
simulate the effect of the plasma actuator. These results showed that the plasma actuator
could be effective in controlling the turbulent flow separation over the hump. Both span-
wise and streamwise plasma actuator configurations were investigated experimentally at
a Rec = 288K. A smoke wire was used to visualize counter-rotating vortices generated by
the streamwise plasma actuators. An optimum spacing between the exposed electrodes of
the streamwise plasma actuator was found. Surface pressure coefficients demonstrate both
streamwise and spanwise configurations work well for turbulent separation control.
I. Introduction
Currently a great deal of interest within the community is to utilize the emerging flow control technol-ogy to design revolutionary Uninhabited Air Vehicles (UAVs) without moving control surfaces while stillmaintaining controlled flight. Corke et al.1 proposed a plasma flow control optimized airfoil concept. Ituses a laminar airfoil design that maintains a favorable pressure gradient over as much of the upper surfaceas possible and incorporates a separation ramp at the trailing edge that can be manipulated by a plasmaactuator in order to control lift. At lower angles of attack such as during cruise flight, a laminar bound-ary layer is maintained until it reaches a separation ramp. The separation in this case is a laminar whichcan easily be controlled with an unsteady plasma actuator at very low power levels. At higher angles ofattack such as take-off and landing, transition to turbulence may occur somewhere before the ramp due toadverse pressure gradients, so the flow approaching the ramp could be turbulent. Thus plasma actuators forturbulent separation control are needed for all the possible flight regimes.
Plasma actuators have been under development for some time at the University of Notre Dame in theCenter for Flow Physics and Control.2 Most of the applications have focused on laminar separation control,such as leading-edge separation control on wing sections (“plasma slats”),3 control of dynamic stall onoscillating airfoils related to helicopter rotors,4, 5 and separation control for low-pressure turbine blades.6, 7
For these, optimum frequency periodic disturbances generated by the plasma actuator successfully suppressedor delayed the flow separation. Instability mechanisms sometimes plays a role in this process, but it is notclear how well these approaches work when the approaching flow is turbulent. The object of the work
∗Ph.D. Candidate.†Clark Chair Professor, Associate Fellow AIAA.‡Senior Member, AIAA.
1 of 16
American Institute of Aeronautics and Astronautics Paper 2007-0935
Covered Electrode
ExposedElectrode
SubstrateDielectricAC Voltage Source
FB
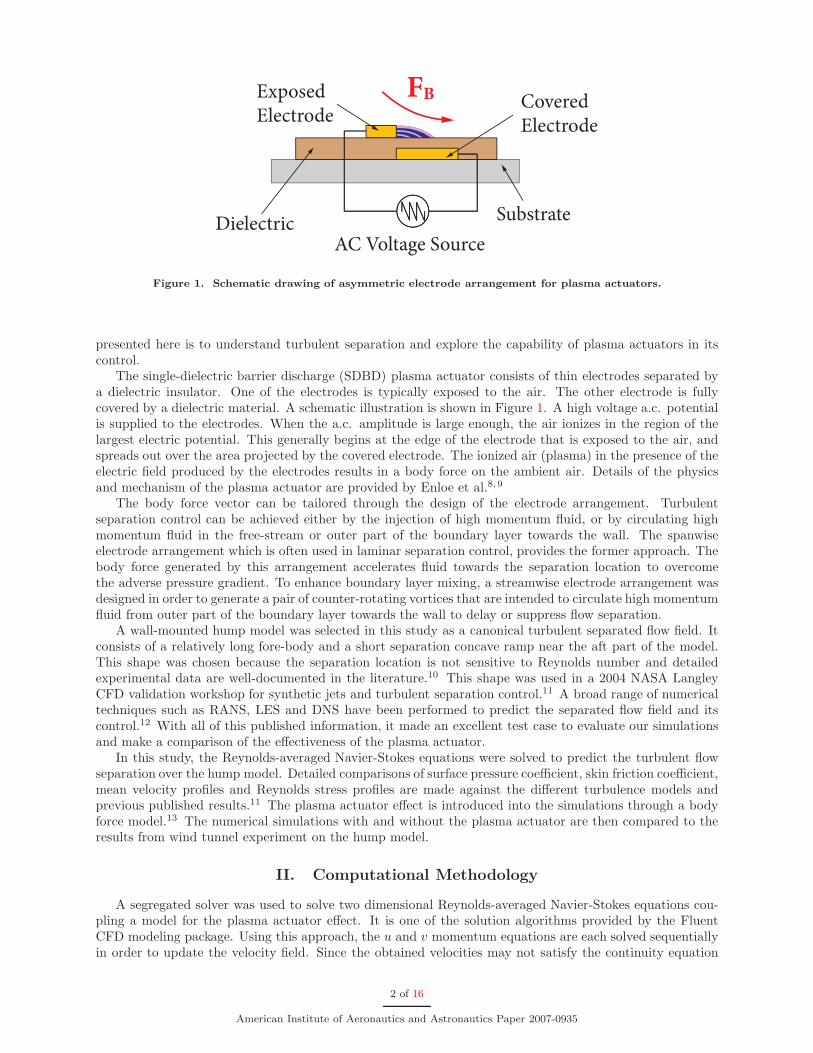
Figure 1. Schematic drawing of asymmetric electrode arrangement for plasma actuators.
presented here is to understand turbulent separation and explore the capability of plasma actuators in itscontrol.
The single-dielectric barrier discharge (SDBD) plasma actuator consists of thin electrodes separated bya dielectric insulator. One of the electrodes is typically exposed to the air. The other electrode is fullycovered by a dielectric material. A schematic illustration is shown in Figure 1. A high voltage a.c. potentialis supplied to the electrodes. When the a.c. amplitude is large enough, the air ionizes in the region of thelargest electric potential. This generally begins at the edge of the electrode that is exposed to the air, andspreads out over the area projected by the covered electrode. The ionized air (plasma) in the presence of theelectric field produced by the electrodes results in a body force on the ambient air. Details of the physicsand mechanism of the plasma actuator are provided by Enloe et al.8, 9
The body force vector can be tailored through the design of the electrode arrangement. Turbulentseparation control can be achieved either by the injection of high momentum fluid, or by circulating highmomentum fluid in the free-stream or outer part of the boundary layer towards the wall. The spanwiseelectrode arrangement which is often used in laminar separation control, provides the former approach. Thebody force generated by this arrangement accelerates fluid towards the separation location to overcomethe adverse pressure gradient. To enhance boundary layer mixing, a streamwise electrode arrangement wasdesigned in order to generate a pair of counter-rotating vortices that are intended to circulate high momentumfluid from outer part of the boundary layer towards the wall to delay or suppress flow separation.
A wall-mounted hump model was selected in this study as a canonical turbulent separated flow field. Itconsists of a relatively long fore-body and a short separation concave ramp near the aft part of the model.This shape was chosen because the separation location is not sensitive to Reynolds number and detailedexperimental data are well-documented in the literature.10 This shape was used in a 2004 NASA LangleyCFD validation workshop for synthetic jets and turbulent separation control.11 A broad range of numericaltechniques such as RANS, LES and DNS have been performed to predict the separated flow field and itscontrol.12 With all of this published information, it made an excellent test case to evaluate our simulationsand make a comparison of the effectiveness of the plasma actuator.
In this study, the Reynolds-averaged Navier-Stokes equations were solved to predict the turbulent flowseparation over the hump model. Detailed comparisons of surface pressure coefficient, skin friction coefficient,mean velocity profiles and Reynolds stress profiles are made against the different turbulence models andprevious published results.11 The plasma actuator effect is introduced into the simulations through a bodyforce model.13 The numerical simulations with and without the plasma actuator are then compared to theresults from wind tunnel experiment on the hump model.
II. Computational Methodology
A segregated solver was used to solve two dimensional Reynolds-averaged Navier-Stokes equations cou-pling a model for the plasma actuator effect. It is one of the solution algorithms provided by the FluentCFD modeling package. Using this approach, the u and v momentum equations are each solved sequentiallyin order to update the velocity field. Since the obtained velocities may not satisfy the continuity equation
2 of 16
American Institute of Aeronautics and Astronautics Paper 2007-0935
Velocity Inlet BCs at x/c = -6.39
pback
/pref
=0.99962 at x/c = 4
Solid Wall Plasma Actuator
at x/c = 0.66
(a)
(b)
Flow
x
y
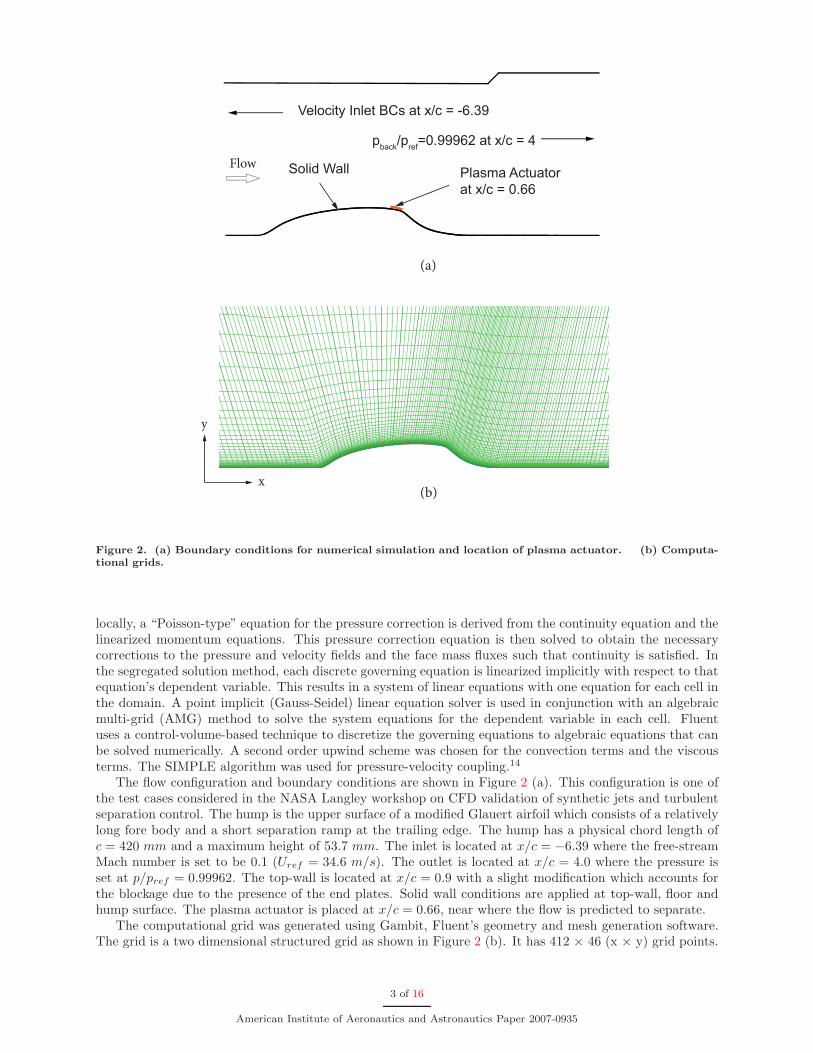
Figure 2. (a) Boundary conditions for numerical simulation and location of plasma actuator. (b) Computa-tional grids.
locally, a “Poisson-type” equation for the pressure correction is derived from the continuity equation and thelinearized momentum equations. This pressure correction equation is then solved to obtain the necessarycorrections to the pressure and velocity fields and the face mass fluxes such that continuity is satisfied. Inthe segregated solution method, each discrete governing equation is linearized implicitly with respect to thatequation’s dependent variable. This results in a system of linear equations with one equation for each cell inthe domain. A point implicit (Gauss-Seidel) linear equation solver is used in conjunction with an algebraicmulti-grid (AMG) method to solve the system equations for the dependent variable in each cell. Fluentuses a control-volume-based technique to discretize the governing equations to algebraic equations that canbe solved numerically. A second order upwind scheme was chosen for the convection terms and the viscousterms. The SIMPLE algorithm was used for pressure-velocity coupling.14
The flow configuration and boundary conditions are shown in Figure 2 (a). This configuration is one ofthe test cases considered in the NASA Langley workshop on CFD validation of synthetic jets and turbulentseparation control. The hump is the upper surface of a modified Glauert airfoil which consists of a relativelylong fore body and a short separation ramp at the trailing edge. The hump has a physical chord length ofc = 420 mm and a maximum height of 53.7 mm. The inlet is located at x/c = −6.39 where the free-streamMach number is set to be 0.1 (Uref = 34.6 m/s). The outlet is located at x/c = 4.0 where the pressure isset at p/pref = 0.99962. The top-wall is located at x/c = 0.9 with a slight modification which accounts forthe blockage due to the presence of the end plates. Solid wall conditions are applied at top-wall, floor andhump surface. The plasma actuator is placed at x/c = 0.66, near where the flow is predicted to separate.
The computational grid was generated using Gambit, Fluent’s geometry and mesh generation software.The grid is a two dimensional structured grid as shown in Figure 2 (b). It has 412 × 46 (x × y) grid points.
3 of 16
American Institute of Aeronautics and Astronautics Paper 2007-0935
Grid dependence was carried out in earlier study, solution no longer changed with further grid refinement.Based on this study, the mesh is believed to have sufficient resolution to capture the features of flow fieldsover the hump.
In order to simulate the plasma actuator effect, a body force model was created.13 The body force pervolume of plasma is a vector, given as
~FB =(
−ǫo
λD
φ)
~E (1)
where ǫo is the permittivity of free space (8.854 × 10⁻¹²F/m), λD is the Debye length, φ is the electric
potential, and ~E is the electric field vector, where
~E = −~∇φ (2)
The Debye length is the characteristic length for electrostatic shielding in a plasma. It varies with plasmadensity and temperature as
1
λ2D
=e2no
ǫo
( 1
kTi
+1
kTe
)
(3)
where kTi and kTe are the ion and electron temperature, no is the plasma density, and e is the elementarycharge.
The electrostatic potential φ is given in the following equation, which is derived from one of Maxwellequations.
∇(ǫ∇φ) = s(x, y)1
λD
φ (4)
where s(x, y) is a rectangular sub-domain in the air over the plasma actuator that is 1 at the intersection ofthe exposed and covered electrode and decrease exponentially to 0 at the downstream edge of the coveredelectrode and 0 over the exposed electrode.
The solution of the spatial distribution for the voltage potential is substituted into Eq 1 and Eq 2 toobtain the spatial body force, ~FB. This added body force is applied to the computational grid points atthe location of the actuator in the computational domain. For the steady actuator effect, the body force isconstant at very iteration. For the unsteady actuator effect, the unsteady period during which the actuatoris on and off is discretized into the time steps.
III. Numerical Results
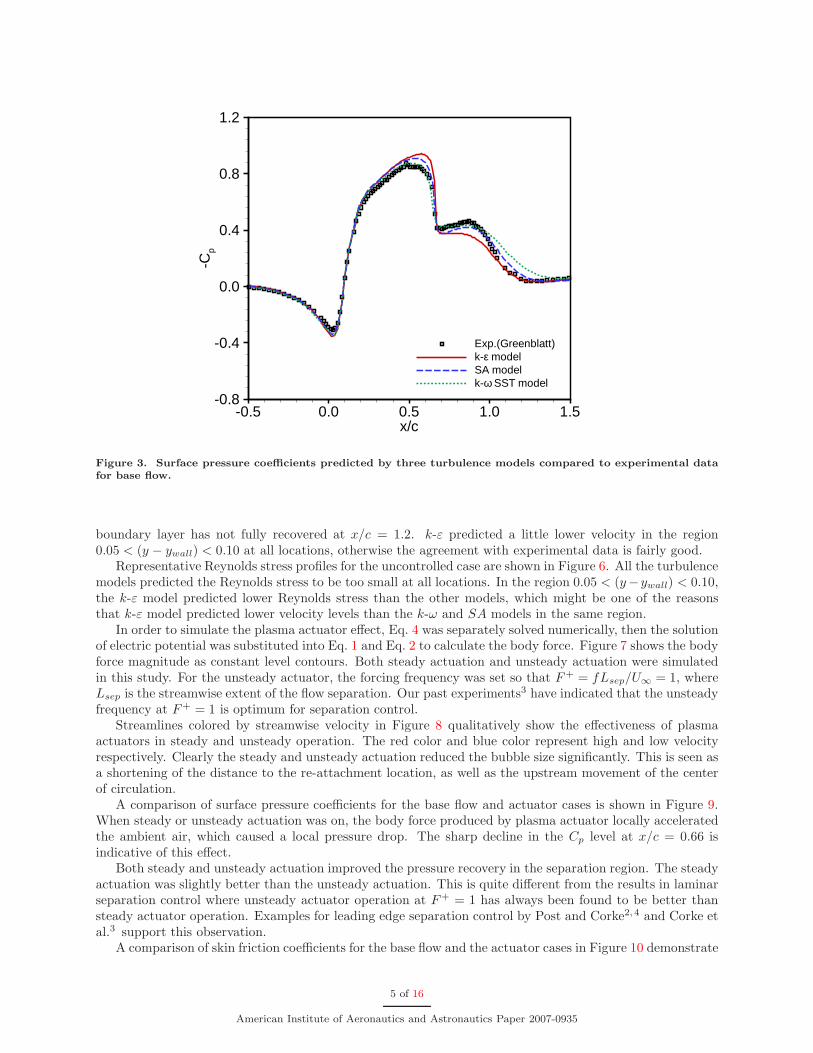
The surface pressure coefficients obtained from the simulations compared to the experimental results ofGreenblatt et al.10 are shown in Figure 3. Basically, the surface pressure coefficient reflects the overallfeatures of the flow field. The flow decelerates when approaching the hump’s leading-edge. Immediatelydownstream of the leading-edge, the flow accelerates up to mid-chord region due to a favorable pressuregradient. Afterwards the sharp drop in the −Cp over the hump near x/c = 0.66 indicates a flow separation.The flow remains separated over the concave ramp and re-attaches downstream of the trailing-edge. k-εmodel , SST k-ω model and SA model were used in the simulations for the uncontrolled case. In the regionof 0.4 < x/c < 0.66, only SST k-ω model agree with the experimental results very well. The other twomodels predicted a slightly lower pressure. All the turbulence models slightly miss the pressure level in theseparation region. Otherwise the general features are consistent with the experimental results.
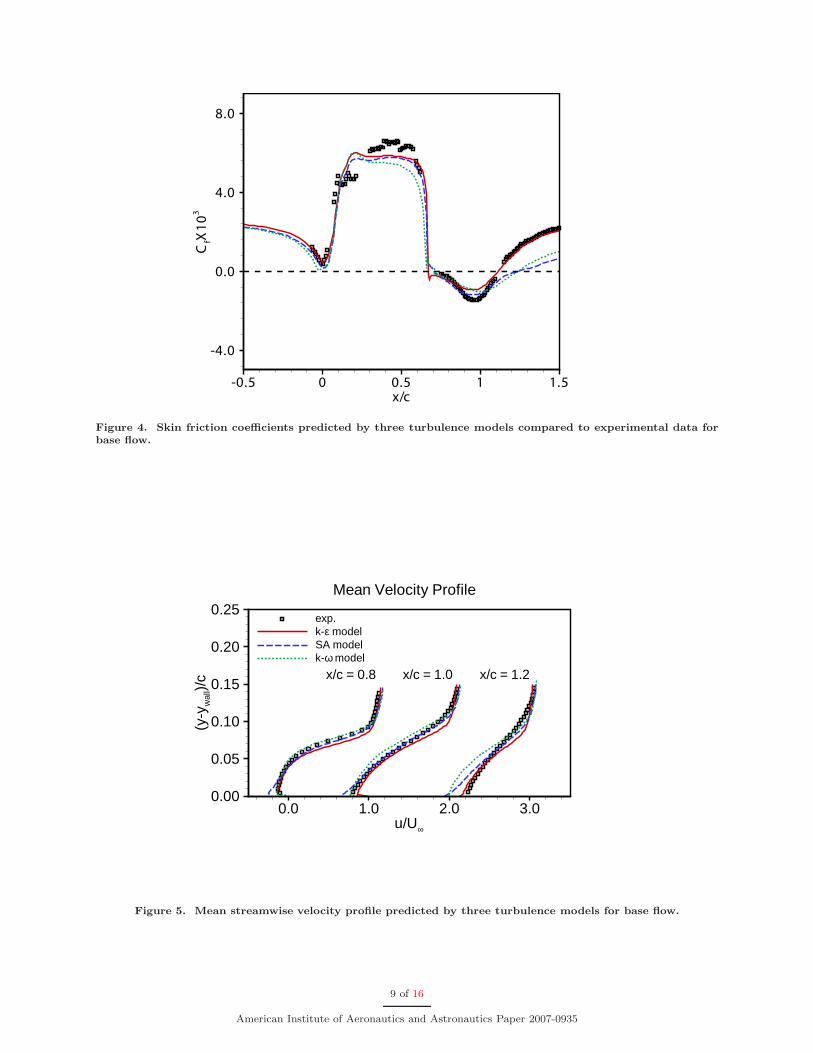
Skin friction coefficients are shown in Figure 4. The horizontal dash line represents Cf = 0, which providesthe border between the separated and re-attached flow. The k-ε model shows a favorable agreement withexperimental data over the whole hump, thus the location of re-attachment and bubble size obtained fromk-ε model are more accurate than the others. All three turbulence models predicted the separation pointaccurately.
Mean velocity profiles were extracted from the simulation results at three typical locations: x/c = 0.8,x/c = 1.0 and x/c = 1.2. x/c = 0.8 and x/c = 1.0 locate inside the separation bubble and x/c = 1.2locates downstream of the re-attachment location. Mean velocity profiles at these representative locationsare compared with experimental data for the uncontrolled case in Figure 5. Velocity profiles at x/c = 0.8and x/c = 1.0 were predicted reasonably well, but SST k-ω model and SA model compared poorly withexperimental data at x/c = 1.2. One of the possible reasons is that both models predict a longer separationbubble, thus the distance between the re-attachment and measurement location becomes shorter and the
4 of 16
American Institute of Aeronautics and Astronautics Paper 2007-0935
x/c
-Cp
-0.5 0.0 0.5 1.0 1.5-0.8
-0.4
0.0
0.4
0.8
1.2
Exp.(Greenblatt)k-ε modelSA modelk-ω SST model
Figure 3. Surface pressure coefficients predicted by three turbulence models compared to experimental datafor base flow.
boundary layer has not fully recovered at x/c = 1.2. k-ε predicted a little lower velocity in the region0.05 < (y − ywall) < 0.10 at all locations, otherwise the agreement with experimental data is fairly good.
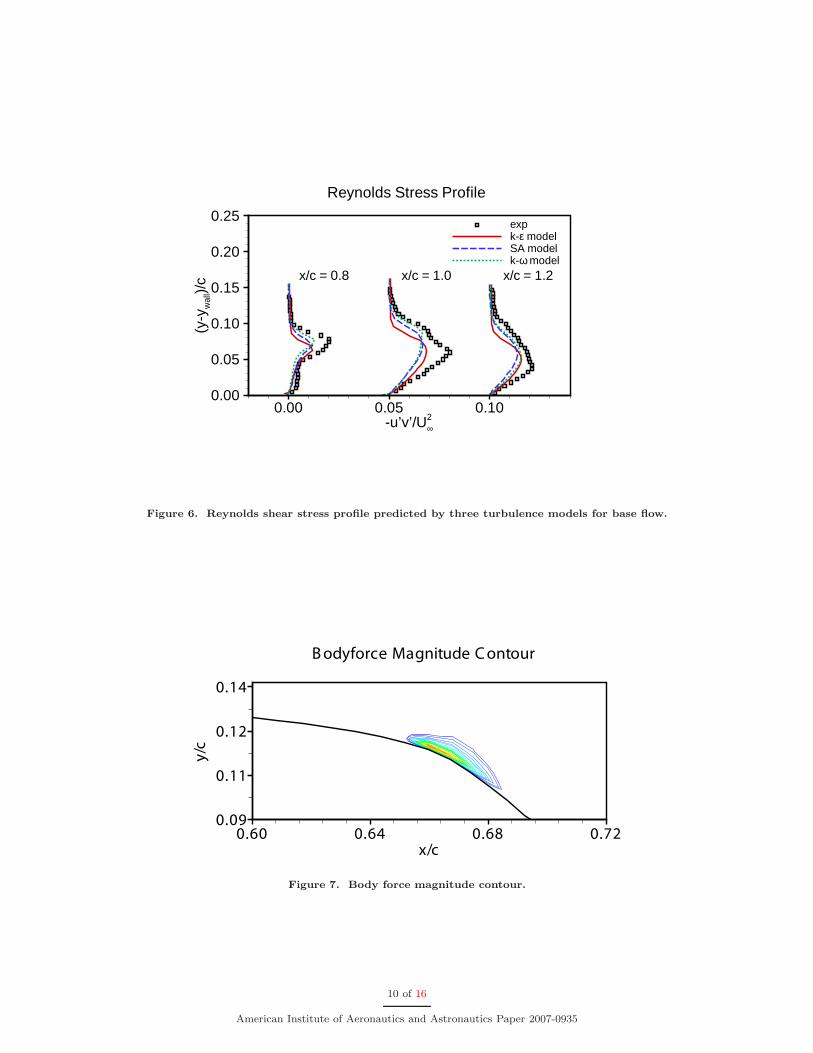
Representative Reynolds stress profiles for the uncontrolled case are shown in Figure 6. All the turbulencemodels predicted the Reynolds stress to be too small at all locations. In the region 0.05 < (y−ywall) < 0.10,the k-ε model predicted lower Reynolds stress than the other models, which might be one of the reasonsthat k-ε model predicted lower velocity levels than the k-ω and SA models in the same region.
In order to simulate the plasma actuator effect, Eq. 4 was separately solved numerically, then the solutionof electric potential was substituted into Eq. 1 and Eq. 2 to calculate the body force. Figure 7 shows the bodyforce magnitude as constant level contours. Both steady actuation and unsteady actuation were simulatedin this study. For the unsteady actuator, the forcing frequency was set so that F+ = fLsep/U∞ = 1, whereLsep is the streamwise extent of the flow separation. Our past experiments3 have indicated that the unsteadyfrequency at F+ = 1 is optimum for separation control.
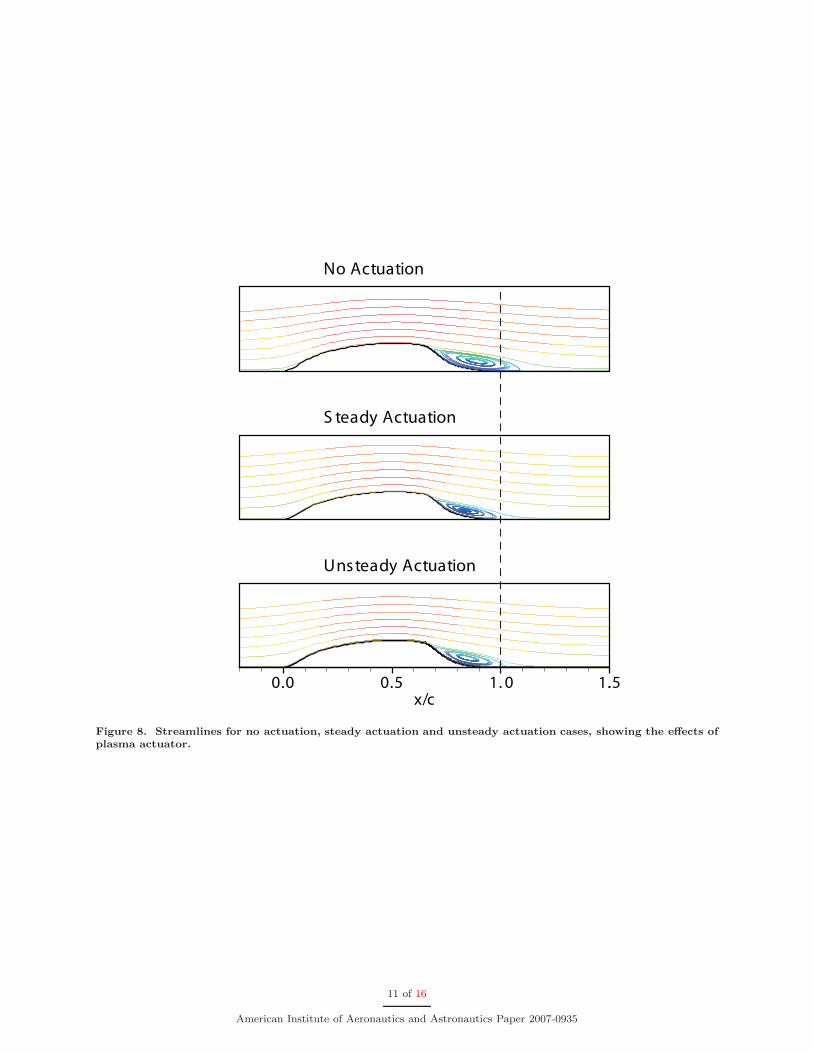
Streamlines colored by streamwise velocity in Figure 8 qualitatively show the effectiveness of plasmaactuators in steady and unsteady operation. The red color and blue color represent high and low velocityrespectively. Clearly the steady and unsteady actuation reduced the bubble size significantly. This is seen asa shortening of the distance to the re-attachment location, as well as the upstream movement of the centerof circulation.
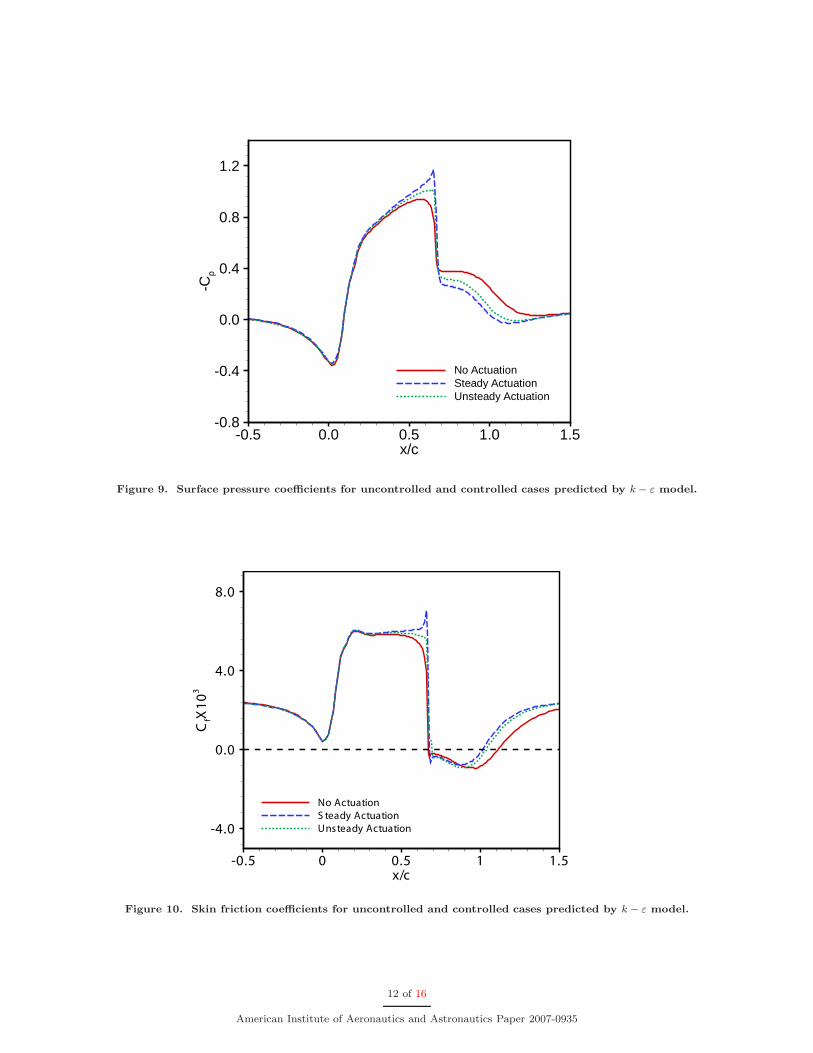
A comparison of surface pressure coefficients for the base flow and actuator cases is shown in Figure 9.When steady or unsteady actuation was on, the body force produced by plasma actuator locally acceleratedthe ambient air, which caused a local pressure drop. The sharp decline in the Cp level at x/c = 0.66 isindicative of this effect.
Both steady and unsteady actuation improved the pressure recovery in the separation region. The steadyactuation was slightly better than the unsteady actuation. This is quite different from the results in laminarseparation control where unsteady actuator operation at F+ = 1 has always been found to be better thansteady actuator operation. Examples for leading edge separation control by Post and Corke2, 4 and Corke etal.3 support this observation.
A comparison of skin friction coefficients for the base flow and the actuator cases in Figure 10 demonstrate
5 of 16
American Institute of Aeronautics and Astronautics Paper 2007-0935
the effectiveness of plasma actuator more clearly. Again the horizontal dash line represents Cf = 0, whichdefines the border between the separated and attached flow. The separation locations did not change forthe steady and unsteady actuation while the re-attachment locations moved from x/c = 1.1 to x/c = 1.02and x/c = 1.04 respectively. Consequently the separation bubble reduced in length with the actuator on aspreviously indicated in Figure 8.
IV. Experimental Setup
A. Wind Tunnel and Hump Model
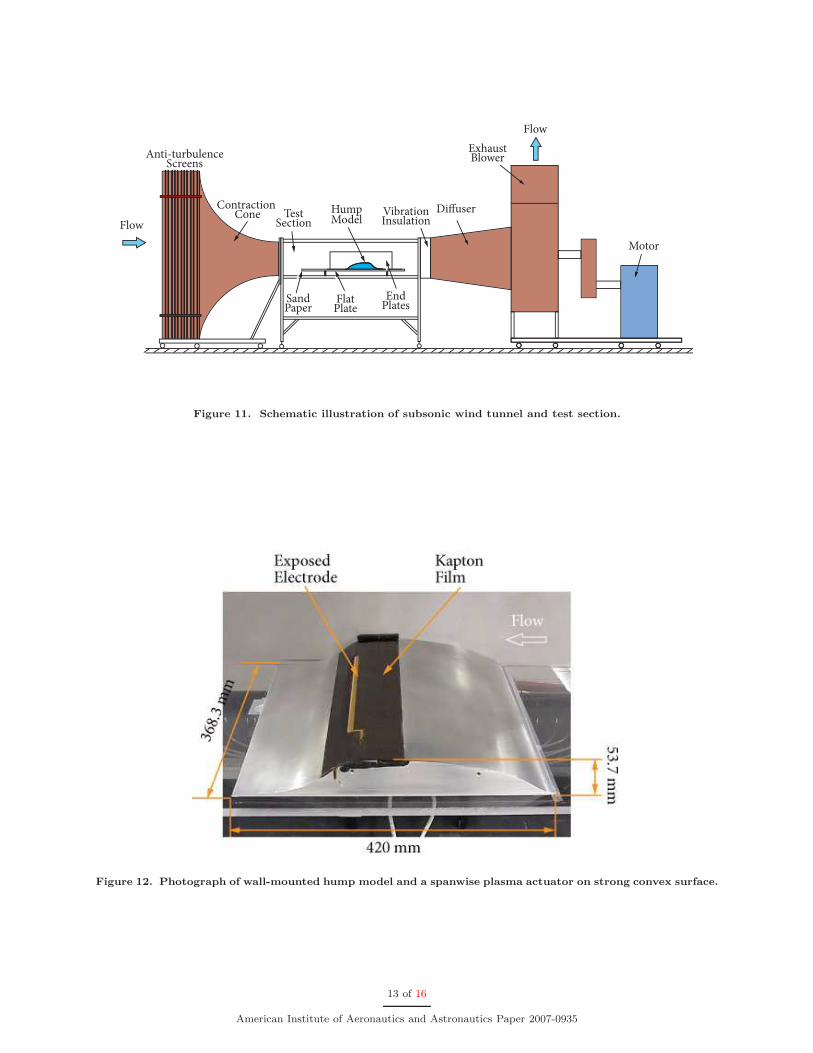
The experiments were conducted in one of the subsonic wind tunnels in the University of Notre Dame Centerfor Flow Physics and Control (FlowPAC) in the Hessert Laboratory . The facility is an open-return blow-down wind tunnel with a 40.64 cm (16 in)wide by 40.64 cm (16 in) high by 182.88 cm (6 ft) long testsection. The tunnel consists of a removable inlet having a series of 12 screens followed by a 24:1 contractionthat attaches to the test section. The test section is equipped with a clear Plexiglas side-wall that allowsoptical access to view the model for flow visualization. The back wall of the test section has a removablepanel to allow access into the test section. A schematic illustration of the subsonic wind tunnel and testsection is shown in Figure 11.
A 38.1 cm wide by 162.56 cm long flat Plexiglas plate was mounted 10.16 cm above the floor of the testsection, so the test section height became 30.48 cm. The hump model was mounted on the top of the flatplate. The flat plate extended 82 cm upstream of the leading-edge and 42 cm downstream of the trailing-edgeof the hump model. A sand paper strip was attached to the elliptical leading-edge of flat plate in order totrip the flow and achieve a fully-developed turbulent boundary layer downstream. Two end-mounted plateswere designed to produce two dimensional flow field over the hump. Each end plate was 82 cm long and 23.5cm high.
A photograph of the hump model is show in Figure 12. It has a 42 cm chord and a 35.6 cm span.Its maximum thickness is 5.37 cm. The model was precisely machined from an aluminum plate using anumerical-controlled machine. It was equipped with 48 center-span static pressure ports. A scanning valvewas used to direct the static pressure port outputs to a differential pressure transducer.
V. Experimental Results
Both spanwise and streamwise plasma actuator configurations were investigated in this study. Thespanwise plasma actuator configuration is the one shown in Figure 12. The copper electrodes were separatedby three layers of 5-mil (dark colored) Kapton film. The edges of the electrodes were aligned in the spanwisedirection. The electrodes were made from 0.0254 mm thick copper foil tape. They were overlapped by asmall amount (of the order of 1 mm), in order to ensure a uniform plasma in the full spanwise direction. Thejunction of the exposed electrode and the covered electrode was placed precisely on the separation location(x/c = 66%).
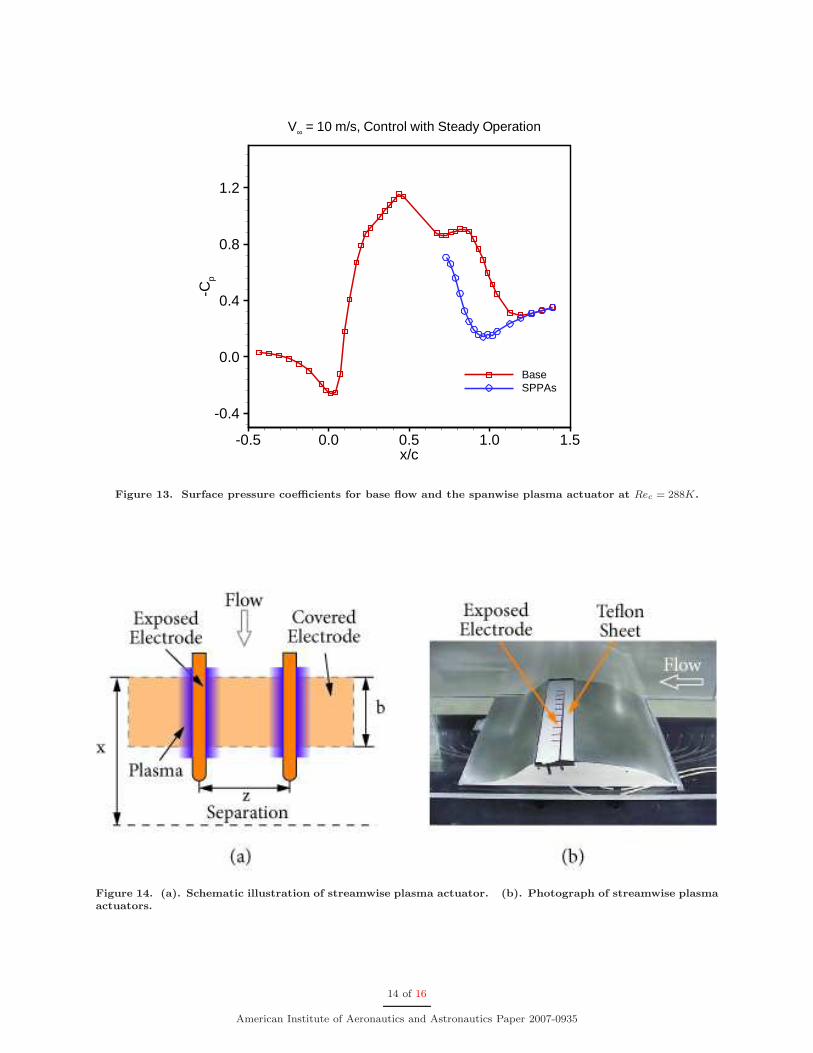
The experiments were conducted at a 10 m/s free-stream speed. This gave a chord Reynolds number of288K. The actuator ran in steady operation. The frequency of the a.c. voltage supplied to the electrodeswas approximately 1.3 kHz. The precise frequency was tuned to minimize the overall power in the actuatorelectronics. The a.c. voltage amplitude to the electrodes was 36 kVp−p.
The results are presented in Figure 13. The red square symbols represent the base flow, and the blue circlesymbols represent the steady plasma actuator case. The spanwise plasma actuator was found to improvethe separation recovery significantly.
The streamwise plasma actuator configuration was also investigated. The schematic illustration andphotograph of the streamwise plasma actuators are shown in Figure 14 (a) and (b). The covered electroderan across most of the span of the hump model. The width (b) of the covered electrode was 0.5 in. Itwas positioned at 1.75 in upstream of separation location (x = 1.75 in). Several spacings (z) between theexposed electrodes were studied. These ranged from 0.5 in to 3.0 in. A 0.25 in thick white-colored Teflonsheet (seen in Figure 14) was used to separate the exposed electrodes and the covered electrode.
The streamwise plasma actuator was expected to generate streamwise-oriented counter-rotating vorticessimilar to those produced by passive delta-wing vortex generators. Flow visualization was used to verify thisidea.
6 of 16
American Institute of Aeronautics and Astronautics Paper 2007-0935
The flow visualization photograph in Figure 15 (a) was taken when the laser sheet and smoke sheet werein the same plane. There were two large vortices generated by the outer edges of plasma actuators. Inaddition, two vortices were generated by the inner edges. Because the inner edges were close, the innervortices interacted with each other, and rolled up and formed two smaller vortices which are not as clearlyseen in the photograph.
The photograph in Figure 15 (b) was taken when the laser sheet was raised above the smoke sheet. Withthis arrangement, three long smoke streaks were captured. These streaks are due to the rotating vorticeswhich brought the smoke from the lower level up to the higher level of the laser light sheet.
The spacing between the exposed electrodes was found to control the size of the generated streamwisevortices. We next determined if an optimum spacing existed for turbulent separation control.
The effect of the spacing of the streamwise-oriented electrodes of the plasma actuator was investigatedexperimentally on the hump model. The result is shown in Figure 16. For this the spacing was varied from0.5 to 3.0 inches. The free-stream speed was the same as the other experiments, namely 10 m/s. In thesecases the frequency of the a.c. voltage supplied to the electrodes was approximately 2.3 kHz, with theprecise frequency again tuned to minimize the overall power. The a.c. voltage amplitude to the electrodeswas 48 kVp−p.
Figure 16 shows the change in the integrated static pressure in the separated region over the humpmodel as a function of the spacing between the streamwise-oriented electrodes. The results indicate a clearoptimum at a spacing of approximately 1.5 inches. It is expected that the optimum spacing scales with theapproaching boundary layer thickness. Future investigations will verify this.
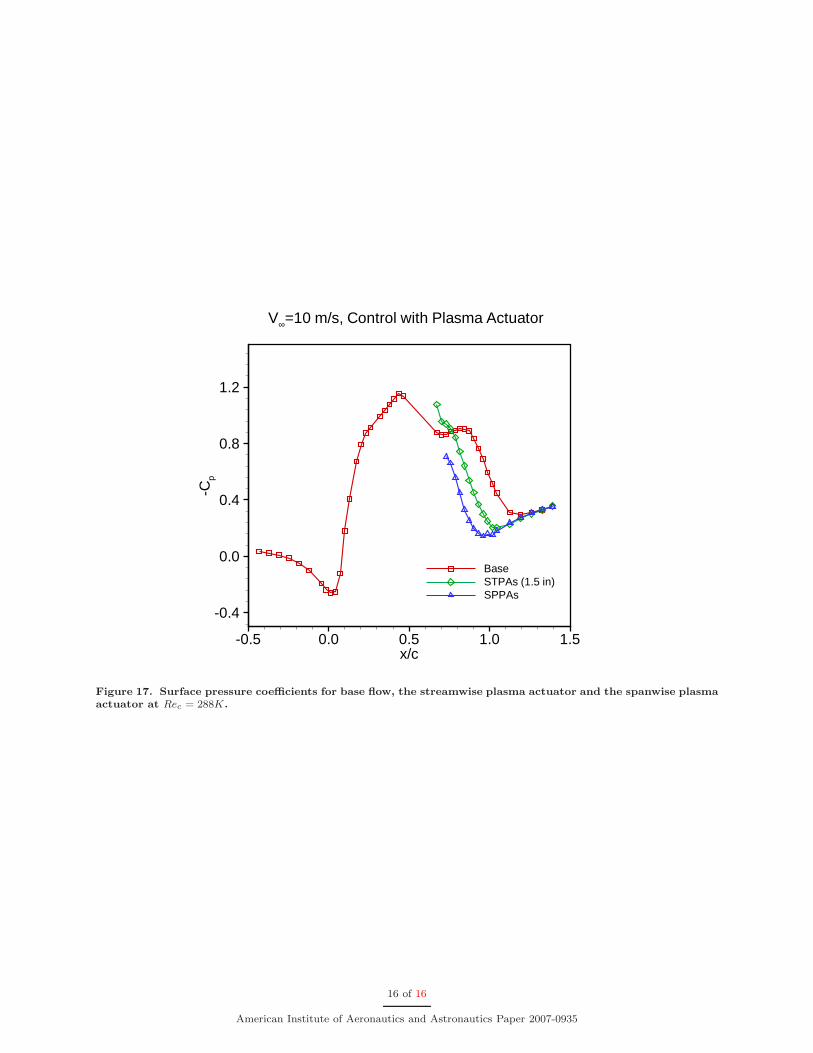
The surface pressure coefficient distribution over the concave portion of the hump model for the optimum1.5 in spacing is presented in Figure 17. This is labeled as STPA(1.5in.) in the figure. We observe that thestreamwise-oriented plasma actuators improved the pressure recovery in the separation region, moving there-attachment location upstream and reducing the size of the separation bubble. Also shown for reference inFigure 17 is the pressure coefficient distribution for the spanwise oriented plasma actuator. This is labeledSPPAs. This was found to produce a better pressure recovery than the streamwise-oriented actuator andtherefore is still preferred for controlling turbulent flow separation.
VI. Conclusions
Numerical simulations using a Reynolds-averaged Navier-Stokes solver were used to predict the flow fieldover a wall-mounted hump model. A k-ε turbulence model predicted surface pressure and skin frictioncoefficient distributions, velocity profiles and Reynolds stress profiles in reasonably good agreement withexperimental data. The plasma actuator effect was simulated through a body force model. Results indicatethat plasma actuators are quite capable of turbulent flow separation control.
Experiments were conducted to confirm the simulation results. Both spanwise and streamwise plasmaactuator configurations were investigated at a chord Reynolds number of Rec = 288K. The surface pressurecoefficients demonstrate that both configurations increase the pressure level in the separation region, andsignificantly reduced the size of the separation bubble. For the same conditions, the steady spanwise-orientedplasma actuator performed the best.
The spanwise plasma actuator can be used in either laminar separation control (unsteady operation) orturbulent separation control (steady operation) depending on the state of the flow field. Such a change inoperation is fully electronic without any physical modification of the actuator.
For the streamwise plasma actuator, it can be placed upstream of the separation location unlike thespanwise plasma actuator. Therefore it may be more useful for separated flows in which the separationlocation changes with flight conditions.
The final goal of this work is to incorporate a separation ramp near the trailing-edge of an airfoil so thatit can be manipulated by plasma actuators for flight control. The bench marking of the simulation tools forthe flow field and plasma actuator effect that was presented here is a necessary step in the design of optimumairfoil shapes that exploit this application.
VII. Acknowledgement
The authors are pleased to acknowledge support from Orbital Research Inc. under an SBIR Phase IIContract.
7 of 16
American Institute of Aeronautics and Astronautics Paper 2007-0935
References
1Corke, T., Mertz, B., and Patel, M., “Plasma Flow Control Optimized Airfoil,” AIAA Paper 2006-1208 .2Corke, T. and Post, M., “Overview of Plasma Flow Control: Concepts, Optimization, and Application,” AIAA Paper
2005-0563 .3Corke, T., He, C., and Patel, M., “Plasma flaps and slats: an application of weakly-ionized plasmas as wing flow control
devices,” AIAA Paper 2004-2127 .4Post, M. and Corke, T., “Separation control on high angle of attack airfoil using plasma actuators,” AIAA J., Vol. 42,
No. 11, 2004, pp. 2177, also AIAA Paper 2003-1024.5Post, M. and Corke, T., “Separation control using plasma actuators - atationary and oscillating airfoils,” AIAA Paper
2004-0841 .6Huang, J., Corke, T., and Thomas, F., “Plasma actuators for separation control of low pressure turbine blades,” AIAA
J., Vol. 44, No. 1, 2006, pp. 51.7Huang, J., Corke, T., and Thomas, F., “Unsteady Plasma Actuators for Separation Control of Low Pressure Turbine
Blades,” AIAA J., Vol. 44, No. 7, 2006, pp. 1477.8Enloe, L., McLaughlin, T., VanDyken, R., Kachner, K., Jumper, E., and Corke, T., “Mechanisisms and Response of a
Single Dielectric Barrier Plasma Actuator: Plasma Morphology,” AIAA J., Vol. 42, No. 3, 2004, pp. 589.9Enloe, L., McLaughlin, T., VanDyken, R., Kachner, K., Jumper, E., Corke, T., Post, M., and Haddad, O., “Mechanisisms
and Response of a Single Dielectric Barrier Plasma Actuator: Geometric Effects,” AIAA J., Vol. 42, No. 3, 2004, pp. 585.10Greenblatt, D., Paschal, K., Schaeffler, N., Washburn, A., Harris, J., and Yao, C., “A separation control CFD validation
test case. Part 1: baseline and steady suction,” AIAA Paper 2004-2220 .11Rumsey, C., Gatski, T., Sellers, W., Vatsa, V., and Viken, S., “Summary of the 2004 CFD Validation Workshop on
Synthetic Jets and Turbulent Separation Control,” AIAA Paper 2004-2217 .12You, D., Wang, M., and Moin, P., “Large-Eddy Simulation of Flow over a Wall-Mounted Hump with Separation Control,”
AIAA J., Vol. 44, No. 11, 2006, pp. 2571.13Orlov, D. and Corke, T., “Numerical Simulation of Aerodynamic Plasma Actuator Effects,” AIAA Paper 2005-1083 .14Fluent 6.2 User’s Guide, Fluent Inc., 2005.15Corke, T., Jumper, E., Post, M., Orlov, D., and McLaughlin, T., “Application of Weakly-Ionized Plasma as Wing
Flow-Control Devices,” AIAA Paper 2002-0350 .
8 of 16
American Institute of Aeronautics and Astronautics Paper 2007-0935
x/c
CfX103
-0.5 0 0.5 1 1.5
-4.0
0.0
4.0
8.0
Figure 4. Skin friction coefficients predicted by three turbulence models compared to experimental data forbase flow.
u/U∞
(y-y
wal
l)/c
0.0 1.0 2.0 3.00.00
0.05
0.10
0.15
0.20
0.25exp.k-ε modelSA modelk-ω model
Mean Velocity Profile
x/c = 0.8 x/c = 1.0 x/c = 1.2
Figure 5. Mean streamwise velocity profile predicted by three turbulence models for base flow.
9 of 16
American Institute of Aeronautics and Astronautics Paper 2007-0935
-u’v’/U∞2
(y-y
wal
l)/c
0.00 0.05 0.100.00
0.05
0.10
0.15
0.20
0.25expk-ε modelSA modelk-ω model
Reynolds Stress Profile
x/c = 0.8 x/c = 1.0 x/c = 1.2
Figure 6. Reynolds shear stress profile predicted by three turbulence models for base flow.
x/c
y/c
0.60 0.64 0.68 0.720.09
0.11
0.12
0.14
Bodyforce Magnitude Contour
Figure 7. Body force magnitude contour.
10 of 16
American Institute of Aeronautics and Astronautics Paper 2007-0935
No Actuation
S teady Actuation
x/c0.0 0.5 1. .5
Unsteady Actuation
0 1.
Figure 8. Streamlines for no actuation, steady actuation and unsteady actuation cases, showing the effects ofplasma actuator.
11 of 16
American Institute of Aeronautics and Astronautics Paper 2007-0935
x/c
-Cp
-0.5 0.0 0.5 1.0 1.5-0.8
-0.4
0.0
0.4
0.8
1.2
No ActuationSteady ActuationUnsteady Actuation
Figure 9. Surface pressure coefficients for uncontrolled and controlled cases predicted by k − ε model.
x/c-0.5 0 0.5 1 1.5
-4.0
0.0
4.0
8.0
No Actuation
S teady Actuation
Unsteady Actuation
CfX103
Figure 10. Skin friction coefficients for uncontrolled and controlled cases predicted by k − ε model.
12 of 16
American Institute of Aeronautics and Astronautics Paper 2007-0935
Anti-turbulenceScreens
Contraction Cone Test
SectionVibrationInsulation
Di!user
ExhaustBlower
Motor
Flow
Flow
HumpModel
SandPaper
FlatPlate
EndPlates
Figure 11. Schematic illustration of subsonic wind tunnel and test section.
Figure 12. Photograph of wall-mounted hump model and a spanwise plasma actuator on strong convex surface.
13 of 16
American Institute of Aeronautics and Astronautics Paper 2007-0935
x/c
-Cp
-0.5 0.0 0.5 1.0 1.5
-0.4
0.0
0.4
0.8
1.2
BaseSPPAs
V∞ = 10 m/s, Control with Steady Operation
Figure 13. Surface pressure coefficients for base flow and the spanwise plasma actuator at Rec = 288K.
Figure 14. (a). Schematic illustration of streamwise plasma actuator. (b). Photograph of streamwise plasmaactuators.
14 of 16
American Institute of Aeronautics and Astronautics Paper 2007-0935
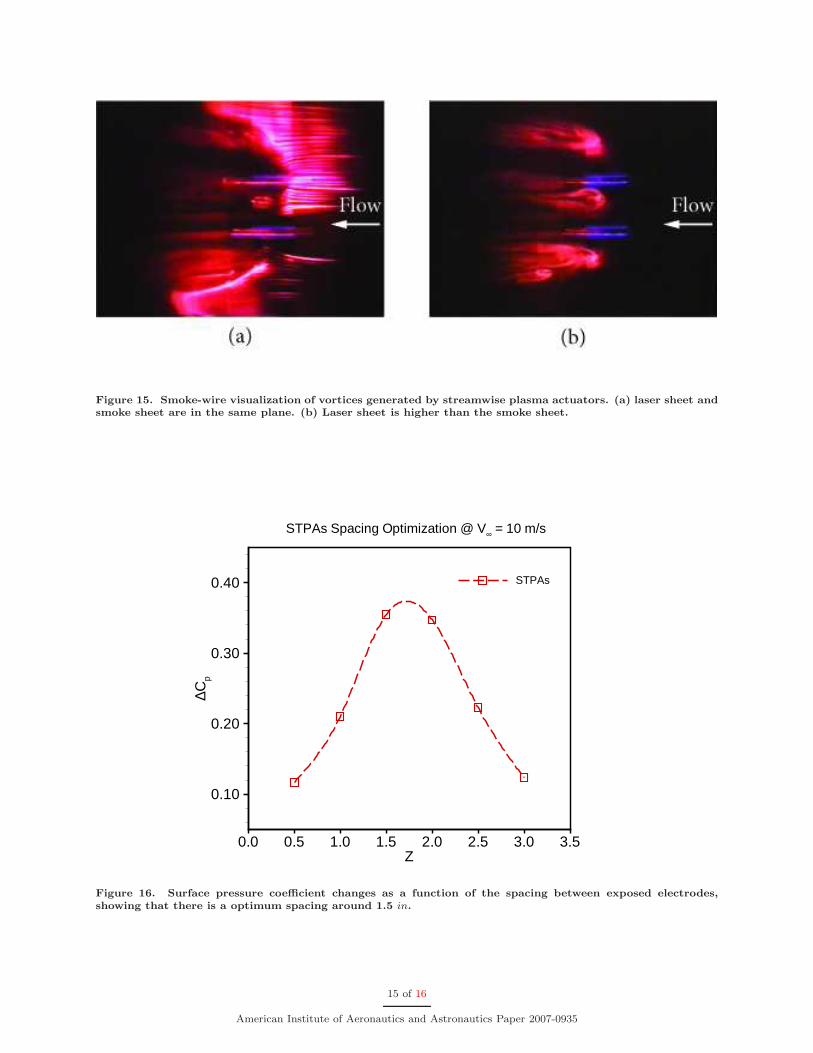
Figure 15. Smoke-wire visualization of vortices generated by streamwise plasma actuators. (a) laser sheet andsmoke sheet are in the same plane. (b) Laser sheet is higher than the smoke sheet.
Z
∆Cp
0.0 0.5 1.0 1.5 2.0 2.5 3.0 3.5
0.10
0.20
0.30
0.40 STPAs
STPAs Spacing Optimization @ V∞ = 10 m/s
Figure 16. Surface pressure coefficient changes as a function of the spacing between exposed electrodes,showing that there is a optimum spacing around 1.5 in.
15 of 16
American Institute of Aeronautics and Astronautics Paper 2007-0935
x/c
-Cp
-0.5 0.0 0.5 1.0 1.5
-0.4
0.0
0.4
0.8
1.2
BaseSTPAs (1.5 in)SPPAs
V∞=10 m/s, Control with Plasma Actuator
Figure 17. Surface pressure coefficients for base flow, the streamwise plasma actuator and the spanwise plasmaactuator at Rec = 288K.
16 of 16
American Institute of Aeronautics and Astronautics Paper 2007-0935