Embed Size (px)
Citation preview
458
Fisheries Reference Points(Single- and multi-species)
Fish 458, Lecture 23
458
(Fisheries) Reference Points
Quantities that provide guidelines for targets and limits on harvesting
(are usually fishing mortality rates or biomasses).
458
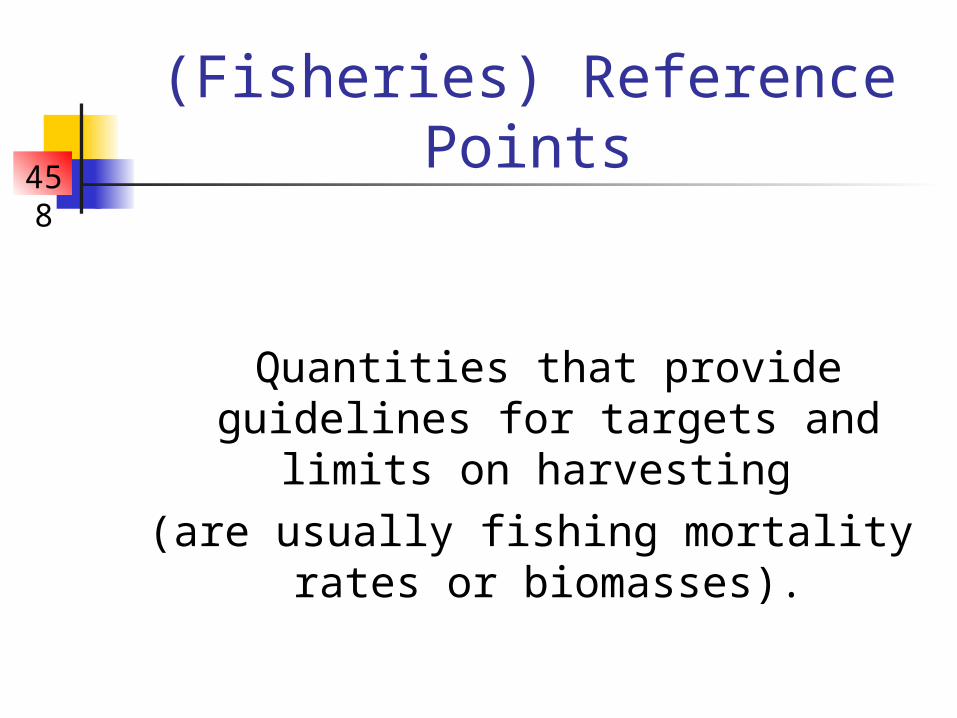
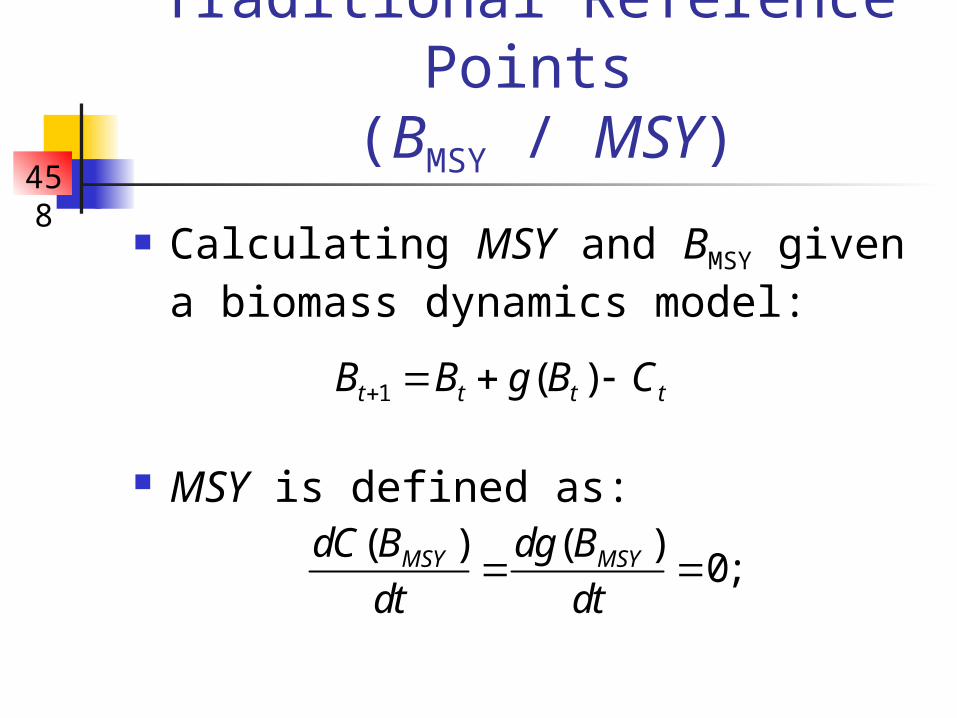
Traditional Reference Points
(BMSY / MSY)
BMSY – the biomass at which Maximum Sustainable Yield, MSY, is achieved.
0
5
10
15
20
25
30
0 20 40 60 80 100
Biomass
Yie
ld
BMSY
MSY
458
Traditional Reference Points
(BMSY / MSY)
Calculating MSY and BMSY given a biomass dynamics model:
MSY is defined as:
1 ( )t t t tB B g B C
( ) ( )0;MSY MSYdC B dg B
dt dt
458
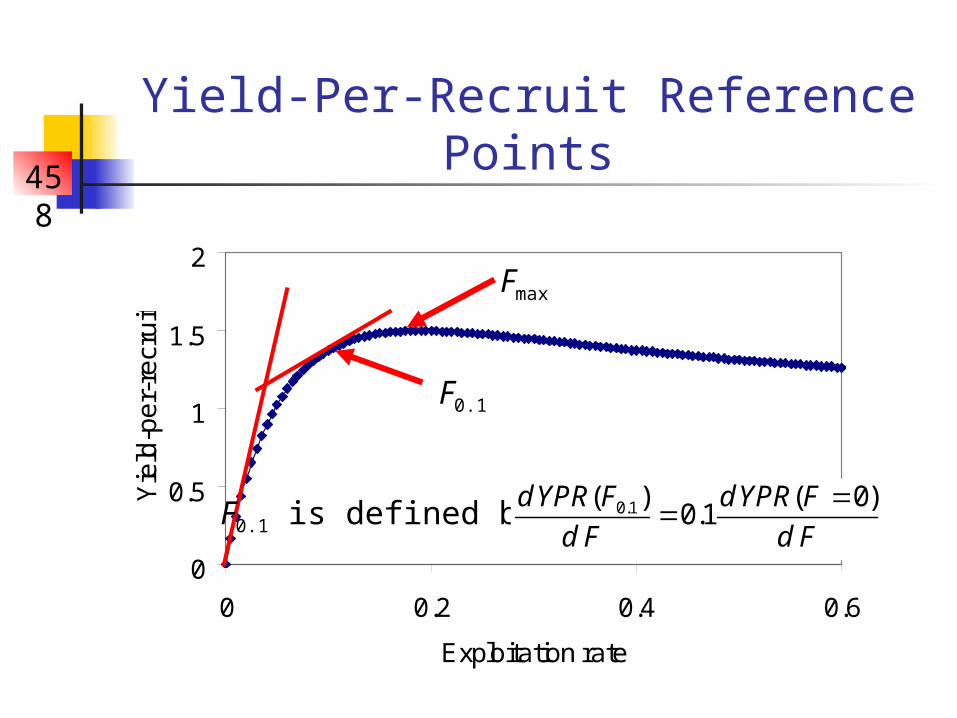
Yield-Per-Recruit Reference Points
0
0.5
1
1.5
2
0 0.2 0.4 0.6
Exploitation rate
Yie
ld-p
er-
recr
uit
Fmax
F0.1 is defined by:
F0.1
0.1( ) ( 0)0.1
d YPR F d YPR F
d F d F
458
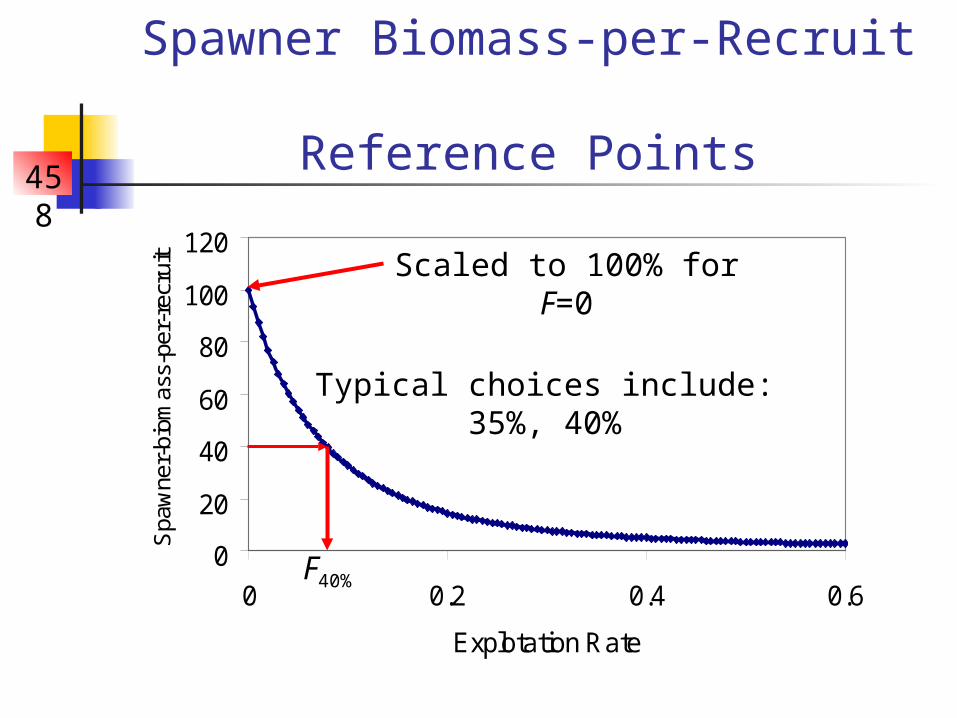
Spawner Biomass-per-Recruit Reference Points
0
20
40
60
80
100
120
0 0.2 0.4 0.6
Explotation Rate
Spa
wne
r-bi
omas
s-pe
r-re
crui
t Scaled to 100% for F=0
F40%
Typical choices include: 35%, 40%
458
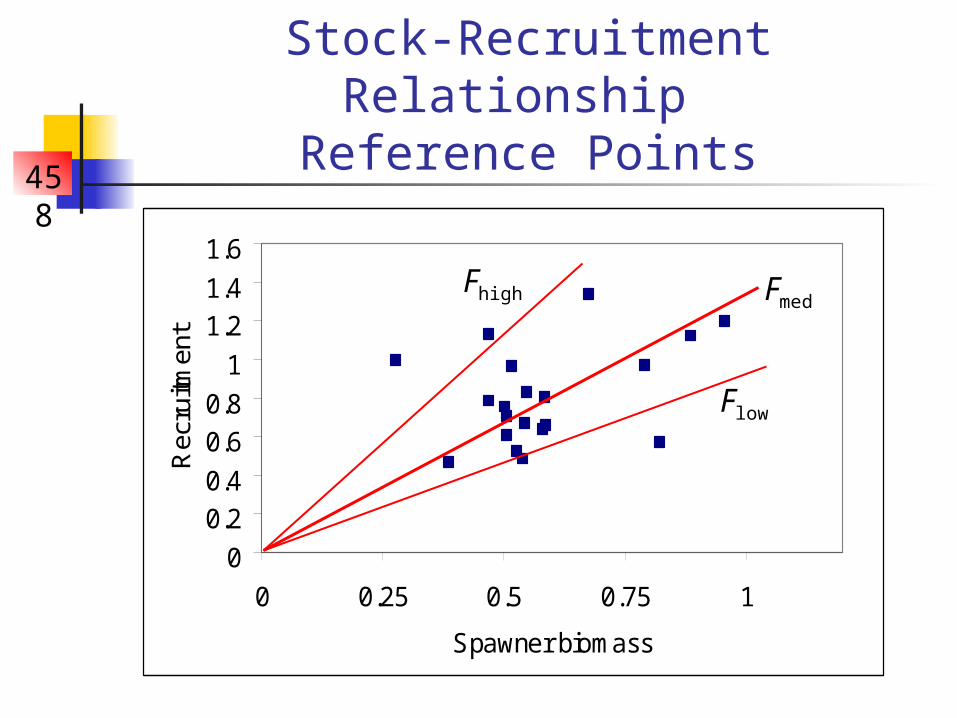
Stock-Recruitment Relationship Reference Points
0
0.20.4
0.60.8
1
1.21.4
1.6
0 0.25 0.5 0.75 1
Spawner biomass
Rec
ruitm
ent
Fhigh
Flow
Fmed
458
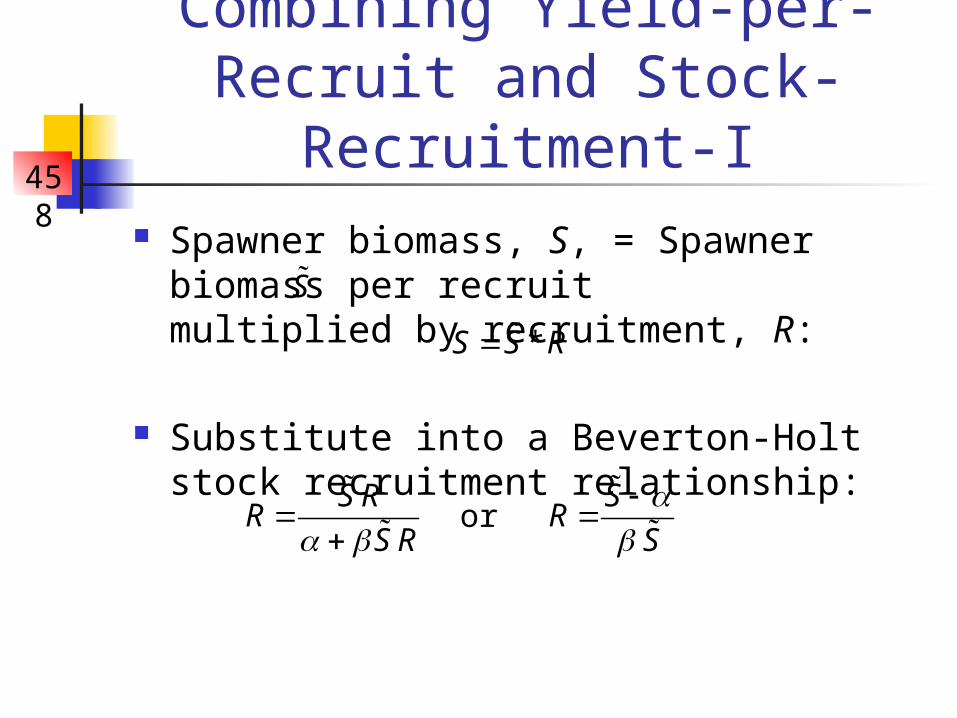
Combining Yield-per-Recruit and Stock-
Recruitment-I Spawner biomass, S, = Spawner
biomass per recruit multiplied by recruitment, R:
Substitute into a Beverton-Holt stock recruitment relationship:
*S S R S
S RR
S R
or
SR
S
458
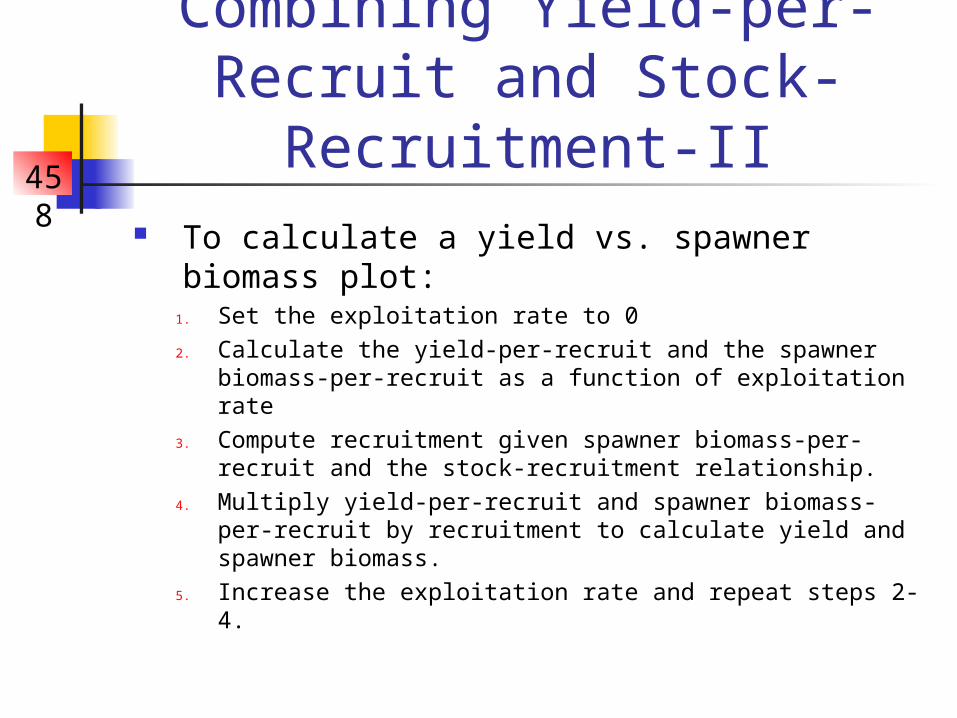
Combining Yield-per-Recruit and Stock-
Recruitment-II To calculate a yield vs. spawner
biomass plot:1. Set the exploitation rate to 02. Calculate the yield-per-recruit and the spawner
biomass-per-recruit as a function of exploitation rate3. Compute recruitment given spawner biomass-per-
recruit and the stock-recruitment relationship.4. Multiply yield-per-recruit and spawner biomass-per-
recruit by recruitment to calculate yield and spawner biomass.
5. Increase the exploitation rate and repeat steps 2-4.
458
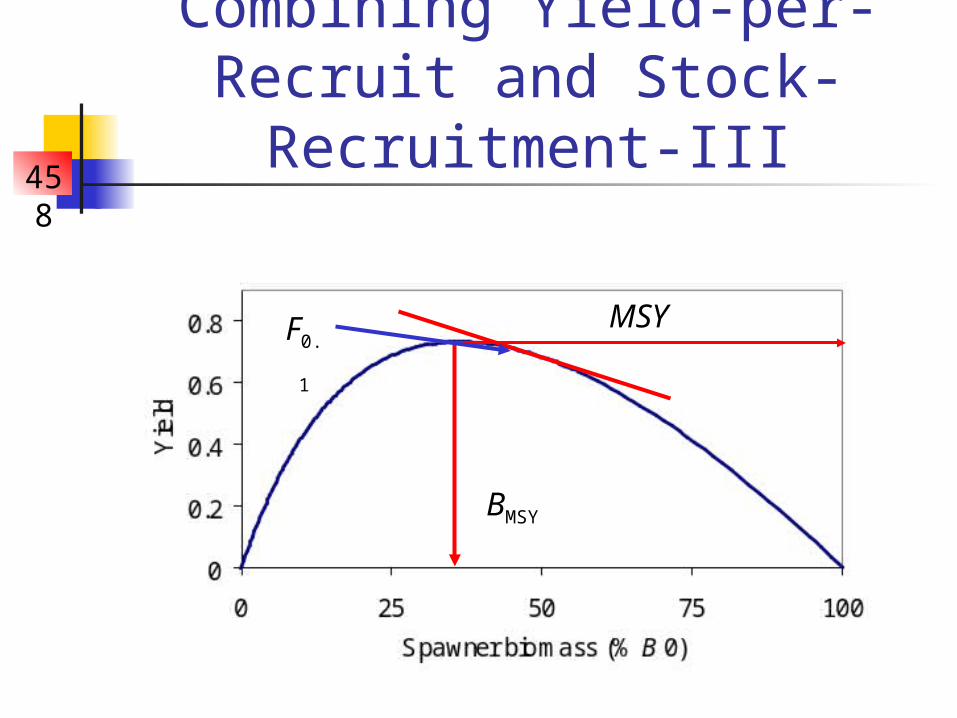
Combining Yield-per-Recruit and Stock-
Recruitment-III
BMSY
MSYF0.
1
458
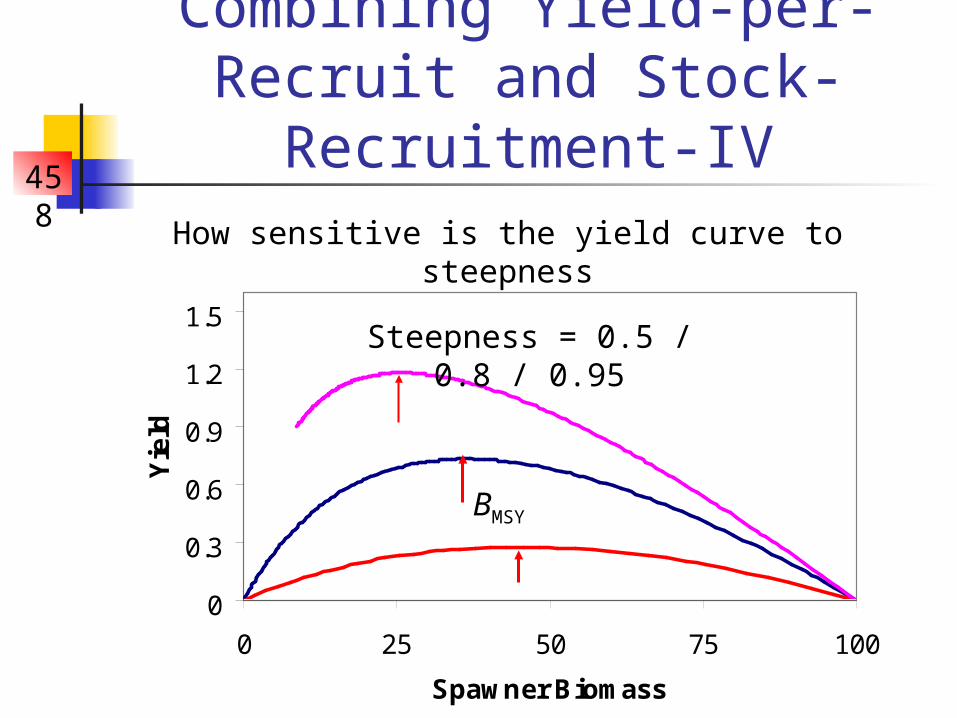
Combining Yield-per-Recruit and Stock-
Recruitment-IV
0
0.3
0.6
0.9
1.2
1.5
0 25 50 75 100
Spawner Biomass
Yie
ld
Steepness = 0.5 / 0.8 / 0.95
How sensitive is the yield curve to steepness
BMSY
458
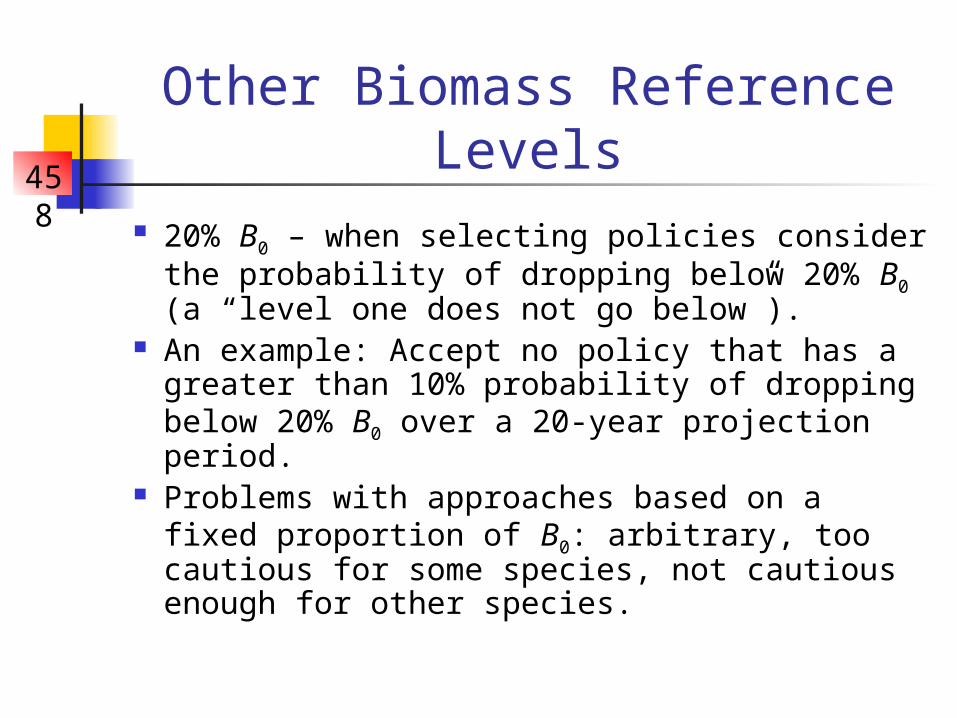
Other Biomass Reference Levels
20% B0 – when selecting policies consider the probability of dropping below 20% B0 (a “level one does not go below”).
An example: Accept no policy that has a greater than 10% probability of dropping below 20% B0 over a 20-year projection period.
Problems with approaches based on a fixed proportion of B0: arbitrary, too cautious for some species, not cautious enough for other species.
458
Multi-species Reference Points
458
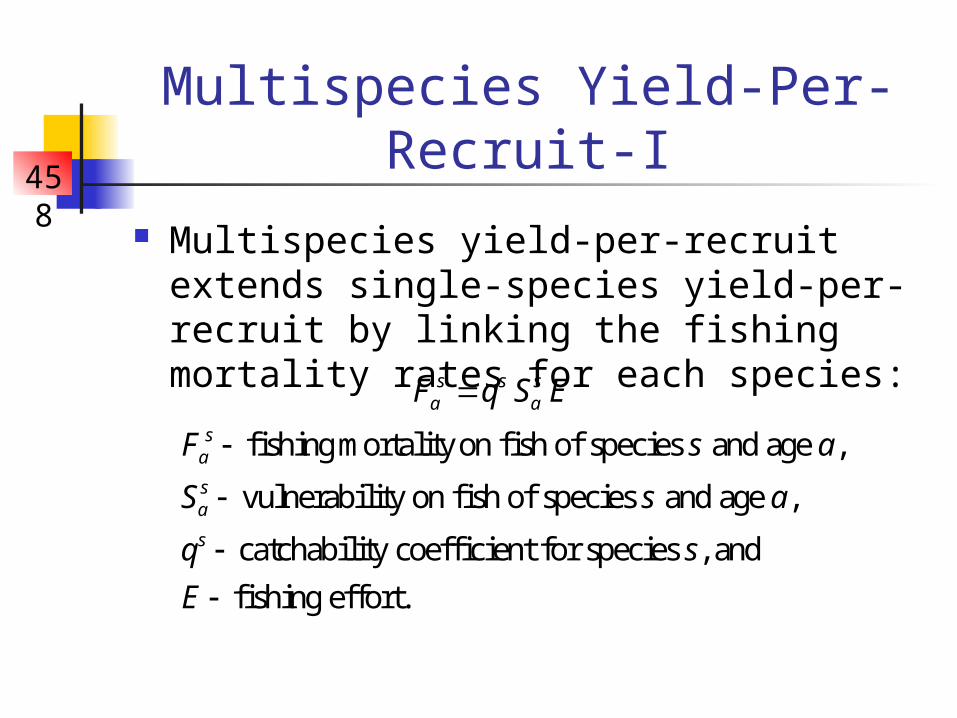
Multispecies Yield-Per-Recruit-I
Multispecies yield-per-recruit extends single-species yield-per-recruit by linking the fishing mortality rates for each species: s s s
a aF q S E
fishing mortality on fish of species and age ,
vulnerability on fish of species and age ,
catchability coefficient for species , and
fishing effort.
sa
sa
s
F s a
S s a
q s
E
458
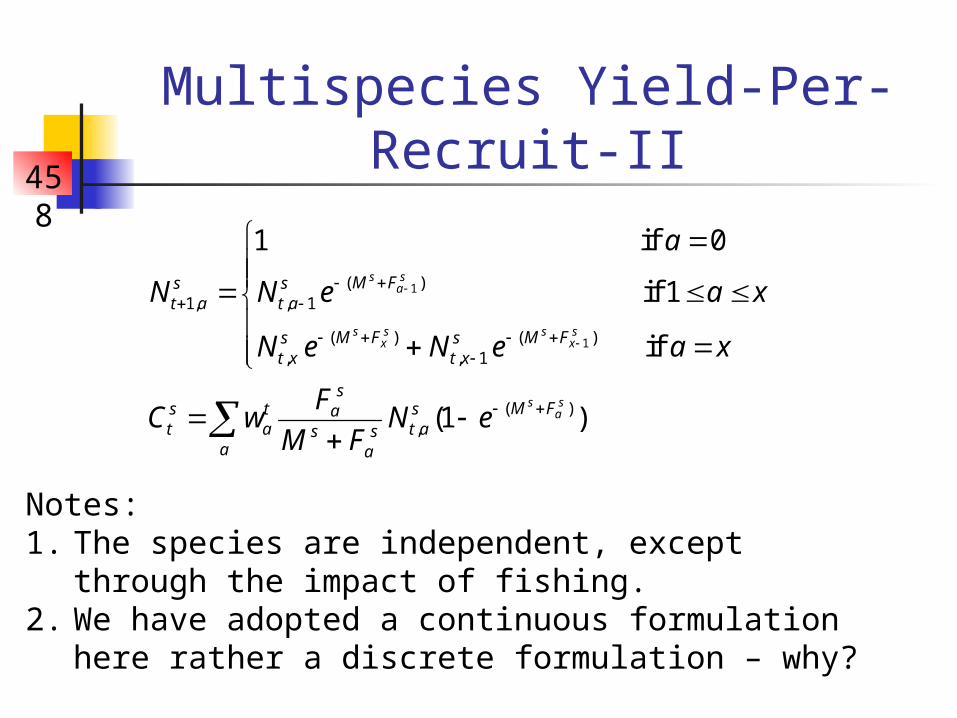
Multispecies Yield-Per-Recruit-II
1
1
( )1, , 1
( ) ( ), , 1
( ),
1 if 0
if 1
if
(1 )
s sa
s s s sx x
s sa
M Fs st a t a
M F M Fs st x t x
sM Fs t sa
t a t as sa a
a
N N e a x
N e N e a x
FC w N e
M F
Notes: 1. The species are independent, except through the
impact of fishing.2. We have adopted a continuous formulation here
rather a discrete formulation – why?
458
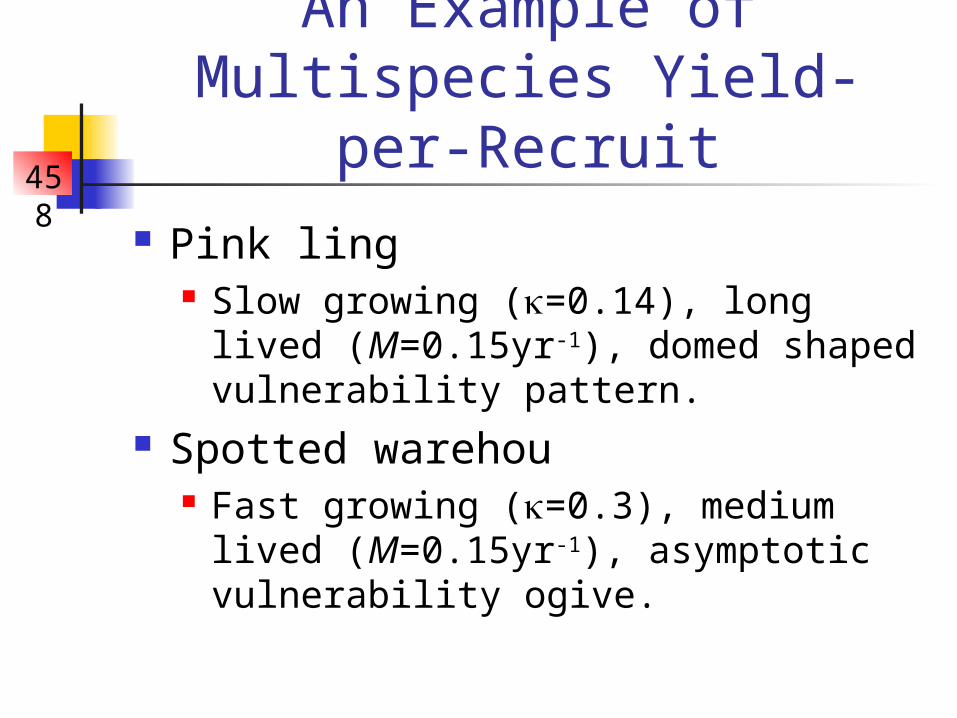
An Example of Multispecies Yield-per-
Recruit Pink ling
Slow growing (=0.14), long lived (M=0.15yr-1), domed shaped vulnerability pattern.
Spotted warehou Fast growing (=0.3), medium lived
(M=0.15yr-1), asymptotic vulnerability ogive.
458
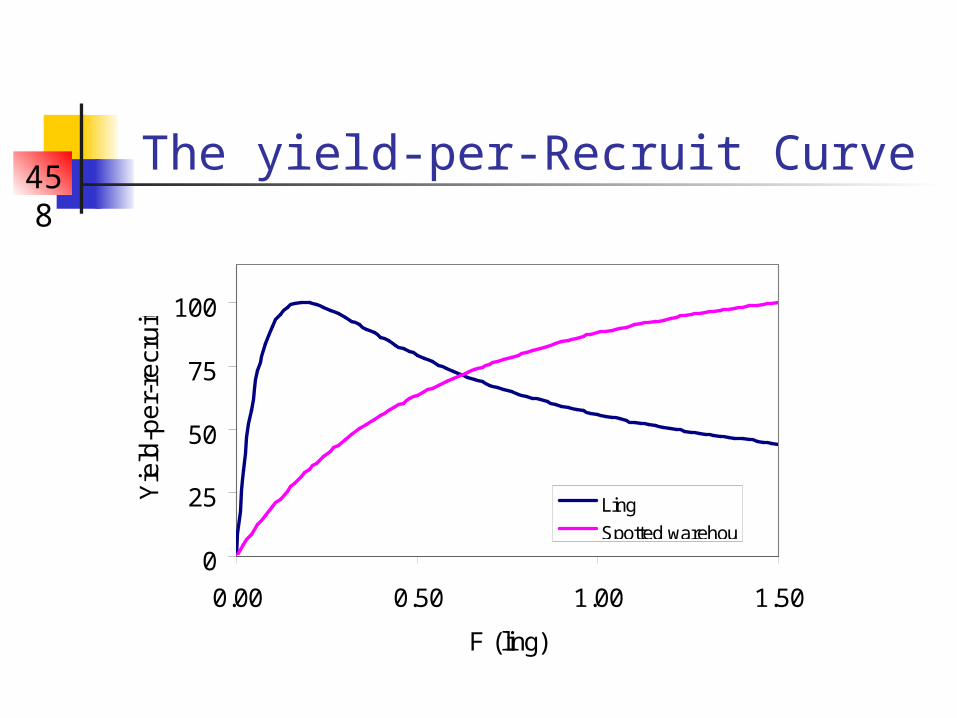
The yield-per-Recruit Curve
0
25
50
75
100
0.00 0.50 1.00 1.50
F (ling)
Yie
ld-p
er-
recr
uit
Ling
Spotted warehou
458
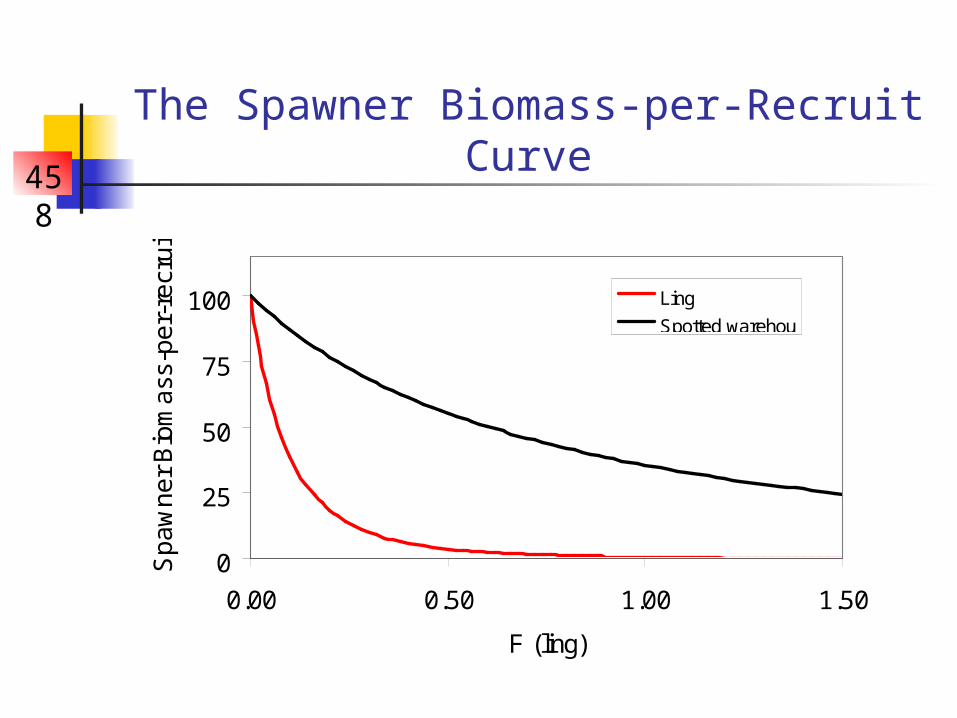
The Spawner Biomass-per-Recruit Curve
0
25
50
75
100
0.00 0.50 1.00 1.50
F (ling)
Sp
aw
ne
r B
iom
ass
-pe
r-re
cru
it
Ling
Spotted warehou
458
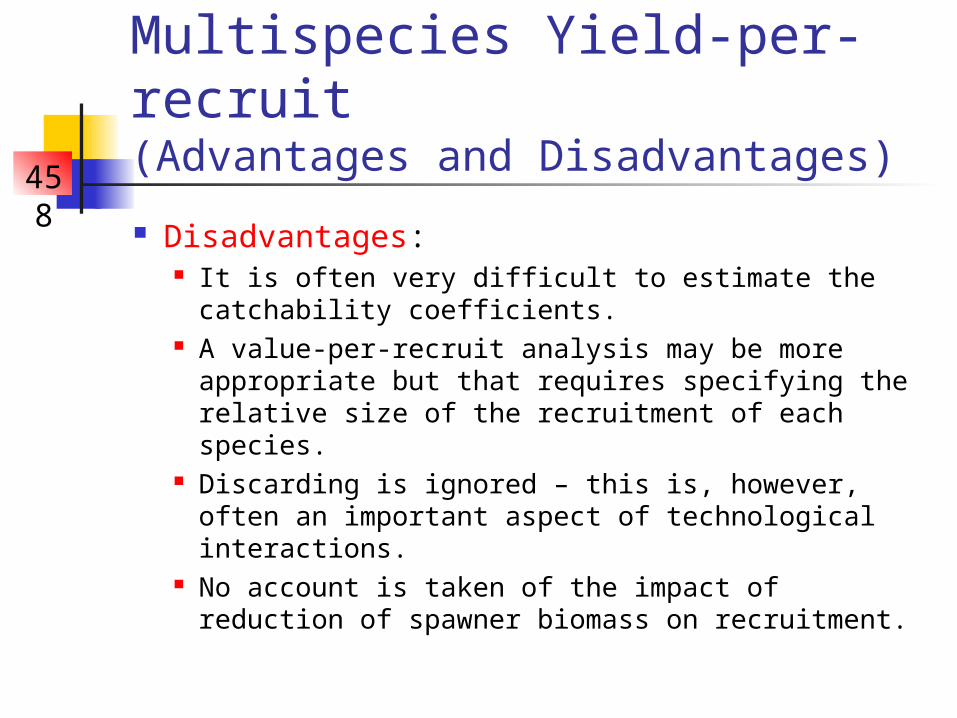
Multispecies Yield-per-recruit(Advantages and Disadvantages)
Disadvantages: It is often very difficult to estimate the
catchability coefficients. A value-per-recruit analysis may be more
appropriate but that requires specifying the relative size of the recruitment of each species.
Discarding is ignored – this is, however, often an important aspect of technological interactions.
No account is taken of the impact of reduction of spawner biomass on recruitment.
458
Multispecies Yield-per-recruit(Advantages and Disadvantages)
Advantages: It allow us to predict the overall
consequences of changes in fishing effort in terms of yield- and spawner biomass-per-recruit.
The approach can be extended to handle discarding and the stock-recruitment relationship.
458
Readings Clark (1991). Hilborn and Walters (1992);
Chapter 14. Pikitch (1987). Quinn and Deriso (1999); Chapter
11. Sissenwine and Shepherd (1987)