Embed Size (px)
DESCRIPTION
document
Citation preview
International Journal for Research and Development in Engineering (IJRDE)
www.ijrde.com ISSN: 2279-0500 Special Issue: pp- 261-266
Methods Enriching Power and Energy Development (MEPED) 2014 261 | P a g e
Temperature rise estimation in a 420 kV GIS bus bar
considering skin and proximity effects
1Bavisha T,
1Usa S,
2Ucchintala Ravindra,
3Santosh Kumar A
1Department of Electrical and Electronics Engineering, College of Engineering Guindy, Chennai, India.
2,3Alstom T&D India Ltd., Padappai, Chennai 620006,India
ABSTRACT
Gas Insulated Switchgear should carry high
current permanently. The high current creates
ohmic losses in the current carrying parts. The
heat from the losses increases the temperature of
the current carrying parts due to which their
resistance increases. This will result in a thermal
runaway condition resulting in failure of GIS.
Hence the temperature rise on the current
carrying parts should not exceed a maximum limit
which is defined by standards. Thus the current
carrying capacity is limited by the maximum
operating temperature. Moreover the capital cost
of GIS depends upon the current carrying
capacity. Hence it is necessary to predict the
temperature rise accurately. In this paper, the
temperature rise in a 420 kV GIS bus bar is
estimated using a theoretical model. The
theoretical model is in line with the publication of
CIGRE working group 21.12 which is meant for
the calculation of continuous current rating in
compressed gas insulated cables. However a
different principle and pattern that suits GIS bus
duct is adapted. The temperature rise estimated
using the theoretical model shows good agreement
when compared with the measured temperature
rise.
Keywords: bus bar, power loss, proximity, skin
effect, temperature.
I. INTRODUCTION
Gas Insulated Substation (GIS) is an
electrical substation in which the live parts are
contained in an external metal enclosure with sulfur
hexafluoride (SF6) gas as the insulating medium. It
occupies only 10% of the space required by a
conventional Air Insulated Substation (AIS).This
ratio reduces further as voltage level increases. Other
advantages include improved operator safety and
higher reliability during operation.
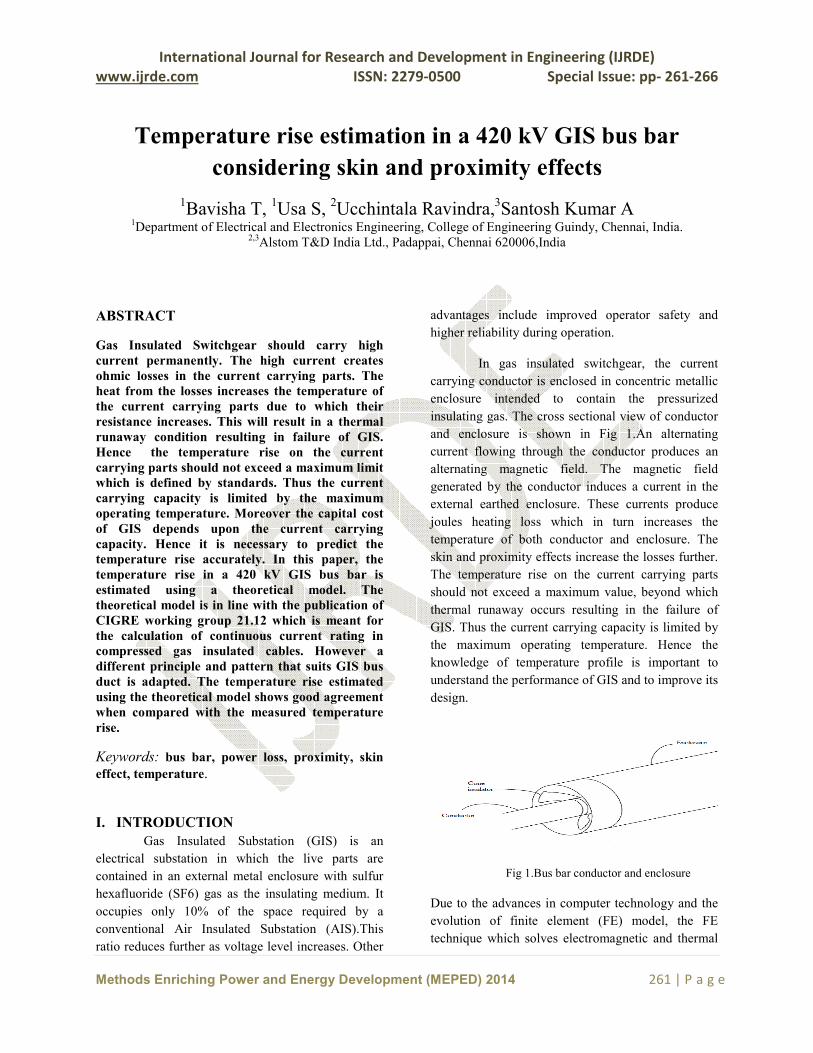
In gas insulated switchgear, the current
carrying conductor is enclosed in concentric metallic
enclosure intended to contain the pressurized
insulating gas. The cross sectional view of conductor
and enclosure is shown in Fig 1.An alternating
current flowing through the conductor produces an
alternating magnetic field. The magnetic field
generated by the conductor induces a current in the
external earthed enclosure. These currents produce
joules heating loss which in turn increases the
temperature of both conductor and enclosure. The
skin and proximity effects increase the losses further.
The temperature rise on the current carrying parts
should not exceed a maximum value, beyond which
thermal runaway occurs resulting in the failure of
GIS. Thus the current carrying capacity is limited by
the maximum operating temperature. Hence the
knowledge of temperature profile is important to
understand the performance of GIS and to improve its
design.
Fig 1.Bus bar conductor and enclosure
Due to the advances in computer technology and the
evolution of finite element (FE) model, the FE
technique which solves electromagnetic and thermal
International Journal for Research and Development in Engineering (IJRDE)
www.ijrde.com ISSN: 2279-0500 Special Issue: pp- 261-266
Methods Enriching Power and Energy Development (MEPED) 2014 262 | P a g e
fields has been used for such problems [4],[5],[6].The
difficulty in this technique lies in determining the
convection heat transfer coefficient at the solid-gas
interface. The heat transfer coefficient depends upon
the geometry, temperature and material property. A
coupled finite element and analytical technique has
been used which involves the calculation of heat
transfer coefficient by iterative analytical technique
[2],[3].Uncoupled field analysis where two fields are
solved separately, could not take into account of the
interrelationship between the two field parameters
like temperature dependent resistivity. Therefore
fully coupled field analysis that repeatedly solves the
two fields has been used. But this technique is time
consuming [4].
In this paper a theoretical model to estimate
the temperature rise in a 420 kV GIS bus bar is
developed. The publication of CIGRE working group
[1] is meant for the calculation of continuous current
rating in a single core compressed gas insulated
cables. Since the gas insulated cables and GIS bus
duct are similar in construction, a theoretical model
in line with the CIGRE document is developed to
estimate the temperature rise. However the principle
and pattern that suits GIS bus duct is adapted. The
theoretical model mainly concerns the skin effect,
proximity effect, thermal resistance of gas insulation
and thermal resistance of surrounding ambient. The
accuracy of the developed theoretical model is
verified by comparing with the measured
temperature.
II. ALTERNATING CURRENT RESISTANCE
The alternating current resistance per unit length of
the conductor or outer enclosure is given by
(1)
is the alternating current resistance of the
conductor tube at its maximum operating
temperature, is the direct current resistance of tube
at 20 , y is the coefficient of skin effect, is the
temperature coefficient of electrical resistivity at
20 per 1K temperature difference, is the
maximum operating temperature of the conductor or
the enclosure.
III. SKIN-PROXIMITY EFFECT
Skin and proximity effects are the major source of
losses in transformer and inductor designs, as well as
in AC power distribution systems composed of
separate, round conductors. They cause a non
uniform current distribution with an increase in loss.
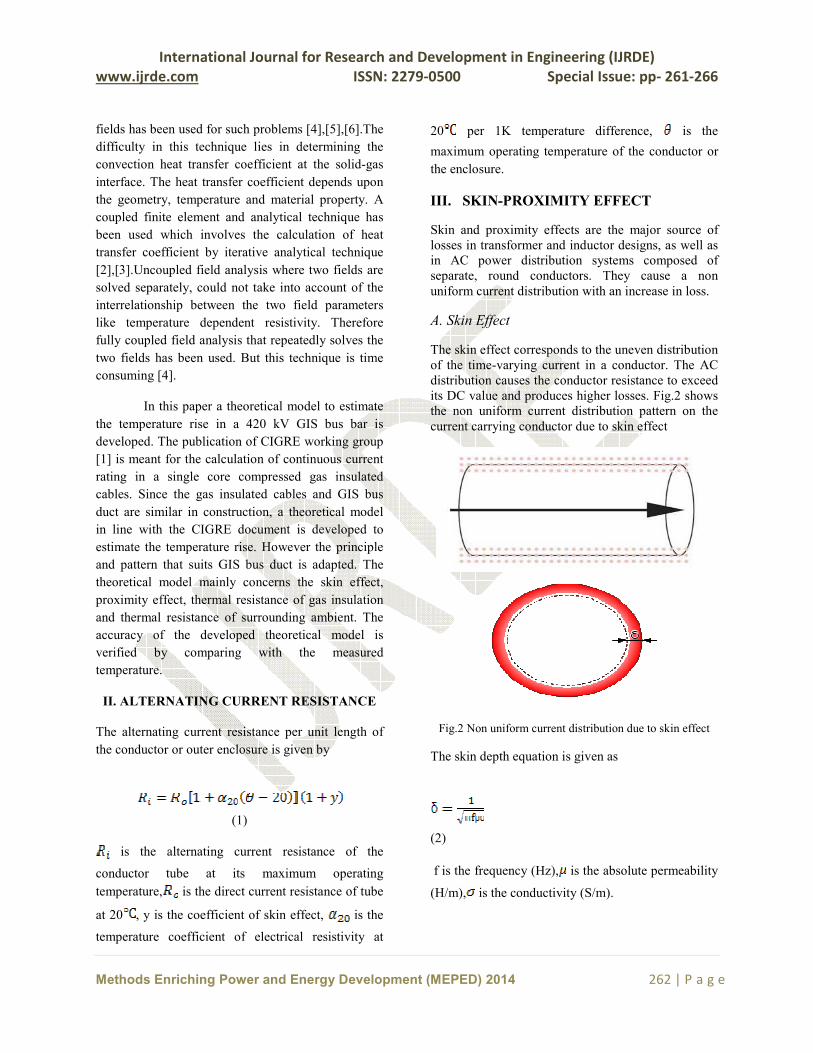
A. Skin Effect
The skin effect corresponds to the uneven distribution
of the time-varying current in a conductor. The AC
distribution causes the conductor resistance to exceed
its DC value and produces higher losses. Fig.2 shows
the non uniform current distribution pattern on the
current carrying conductor due to skin effect
Fig.2 Non uniform current distribution due to skin effect
The skin depth equation is given as
(2)
f is the frequency (Hz), is the absolute permeability
(H/m), is the conductivity (S/m).
International Journal for Research and Development in Engineering (IJRDE)
www.ijrde.com ISSN: 2279-0500 Special Issue: pp- 261-266
Methods Enriching Power and Energy Development (MEPED) 2014 263 | P a g e
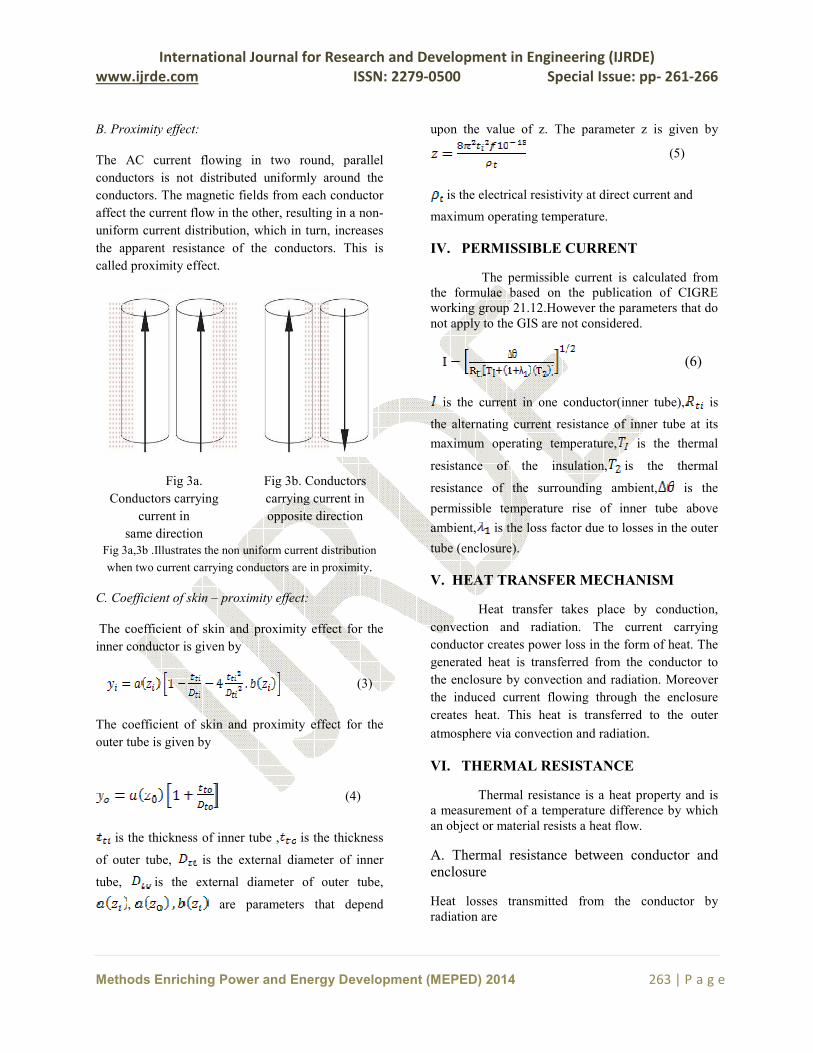
B. Proximity effect:
The AC current flowing in two round, parallel
conductors is not distributed uniformly around the
conductors. The magnetic fields from each conductor
affect the current flow in the other, resulting in a non-
uniform current distribution, which in turn, increases
the apparent resistance of the conductors. This is
called proximity effect.
Fig 3a.
Conductors carrying
current in
same direction
Fig 3b. Conductors
carrying current in
opposite direction
Fig 3a,3b .Illustrates the non uniform current distribution
when two current carrying conductors are in proximity.
C. Coefficient of skin – proximity effect:
The coefficient of skin and proximity effect for the
inner conductor is given by
(3)
The coefficient of skin and proximity effect for the
outer tube is given by
(4)
is the thickness of inner tube , is the thickness
of outer tube, is the external diameter of inner
tube, is the external diameter of outer tube,
, are parameters that depend
upon the value of z. The parameter z is given by
(5)
is the electrical resistivity at direct current and
maximum operating temperature.
IV. PERMISSIBLE CURRENT
The permissible current is calculated from
the formulae based on the publication of CIGRE
working group 21.12.However the parameters that do
not apply to the GIS are not considered.
(6)
is the current in one conductor(inner tube), is
the alternating current resistance of inner tube at its
maximum operating temperature, is the thermal
resistance of the insulation, is the thermal
resistance of the surrounding ambient, is the
permissible temperature rise of inner tube above
ambient, is the loss factor due to losses in the outer
tube (enclosure).
V. HEAT TRANSFER MECHANISM
Heat transfer takes place by conduction,
convection and radiation. The current carrying
conductor creates power loss in the form of heat. The
generated heat is transferred from the conductor to
the enclosure by convection and radiation. Moreover
the induced current flowing through the enclosure
creates heat. This heat is transferred to the outer
atmosphere via convection and radiation.
VI. THERMAL RESISTANCE
Thermal resistance is a heat property and is
a measurement of a temperature difference by which
an object or material resists a heat flow.
A. Thermal resistance between conductor and
enclosure
Heat losses transmitted from the conductor by
radiation are
International Journal for Research and Development in Engineering (IJRDE)
www.ijrde.com ISSN: 2279-0500 Special Issue: pp- 261-266
Methods Enriching Power and Energy Development (MEPED) 2014 264 | P a g e
=
(7)
Heat losses transmitted from the conductor by
convection are
8)
Thermal resistance between conductor and enclosure
= (9)
is the internal diameter of the outer tube, is
the maximum operating temperature of inner tube,
is the maximum operating temperature of outer tube,
is the temperature of the ambient air, is the
emissivity coefficient of the inner tube, is the
emissivity coefficient of the inner surface of outer
tube, is the gas pressure. is equal to 11.3 if sf6
gas is used as insulating gas whereas it is equal to
5.83 if nitrogen is used as insulating gas.
B. Thermal resistance of enclosure
Heat losses transmitted from the enclosure by
radiation are
(10)
Heat losses transmitted from the enclosure by
convection are
(11)
Thermal resistance of enclosure is
= (12)
is the external diameter, is the temperature
of the outer enclosure, is the emissivity
coefficient of the outer surface, e is the factor
permitting to take into account of proximity
effect of adjacent conductor by means of the
formula
(13)
is the external diameter of enclosure and s is the
axial separation of conductors.
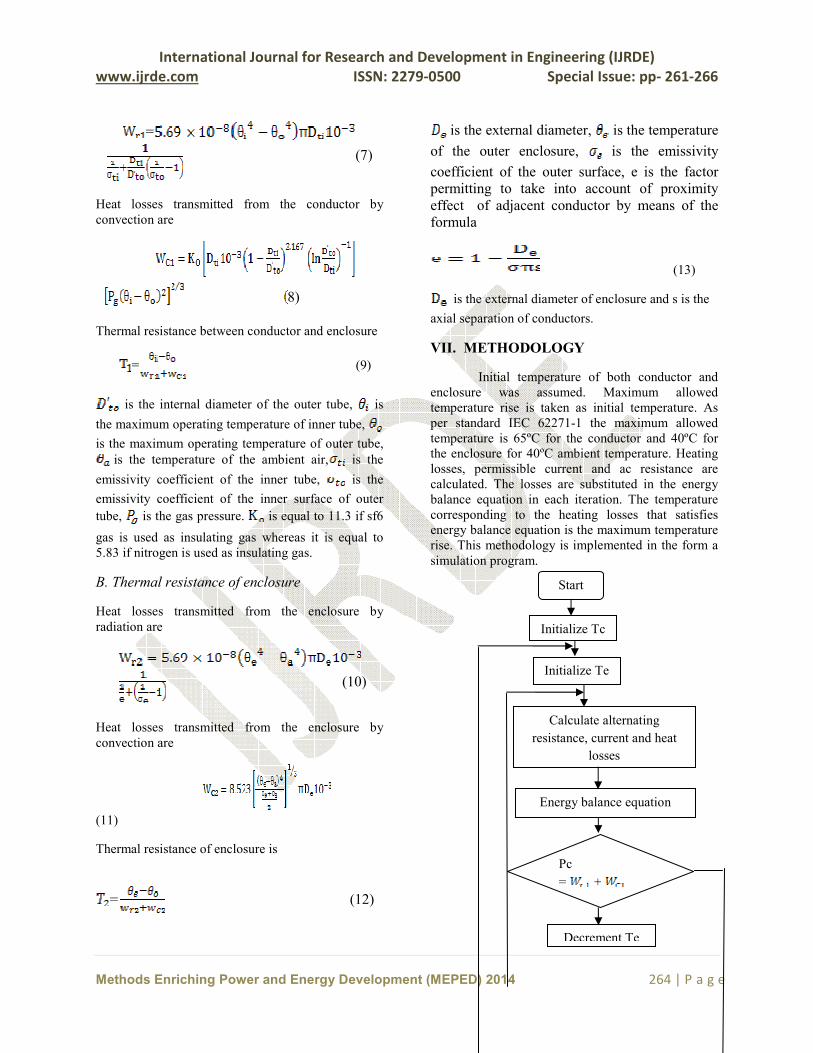
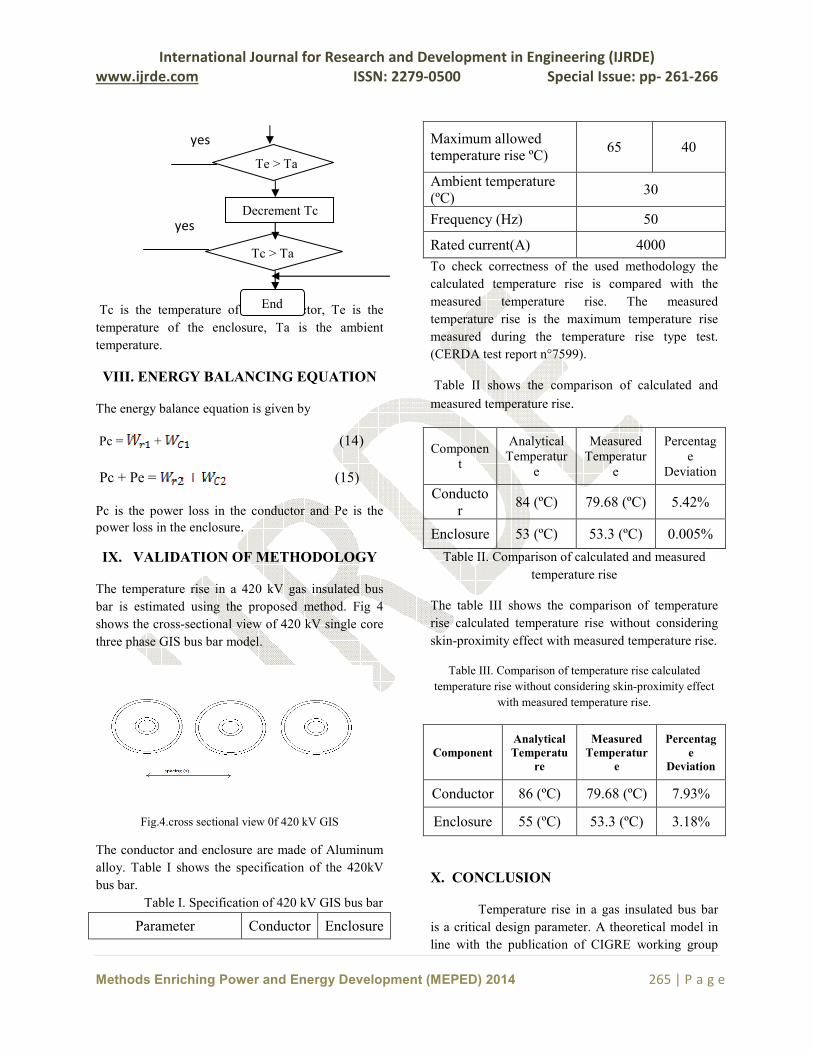
VII. METHODOLOGY
Initial temperature of both conductor and
enclosure was assumed. Maximum allowed
temperature rise is taken as initial temperature. As
per standard IEC 62271-1 the maximum allowed
temperature is 65ºC for the conductor and 40ºC for
the enclosure for 40ºC ambient temperature. Heating
losses, permissible current and ac resistance are
calculated. The losses are substituted in the energy
balance equation in each iteration. The temperature
corresponding to the heating losses that satisfies
energy balance equation is the maximum temperature
rise. This methodology is implemented in the form a
simulation program.
Start
Initialize Tc
Initialize Te
Energy balance equation
Pc
= +
Decrement Te
Calculate alternating
resistance, current and heat
losses
International Journal for Research and Development in Engineering (IJRDE)
www.ijrde.com ISSN: 2279-0500 Special Issue: pp- 261-266
Methods Enriching Power and Energy Development (MEPED) 2014 265 | P a g e
Tc is the temperature of the conductor, Te is the
temperature of the enclosure, Ta is the ambient
temperature.
VIII. ENERGY BALANCING EQUATION
The energy balance equation is given by
Pc = + (14)
Pc + Pe = (15)
Pc is the power loss in the conductor and Pe is the
power loss in the enclosure.
IX. VALIDATION OF METHODOLOGY
The temperature rise in a 420 kV gas insulated bus
bar is estimated using the proposed method. Fig 4
shows the cross-sectional view of 420 kV single core
three phase GIS bus bar model.
Fig.4.cross sectional view 0f 420 kV GIS
The conductor and enclosure are made of Aluminum
alloy. Table I shows the specification of the 420kV
bus bar.
Table I. Specification of 420 kV GIS bus bar
Parameter Conductor Enclosure
Maximum allowed
temperature rise ºC) 65 40
Ambient temperature
(ºC) 30
Frequency (Hz) 50
Rated current(A) 4000
To check correctness of the used methodology the
calculated temperature rise is compared with the
measured temperature rise. The measured
temperature rise is the maximum temperature rise
measured during the temperature rise type test.
(CERDA test report n°7599).
Table II shows the comparison of calculated and
measured temperature rise.
Componen
t
Analytical
Temperatur
e
Measured
Temperatur
e
Percentag
e
Deviation
Conducto
r 84 (ºC) 79.68 (ºC) 5.42%
Enclosure 53 (ºC) 53.3 (ºC) 0.005%
Table II. Comparison of calculated and measured
temperature rise
The table III shows the comparison of temperature
rise calculated temperature rise without considering
skin-proximity effect with measured temperature rise.
Table III. Comparison of temperature rise calculated
temperature rise without considering skin-proximity effect
with measured temperature rise.
Component
Analytical
Temperatu
re
Measured
Temperatur
e
Percentag
e
Deviation
Conductor 86 (ºC) 79.68 (ºC) 7.93%
Enclosure 55 (ºC) 53.3 (ºC) 3.18%
X. CONCLUSION
Temperature rise in a gas insulated bus bar
is a critical design parameter. A theoretical model in
line with the publication of CIGRE working group
Te > Ta
Decrement Tc
Tc > Ta
End
yes
yes
International Journal for Research and Development in Engineering (IJRDE)
www.ijrde.com ISSN: 2279-0500 Special Issue: pp- 261-266
Methods Enriching Power and Energy Development (MEPED) 2014 266 | P a g e
21.12 to estimate the temperature rise in a 420 kV
GIS bus bar is developed. The temperature rise
estimated using the theoretical model shows good
agreement when compared with the measured
temperature rise. The results are found to be more
accurate since the skin and proximity effects are
considered.
REFERENCES
[1] CIGRE Working group 21.12., “Calculation of
the continuous rating, compressed gas insulated
cables in still air with no radiation”, Electra No
100,pp. 65-76, 1985.
[2] S. W. Kim, H. H. Kim, and S. C. Hahn, “Coupled
finite-element analytic technique for prediction of
temperature rise in power apparatus,” IEEE
Trans. on Magnetics., vol.38, no.2, pp. 921-924,
2002.
[3] J.K.Kim, S.C.Hahn, K.Y.Park, H.K.Kim,
Y.H.Oh, “Temperature Rise Prediction of EHV
GIS Bus Bar by Coupled Magneto-thermal Finite
Element Method”, IEEE Trans. Magnetics, Vol.
41, No. 5,pp. 1636-1639, May 2005.588
[4] J.H. Yoon, H.S. Ahn, J. Choi, I.S. Oh, “An
Estimation Technology of Temperature Rise in
GIS Bus Bar using Three-Dimensional Coupled-
Field Multiphysics”, Proceedings of the IEEE
ISEI, 2008, 432-436
[5] Y. Li, S.L. Ho, N. Wang, and J. Guo
,“Calculations of Electromagnetic Field and
Thermal Problem in an Isolated Phase Bus by
Using FE Model” IEEE 2008 .
[6] Kim, H.K.; Oh, Y.H.; Lee, S.H ," Prediction of
temperature rise in gas insulated bus bar using
multi-physics analysis”, IEEE Transmission &
Distribution Conference & Exposition: Asia and
Pacific, 2009.
[7] B. Novák, L. Koller, “Steady-state Heating of
Gas Insulated Busbars” ,IEEE 2008
[8] K. Itaka, T. Araki, and T. Hara, “Heat transfer
characteristics of gas spacer cables,” IEEE Trans.
P.A. , vol. 97, Sept./Oct. 1978


![c- -50% 40 % 60 - 40 SATISFACTORY pASS FAIL Signed 22 ... · material science and engineering 1 material processng 1 45 45 45 45 45 45 45 academic year: student name: fac/sch]tnst:](https://img.pdfslide.us/doc/110x75/5fa20790d9c9b8611d24a0af/c-50-40-60-40-satisfactory-pass-fail-signed-22-material-science-and-engineering.jpg)


![[45, -45] Pictures](https://img.pdfslide.us/doc/110x75/55d01ec9bb61eb731d8b467e/45-45-pictures.jpg)