Embed Size (px)
Citation preview

44095: IT for Management
Introduction to Spreadsheets(Basic/Complex Formulae & Worksheets)
By: Ian PerryRoom: C48E-mail: [email protected]
Tel: 01723 35 7287
http://itsy.co.uk/ac/0607/Sem2/44095_IT4M/
Ian Perry Slide 244095: IT for Management: Introduction to Spreadsheets
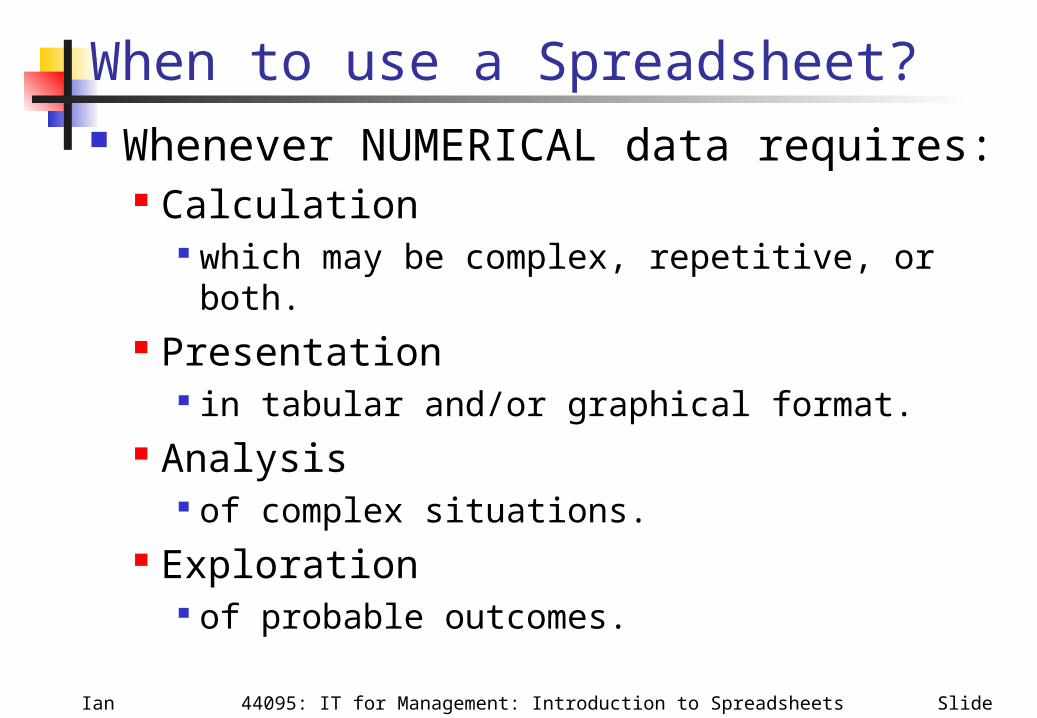
When to use a Spreadsheet? Whenever NUMERICAL data requires:
Calculation which may be complex, repetitive, or both.
Presentation in tabular and/or graphical format.
Analysis of complex situations.
Exploration of probable outcomes.
Ian Perry Slide 344095: IT for Management: Introduction to Spreadsheets
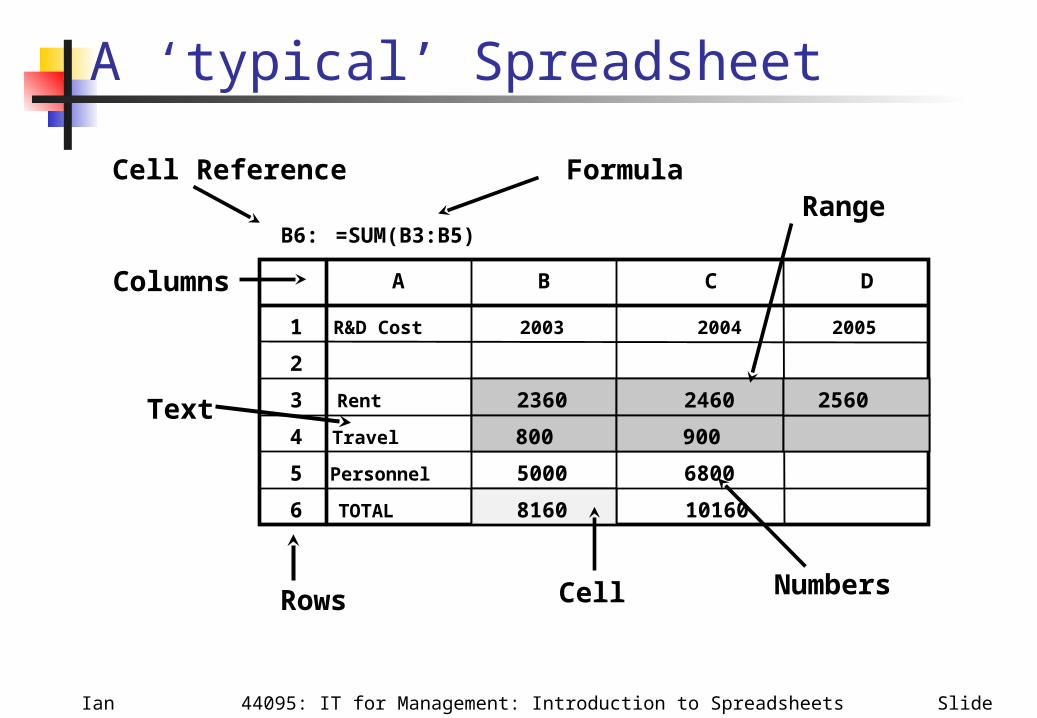
A ‘typical’ Spreadsheet
1
2
3
4
5
6
A B C D
R&D Cost
Rent
Travel
Personnel
TOTAL
2003 2004 2005
2360 2460 2560
800 900
8160
5000 6800
10160
Columns
Rows
Text
B6:
Cell Reference
=SUM(B3:B5)
FormulaRange
Cell Numbers

Ian Perry Slide 444095: IT for Management: Introduction to Spreadsheets
Data can be presented as a Chart
A B C D E
1 1st Qtr 2nd Qtr 3rd Qtr 4th Qtr
2 East 20.4 27.4 90 20.4
3 West 30.6 38.6 34.6 31.6
4 North 45.9 46.9 45 43.9
5
1st Qtr 2nd Qtr 3rd Qtr 4th Qtr0
1020
30
40
50
60
70
8090
East
West
North
Which may make it easier to see trends, or spot exceptional/unusual values.
Ian Perry Slide 544095: IT for Management: Introduction to Spreadsheets
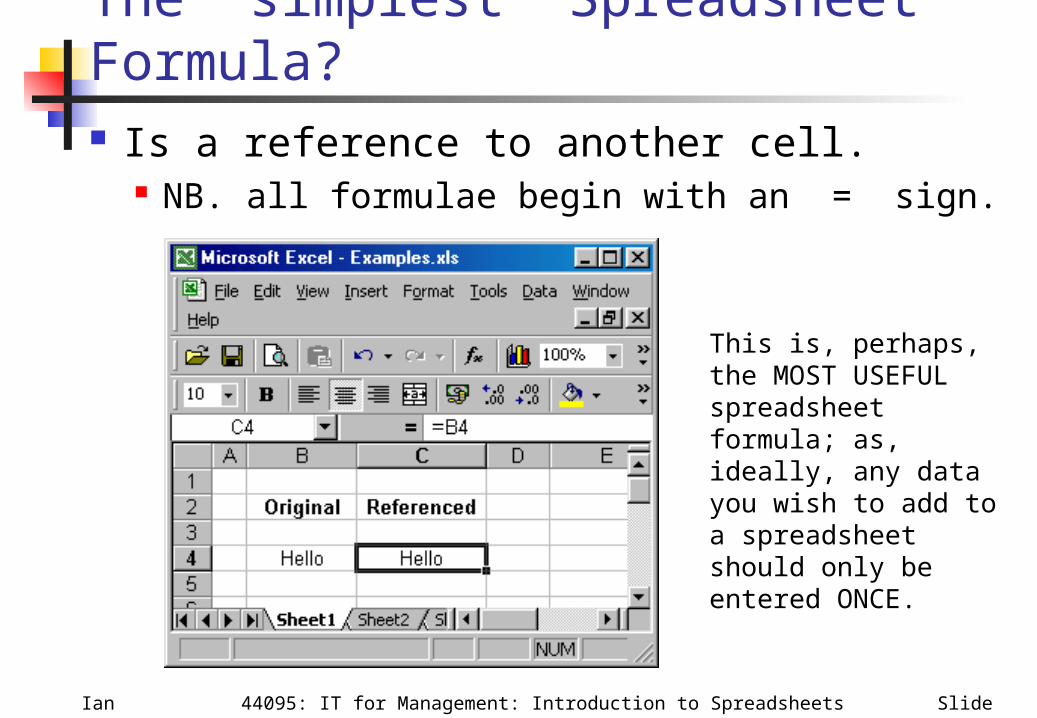
The ‘simplest’ Spreadsheet Formula? Is a reference to another cell.
NB. all formulae begin with an = sign.
This is, perhaps, the MOST USEFUL spreadsheet formula; as, ideally, any data you wish to add to a spreadsheet should only be entered ONCE.
Ian Perry Slide 644095: IT for Management: Introduction to Spreadsheets
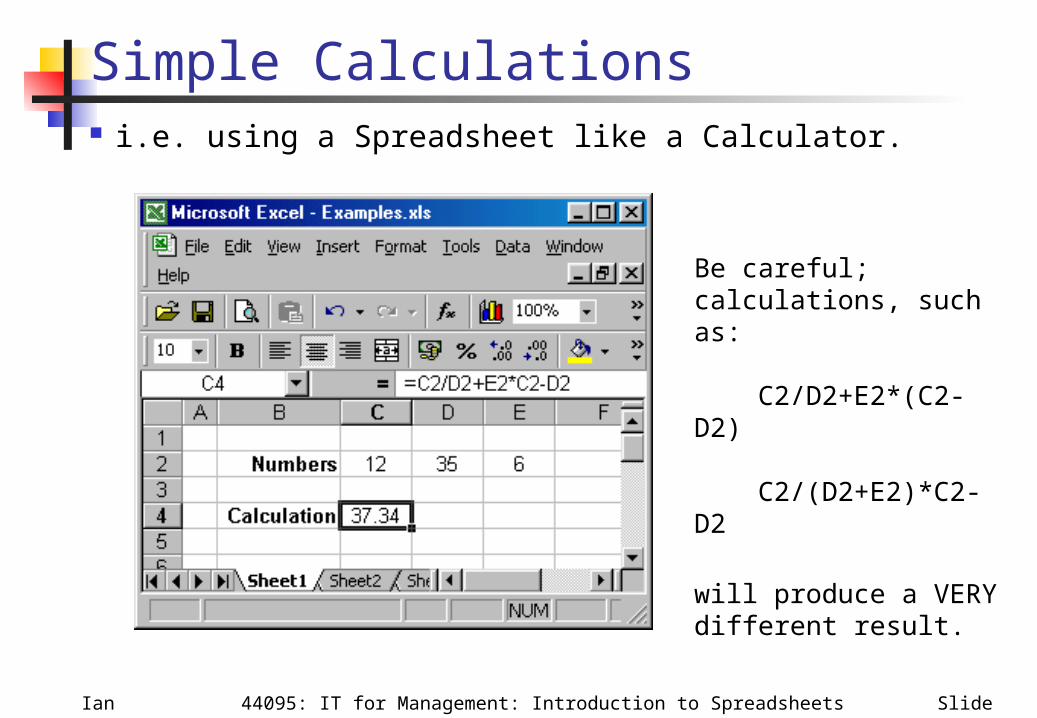
Simple Calculations i.e. using a Spreadsheet like a Calculator.
Be careful; calculations, such as:
C2/D2+E2*(C2-D2)
C2/(D2+E2)*C2-D2
will produce a VERY different result.

Ian Perry Slide 744095: IT for Management: Introduction to Spreadsheets
Simple Spreadsheet Functions - 1 Sum
=sum(range) OR =sum(cell, cell, …)
Ian Perry Slide 844095: IT for Management: Introduction to Spreadsheets
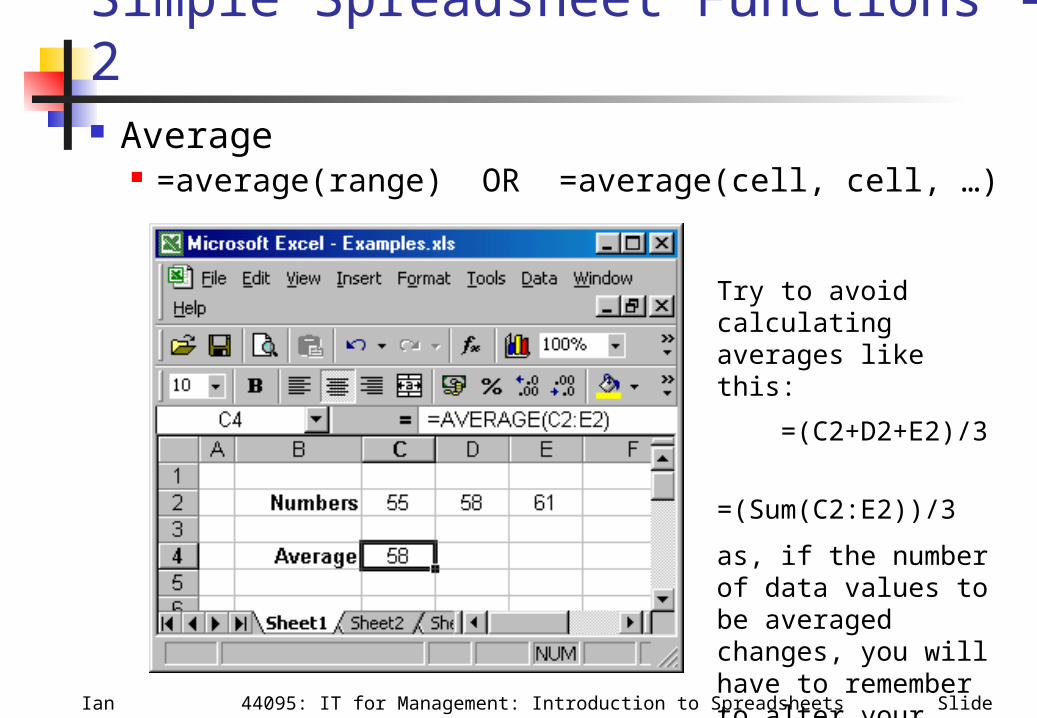
Simple Spreadsheet Functions - 2 Average
=average(range) OR =average(cell, cell, …)
Try to avoid calculating averages like this:
=(C2+D2+E2)/3
=(Sum(C2:E2))/3
as, if the number of data values to be averaged changes, you will have to remember to alter your formula.
Ian Perry Slide 944095: IT for Management: Introduction to Spreadsheets
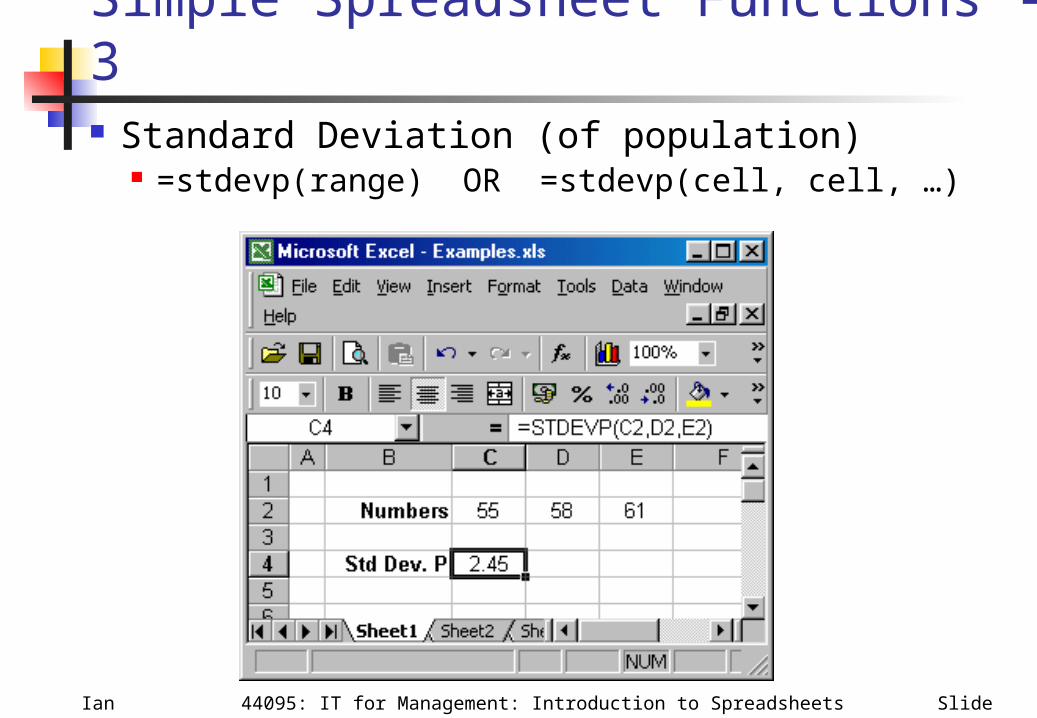
Simple Spreadsheet Functions - 3 Standard Deviation (of population)
=stdevp(range) OR =stdevp(cell, cell, …)

Ian Perry Slide 1044095: IT for Management: Introduction to Spreadsheets
Simple Spreadsheet Functions - 4 Maximum
=max(range) OR = max(cell, cell, …) Minimum
=min(range) OR = min(cell, cell, …) Median
=median(range) OR = median(cell, cell, …) Today (i.e. today’s Date)
=today() Now (i.e. today’s Date & Time)
=now() Count (of cells containing numeric data)
=count(range) OR = count(cell, cell, …)

Ian Perry Slide 1144095: IT for Management: Introduction to Spreadsheets
The ‘CountIf’ Function Counts the number of values in a range
that match a given criteria. =countif(range,criteria)

Ian Perry Slide 1244095: IT for Management: Introduction to Spreadsheets
The ‘IF’ Function Tests a condition in another cell, and
decides what to display in this one. =if(condition,true,false)
Ian Perry Slide 1344095: IT for Management: Introduction to Spreadsheets
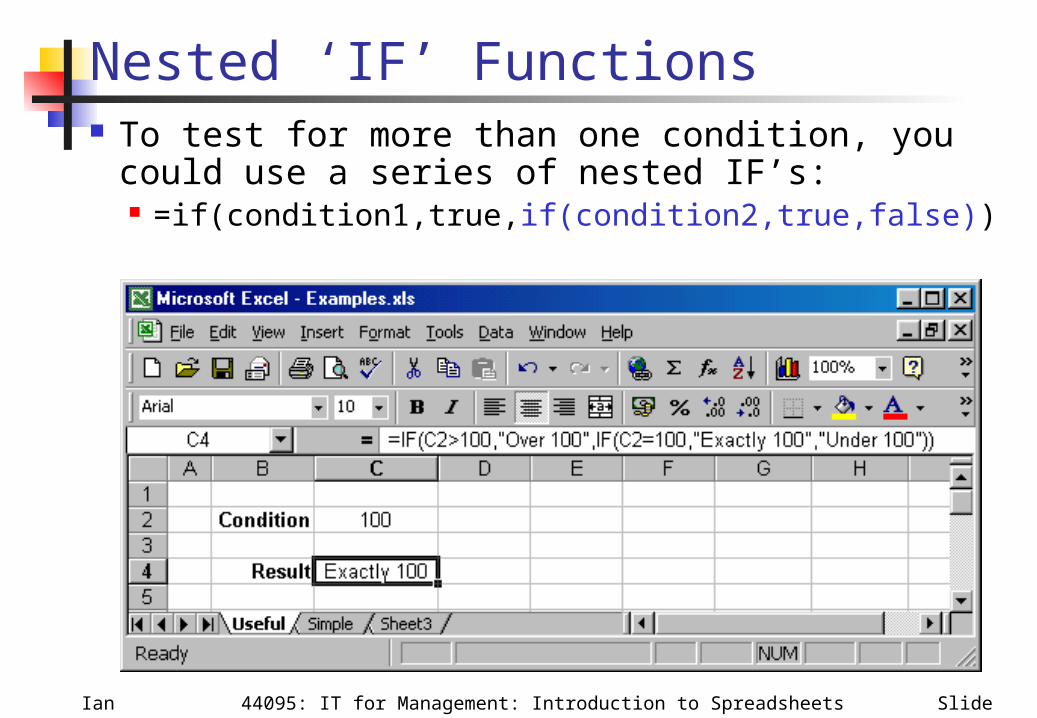
Nested ‘IF’ Functions To test for more than one condition, you
could use a series of nested IF’s: =if(condition1,true,if(condition2,true,false))
Ian Perry Slide 1444095: IT for Management: Introduction to Spreadsheets
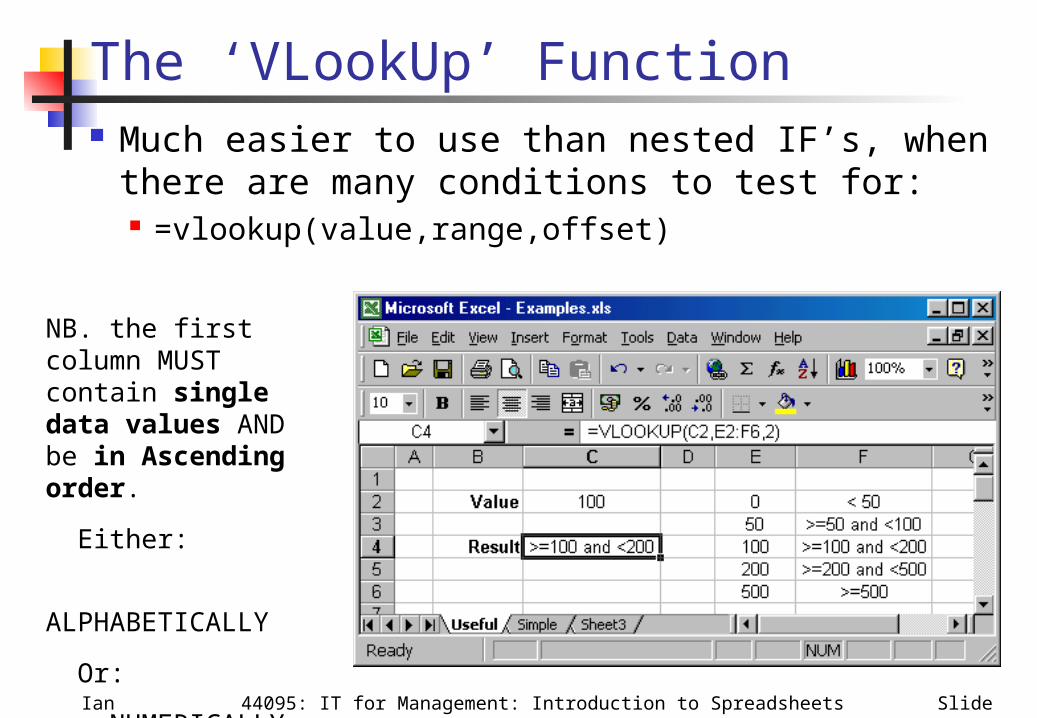
The ‘VLookUp’ Function Much easier to use than nested IF’s, when
there are many conditions to test for: =vlookup(value,range,offset)
NB. the first column MUST contain single data values AND be in Ascending order.
Either:
ALPHABETICALLY
Or:
NUMERICALLY
Ian Perry Slide 1544095: IT for Management: Introduction to Spreadsheets
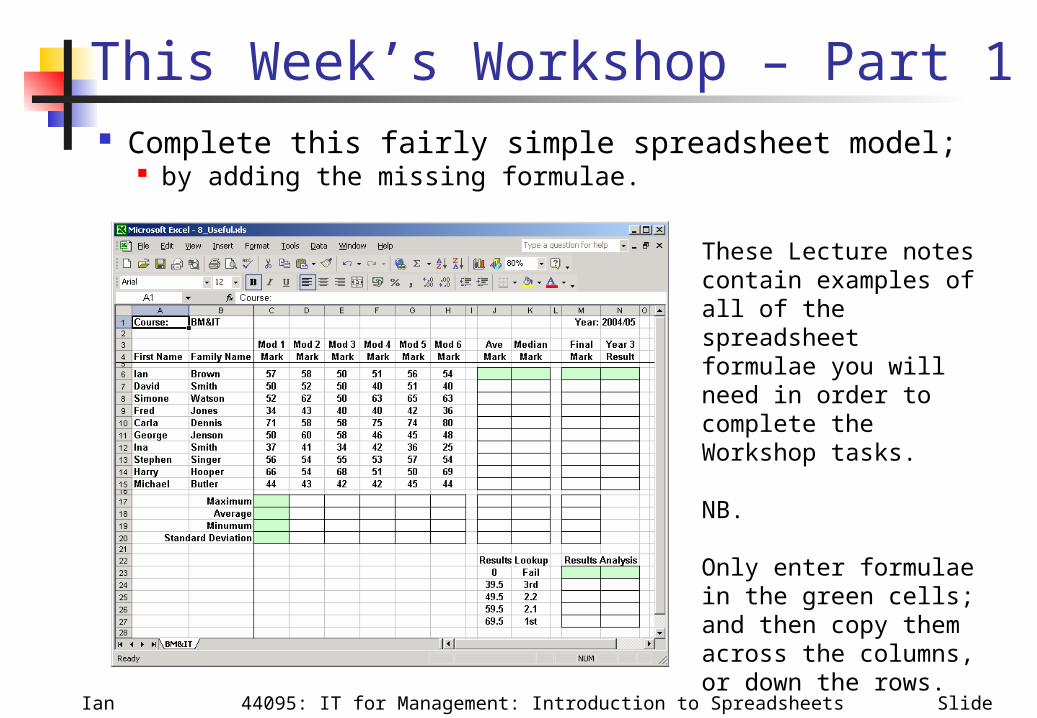
This Week’s Workshop – Part 1 Complete this fairly simple spreadsheet model;
by adding the missing formulae.
These Lecture notes contain examples of all of the spreadsheet formulae you will need in order to complete the Workshop tasks.
NB.
Only enter formulae in the green cells; and then copy them across the columns, or down the rows.
Ian Perry Slide 1644095: IT for Management: Introduction to Spreadsheets
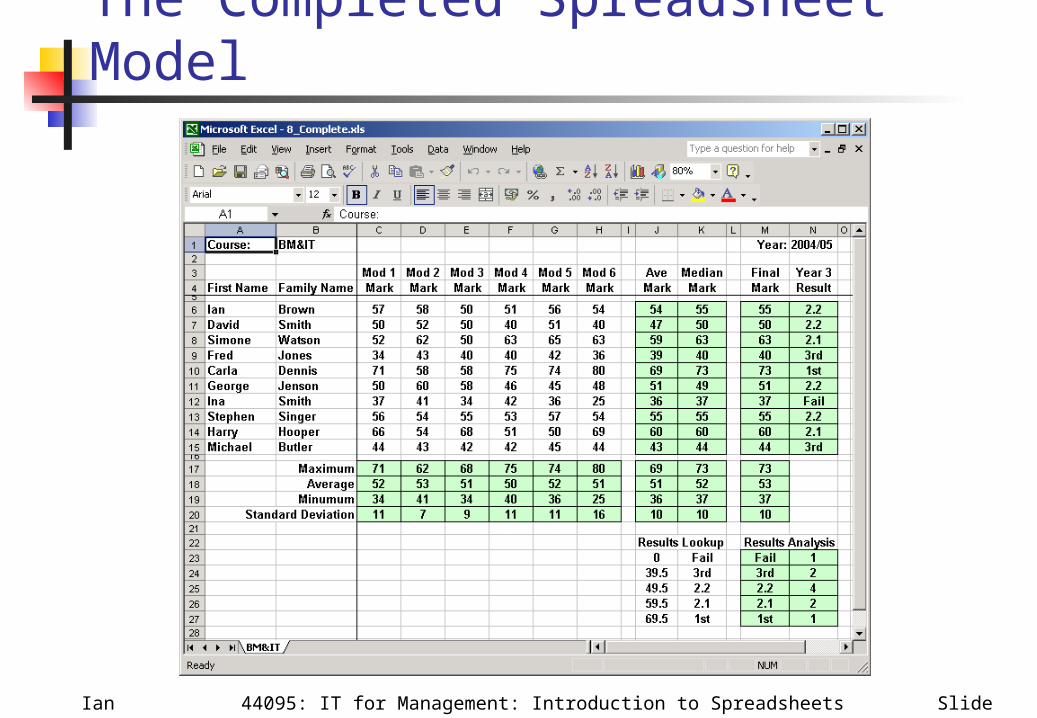
The Completed Spreadsheet Model

Ian Perry Slide 1744095: IT for Management: Introduction to Spreadsheets
Spreadsheet Development - 1 Draft it out on paper first, considering:
Shape does the problem suit a landscape or a portrait
shaped solution? Content
which parts of the spreadsheet content will be text, data, formulae?
Outputs is there a need to print the results or will they be
viewed on screen?
Ian Perry Slide 1844095: IT for Management: Introduction to Spreadsheets
Spreadsheet Development - 2 Two types of data in a spreadsheet:
Input data - entered/altered often, e.g. sales made, hours worked, money to change, etc.
Reference data - rarely changes, e.g. vat rates, pay rates, currency conversion rates,
etc.
Always separate these data types: Keep input data areas together (and easily
accessible) data entry is the biggest source of errors.
Keep reference data together and protect cells where data entry is not required.

Ian Perry Slide 1944095: IT for Management: Introduction to Spreadsheets
Spreadsheet Development – 3 Start simply:
Do not try to build a large complex spreadsheet model containing features/functions you have never used before.
Try out any new features/functions you want to use, by building a small controlled example.
Test each stage in the development of your spreadsheet model: testing each new feature/function you add;
gradually incorporating all of the functionality required.
Don't get too clever, too soon!
Ian Perry Slide 2044095: IT for Management: Introduction to Spreadsheets
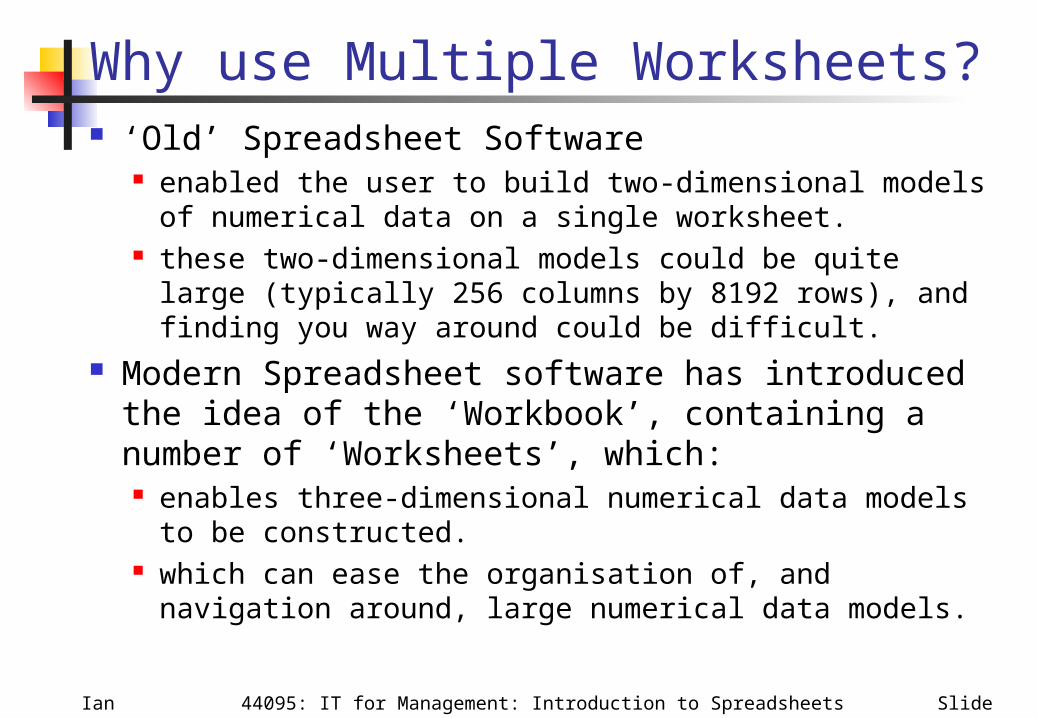
Why use Multiple Worksheets? ‘Old’ Spreadsheet Software
enabled the user to build two-dimensional models of numerical data on a single worksheet.
these two-dimensional models could be quite large (typically 256 columns by 8192 rows), and finding you way around could be difficult.
Modern Spreadsheet software has introduced the idea of the ‘Workbook’, containing a number of ‘Worksheets’, which: enables three-dimensional numerical data models
to be constructed. which can ease the organisation of, and navigation
around, large numerical data models.
Ian Perry Slide 2144095: IT for Management: Introduction to Spreadsheets
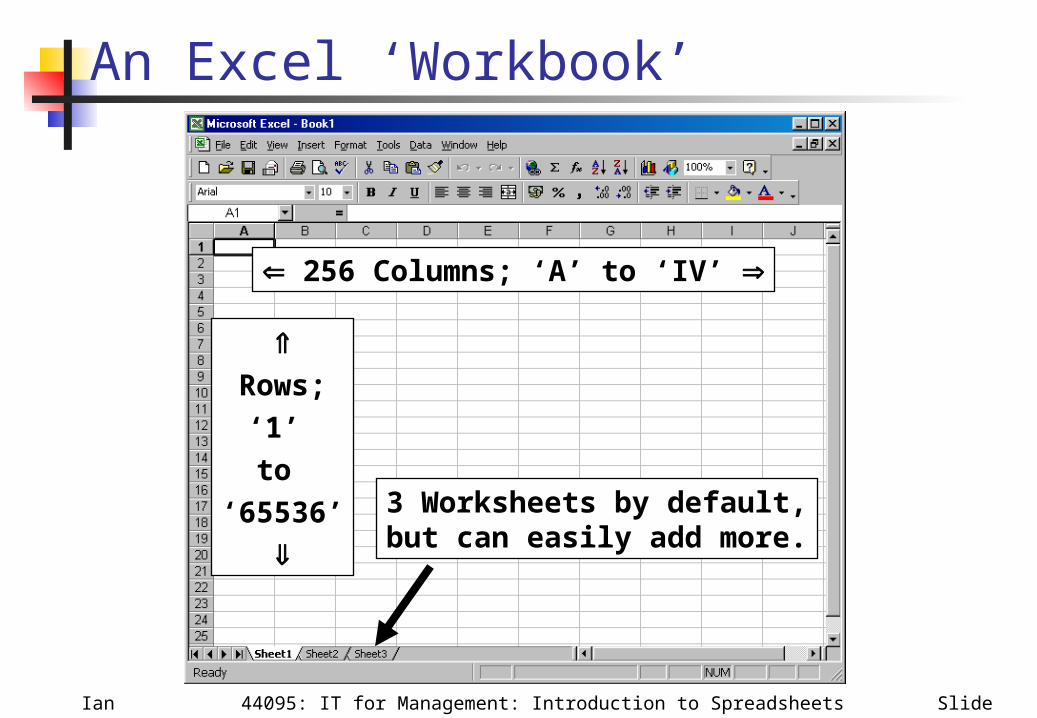
An Excel ‘Workbook’
256 Columns; ‘A’ to ‘IV’
Rows;
‘1’
to
‘65536’
3 Worksheets by default,but can easily add more.

Ian Perry Slide 2244095: IT for Management: Introduction to Spreadsheets
To add a New Worksheet
• Pull-down the ‘Insert’ Menu• Select ‘Worksheet’
Ian Perry Slide 2344095: IT for Management: Introduction to Spreadsheets
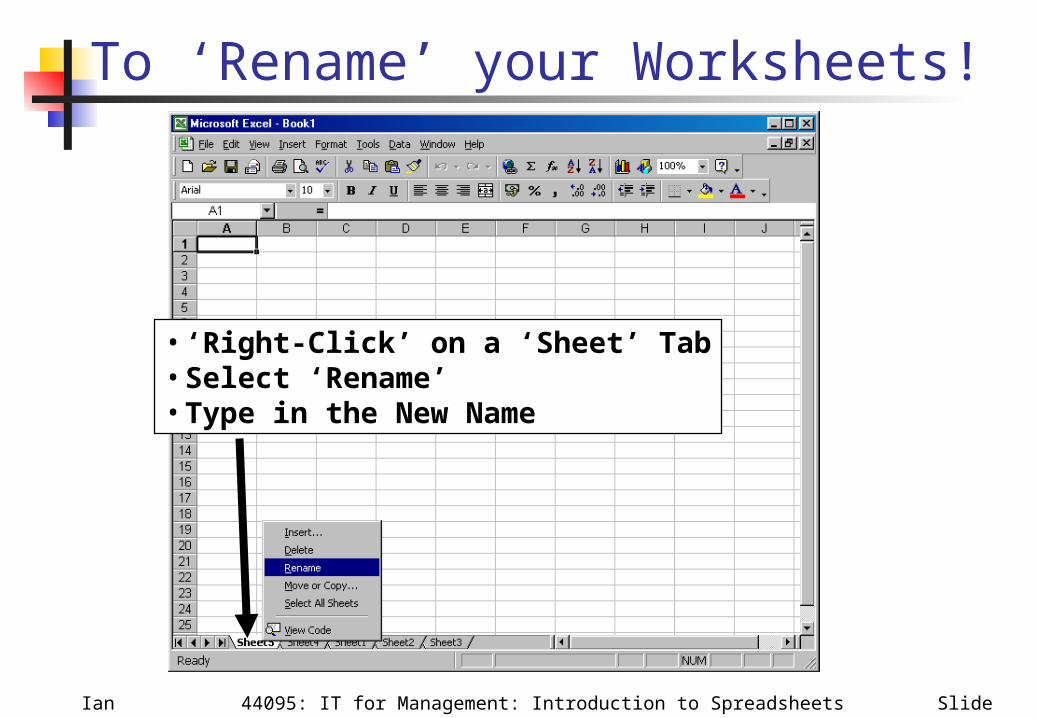
To ‘Rename’ your Worksheets!
• ‘Right-Click’ on a ‘Sheet’ Tab• Select ‘Rename’ • Type in the New Name
Ian Perry Slide 2444095: IT for Management: Introduction to Spreadsheets
This Week’s Workshop – Part 2 Create the Spreadsheet, and set-up the
Worksheets, for Part 2 of the Assignment. Your spreadsheet model;
must be able to accept the input of 11 items of data. and should be capable of producing an automatically
calculated, and accurate, “Motor Insurance Quotation”.
based upon a series of “Rules to Apply”. You therefore need to develop a Spreadsheet
containing 3 Worksheets, i.e.:1. for Input;
where the 11 items of data will be captured.2. for Output;
where the “Motor Insurance Quotation” will be displayed.3. for Lookup;
where all of tables of data representing the “Rules to Apply” will be stored.