Embed Size (px)
Citation preview
4380 (RP-675)
AIVC #12,995
Air Filter Performance Under Variable Air Volume Conditions
Richard D. Rivers Fellow/Life Member ASHRAE
David J. Murphy, Jr. Member ASHRAE
ABSTRACT
Samples of 31 different air filters, representative of the designs and efficiency range of those used in general ventilation, were tested at constant airflow. The complete array of ASHRAE Standard 52.1 tests was run on these filters, plus particle-size efficiency tests and tests measuring the reentrainment of dust from the filters when subjected to ultra-clean air flow. Additional samples of the same filters were then subjected to the same test array, except that VAV flow was simulated. No significant difference was noted between the results using constant flow and VAV flow; low efficiency filters did, however, show substantial reentrainment for both cases. Additional studies of the filter media resistance showed that media resistance as a function of media airflow velocity can be predicted from media geometry more accurately than by existing theories if media compression under airflow is taken into account. Expressions for overall filter resistance as a fanction of filter flow and means for obtaining their coefficients are given.
INTRODUCTION
The overall goal of this study was to develop a means to predict air filter resistance and particle-size efficiency for air filters in HVAC systems operating in the variable air volume (VAV) mode. It is well known that the airflow resistance of filters is dependent on air velocity. In addition, the dustcapture efficiency of filters might be lower (or higher) when filters operate above or below the velocity recommended by their manufacturers for constant-flow systems.
There has also been concern that the intermittent rise and fall of air velocity through filter media under VAY operation might dislodge captured dust or even fracture media fibers enough to affect air quality significantly. The established
ASHRAE 52.1 Air Filter Test Standard (ASHRAE 1992) does not attempt to simulate variable air flow performance.
Past experience had shown that coarse-fiber, low-efficiency filters do retain captured dust rather poorly, while finefiber, high-efficiency filters do not show this effect significantly. It thus seemed appropriate to test a wide range of filter types, including designs with flexible gross structures as well as those that held their media in relatively rigid structures. A variety of filter media fibers and ASHRAE dust-spot efficiencies were also included in the samples studied. A two-stage ionizer/plate type electrostatic air cleaner was also included in the study to see if it, too, suffered efficiency degradation under VAY conditions.
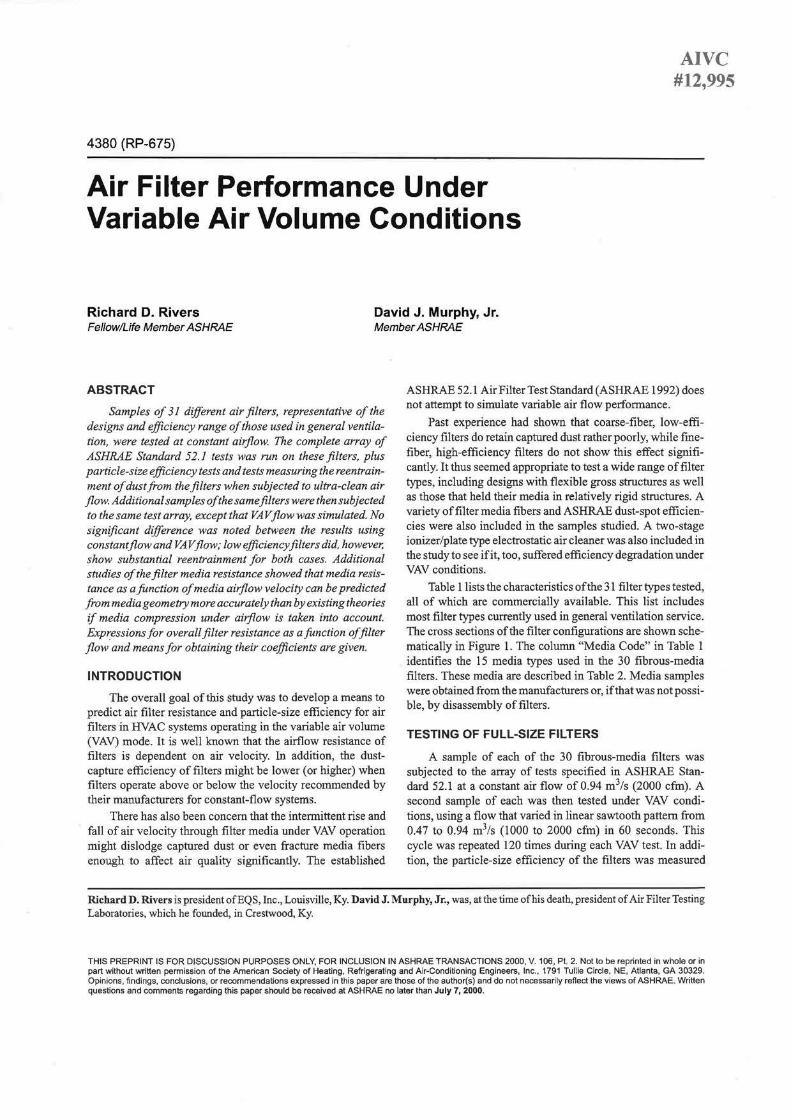
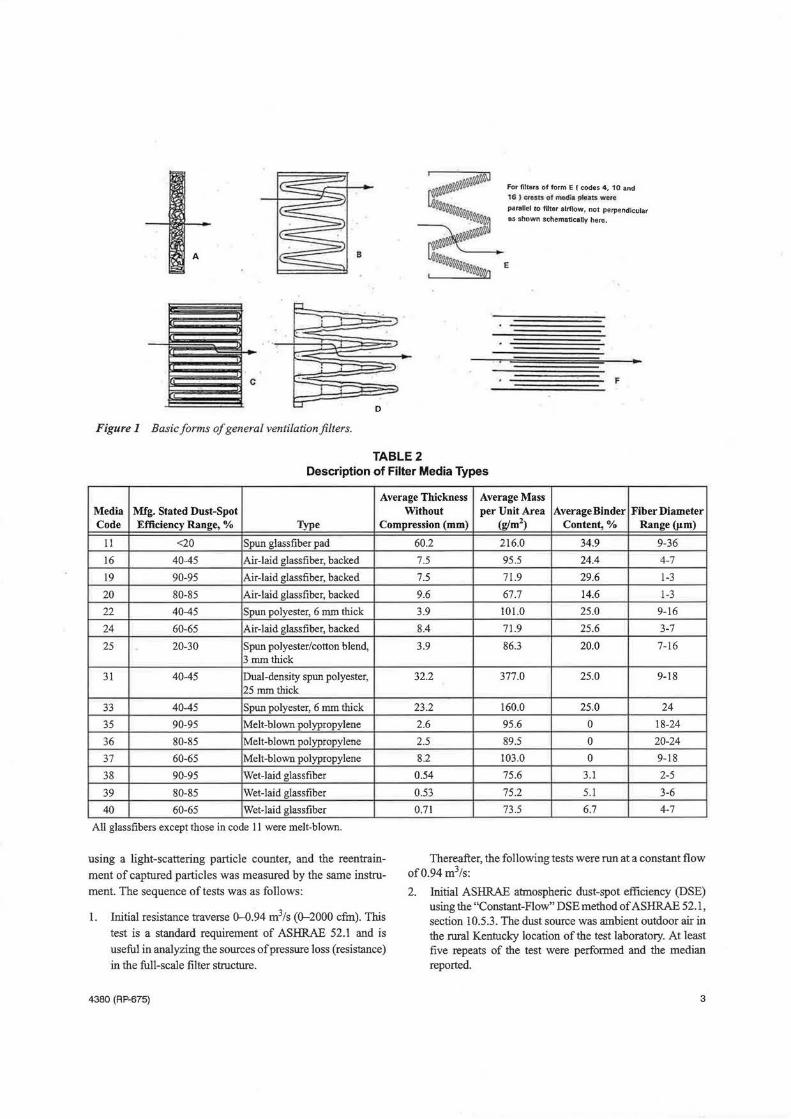
Table 1 lists the characteristics of the 31 filter types tested, all of which are commercially available. This list includes most filter types currently used in general ventilation service. The cross sections of the filter configurations are shown schematically in Figure 1. The column "Media Code" in Table 1 identifies the 15 media types used in the 30 fibrous-media filters. These media are described in Table 2. Media samples were obtained from the manufacturers or, if that was not possible, by disassembly of filters.
TESTING OF FULL-SIZE FILTERS
A sample of each of the 30 fibrous-media filters was subjected to the array of tests specified in ASHRAE Standard 52.1 at a constant air flow of 0.94 m3 Is (2000 cfm). A second sample of each was then tested under VAY conditions, using a flow that varied in linear sawtooth pattern from 0.47 to 0.94 m3/s (1000 to 2000 cfm) in 60 seconds. This cycle was repeated 120 times during each VAY test. In addition, the particle-size efficiency of the filters was measured
Richard D. Rivers is president ofEQS, Inc., Louisville, Ky. David J. Murphy, Jr., was, at the time of his death, president of Air Filter Testing Laboratories, which he founded, in Crestwood, Ky.
THIS PREPRINT IS FOR DISCUSSION PURPOSES ONLY, FOR INCLUSION IN ASHRAE TRANSACTIONS 2000, V. 106, Pt. 2. Not to be reprinted in whole or in part without written permission of the American Society of Heating, Refrigerating and Air-Conditioning Engineers, Inc., 1791 Tullie Circle, NE, Atlanta, GA 30329. Opinions, findings, conclusions, or recommendations expressed in this paper are those of the author(s) and do not necessarily reflect the views of ASHRAE. Written questions and comments regarding this paper should be received at ASHRAE no later than July 7, 2000.
"'
.j:>. (,) CX> 0
'53 1' Ol -..J ~
TABLE 1 Summary Description of Filter Types
Dust-Spot Filter Efficiency Rigid/ Code Range,% Generic Filter Type Non-Rigid Form Depth (mm) Media Code Media Type
1 90-95 Pleated, with separators Rigid c 267 38 Wet-laid glassfiber
2 90-95 Pleated, with ribbon spacers Rigid c 96 38 Wet-laid glassfiber
3 90-95 Cartridge, internal supports Rigid B 267 19 Air-laid glassfiber
4 90-95 Multipanel minipleat Rigid E 267 38 Wet-laid glassfiber
5 90-95 Nonsupported bag Non D 737 19 Air-laid glassfiber
6 90-95 Nonsupported bag Non D 625 35 Blown polypropylene
7 80-85 Pleated, with separators Rigid c 267 39 Wet-laid glassfiber
8 80-85 Pleated, with ribbon spacers Rigid c 96 39 Wet-laid glassfiber
9 80-85 Cartridge, internal supports Rigid B 267 20 Air-laid glassfiber
JO 80-85 Multipanel minipleat Rigid E 267 39 Wet-laid glassfiber
11 80-85 Nonsupported bag Non D 737 20 Air-laid glassfiber
12 80-85 Nonsupported bag Non D 625 36 Blown polypropylene
13 60-65 Pleated, with separators Rigid c 267 40 Wet-laid glassfiber
14 60-65 Pleated, with ribbon spacers Rigid c 96 40 Wet-laid glassfiber
J5 60-65 Cartridge, internal supports Rigid B 267 24 Air-laid glassfiber
16 60-65 Multipanel minipleat Rigid E 267 40 Wet-laid glassfiber
17 60-65 Nonsupported bag Non D 737 24 Air-laid glassfiber
18 60-65 Nonsupported bag Non D 625 37 Blown polypropylene
19 40-45 Cartridge, external supports Rigid B 280 16 Air-laid glassfiber
20 40-45 Cartridge, external supports Rigid B 280 31 Dual-density spun polyester
21 40-45 Cartridge, nonsupported Non D 330 16 Air-laid glassfiber
22 40-45 Cartridge,nonsupported Non D 330 22 Spun polyester
23 40-45 Cartridge, nonsupported Non D 356 31 Dual-density spun polyester
24 40-45 Cartridge, nonsupported Non D 356 31 Dual-density spun polyester with wire grid
25 20-25 Cartridge, nonsupported Non D 280 25 Spun polyester/cotton
26 20-30 Pleated panel Rigid B 48 25 Spun polyester/cotton
27 20-30 Pleated panel Rigid B 98 25 Spun polyester/cotton
28 20-30 Replacement pad Rigid A 48 31 Dual-density spun polyester
29 20-30 Ring panel Rigid A 25 33 Spun polyester
30 80-85 Ionizer/plate electronic Rigid F J28 NA None
31 <20 Industrial spun glass pad Rigid A 48 II Spun fiberglass pad
The individual panels making up filters 4, JO, and 16 had depths of25 mm.
Initial Resis. @ Media Area (m2) 0.94 m3/s Pa
10.03 140
10.10 170
5.20 215
18.02 68
7.7J 130
8.40 115
J0.03 IJO
JO.JO 155
5.20 J83
18.02 78
7.71 110
8.40 118
10.03 78
10.10 113
5.20 110
18.02 90
7.71 63
3.80 30
5.21 70
5.2J 83
2.98 55
2.98 58
1.40 63
1.40 60
2.23 68
1.67 58
2.41 63
0.372 98
0.372 63
NA 28
0.372 33
IC-== _, l(c:
-=-
-=-A
~c Figure 1 Basic forms of general ventilation filters.
B
0
For filters of form E {codes 4, 10 and
16 ) cte.aa: of me<f11 pleats we1e
parallel to filter alrflow, not perpendicular i!llS shown schematically here.
E
F
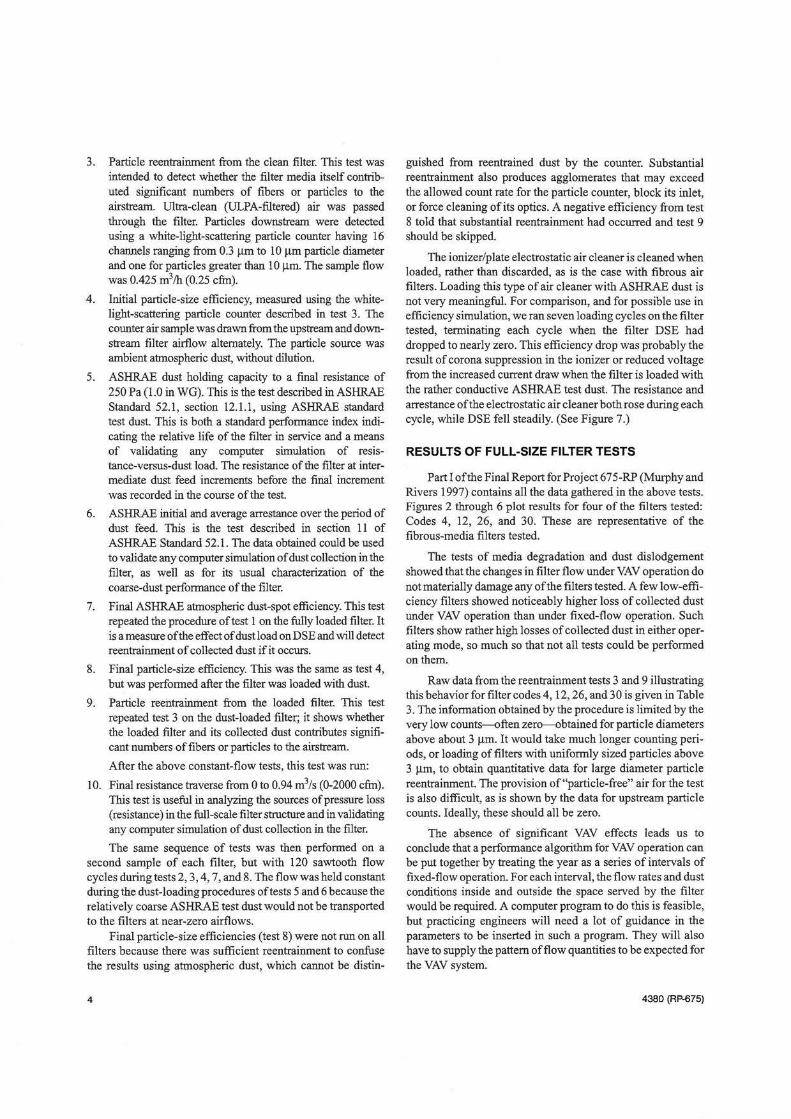
TABLE2 Description of Filter Media Types
Average Thickness Average Mass Media Mfg. Stated Dust-Spot Without per Unit Area Average Binder Fiber Diameter Code Efficiency Range, % Type Compression (mm) (g/m2) Content,% Range(µm)
11 <20 Spun glassfiber pad
16 40-45 Air-laid glassfiber, backed
19 90-95 Air-laid glassfiber, backed
20 80-85 Air-laid glassfiber, backed
22 40-45 Spun polyester, 6 mm thick
24 60-65 Air-laid glassfiber, backed
25 20-30 Spun polyester/cotton blend, 3 mm thick
31 40-45 Dual-density spun polyester, 25 mm thick
33 40-45 Spun polyester, 6 mm thick
35 90-95 Melt-blown polypropylene
36 80-85 Melt-blown polypropylene
37 60-65 Melt-blown polypropylene
38 90-95 Wet-laid glassfiber
39 80-85 Wet-laid glassfiber
40 60-65 Wet-laid glassfiber
All glassfibers except those in code 11 were melt-blown.
using a light-scattering particle counter, and the reentrainment of captured particles was measured by the same instrument. The sequence of tests was as follows:
l. Initial resistance traverse 0--0.94 m3/s (0-2000 cfm). This test is a standard requirement of ASHRAE 52.1 and is useful in analyzing the sources of pressure loss (resistance) in the full-scale filter structure.
4380 (RP-675)
60.2 216.0 34.9 9-36
7.5 95.5 24.4 4-7
7.5 71.9 29.6 1-3
9.6 67.7 14.6 1-3
3.9 101.0 25.0 9-16
8.4 71.9 25.6 3-7
3.9 86.3 20.0 7-16
32.2 377.0 25.0 9-18
23.2 160.0 25.0 24
2.6 95.6 0 18-24
2.5 89.5 0 20-24
8.2 103.0 0 9-18
0.54 75.6 3.1 2-5
0.53 75.2 5.1 3-6
0.71 73.5 6.7 4-7
Thereafter, the following tests were run at a constant flow of0.94 m3/s:
2. Initial ASHRAE atmospheric dust-spot efficiency (DSE) using the "Constant-Flow" DSE method of ASHRAE 52.1, section 10.5.3. The dust source was ambient outdoor air in the rural Kentucky location of the test laboratory. At least five repeats of the test were performed and the median reported.
3
3. Particle reentrainment from the clean filter. This test was intended to detect whether the filter media itself contributed significant numbers of fibers or particles to the airstream. Ultra-clean (ULPA-filtered) air was passed through the filter. Particles downstream were detected using a white-light-scattering particle counter having 16 channels ranging from 0.3 µm to 10 µm particle diameter and one for particles greater than 10 µm. The sample flow was 0.425 m3/h (0.25 cfrn).
4. Initial particle-size efficiency, measured using the whitelight-scattering particle counter described in test 3. The counter air sample was drawn from the upstream and downstream filter airflow alternately. The particle source was ambient atmospheric dust, without dilution.
5. ASHRAE dust holding capacity to a final resistance of 250 Pa (1.0 in WG). This is the test described in ASHRAE Standard 52.1, section 12.1.1, using ASHRAE standard test dust. This is both a standard performance index indicating the relative life of the filter in service and a means of validating any computer simulation of resistance-versus-dust load. The resistance of the filter at intermediate dust feed increments before the final increment was recorded in the course of the test.
6. ASHRAE initial and average arrestance over the period of dust feed. This is the test described in section 11 of ASHRAE Standard 52.1. The data obtained could be used to validate any computer simulation of dust collection in the filter, as well as for its usual characterization of the coarse-dust performance of the filter.
7. Final ASHRAE atmospheric dust-spot efficiency. This test repeated the procedure oftest 1 on the fully loaded filter. It is a measure of the effect of dust load on DSE and will detect reentrainment of collected dust if it occurs.
8. Final particle-size efficiency. This was the same as test 4, but was performed after the filter was loaded with dust.
9. Particle reentrainment from the loaded filter. This test repeated test 3 on the dust-loaded filter; it shows whether the loaded filter and its collected dust contributes significant numbers of fibers or particles to the airstream.
After the above constant-flow tests, this test was run:
10. Final resistance traverse from 0 to 0.94 m3/s (0-2000 cfrn). This test is useful in analyzing the sources of pressure loss (resistance) in the full-scale filter structure and in validating any computer simulation of dust collection in the filter.
The same sequence of tests was then performed on a second sample of each filter, but with 120 sawtooth flow cycles during tests 2, 3, 4, 7, and 8. The flow was held constant during the dust-loading procedures of tests 5 and 6 because the relatively coarse ASHRAE test dust would not be transported to the filters at near-zero airflows.
Final particle-size efficiencies (test 8) were not run on all filters because there was sufficient reentrainment to confuse the results using atmospheric dust, which cannot be distin-
4
guished from reentrained dust by the counter. Substantial reentrainment also produces agglomerates that may exceed the allowed count rate for the particle counter, block its inlet, or force cleaning of its optics. A negative efficiency from test 8 told that substantial reentrainment had occurred and test 9 should be skipped.
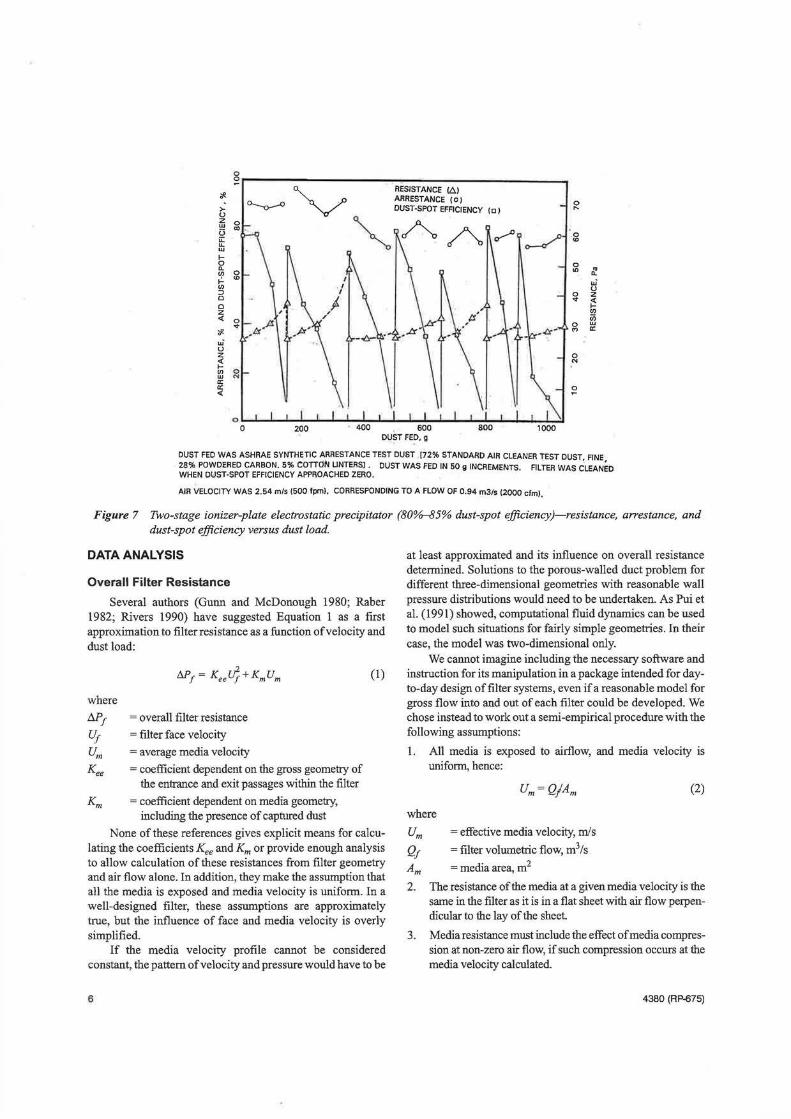
The ionizer/plate electrostatic air cleaner is cleaned when loaded, rather than discarded, as is the case with fibrous air filters. Loading this type of air cleaner with ASHRAE dust is not very meaningful. For comparison, and for possible use in efficiency simulation, we ran seven loading cycles on the filter tested, terminating each cycle when the filter DSE had dropped to nearly zero. This efficiency drop was probably the result of corona suppression in the ionizer or reduced voltage from the increased current draw when the filter is loaded with the rather conductive ASHRAE test dust. The resistance and arrestance of the electrostatic air cleaner both rose during each cycle, while DSE fell steadily. (See Figure 7.)
RESULTS OF FULL-SIZE FILTER TESTS
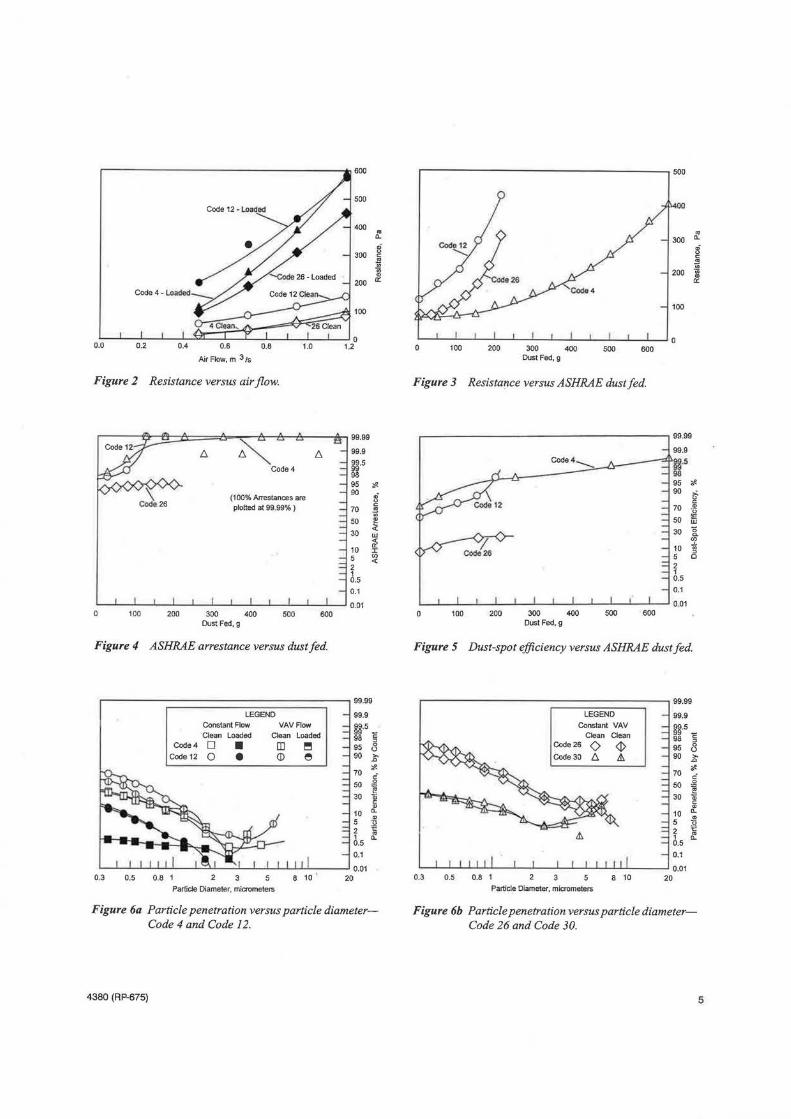
Part I of the Final Report for Project 675-RP (Murphy and Rivers 1997) contains all the data gathered in the above tests. Figures 2 through 6 plot results for four of the filters tested: Codes 4, 12, 26, and 30. These are representative of the fibrous-media filters tested.
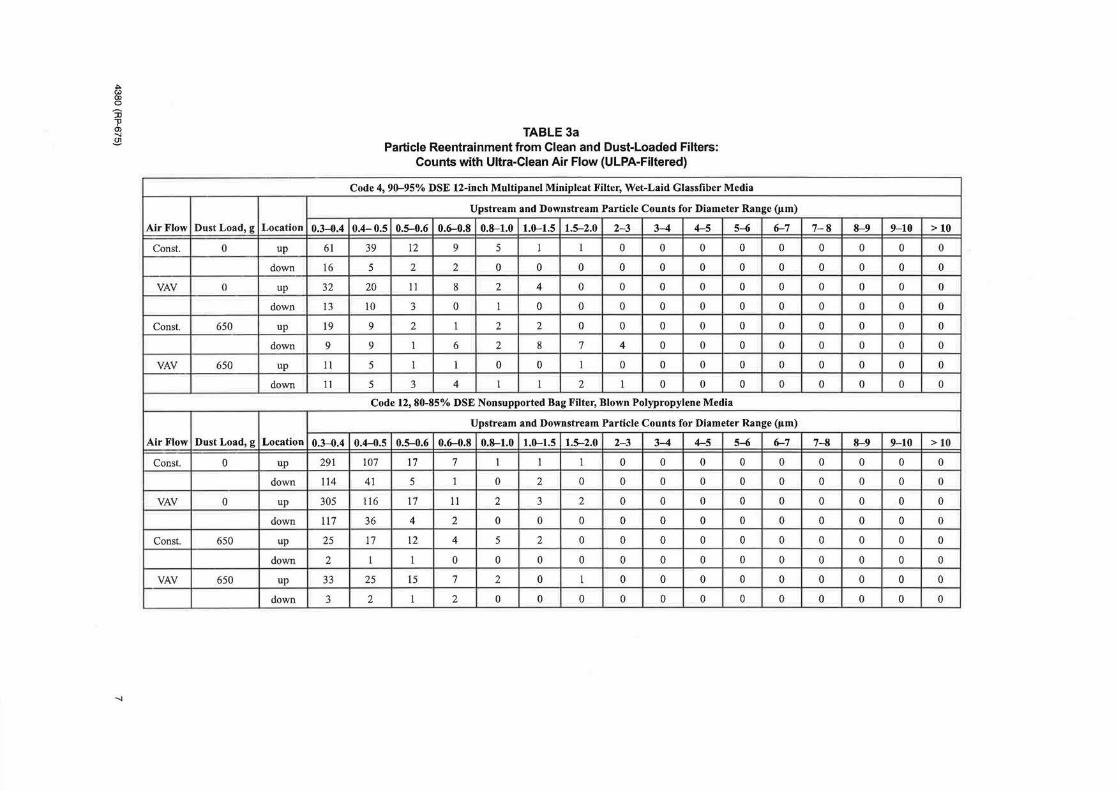
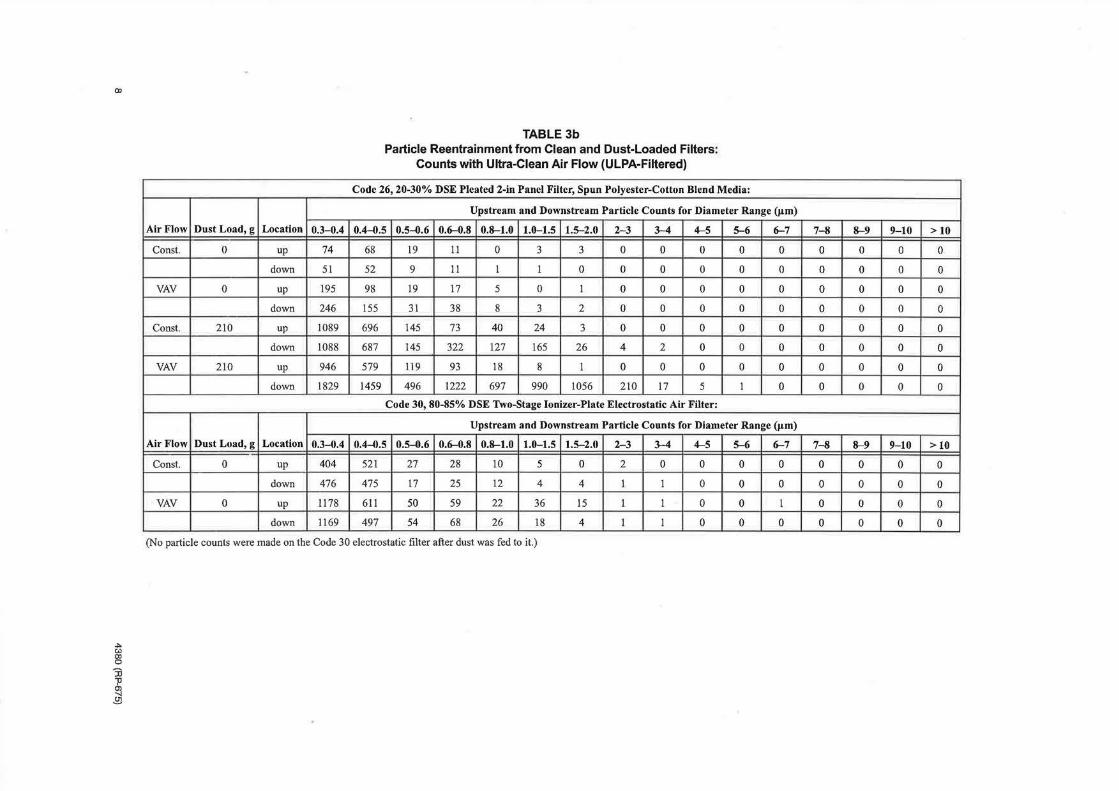
The tests of media degradation and dust dislodgement showed that the changes in filter flow under VAV operation do not materially damage any of the filters tested. A few low-efficiency filters showed noticeably higher loss of collected dust under VAY operation than under fixed-flow operation. Such filters show rather high losses of collected dust in either operating mode, so much so that not all tests could be performed on them.
Raw data from the reentrainment tests 3 and 9 illustrating this behavior for filter codes 4, 12, 26, and 30 is given in Table 3. The information obtained by the procedure is limited by the very low counts---often zero--obtained for particle diameters above about 3 µm. It would take much longer counting periods, or loading of filters with uniformly sized particles above 3 µm, to obtain quantitative data for large diameter particle reentrainment. The provision of "particle-free" air for the test is also difficult, as is shown by the data for upstream particle counts. Ideally, these should all be zero.
The absence of significant VAV effects leads us to conclude that a performance algorithm for VAY operation can be put together by treating the year as a series of intervals of fixed-flow operation. For each interval, the flow rates and dust conditions inside and outside the space served by the filter would be required. A computer program to do this is feasible, but practicing engineers will need a lot of guidance in the parameters to be inserted in such a program. They will also have to supply the pattern of flow quantities to be expected for the VAY system.
4380 (RP-675)
600
500
400 "' 0..
300 fi ~ u;
" 200 a::
100
0.0 0.2 0.4 0.6 0.8 1.0
Air Flow, m 3 Is
Figure 2 Resistance versus air flow.
~ ~ ~ B~ 99.99
/:;. /:;. 99.9
Code4 ~-5 98 95 * (100% Arrestances are ~ 90 f plotted at 99.99% ) 70
50 ~ 30 w
10 ;i; I
5 Cl) <(
2 1 0.5
0.1
0.01 100 200 300 400 500 600
DustFed,g
Figure 4 ASHRAE arrestance versus dust fed.
....-------============;-] 99.99 ., 99.9 LEGEND
Constant Flow aean Loaded
Code4 D • Code12 0 e
VAVFlow
Clean Loaded
DJ ~ <D e
3§·5 -98 § 95 8 90 ~
:.-'! 70 °,: 50 g
l" 30 i1
" 10 r; 5 g 2 1ii , 0.. 0.5
0.1 I I I I I e, I -,. I ! I I I I I I 0.01 I I I I . . . . · 20
0.3 0.5 0.8 , 2 8 10
Particle Diameter, micrometers
Figure 6a Particle penetration versus particle diameterCode 4 and Code 12.
4380 (RP-675)
r--- --------- - -------- --.,500
100 200 300 400 500 600 Dust Fed, g
Figure 3 Resistance versus ASHRAE dust fed.
100 200
Code4-..._ -
300 400 Dust Fed, g
500 600
"' 300 0..
~ .!!!
200 -~ .. "'
100
99.99
99.9
n·s 98 95 * 90
~ 70 ~ 50 in 30 8.
Cl)
10 ~ 5 0
2 1 0.5
0.1
0.01
Figure 5 Dust-spot efficiency versus ASHRAE dust fed .
0.3 0.5 0.8 1 2
LEGEND
Constant VAV Clean aean
Code26 () ~ Code30 /:;. Lt:.
.11.
3 8 10 Particle Diameter, micrometers
20
99.99
99.9
~-5 -98 § 95 0
u 90 ,..
.c
70 * .: 50 0
~ 30 a;
c:
" 10 0.. .. 5 " 2 ~ , 0.. 0.5
0.1
0.01
Figure 6b Particle penetration versus particle diameterCode 26 and Code 30.
5
0 ~
RESISTANCE (Ll.)
~~ v ARREST~TC~F~l~:ENCY (o) DUST-S
~~.g
*
~ ~ A .r'°
>-u z
r· w
ID 0..
u
/~ w'
ii:
N.1/ u
u.
0 z
w
-t ~
f-0
l CJ)
D..
iii
en
0 w
~
"' "' ,,_
::i 0 0 z <(
* w' u
I I \ -I ~ I \ I \ I \ \ I \ I z I <(
f- 0 [!! N
"' \. -I ~ II \ I \ I \ I II \ I I "' <(
0 400 0 200 600
DUST FED. g 800 1000
DUST FED WAS ASHRAE SYNTHETIC ARRESTANCE TEST DUST [72% STANDARD AIR CLEANER TEST DUST, FINE 28% POWDERED CARBON. 5% COTION LINTERSJ. DUST WAS FED IN 50 g INCREMENTS. FILTER WAS CLEANED WHEN DUST-SPOT EFFICIENCY APPROACHED ZERO.
AIR VELOCITY WAS 2.54 m/s 1500 !pm), CORRESPONDING TO A FLOW OF 0.94 m3/s 12000 cfm).
Figure 7 Two-stage ionizer-plate electrostatic precipitator (80'Ya-85% dust-spot efficiency)-resistance, arrestance, and dust-spot efficiency versus dust load.
DATA ANALYSIS
Overall Filter Resistance
Several authors (Gunn and McDonough 1980; Raber 1982; Rivers 1990) have suggested Equation 1 as a first approximation to filter resistance as a function of velocity and dust load:
Mr= KeeuJ.+KmUm
where
M 1 = overall filter resistance
u1 = filter face velocity
um Kee
Km
= average media velocity
= coefficient dependent on the gross geometry of the entrance and exit passages within the filter
= coefficient dependent on media geometry, including the presence of captured dust
(1)
None of these references gives explicit means for calculating the coefficients Kee and Km or provide enough analysis to allow calculation of these resistances from filter geometry and air flow alone. In addition, they make the assumption that all the media is exposed and media velocity is uniform. In a well-designed filter, these assumptions are approximately true, but the influence of face and media velocity is overly simplified.
If the media velocity profile cannot be considered constant, the pattern of velocity and pressure would have to be
6
at least approximated and its influence on overall resistance determined. Solutions to the porous-walled duct problem for different three-dimensional geometries with reasonable wall pressure distributions would need to be undertaken. As Pui et al. (1991) showed, computational fluid dynamics can be used to model such situations for fairly simple geometries. In their case, the model was two-dimensional only.
We cannot imagine including the necessary software and instruction for its manipulation in a package intended for dayto-day design of filter systems, even if a reasonable model for gross flow into and out of each filter could be developed. We chose instead to work out a semi-empirical procedure with the following assumptions:
1. All media is exposed to airflow, and media velocity is uniform, hence:
Um= QJAm (2)
where
um =effective media velocity, mis Qt =filter volumetric flow, m3 /s
Am =media area, m2
2. The resistance of the media at a given media velocity is the same in the filter as it is in a flat sheet with air flow perpendicular to the lay of the sheet.
3. Media resistance must include the effect of media compression at non-zero air flow, if such compression occurs at the media velocity calculated.
4380 (RP-675)
~ OJ 0
JJ 1' (J)
" ~
"
Air Flow
Const.
VAV
Const.
VAV
Air Flow
Const.
VAV
Const.
VAV
Dust Load, g
0
0
650
650
Dust Load, g
0
0
650
650
Location 0.3--0.4
up 61
down 16
up 32
down 13
up 19
down 9
up 11
down 11
Location 0.3--0.4
up 291
down 114
up 305
down 117
up 25
down 2
up 33
down 3
TABLE 3a Particle Reentrainment from Clean and Dust-Loaded Filters:
Counts with Ultra-Clean Air Flow (ULPA-Filtered)
Code 4, 90--95% DSE 12-inch Multipanel Minipleat Filter, Wet-Laid Glassfiber Media
Upstream and Downstream Particle Counts for Diameter Range (µm)
0.4-0.5 0.5-0.6 0.6-0.8 0.8-1.0 1.0--1.5 1.5-2.0 2-3 3-4 4-5 5-6 6-7 7-8 8-9 9-10 > 10
39 12 9 5 1 1 0 0 0 0 0 0 0 0 0
5 2 2 0 0 0 0 0 0 0 0 0 0 0 0
20 11 8 2 4 0 0 0 0 0 0 0 0 0 0
10 3 0 1 0 0 0 0 0 0 0 0 0 0 0
9 2 1 2 2 0 0 0 0 0 0 0 0 0 0
9 1 6 2 8 7 4 0 0 0 0 0 0 0 0
5 1 1 0 0 1 0 0 0 0 0 0 0 0 0
5 3 4 1 1 2 1 0 0 0 0 0 0 0 0
Code 12, 80-85% DSE Nonsupported Bag Filter, Blown Polypropylene Media
Upstream and Downstream Particle Counts for Diameter Range (µm)
0.4--0.5 0.5-0.6 0.6-0.8 0.8-1.0 1.0--1.5 1.5-2.0 2-3 3-4 4-5 5-6 6-7 7-8 8-9 9-10 > 10
107 17 7 1 1 1 0 0 0 0 0 0 0 0 0
41 5 1 0 2 0 0 0 0 0 0 0 0 0 0
116 17 11 2 3 2 0 0 0 0 0 0 0 0 0
36 4 2 0 0 0 0 0 0 0 0 0 0 0 0
17 12 4 5 2 0 0 0 0 0 0 0 0 0 0
1 1 0 0 0 0 0 0 0 0 0 0 0 0 0
25 15 7 2 0 1 0 0 0 0 0 0 0 0 0
2 1 2 0 0 0 0 0 0 0 0 0 0 0 0
Ql
""' "' gi J3 "P
~
TABLE 3b Particle Reentrainment from Clean and Dust-Loaded Filters:
Counts with Ultra-Clean Air Flow {ULPA-Filtered)
Code 26, 20-30% DSE Pleated 2-in Panel Filter, Spun Polyester-Cotton Blend Media:
Upstream and Downstream Particle Counts for Diameter Range (µm)
Air Flow Dust Load, g Location 0.3-0.4 0.4-0.5 0.5-0.6 0.6-0.8 0.8-1.0 1.0-1.5 1.5-2.0 2-3 3-4 4-5 5-6 6-7
Const. 0 up 74 68 19 11 0 3 3 0 0 0 0 0
down 51 52 9 11 1 1 0 0 0 0 0 0
VAV 0 up 195 98 19 17 5 0 1 0 0 0 0 0
down 246 155 31 38 8 3 2 0 0 0 0 0
Const. 210 up 1089 696 145 73 40 24 3 0 0 0 0 0
down 1088 687 145 322 127 165 26 4 2 0 0 0
VAV 210 up 946 579 119 93 18 8 1 0 0 0 0 0
down 1829 1459 496 1222 697 990 1056 210 17 5 1 0
Code 30, 80-85% DSE Two-Stage Ionizer-Plate Electrostatic Air Filter:
Upstream and Downstream Particle Counts for Diameter Range (µm)
Air Flow Dust Load, g Location 0.3-0.4 0.4-0.5 0.5-0.6 0.6-0.8 0.8-1.0 1.0-1.5 1.5-2.0 2-3 3-4 4-5 5-6 6-7
Const. 0 up 404 521 27 28 10 5 0 2 0 0 0 0
down 476 475 17 25 12 4 4 1 1 0 0 0
VAV 0 up 1178 611 50 59 22 36 15 1 1 0 0 1
down 1169 497 54 68 26 18 4 1 I 0 0 0
(No particle counts were made on the Code 30 electrostatic filter after dust was fed to it.)
7-8 8-9 9-10 > 10
0 0 0 0
0 0 0 0
0 0 0 0
0 0 0 0
0 0 0 0
0 0 0 0
0 0 0 0
0 0 0 0
7-8 8-9 9-10 > 10
0 0 0 0
0 0 0 0
0 0 0 0
0 0 0 0
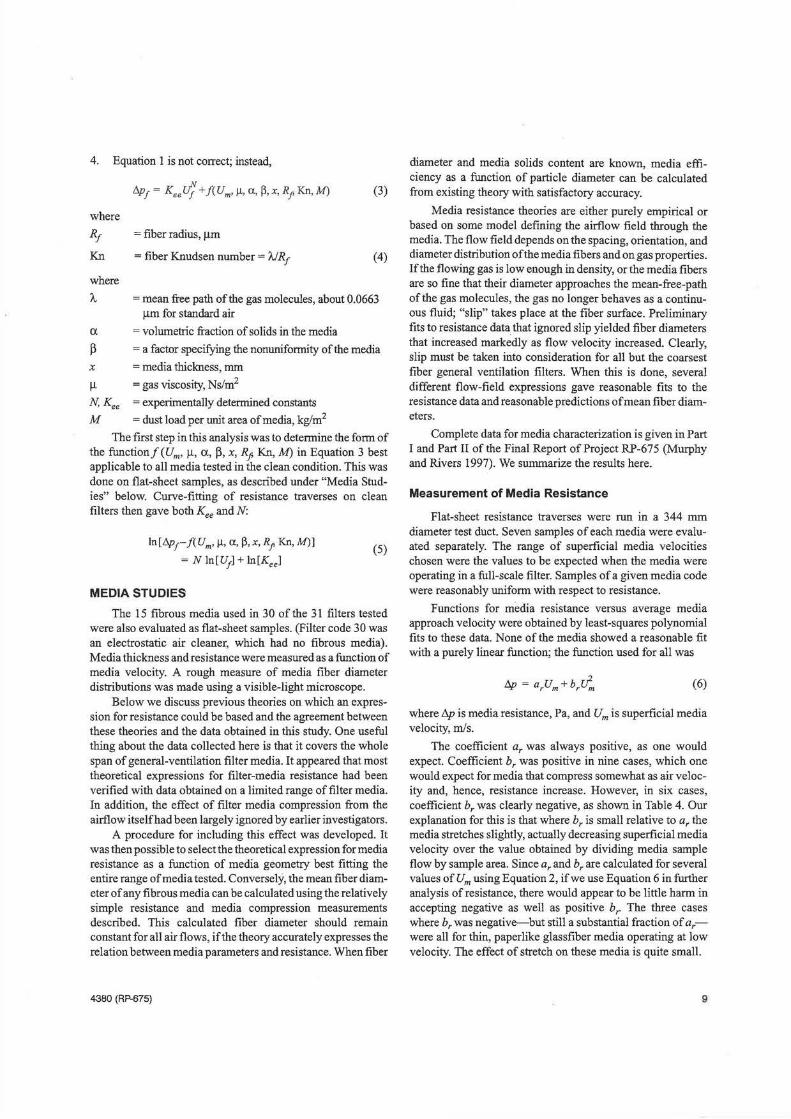
4. Equation 1 is not correct; instead,
where
Rf
Kn
where
/...,
a
~ x
µ
N, Kee
M
t;pf = Keeu;. + f(Um, µ,a,~' x, Rf Kn, M) (3)
= fiber radius, µm
=fiber Knudsen number= IJR1 (4)
=mean free path of the gas molecules, about 0.0663 µm for standard air
= volumetric fraction of solids in the media
=a factor specifying the nonuniforrnity of the media
= media thickness, mm
=gas viscosity, Ns/m2
= experimentally determined constants
= dust load per unit area of media, kg/m2
The first step in this analysis was to determine the form of the function/ (Um, µ,a, ~, x, Rfi Kn, M) in Equation 3 best applicable to all media tested in the clean condition. This was done on flat-sheet samples, as described under "Media Studies" below. Curve-fitting of resistance traverses on clean filters then gave both Kee and N:
ln[t;pr f(Um' µ,a,~, x, Rf Kn, M)]
= N ln[U1] + ln[Kee1
MEDIA STUDIES
(5)
The 15 fibrous media used in 30 of the 31 filters tested were also evaluated as flat-sheet samples. (Filter code 30 was an electrostatic air cleaner, which had no fibrous media). Media thickness and resistance were measured as a function of media velocity. A rough measure of media fiber diameter distributions was made using a visible-light microscope.
Below we discuss previous theories on which an expression for resistance could be based and the agreement between these theories and the data obtained in this study. One useful thing about the data collected here is that it covers the whole span of general-ventilation filter media. It appeared that most theoretical expressions for filter-media resistance had been verified with data obtained on a limited range of filter media. In addition, the effect of filter media compression from the airflow itselfhad been largely ignored by earlier investigators.
A procedure for including this effect was developed. It was then possible to select the theoretical expression for media resistance as a function of media geometry best fitting the entire range of media tested. Conversely, the mean fiber diameter of any fibrous media can be calculated using the relatively simple resistance and media compression measurements described. This calculated fiber diameter should remain constant for all air flows, if the theory accurately expresses the relation between media parameters and resistance. When fiber
4380 (RP-675)
diameter and media solids content are known, media efficiency as a function of particle diameter can be calculated from existing theory with satisfactory accuracy.
Media resistance theories are either purely empirical or based on some model defining the airflow field through the media. The flow field depends on the spacing, orientation, and diameter distribution of the media fibers and on gas properties. If the flowing gas is low enough in density, or the media fibers are so fine that their diameter approaches the mean-free-path of the gas molecules, the gas no longer behaves as a continuous fluid; "slip" takes place at the fiber surface. Preliminary fits to resistance data. that ignored slip yielded fiber diameters that increased markedly as flow velocity increased. Clearly, slip must be taken into consideration for all but the coarsest fiber general ventilation filters. When this is done, several different flow-field expressions gave reasonable fits to the resistance data and reasonable predictions of mean fiber diameters.
Complete data for media characterization is given in Part I and Part II of the Final Report of Project RP-675 (Murphy and Rivers 1997). We summarize the results here.
Measurement of Media Resistance
Flat-sheet resistance traverses were run in a 344 mm diameter test duct. Seven samples of each media were evaluated separately. The range of superficial media velocities chosen were the values to be expected when the media were operating in a full-scale filter. Samples of a given media code were reasonably uniform with respect to resistance.
Functions for media resistance versus average media approach velocity were obtained by least-squares polynomial fits to these data. None of the media showed a reasonable fit with a purely linear function; the function used for all was
t;p = arum+ b/.;;,, (6)
where !lp is media resistance, Pa, and Um is superficial media velocity, mis.
The coefficient ar was always positive, as one would expect. Coefficient br was positive in nine cases, which one would expect for media that compress somewhat as air velocity and, hence, resistance increase. However, in six cases, coefficient br was clearly negative, as shown in Table 4. Our explanation for this is that where br is small relative to ar the media stretches slightly, actually decreasing superficial media velocity over the value obtained by dividing media sample flow by sample area. Since ar and br are calculated for several values of Um using Equation 2, if we use Equation 6 in further analysis of resistance, there would appear to be little harm in accepting negative as well as positive br The three cases where br was negative-but still a substantial fraction of arwere all for thin, paperlike glassfiber media operating at low velocity. The effect of stretch on these media is quite small.
9
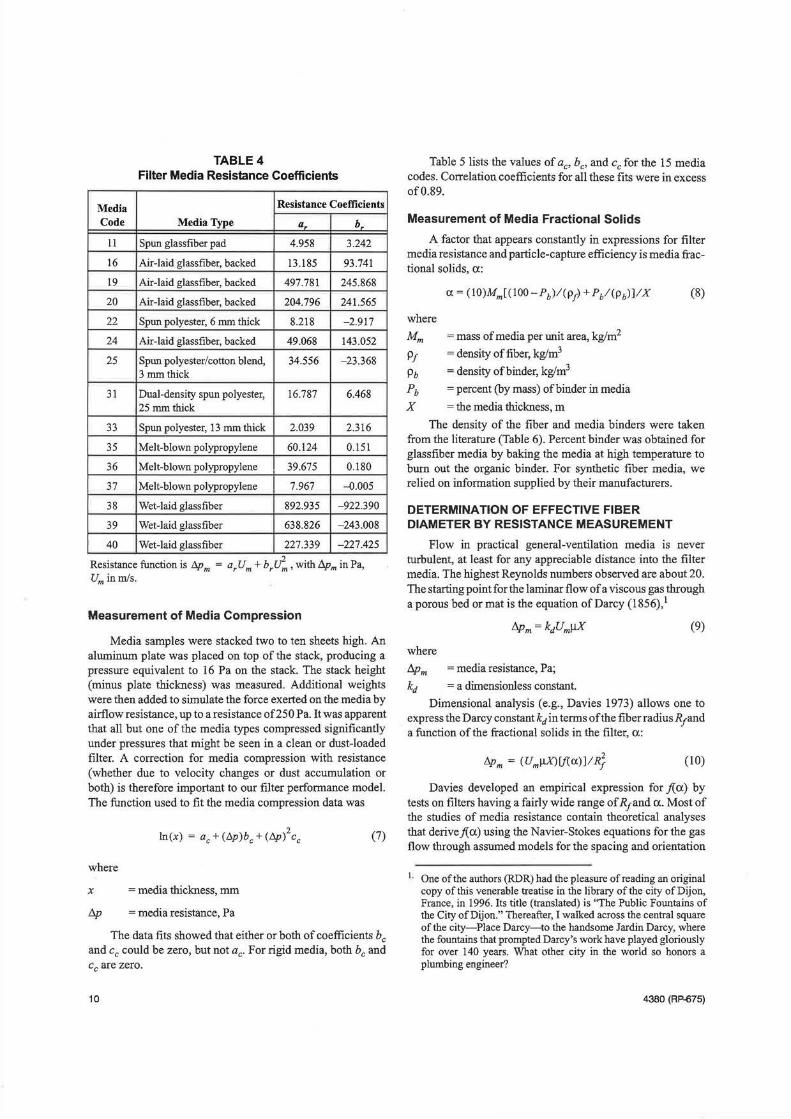
TABLE 4 Filter Media Resistance Coefficients
Media Resistance Coefficients
Code Media Type a, b,
11 Spun glassfiber pad 4.958 3.242
16 Air-laid glassfiber, backed 13.185 93.741
19 Air-laid glassfiber, backed 497.781 245.868
20 Air-laid glassfiber, backed 204.796 241.565
22 Spun polyester, 6 mm thick 8.218 -2.917
24 Air-laid glassfiber, backed 49.068 143.052
25 Spun polyester/cotton blend, 34.556 -23.368 3 mm thick
31 Dual-density spun polyester, 16.787 6.468 25 mm thick
33 Spun polyester, 13 mm thick 2.039 2.316
35 Melt-blown polypropylene 60.124 0.151
36 Melt-blown polypropylene 39.675 0.180
37 Melt-blown polypropylene 7.967 -0.005
38 Wet-laid glassfiber 892.935 -922.390
39 Wet-laid glassfiber 638.826 -243.008
40 Wet-laid glassfiber 227.339 -227.425
Resistance function is !¥Jm = a,Um + b,u;., with ~min Pa, um inm/s.
Measurement of Media Compression
Media samples were stacked two to ten sheets high. An aluminum plate was placed on top of the stack, producing a pressure equivalent to 16 Pa on the stack. The stack height (minus plate thickness) was measured. Additional weights were then added to simulate the force exerted on the media by airflow resistance, up to a resistance of250 Pa. It was apparent that all but one of the media types compressed significantly under pressures that might be seen in a clean or dust-loaded filter. A correction for media compression with resistance (whether due to velocity changes or dust accumulation or both) is therefore important to our filter performance model. The function used to fit the media compression data was
where
2 ln(x) = ac + (t:.p)bc + (!lp) cc
x = media thickness, mm
!:J.p = media resistance, Pa
(7)
The data fits showed that either or both of coefficients b c
and cc could be zero, but not ac. For rigid media, both be and cc are zero.
10
Table 5 lists the values of ac, be, and cc for the 15 media codes. Correlation coefficients for all these fits were in excess of0.89.
Measurement of Media Fractional Solids
A. factor that appears constantly in expressions for filter media resistance and particle-capture efficiency is media fractional solids, a:
a= (10)Mm[(100-Pb)l(p1) + Pb/(pb)]IX (8)
where
Mm =mass of media per unit area, kg/m2
PJ =density offiber, kg!m3
Pb =density ofbinder, kg!m3
Pb =percent (by mass) of binder in media
X = the media thickness, m
The density of the fiber and media binders were taken from the literature (Table 6). Percent binder was obtained for glassfiber media by baking the media at high temperature to bum out the organic binder. For synthetic fiber media, we relied on information supplied by their manufacturers.
DETERMINATION OF EFFECTIVE FIBER DIAMETER BY RESISTANCE MEASUREMENT
Flow in practical general-ventilation media is never turbulent, at least for any appreciable distance into the filter media. The highest Reynolds numbers observed are about 20. The starting point for the laminar flow of a viscous gas through a porous bed or mat is the equation of Darcy (1856), 1
/J.pm = kdUmµX (9)
where
/J.pm =media resistance, Pa;
kd = a dimensionless constant.
Dimensional analysis (e.g., Davies 1973) allows one to express the Darcy constant kdin terms of the fiber radius Rrand a function of the fractional solids in the filter, a:
2 !¥Jm = (UmµX)lfia)]IR1 (10)
Davies developed an empirical expression for j{a) by tests on filters having a fairly wide range of R1and a. Most of the studies of media resistance contain theoretical analyses that derive j{ a) using the N avier-Stokes equations for the gas flow through assumed models for the spacing and orientation
I. One of the authors (RDR) had the pleasure ofreading an original copy of this venerable treatise in the library of the city of Dijon, France, in 1996. Its title (translated) is "The Public Fountains of the City of Dijon." Thereafter, I walked across the central square of the city-Place Darcy-to the handsome Jardin Darcy, where the fountains that prompted Darcy's work have played gloriously for over 140 years. What other city in the world so honors a plumbing engineer?
4380 (RP-B75)
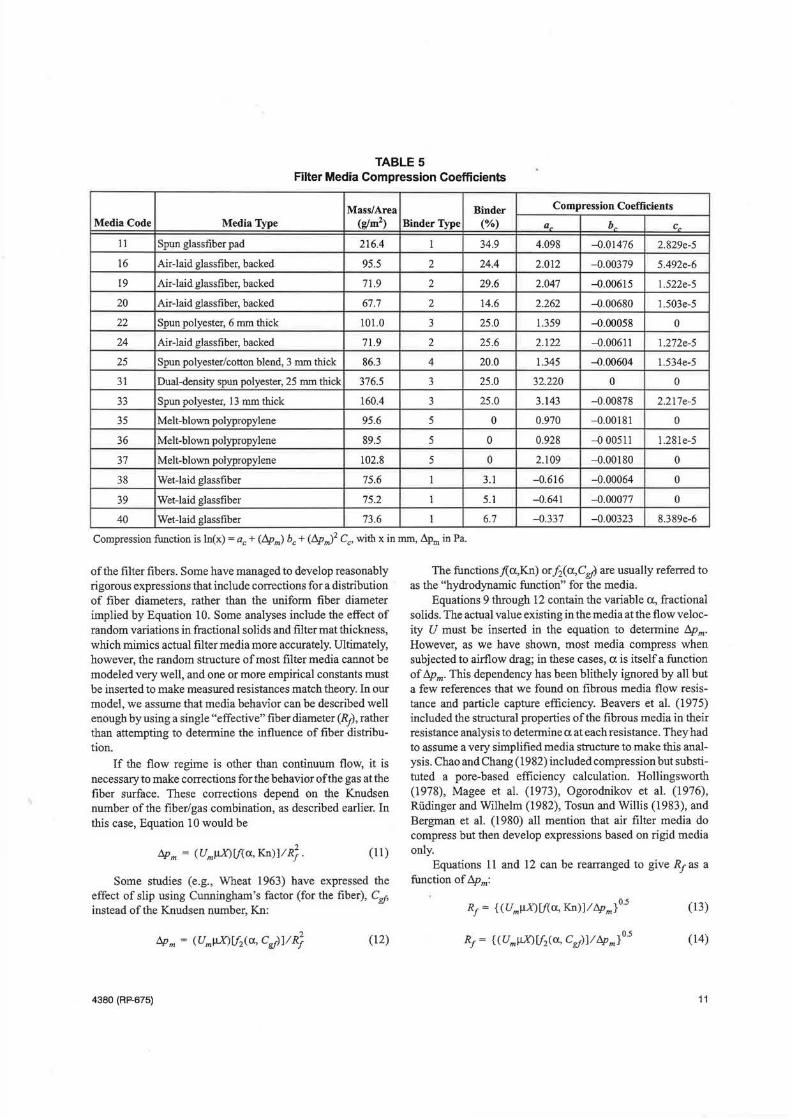
TABLE 5 Filter Media Compression Coefficients
Mass/Area Binder Compression Coefficients
Media Code Media Type (g/m2) Binder Type (%) a, b, c,
11 Spun glassfiber pad 216.4 1 34.9 4.098 --0.01476 2.829e-5
16 Air-laid glassfiber, backed 95.5 2 24.4 2.012 --0.00379 5.492e-6
19 Air-laid glassfiber, backed 71.9 2 29.6 2.047 --0.00615 l.522e-5
20 Air-laid glassfiber, backed 67.7 2 14.6 2.262 --0.00680 1.503e-5
22 Spun polyester, 6 mm thick 101.0 3 25.0 1.359 --0.00058 0
24 Air-laid glassfiber, backed 71.9 2 25.6 2.122 --0.00611 l.272e-5
25 Spun polyester/cotton blend, 3 mm thick 86.3 4 20.0 1.345 --0.00604 l.534e-5
31 Dual-density spun polyester, 25 mm thick 376.5 3 25 .0 32.220 0 0
33 Spun polyester, 13 mm thick 160.4 3 25.0 3.143 --0.00878 2.217e-5
35 Melt-blown polypropylene 95.6 5 0 0.970 --0.00181 0
36 Melt-blown polypropylene 89.5 5 0 0.928 --0 00511 l.281e-5
37 Melt-blown polypropylene 102.8 5 0 2.109 -0.00180 0
38 Wet-laid glassfiber 75.6 l 3.1 -0.616 -0.00064 0
39 Wet-laid glassfiber 75.2 1 5.1 -0.641 -0.00077 0
40 Wet-laid glassfiber 73.6 1 6.7 -0.337 -0.00323 8.389e-6
Compression function is ln(x) = ac + (b.pm) be+ (b.pm)2 Cc, with X in mm, dpm in Pa.
of the filter fibers. Some have managed to develop reasonably rigorous expressions that include corrections for a distribution of fiber diameters, rather than the uniform fiber diameter implied by Equation 10. Some analyses include the effect of random variations in fractional solids and filter mat thickness, which mimics actual filter media more accurately. Ultimately, however, the random structure of most filter media cannot be modeled very well, and one or more empirical constants must be inserted to make measured resistances match theory. In our model, we assume that media behavior can be described well enough by using a single "effective" fiber diameter (R1), rather than attempting to determine the influence of fiber distribution.
If the flow regime is other than continuum flow, it is necessary to make corrections for the behavior of the gas at the fiber surface. These corrections depend on the Knudsen number of the fiber/ gas combination, as described earlier. In this case, Equation 10 would be
2 tipm = (UmµX)[f(a,Kn)]IR1 . (11)
Some studies (e.g., Wheat 1963) have expressed the effect of slip using Cunningham's factor (for the fiber), Cgf, instead of the Knudsen number, Kn:
4380 (RP-675)
2 t1pm = (UmµX)[f2 (cx, Cgf')]/Rf (12)
The functionsfi:a,Kn) orfi(a,Cgfi are usually referred to as the "hydrodynamic function" for the media.
Equations 9 through 12 contain the variable a, fractional solids. The actual value existing in the media at the flow velocity U must be inserted in the equation to determine dPm· However, as we have shown, most media compress when subjected to airflow drag; in these cases, a is itself a function of !J.pm. This dependency has been blithely ignored by all but a few references that we found on fibrous media flow resistance and particle capture efficiency. Beavers et al. (1975) included the structural properties of the fibrous media in their resistance analysis to determine a at each resistance. They had to assume a very simplified media structure to make this analysis. Chao and Chang (1982) included compression but substituted a pore-based efficiency calculation. Hollingsworth (1978), Magee et al. (1973), Ogorodnikov et al. (1976), Riidinger and Wilhelm (1982), Tosun and Willis (1983), and Bergman et al. (1980) all mention that air filter media do compress but then develop expressions based on rigid media only.
Equations 11 and 12 can be rearranged to give R1 as a function of b.pm:
Rf= {(UmµX)[f(a, Kn)] / tipm}°-5
Rf= {(UmµX)[f2(a, Cgf')]lt1pm}0.5
(13)
(14)
11
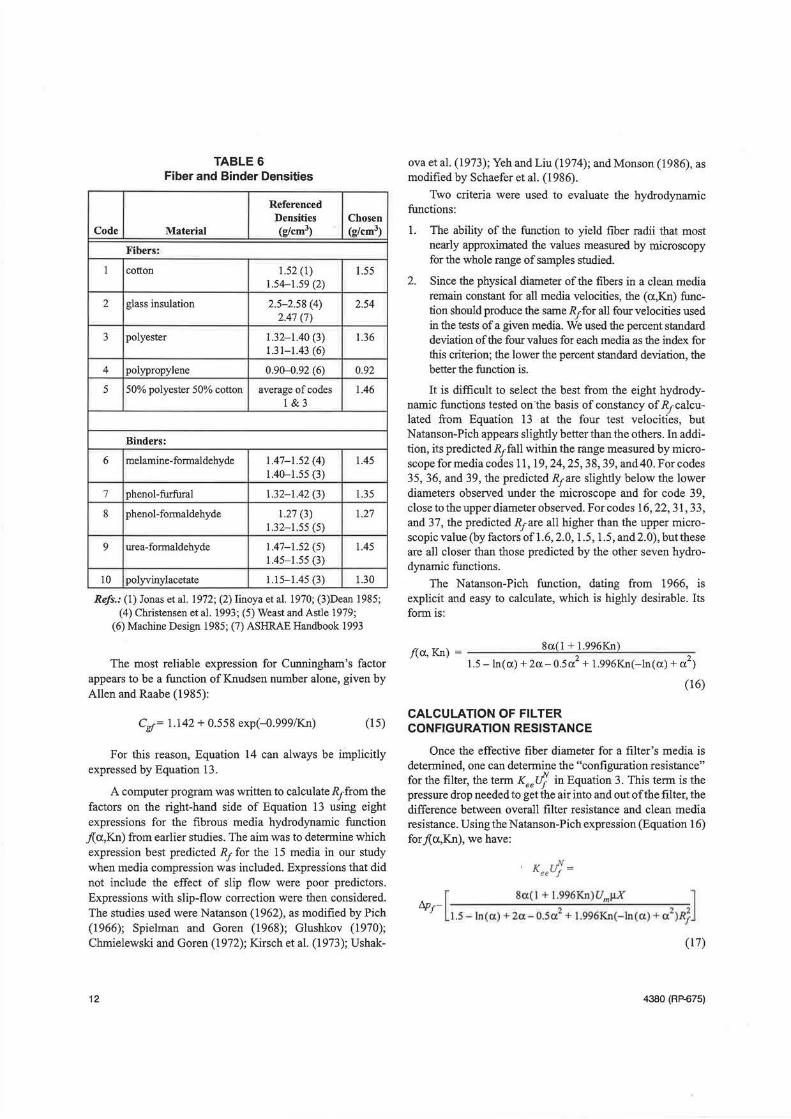
TABLE 6 Fiber and Binder Densities
Referenced Densities Chosen
Code Material (g/cm3) (g/cm3)
Fibers:
1 cotton 1.52 (1) 1.55 1.54--1.59 (2)
2 glass insulation 2.5-2.58 (4) 2.54 2.47 (7)
3 polyester 1.32-1.40 (3) 1.36 1.31-1.43 (6)
4 polypropylene 0.90--0.92 (6) 0.92
5 50% polyester 50% cotton average of codes 1.46 1 & 3
Binders:
6 melamine-formaldehyde 1.47-1.52 (4) 1.45 1.40--1.55 (3)
7 phenol-furfural 1.32-1.42 (3) 1.35
8 phenol-formaldehyde 1.27 (3) 1.27 1.32-1.55 (5)
9 urea-formaldehyde 1.47-1.52 (5) 1.45 1.45-1.55 (3)
10 polyvinylacetate 1.15-1.45 (3) 1.30
Refs.: (1) Jonas et al. 1972; (2) Iinoya et al. 1970; (3)Dean 1985; (4) Christensen et al. 1993; (5) Weast and Astle 1979;
(6) Machine Design 1985; (7) ASHRAE Handbook 1993
The most reliable expression for Cunningham's factor appears to be a function of Knudsen number alone, given by Allen and Raabe (1985):
Cg[= 1.142 + 0.558 exp(--0.999/Kn) (15)
For this reason, Equation 14 can always be implicitly expressed by Equation 13.
A computer program was written to calculate R1 from the factors on the right-hand side of Equation 13 using eight expressions for the fibrous media hydrodynamic function j( a,Kn) from earlier studies. The aim was to determine which expression best predicted R1 for the 15 media in our study when media compression was included. Expressions that did not include the effect of slip flow were poor predictors. Expressions with slip-flow correction were then considered. The studies used were Natanson (1962), as modified by Pich (1966); Spielman and Goren (1968); Glushkov (1970); Chmielewski and Goren (1972); Kirsch et al. (1973); Ushak-
12
ova et al. (1973); Yeh and Liu (1974); and Monson (1986), as modified by Schaefer et al. (1986).
Two criteria were used to evaluate the hydrodynamic functions:
1. The ability of the function to yield fiber radii that most nearly approximated the values measured by microscopy for the whole range of samples studied.
2. Since the physical diameter of the fibers in a clean media remain constant for all media velocities, the ( a,Kn) function should produce the same Rr for all four velocities used in the tests of a given media. We used the percent standard deviation of the four values for each media as the index for this criterion; the lower the percent standard deviation, the better the function is.
It is difficult to select the best from the eight hydrodynamic functions tested on ·the basis of constancy of R1 calculated from Equation 13 at the four test velocities, but N atanson-Pich appears slightly better than the others. In addition, its predicted R1 fall within the range measured by microscope formedia codes 11, 19, 24, 25, 38, 39, and40. For codes 35, 36, and 39, the predicted R1 are slightly below the lower diameters observed under the microscope and for code 39, close to the upper diameter observed. For codes 16, 22, 31, 33, and 3 7, the predicted R1 are all higher than the upper microscopic value (by factors ofl.6, 2.0, 1.5, 1.5, and2.0), but these are all closer than those predicted by the other seven hydrodynamic functions.
The Natanson-Pich function, dating from 1966, is explicit and easy to calculate, which is highly desirable. Its form is:
f(a, Kn) = 8a(l \l.996Kn) 2
1.5-ln(a)+2a-0.5a +l.996Kn(-ln(a)+a)
CALCULATION OF FILTER CONFIGURATION RESISTANCE
(16)
Once the effective fiber diameter for a filter's media is determined, one can determine the "configuration resistance" for the filter, the term Keedj. in Equation 3. This term is the pressure drop needed to get the air into and out of the filter, the difference between overall filter resistance and clean media resistance. Using the N atanson-Pich expression (Equation 16) for.f(a,Kn), we have:
' KeerJ/ =
[ Sa(! + l.996Kn)UmµX ]
!lpr 1.5-ln(cx) + 2et-0.5 cx2 + l.996Kn(- ln(a) + cl)RJ
(17)
4380 (RP-675)
Taking the logarithm of both sides of Equation 17,
ln(Kee) + N ln(U1) =
{ [ 8a(l +I· k)UmµX ]}
In /¥J1- 2 2 2 l.5-ln(a)+2a- O.Sa +l.996Kn(-ln(a)+a )R1
(18)
A least-squares linear regression of the data using Equation 18 yields the best values for both Kee and N for each filter. Values for N ranged from 1.15 to 3. 74. A possible explanation for N exceeding 2 is that the filter pleats are collapsing against each other, reducing the flow area and increasing air velocity between pleats. Values of Nbelow 2 could be caused by opening of pleats (or tubes, in the case of bag filters) as flow increases. Regardless of these effects, the procedure predicts overall filter resistance M 1 quite well for the entire range of filter types and velocities. Codes 31 and 33 are flat sheets of media and have no configuration resistance; for them, there should be no Kee dj. term, and, indeed, for them, calculated values of Kee were small.
CONCLUSIONS
As stated above, we observed no significant decrease in filter performance under VAY operating conditions, except for the very lowest efficiency filters. Theory predicts that efficiency varies with particle size and filter velocity for both fibrous filters and plate-type electronic air cleaners. This means that dust buildup in filter structures is dependent on the particle size distribution in the air approaching the filter, the filter velocity, and the dust previously collected.
The calculations of efficiency and resistance taking all these factors into consideration require considerable computer programming. An algorithm to accomplish this, based on established theories of inertial and diffusional particle capture and on the formation of "dendrites" by captured dust (Cai 1992), is outlined in the Final Report for Project RP-675 (Murphy and Rivers 1997). The algorithm would require validation by tests using well-defined aerosols. Such tests were beyond the scope ofRP-675.
In addition the characteristics of aerosols met in various building situations would need to be established, and the engineer using the program would need to supply the pattern of airflow to the filtered space by season, time of day, and space occupancy. A program to calculate particulate air quality and its effect on filter performance envisaged here will need substantial work, but it appears feasible.
REFERENCES
Allen, M.D., and O.G. Raabe. 1985. Slip correction measurements of spherical solid aerosol particles in an improved Millikan apparatus. Aerosol Sci. and Tech. 4 (3): 269-286.
4380 (RP-675)
ASHRAE. 1992. ANSIIASHRAE Standard 52.1-1992, Gravimetric and dust spot procedures for testing air cleaning devices used in general ventilation for removing particulate matter. Atlanta: American Society of Heating, Refrigerating and Air-Conditioning Engineers, Inc.
ASHRAE. 1993. 1993 ASHRAE Handbook-Fundamentals. Atlanta: American Society of Heating, Refrigerating and Air-Conditioning Engineers, Inc.
Beavers, G.S., T.A. Wilson, and B.A. Masha. 1975. Flow through a deformable porous material. Trans. ASMEJournal of Appl. Mech., pp. 598-602.
Bergman, W., W.D. Kuhl, W.L. Russel, R.D. Taylor, H.E. Hebard, AR. Biermann, N.J. Alvarez, D.G. Beason, and B.Y. Lum. 1980. Electrofibrous prefilters for use in nuclear ventilation systems. Proc. 16th DOE Nuclear Air Cleaning Conj, pp. 807-837.
Cai, J. 1992. Fibrous filters with non-ideal conditions. Dissertation, Royal Institute of Technology, Stockholm. (ISSN 0346-2668)
Chao, C.C.M., and W.V Chang. 1982. Pressure drop across compressible random-fiber porous medium: A unified filtration theory. Proc. 3d World Filtration Cong., 2: 610-617.
Chmielewski, R.D., and S.L. Goren. 1972. Aerosol filtration with slip flow. Envir. Sci. & Technol. 6 (13): 1101-1105.
Christensen, V.R., W. Eastes, R.D. Hamilton, and A.W. Struss. 1993. Fiber diameter distributions in typical MMVF wool insulation products. Am. Indus. Hyg. Assoc. J. 54 (5): 232-238.
Darcy. 1856. The public fountains of the city of Dijon (in Fr.). Dalmont, Paris.
Davies, C.N. 1973. Air filtration, chapter 4. London: Academic Press.
Dean, J.A., ed. 1985. Lange's handbook of chemistry, 13th ed. New York: McGraw-Hill.
Glushkov, Y.M. 1970. Passage of aerosol particles through fibrous filters. Dok!. Akad. Nauk SSSR 195 (1-3): 71-74 (in Russian). English translation, Sov. Phys. Dok!. 15 (11): 1047-1049.
Gunn, C.A., and J.B. McDonough. 1980. Survey of loading performance of currently available types of HEPA filters under in-service conditions. Proc. 16th DOE Nuclear Air Cleaning Conj. (CONF-801038, NTIS)
Hollingsworth, M., Jr. 1978. A new filter media resistance tester. ASHRAE Transactions 84 (1): 590-599. Atlanta: American Society of Heating, Refrigerating and AirConditioning Engineers, Inc.
Iinoya, K.K., K. Makino, and T.Imamura, 1970. Dust collection performance of paper filters. Kagaku Kogaku 34 (6): 632-637 (Eng. abstr.).
Jonas, L.A., C.M. Lochboehler, and W.S. Magee, Jr. 1972. Aerosol filtration by fibrous filter mats. Envir. Sci. & Tech. 6 (9): 821-826.
13
Kirsch, A.A., LB. Stechkina, and N.A. Fuchs. 1973. Effect of gas slip on the pressure drop in fibrous filters. J. Aerosol Sci. 4: 287-293.
Machine Design. 1985. Materials reference issue: Section 3, plastics, 57 (8): 143-206.
Magee, W.S., Jr., L.A. Jonas, and W.L. Anderson. 1973. Aerosol filtration by fibrous filter mats. Envir. Sci. & Tech. 7 (13): 1131-1135.
Monson, D.R. 1986. Key parameters used in modeling pressure loss of fibrous filter media. Fluid Filtration: Gas, ASTM STP 975 (1): 27-45. Philadelphia: ASTM.
Murphy, D.J., Jr., and R.D. Rivers. 1997. Determination of air filter performance under variable air volume conditions-Parts I and II. Atlanta: American Society of Heating, R~frigerating and Air-Conditioning Engineers, Inc.
Natanson, G.L. 1962. Influence of slip on impaction efficiency for capture of aerosols by a cylinder. Kolloid. Zhurn. 24 (1): 52-54 (in Russ.).
Ogorodnikov, B.I., V.I. Skitovich, and V.I. Khabarov. 1976. Pressure distribution in gas flow in the presences of a fibrous filter in the channel. J. Eng. Phys. 31 (2): 922-924 (in Russ.).
Pich, J. 1966. Theory of fibrous filters. Aerosol Science, pp. 223-286. London: Academic Press.
Pui, D.Y.H., D.R. Chen, and B.Y.H. Liu. 1991. Optimization of pleated filter design using a finite-element numerical method. J. Aerosol Sci. 24 (Supp. 1): S39-S40.
14
Raber, R.R. 1982. Pressure drop optimization and dust capacity estimation for a deep-pleated industrial air filter using small sample data. Filtration & Separation 19 (6): 508-511.
Rivers, R.D. 1990. Air filtration and air pollution control equipment. Handbook of HVAC Design. New York: McGraw-Hill.
Riidinger, V., and J.G. Wilhelm. 1982. HEPA filter response to high air flow velocities. Proc. 17th DOE Nuclear Air Cleaning Corif.
Schaefer, J.W., M.A. Barris, and B.Y.H. Liu. 1986. Filter media design for high purity applications. J. of the Environmental Sciences 29 ( 4): 27-31.
Spielman, L., and S.L. Goren. 1968. Model for predicting pressure drop and filtration efficiency in fibrous media. Envir. Sci. and Tech. 2 (4): 279-287.
Tosun, I., and M.S. Willis. 1983. Drag stress-Pressure drop relationships in filtration. Chem. Eng. Sci. 38 (3): 485-487.
Ushakova, E.N., V.I. Kozlov, and 1.N. Petrayanov. 1973. Hydrodynamics ofFP filter materials. Kolloid. Zhur. 37 (1): 99-104 (Eng tr.).
Weast, R.C., and M.J. Astle, eds. 1979. CRC handbook of chemistry and physics, 60th ed. Boca Raton: CRC Press.
Wheat, J.A. 1963. Airflow resistance of glassfiber paper. Canadian. J. Chem. Eng. 41 (4): 67.
Yeh, H.C., and B.Y.H. Liu. 1974. Aerosol filtration by fibrous filters-I. theoretical. J. Aerosol Science 5: 191-204.
4380 (RP.£75)