Embed Size (px)
Citation preview
14/30/2015
FUNDING PUBLIC EDUCATION
Bucks County Schools Intermediate Unit #22
Thursday, April 30th, 2015
Dave Matyas
Business Administrator
Central Bucks School District
24/30/2015
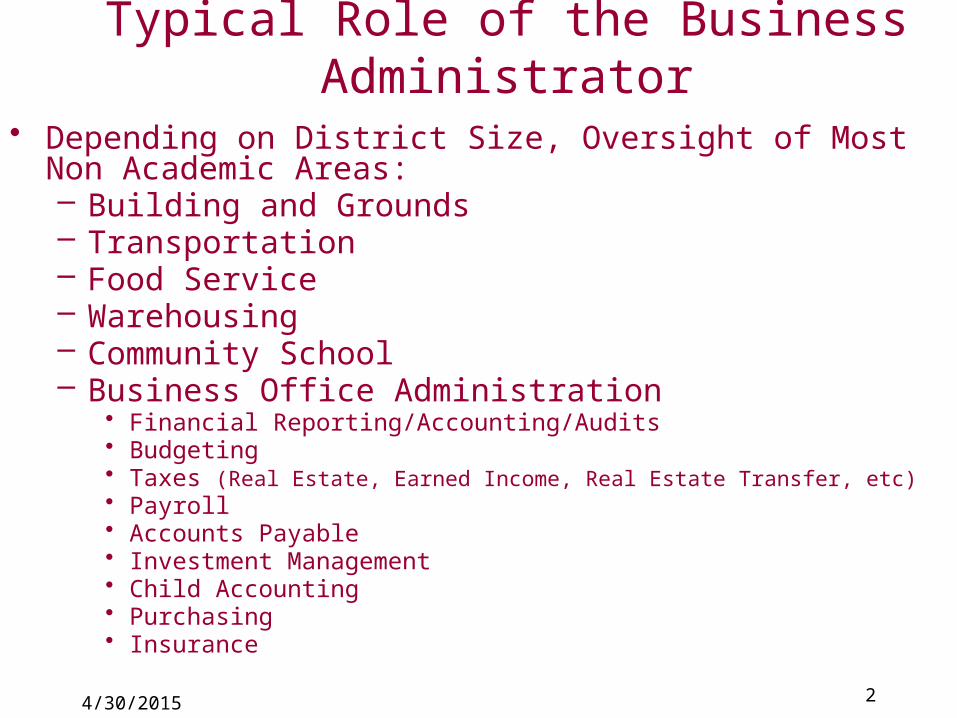
Typical Role of the Business Administrator
• Depending on District Size, Oversight of Most Non Academic Areas:– Building and Grounds– Transportation– Food Service– Warehousing– Community School– Business Office Administration
• Financial Reporting/Accounting/Audits• Budgeting• Taxes (Real Estate, Earned Income, Real Estate Transfer, etc)• Payroll• Accounts Payable• Investment Management• Child Accounting• Purchasing• Insurance
34/30/2015
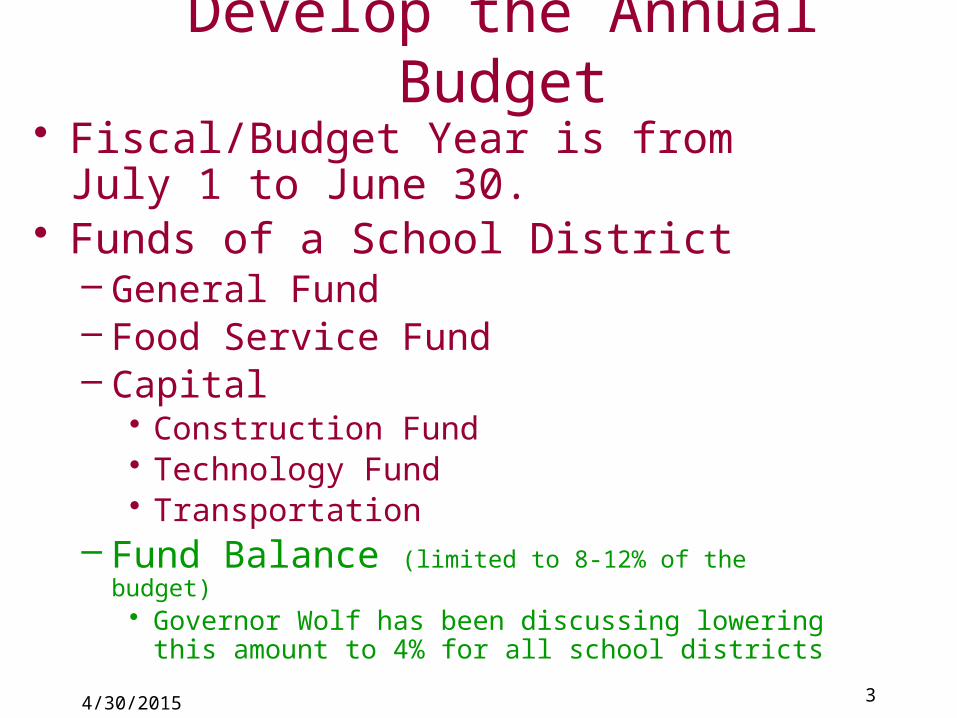
Develop the Annual Budget• Fiscal/Budget Year is from July 1 to June 30.• Funds of a School District
– General Fund– Food Service Fund– Capital
• Construction Fund• Technology Fund• Transportation
– Fund Balance (limited to 8-12% of the budget)• Governor Wolf has been discussing lowering this amount to 4%
for all school districts
4
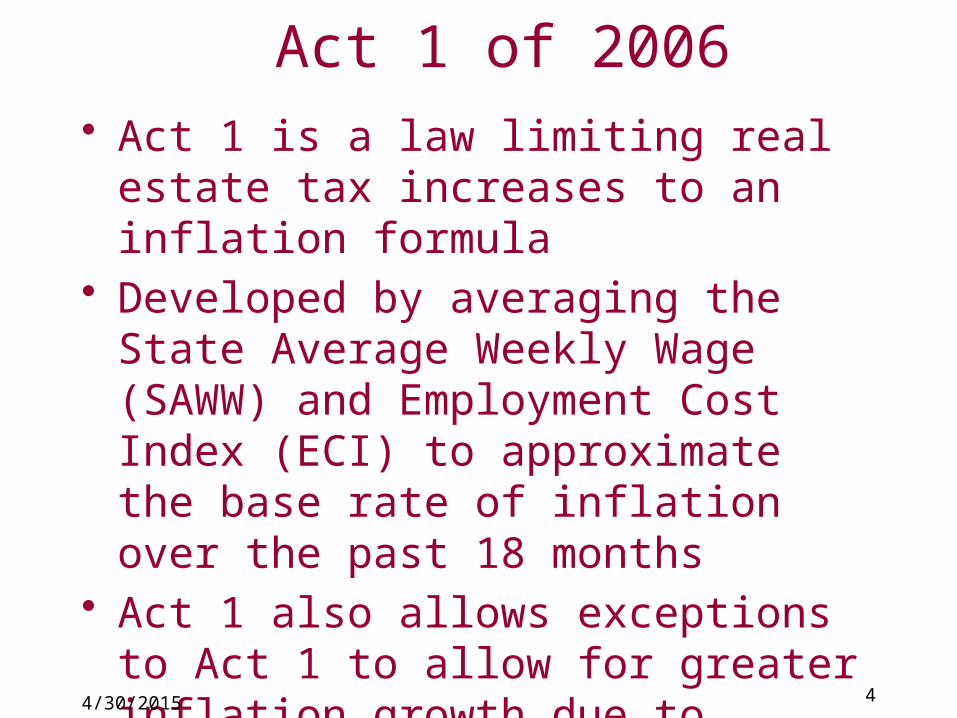
• Act 1 is a law limiting real estate tax increases to an inflation formula
• Developed by averaging the State Average Weekly Wage (SAWW) and Employment Cost Index (ECI) to approximate the base rate of inflation over the past 18 months
• Act 1 also allows exceptions to Act 1 to allow for greater inflation growth due to factors outside the control of a school board
• The Act 1 index is published in September
4/30/2015
Act 1 of 2006
5
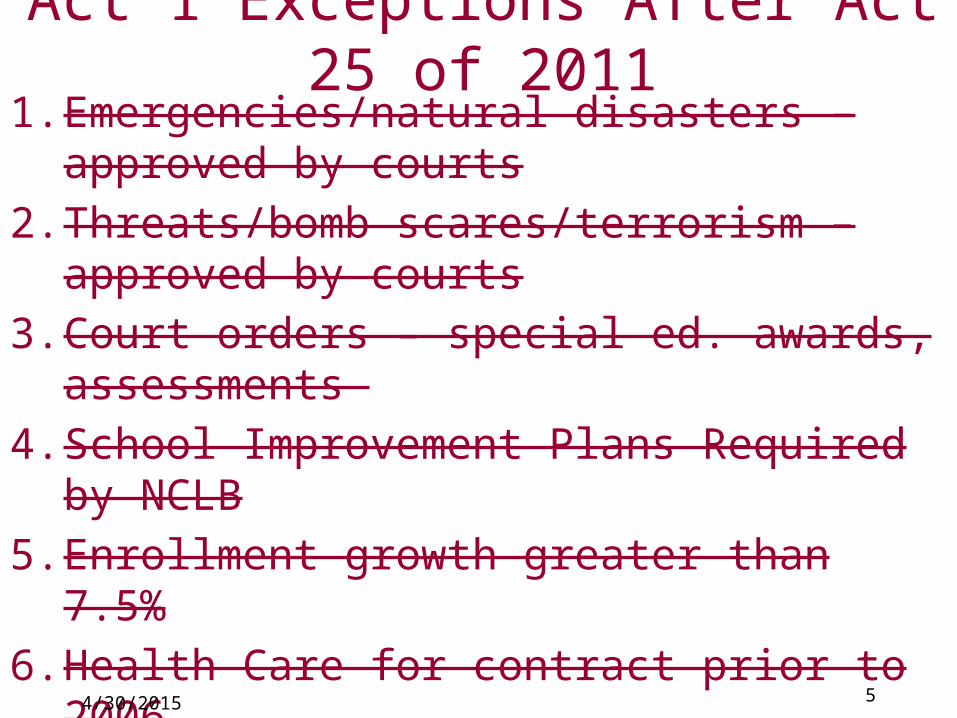
1. Emergencies/natural disasters – approved by courts
2. Threats/bomb scares/terrorism –approved by courts
3. Court orders – special ed. awards, assessments
4. School Improvement Plans Required by NCLB
5. Enrollment growth greater than 7.5%
6. Health Care for contract prior to 2006
7. State/local revenue growth below the base index
8. Construction debt prior to 2006
9. Special Education
10.Contribution to PSERS greater than base index4/30/2015
Act 1 Exceptions After Act 25 of 2011
6
2006
-07
2007
-08
2008
-09
2009
-10
2010
-11
2011
-12
2012
-13
2013
-14
2014
-15
2015
-16
0.0%
0.5%
1.0%
1.5%
2.0%
2.5%
3.0%
3.5%
4.0%
4.5%
5.0%
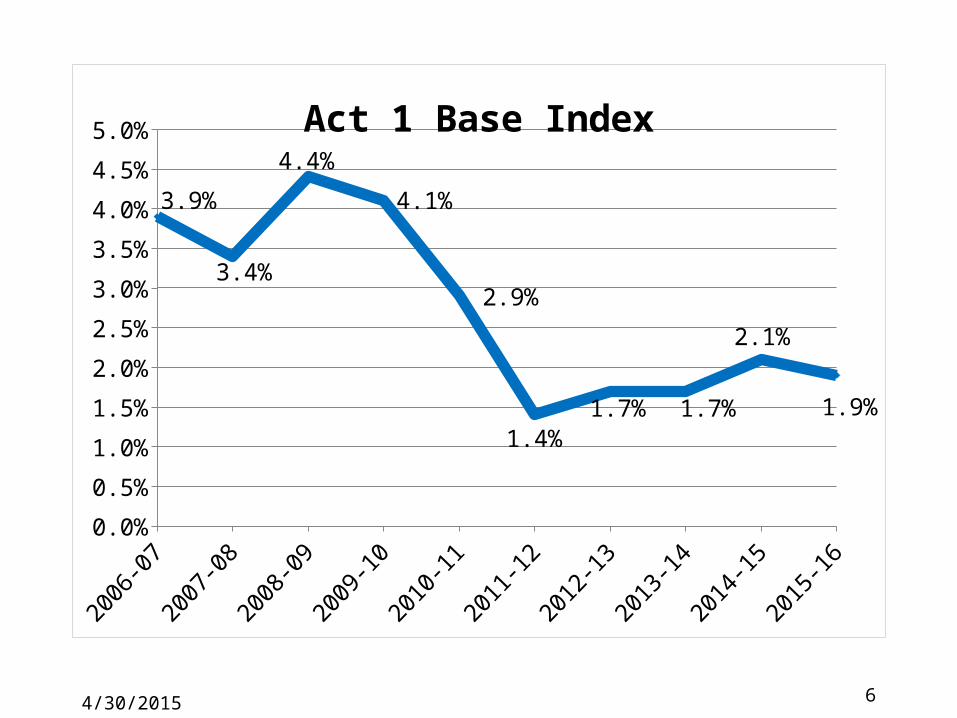
3.9%
3.4%
4.4%
4.1%
2.9%
1.4%1.7% 1.7%
2.1%
1.9%
Act 1 Base Index
4/30/2015
7
54-5
556
-57
58-5
960
-61
62-6
364
-65
66-6
768
-69
70-7
172
-73
74-7
576
-77
78-7
980
-81
82-8
384
-85
86-8
788
-89
90-9
192
-93
94-9
596
-97
98-9
900
-01
02-0
304
-05
06-0
708
-09
10-1
112
-13
14-1
516
-17
18-1
920
-21
22-2
324
-25
26-2
728
-29
30-3
132
-33
34-3
536
-37
38-3
940
-41
42-4
344
-45
46-4
70%
5%
10%
15%
20%
25%
30%
35%
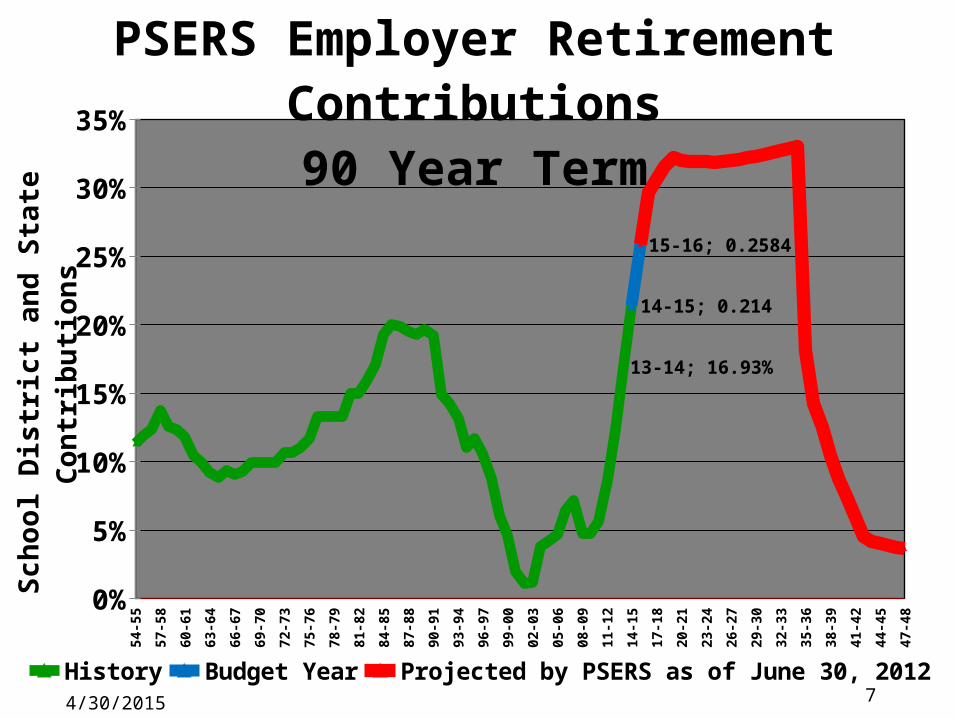
13-14; 16.93%
14-15; 0.214
15-16; 0.2584
History Budget Year Projected by PSERS as of June 30, 2012
Sch
ool D
istr
ict
and
Sta
te C
ontr
ibu
tion
sPSERS Employer Retirement Contributions
90 Year Term
4/30/2015
84/30/2015
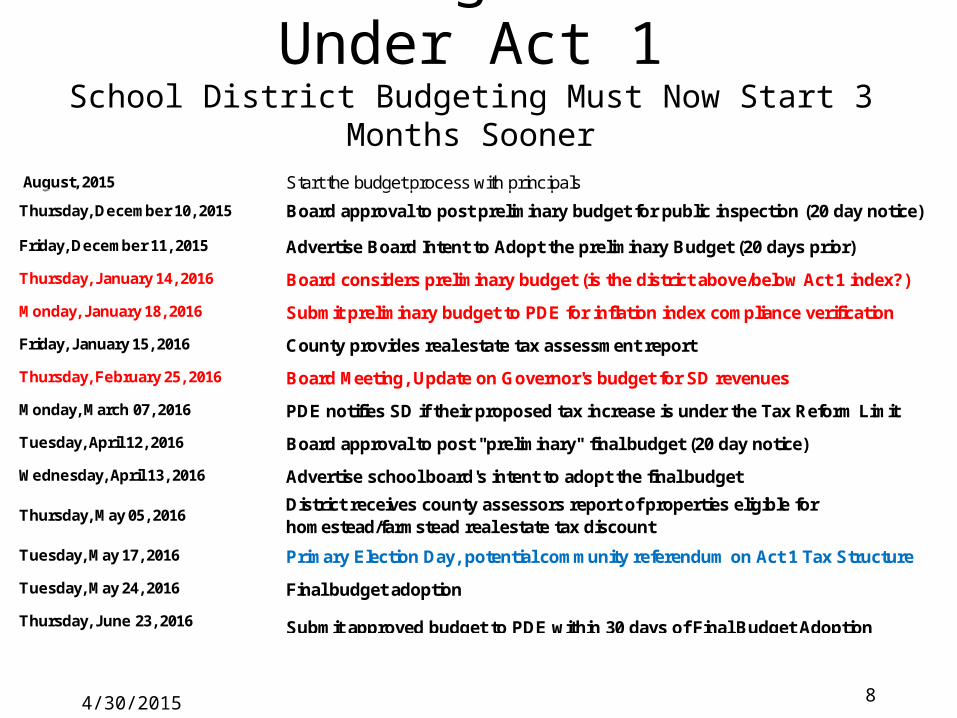
2015-16 Budget Timeline Under Act 1School District Budgeting Must Now Start 3 Months Sooner
August, 2015 Start the budget process with principals
Thursday, December 10, 2015
Friday, December 11, 2015 Advertise Board Intent to Adopt the preliminary Budget (20 days prior)
Thursday, January 14, 2016 Board considers preliminary budget (is the district above/below Act 1 index?)
Monday, January 18, 2016 Submit preliminary budget to PDE for inflation index compliance verification
Friday, January 15, 2016 County provides real estate tax assessment report
Thursday, February 25, 2016 Board Meeting, Update on Governor's budget for SD revenues
Monday, March 07, 2016 PDE notifies SD if their proposed tax increase is under the Tax Reform Limit
Tuesday, April 12, 2016 Board approval to post "preliminary" final budget (20 day notice)
Wednesday, April 13, 2016 Advertise school board's intent to adopt the final budget
Thursday, May 05, 2016
Tuesday, May 17, 2016 Primary Election Day, potential community referendum on Act 1 Tax Structure
Tuesday, May 24, 2016 Final budget adoption
Thursday, June 23, 2016 Submit approved budget to PDE within 30 days of Final Budget Adoption
District receives county assessors report of properties eligible for homestead/farmstead real estate tax discount
Board approval to post preliminary budget for public inspection (20 day notice)
94/30/2015
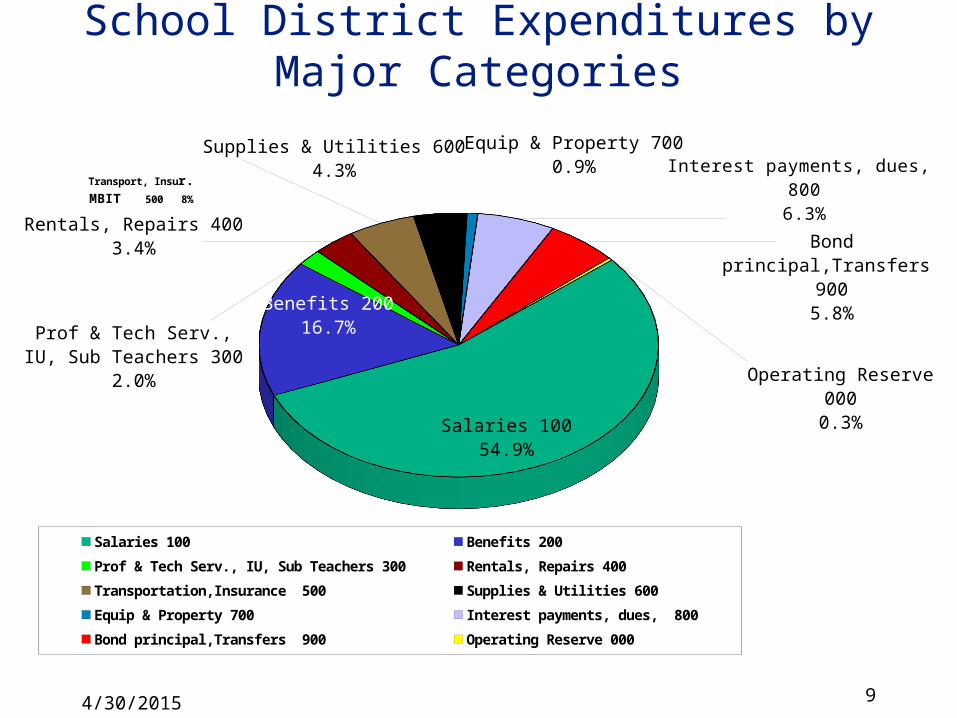
School District Expenditures by Major Categories
Salaries 10054.9%
Benefits 20016.7%
Prof & Tech Serv., IU, Sub Teachers 300
2.0%
Rentals, Repairs 4003.4%
Transport, Insur.MBIT 500 8%
Supplies & Utilities 6004.3%
Equip & Property 7000.9%
Interest payments, dues, 8006.3%
Bond principal,Transfers 900
5.8%
Operating Reserve 0000.3%
Salaries 100 Benefits 200 Prof & Tech Serv., IU, Sub Teachers 300
Rentals, Repairs 400 Transportation,Insurance 500 Supplies & Utilities 600
Equip & Property 700 Interest payments, dues, 800 Bond principal,Transfers 900
Operating Reserve 000
104/30/2015
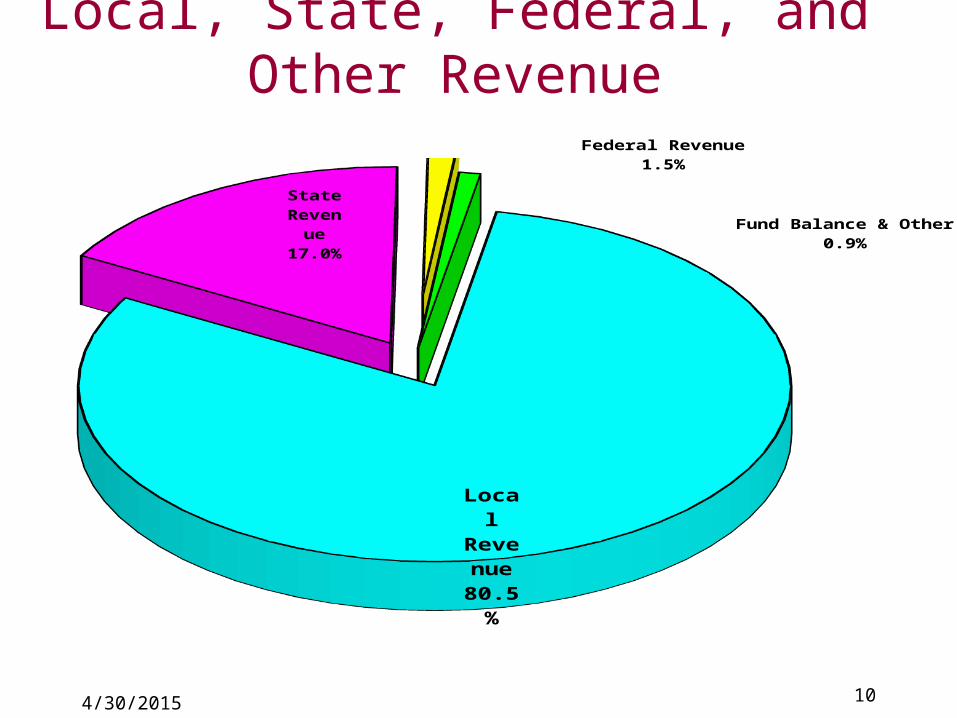
Local, State, Federal, and Other Revenue
Lo-cal Revenu
e80.5
%
State Rev-enue17.0
%
Federal Revenue1.5%
Fund Balance & Other0.9%
114/30/2015
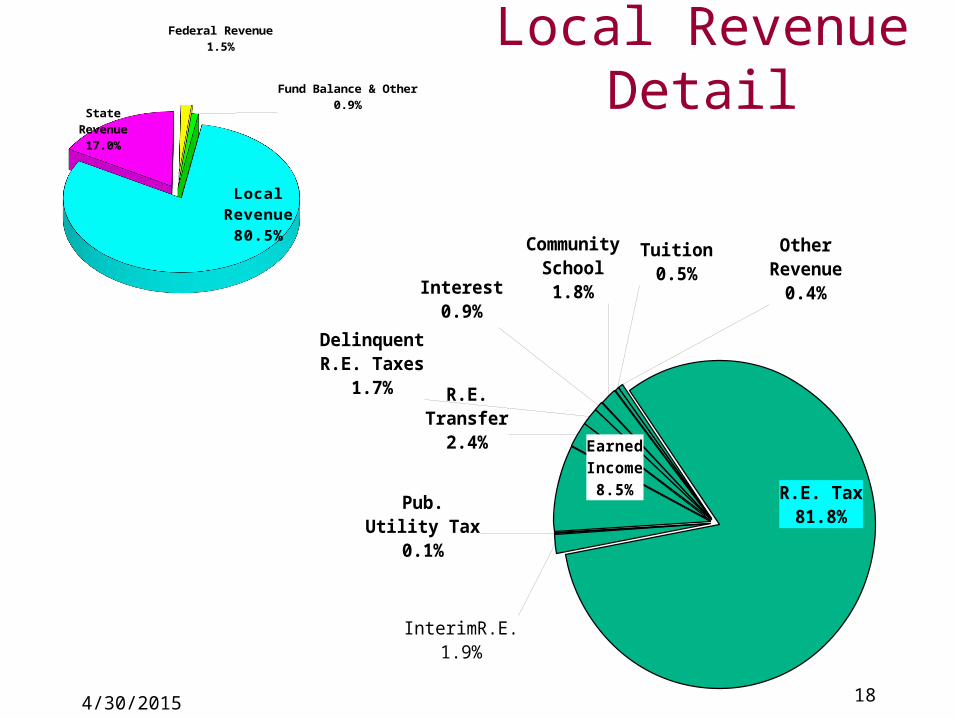
Major Sources of Local Revenues
• Real Estate Taxes• Real Estate Transfer (0.50%)• Interim Real Estate Taxes• Delinquent Real Estate Taxes• Earned Income Tax (0.50%)• Investment Income
124/30/2015
Looking forward to 2015-16State/Federal Funding of Public Schools
• State Subsidies– Basic Education Funding ( Proposed Increase by Gov. Wolf )– Special Education ( Proposed Increase by Gov. Wolf )– Transportation ( flat funding )– Accountability Block Grant ($0 Under Gov. Wolf’s Proposal)– School District Payments to Charter Schools (Reduced Under
Gov. Wolf’s Proposal)
• Federal Funding For Schools– Title 1, 2, 3 (Small Funding Increase is Expected)
134/30/2015
Spending From the State-Wide View Point
Spending From the State-Wide View Point
• Lets Take a Look at What has Been Happening to Public School Funding Over The Years
• Lets Take a Look at What has Been Happening to Public School Funding Over The Years
14
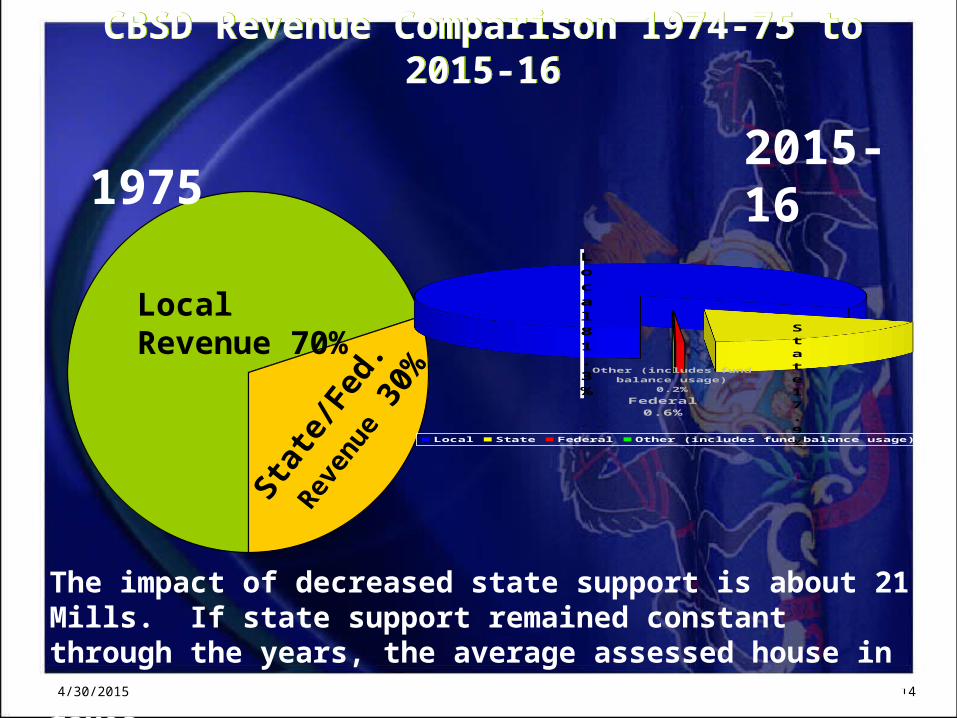
CBSD Revenue Comparison 1974-75 to 2015-16CBSD Revenue Comparison 1974-75 to 2015-16
Local Revenue 70%
Stat
e/Fed
.
Rev
enue
30%
1975Local81.3%
State17.9%
Federal0.6%
Other (includes fund balance usage)
0.2%
Local State Federal Other (includes fund balance usage)
2015-16
The impact of decreased state support is about 21 Mills. If state support remained constant through the years, the average assessed house in CB would be paying about $ 840 dollars less in RE taxes.
4/30/2015
15
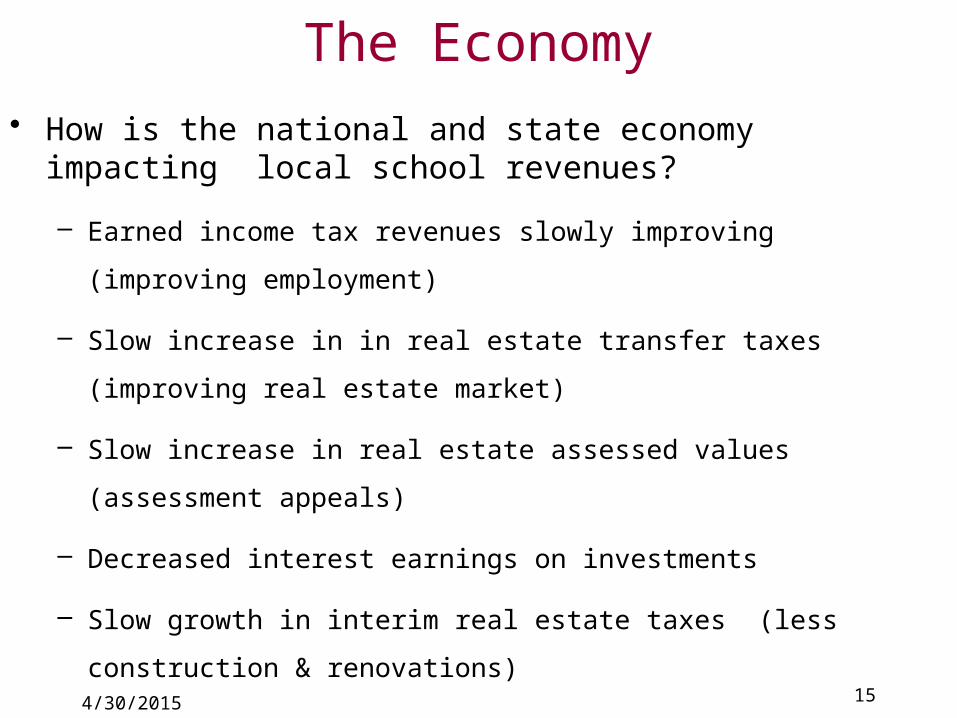
The Economy
4/30/2015
• How is the national and state economy impacting local school revenues?
– Earned income tax revenues slowly improving (improving employment)
– Slow increase in in real estate transfer taxes (improving real estate market)
– Slow increase in real estate assessed values (assessment appeals)
– Decreased interest earnings on investments
– Slow growth in interim real estate taxes (less construction & renovations)
– More families applying for free/reduced price lunches - starting to decline
164/30/2015
FUNDING PUBLIC EDUCATION
Questions?

174/30/2015
184/30/2015
Local Revenue Detail
R.E. Tax81.8%
InterimR.E.1.9%
Pub. Utility Tax0.1%
Earned Income8.5%
R.E. Transfer2.4%
Delinquent R.E. Taxes
1.7%
Interest0.9%
Community School1.8%
Tuition0.5%
Other Revenue
0.4%
Local Revenue
80.5%
State Revenue
17.0%
Federal Revenue1.5%
Fund Balance & Other0.9%
194/30/2015
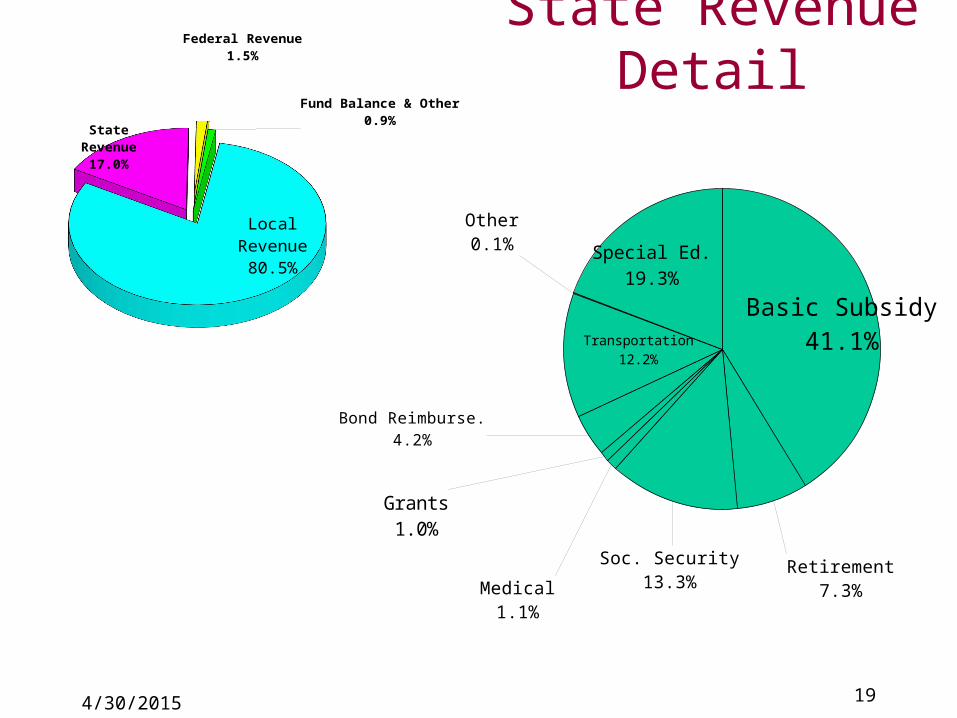
State Revenue Detail
Basic Subsidy41.1%
Retirement7.3%
Soc. Security13.3%Medical
1.1%
Grants1.0%
Bond Reimburse.4.2%
Transportation12.2%
Other0.1%
Special Ed.19.3%
Local Revenue80.5%
State Revenue17.0%
Federal Revenue1.5%
Fund Balance & Other0.9%

20
The Economy
4/30/2015
Dow’s Jones Industrial Average 10 Worst Years
DATE CLOSE NET CHANGE % CHANGE 1931 77.90 -86.68 -52.7% 1907 58.75 -35.60 -37.7% 2008 8,776.39 -4,488.43 -33.8% 1930 164.58 -83.90 -33.8% 1920 71.95 -35.28 -32.9% 1937 120.85 -59.05 -32.8% 1974 616.24 -234.62 -27.6% 1903 49.11 -15.18 -23.6% 1932 59.93 -17.97 -23.1%1917 74.38 -20.62 -21.7%
21
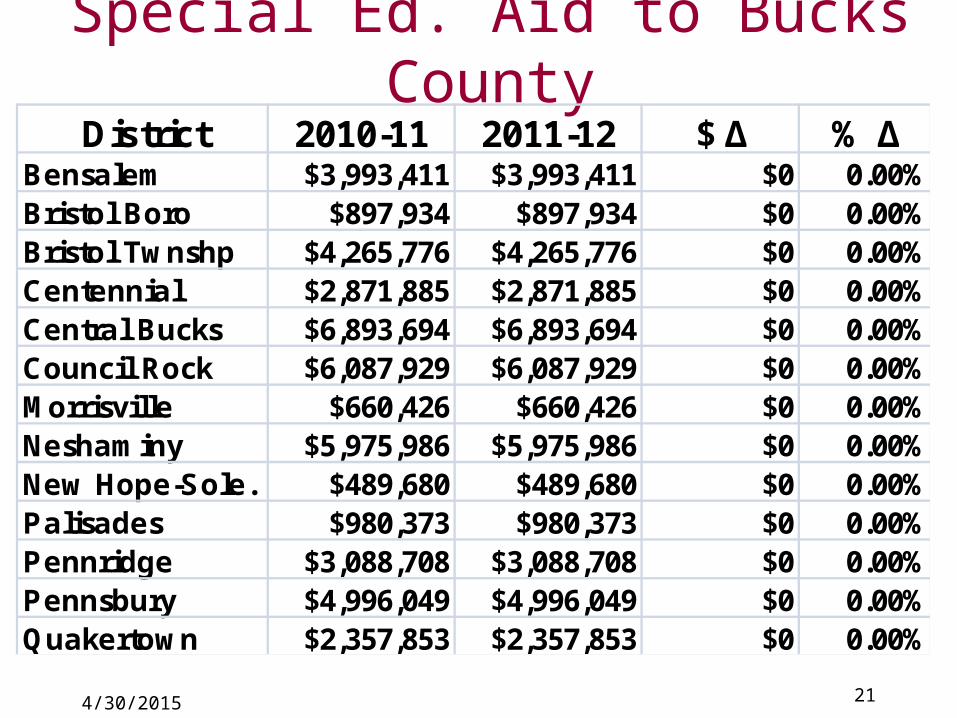
Special Ed. Aid to Bucks CountyDistrict 2010-11 2011-12 $ ∆ % ∆
Bensalem $3,993,411 $3,993,411 $0 0.00%Bristol Boro $897,934 $897,934 $0 0.00%Bristol Twnshp $4,265,776 $4,265,776 $0 0.00%Centennial $2,871,885 $2,871,885 $0 0.00%Central Bucks $6,893,694 $6,893,694 $0 0.00%Council Rock $6,087,929 $6,087,929 $0 0.00%Morrisville $660,426 $660,426 $0 0.00%Neshaminy $5,975,986 $5,975,986 $0 0.00%New Hope-Sole. $489,680 $489,680 $0 0.00%Palisades $980,373 $980,373 $0 0.00%Pennridge $3,088,708 $3,088,708 $0 0.00%Pennsbury $4,996,049 $4,996,049 $0 0.00%Quakertown $2,357,853 $2,357,853 $0 0.00%
4/30/2015
22
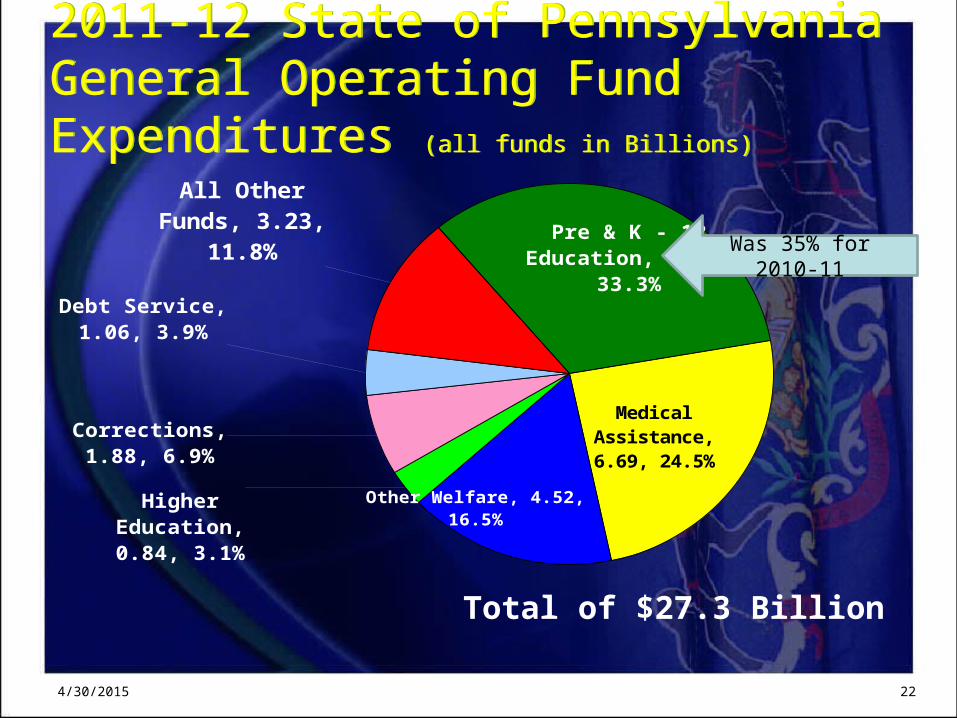
2011-12 State of Pennsylvania General Operating Fund Expenditures (all funds in Billions)
2011-12 State of Pennsylvania General Operating Fund Expenditures (all funds in Billions)
Pre & K - 12 Education, 9.11, 33.3%
Medical Assistance, 6.69, 24.5%
Other Welfare, 4.52, 16.5%Higher Education, 0.84, 3.1%
Corrections, 1.88, 6.9%
Debt Service, 1.06, 3.9%
All Other Funds, 3.23,
11.8%
Total of $27.3 Billion
4/30/2015
Was 35% for 2010-11
23
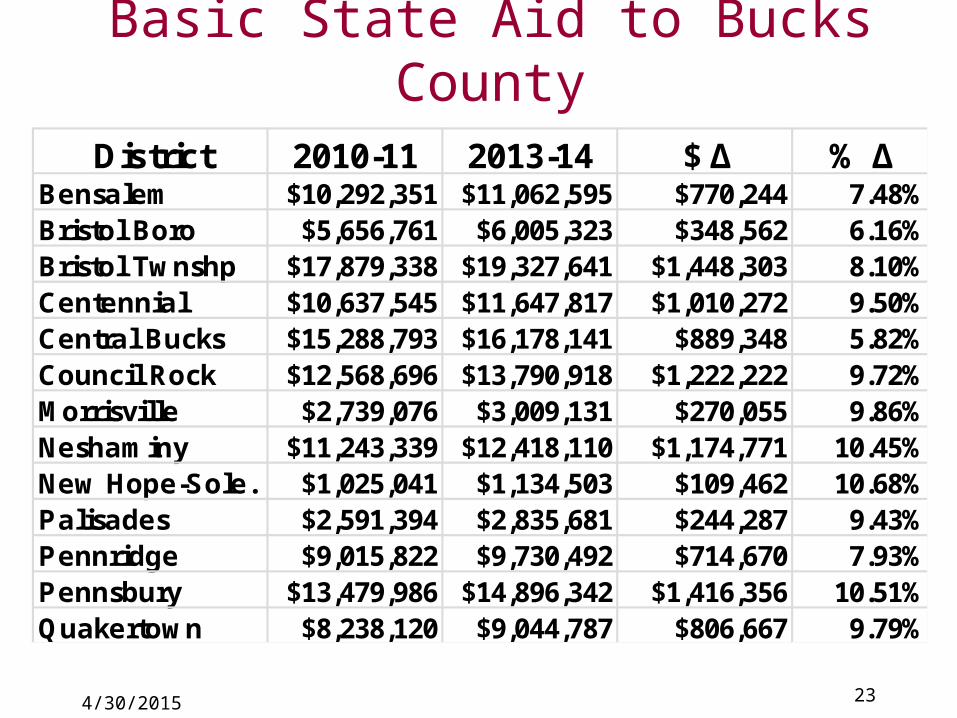
Basic State Aid to Bucks County
District 2010-11 2013-14 $ ∆ % ∆Bensalem $10,292,351 $11,062,595 $770,244 7.48%Bristol Boro $5,656,761 $6,005,323 $348,562 6.16%Bristol Twnshp $17,879,338 $19,327,641 $1,448,303 8.10%Centennial $10,637,545 $11,647,817 $1,010,272 9.50%Central Bucks $15,288,793 $16,178,141 $889,348 5.82%Council Rock $12,568,696 $13,790,918 $1,222,222 9.72%Morrisville $2,739,076 $3,009,131 $270,055 9.86%Neshaminy $11,243,339 $12,418,110 $1,174,771 10.45%New Hope-Sole. $1,025,041 $1,134,503 $109,462 10.68%Palisades $2,591,394 $2,835,681 $244,287 9.43%Pennridge $9,015,822 $9,730,492 $714,670 7.93%Pennsbury $13,479,986 $14,896,342 $1,416,356 10.51%Quakertown $8,238,120 $9,044,787 $806,667 9.79%
4/30/2015
24
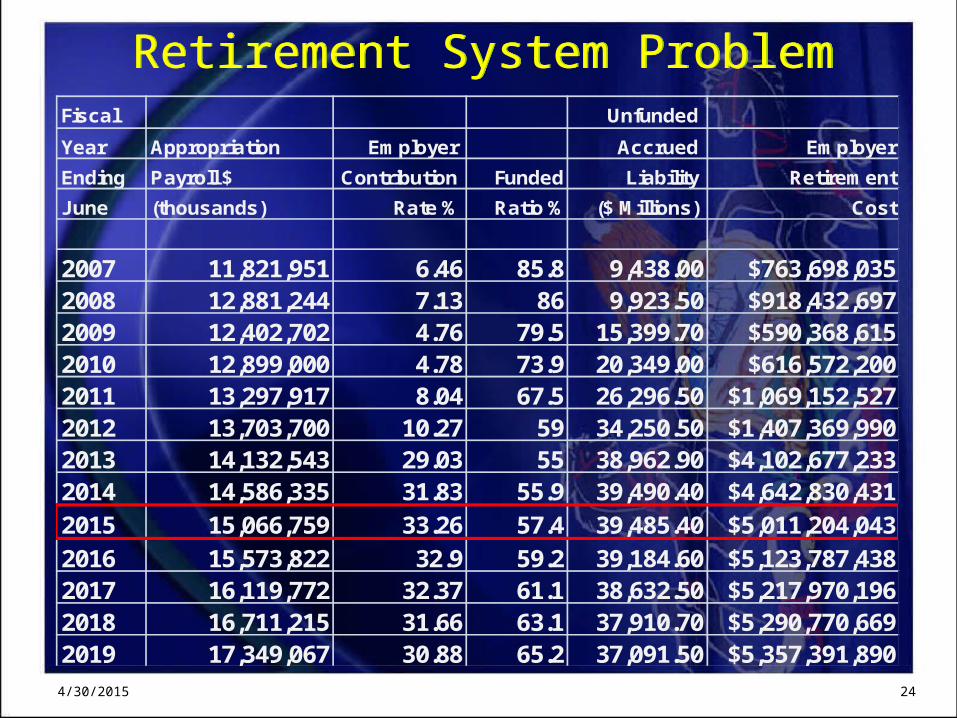
Retirement System ProblemRetirement System Problem
4/30/2015
Fiscal Unfunded
Year Appropriation Employer Accrued Employer
Ending Payroll $ Contribution Funded Liability Retirement
June (thousands) Rate % Ratio % ($ Millions) Cost
2007 11,821,951 6.46 85.8 9,438.00 $763,698,0352008 12,881,244 7.13 86 9,923.50 $918,432,6972009 12,402,702 4.76 79.5 15,399.70 $590,368,6152010 12,899,000 4.78 73.9 20,349.00 $616,572,2002011 13,297,917 8.04 67.5 26,296.50 $1,069,152,5272012 13,703,700 10.27 59 34,250.50 $1,407,369,9902013 14,132,543 29.03 55 38,962.90 $4,102,677,2332014 14,586,335 31.83 55.9 39,490.40 $4,642,830,431
2015 15,066,759 33.26 57.4 39,485.40 $5,011,204,043
2016 15,573,822 32.9 59.2 39,184.60 $5,123,787,4382017 16,119,772 32.37 61.1 38,632.50 $5,217,970,1962018 16,711,215 31.66 63.1 37,910.70 $5,290,770,6692019 17,349,067 30.88 65.2 37,091.50 $5,357,391,890
25
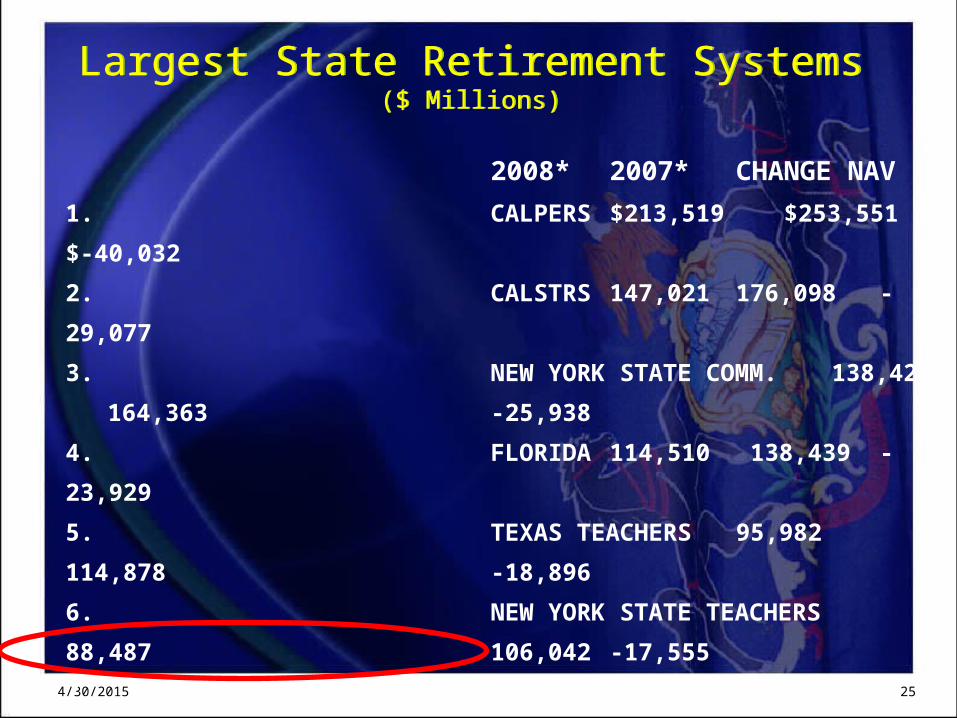
Largest State Retirement Systems($ Millions)
Largest State Retirement Systems($ Millions)
4/30/2015
2008* 2007* CHANGE NAV
1. CALPERS $213,519 $253,551 $-40,032
2. CALSTRS 147,021 176,098 -29,077
3. NEW YORK STATE COMM. 138,425 164,363 -25,938
4. FLORIDA 114,510 138,439 -23,929
5. TEXAS TEACHERS 95,982 114,878 -18,896
6. NEW YORK STATE TEACHERS 88,487 106,042 -17,555
7. WISCONSIN INVESTMENT BD. 72,493 89,328 -16,835
8. NEW JERSEY 70,826, 82,780, -11,954,
9. NORTH CAROLINA 65,924 77,384 -11,460
10. OHIO STATE TEACHERS 62,611 78,311 -15,700
11. OHIO PUBLIC EMPLOYEES 57,940 84,123 -26,183
12. Pennsylvania School Employees 54,666 68,678 -14,012
264/30/2015
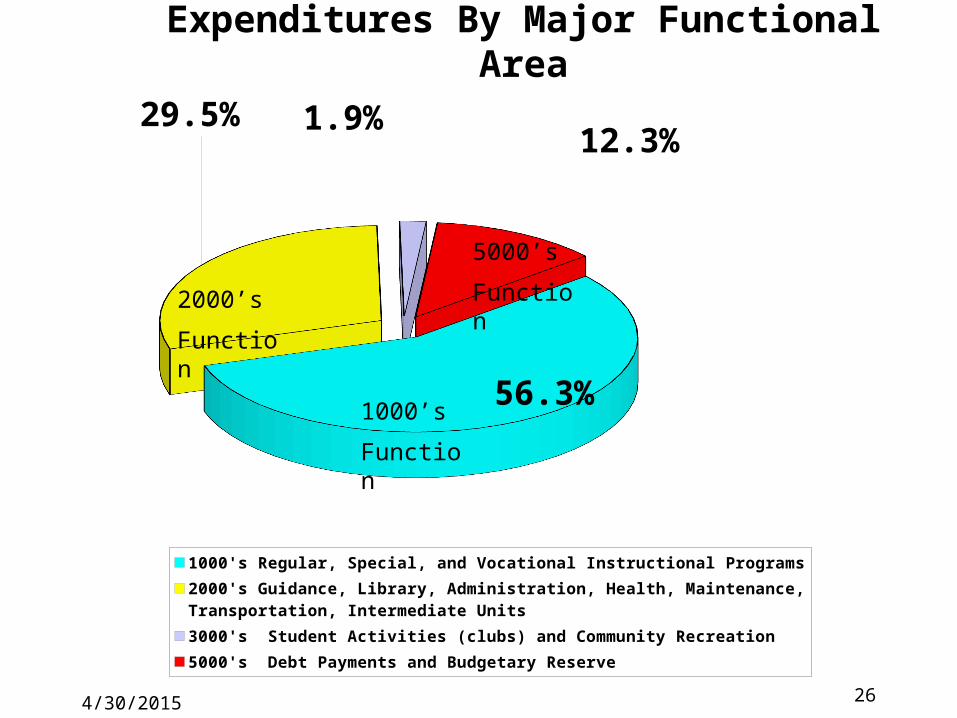
56.3%
29.5% 1.9%12.3%
1000's Regular, Special, and Vocational Instructional Programs2000's Guidance, Library, Administration, Health, Maintenance, Transportation, Intermediate Units 3000's Student Activities (clubs) and Community Recreation5000's Debt Payments and Budgetary Reserve
Expenditures By Major Functional Area
1000’s
Function
2000’s
Function
5000’s
Function
4/30/2015 36
May 5, 2007Bucks County IU#22
Act 1 Overview
Higher Income Taxes and Slot Machine Proceeds Reduce Residential
Real Estate Taxes
374/30/2015
Act 1 - Overview
Act 1 provides a vehicle for the community within a school district to opt into real estate tax reform by shifting some taxes from real estate to an income tax.
The tax shift from real estate to an income based tax can be accomplished through raising the Earned Income Tax (EIT) or implementing an Equivalent Personal Income Tax (PIT).
384/30/2015
What is EIT
The Earned income tax (EIT) is a tax on gross wages paid to the municipality and school district where you live – not where you work.
The current earned income tax is 1% of gross wages. A half of 1% goes to CBSD and a half of 1% goes to the township or borough where you live.
Pensions and social security are not taxable.
394/30/2015
How Tax Reform Works
Only primary residential properties and Farms are eligible for a real estate tax credit.– Apartments, vacation homes, and commercial
properties are not eligible for real estate tax credits. Why?
• Apartments are considered to be commercial properties. And, commercial properties should not benefit from a tax reduction since the properties will not pay any additional wage taxes to help fund the real estate tax credits.
The county Assessors Office determines what properties are eligible for a real estate tax credit (not the school district).
404/30/2015
Tax Reform in Four Easy Steps
414/30/2015
Step 1
In Central Bucks, the Median Assessed Value of a home for real estate taxing purposes is $36,800.
Then …
– The tax study commission can recommend an assessment reduction ranging from 25% to 50%
424/30/2015
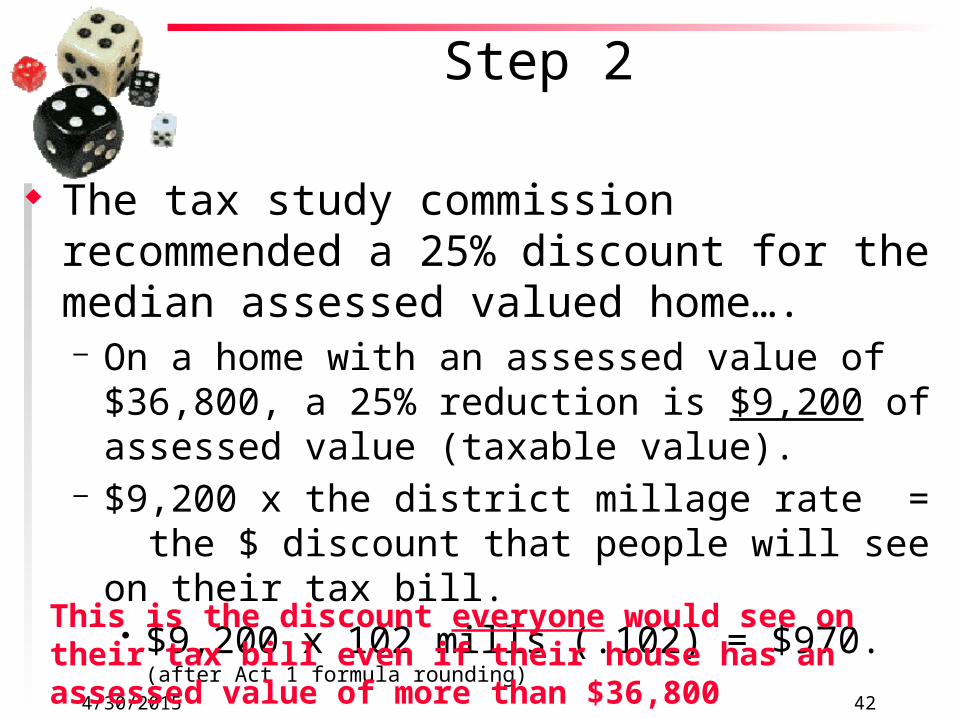
Step 2
The tax study commission recommended a 25% discount for the median assessed valued home….– On a home with an assessed value of $36,800, a 25%
reduction is $9,200 of assessed value (taxable value).– $9,200 x the district millage rate = the $ discount that
people will see on their tax bill.• $9,200 x 102 mills (.102) = $970. (after Act 1 formula rounding)
This is the discount everyone would see on their tax bill even if their house has an assessed value of more than $36,800
434/30/2015
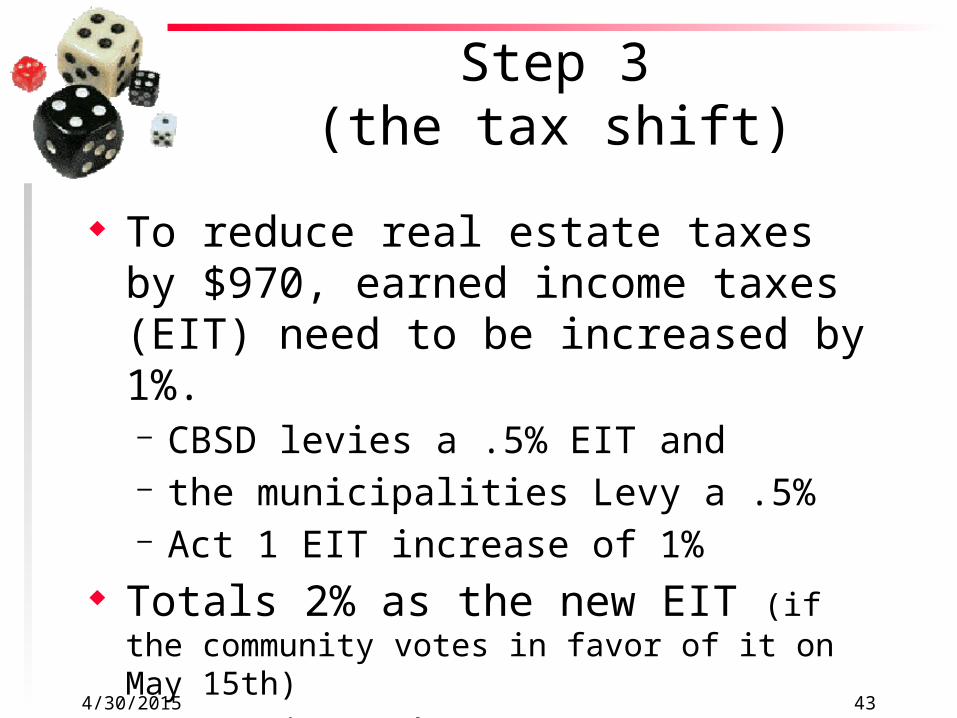
Step 3(the tax shift)
To reduce real estate taxes by $970, earned income taxes (EIT) need to be increased by 1%.– CBSD levies a .5% EIT and – the municipalities Levy a .5%– Act 1 EIT increase of 1%
Totals 2% as the new EIT (if the community votes in favor of it on May 15th)– But, it’s the new 1% tax we are interested in…
444/30/2015
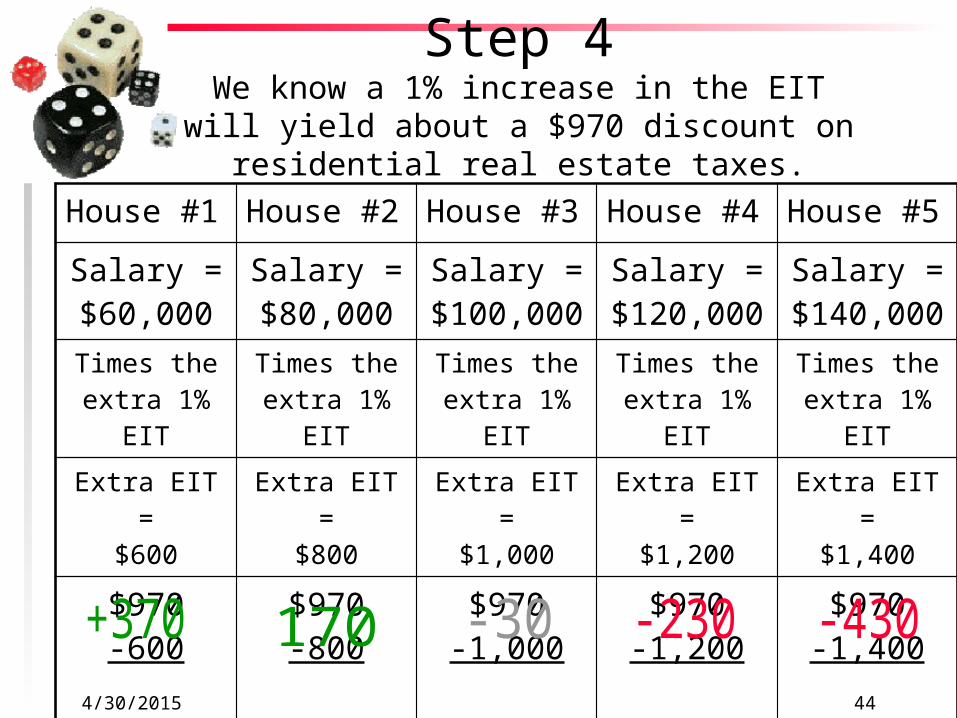
Step 4We know a 1% increase in the EIT will yield about a
$970 discount on residential real estate taxes.
House #1 House #2 House #3 House #4 House #5
Salary = $60,000
Salary = $80,000
Salary = $100,000
Salary = $120,000
Salary = $140,000
Times the extra 1% EIT
Times the extra 1% EIT
Times the extra 1% EIT
Times the extra 1% EIT
Times the extra 1% EIT
Extra EIT =$600
Extra EIT =$800
Extra EIT =$1,000
Extra EIT =$1,200
Extra EIT =$1,400
$970-600
$970-800
$970-1,000
$970-1,200
$970-1,400
454/30/2015
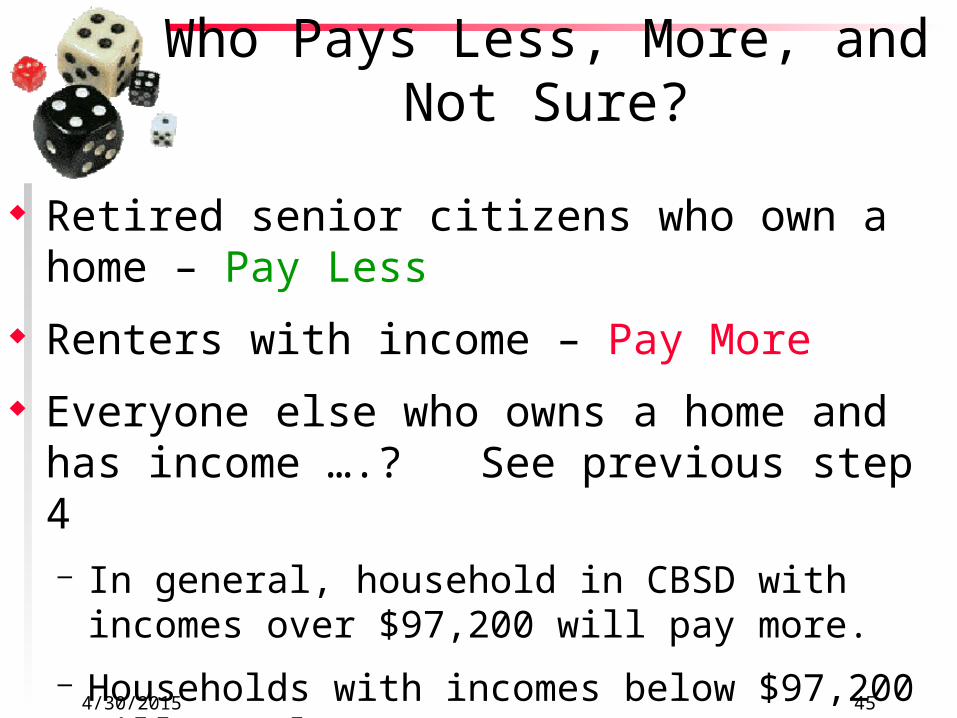
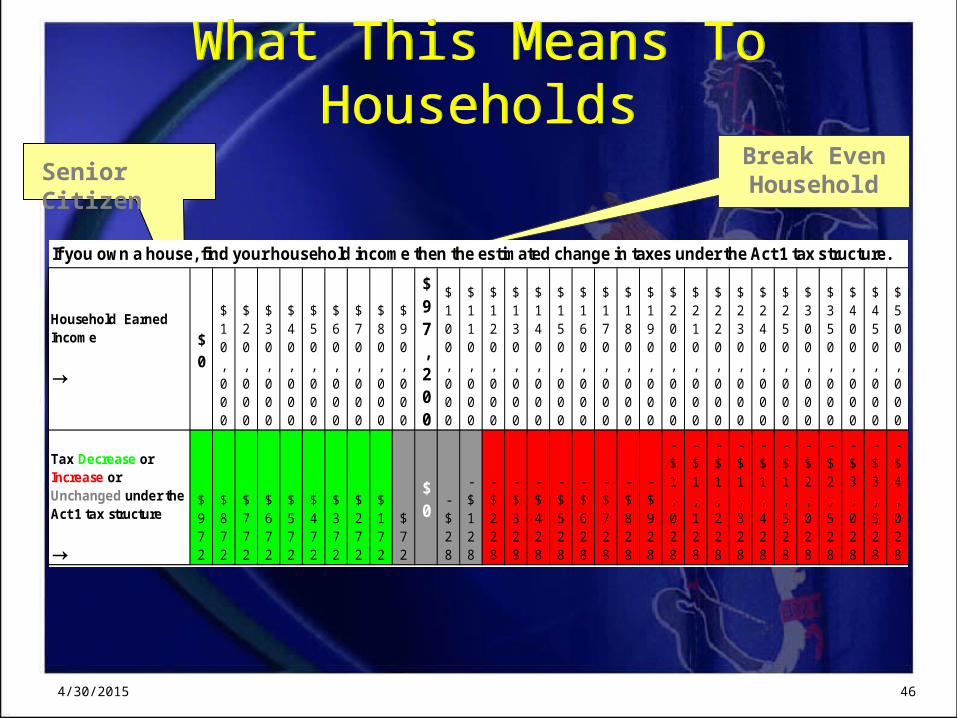
Who Pays Less, More, and Not Sure?
Retired senior citizens who own a home – Pay Less
Renters with income – Pay More
Everyone else who owns a home and has income ….? See previous step 4 – In general, household in CBSD with incomes over
$97,200 will pay more.
– Households with incomes below $97,200 will pay less.
46
What This Means To HouseholdsWhat This Means To Households
If you own a house, find your household income then the estimated change in taxes under the Act 1 tax structure.
Household Earned Income
→$0
$10,000
$20,000
$30,000
$40,000
$50,000
$60,000
$70,000
$80,000
$90,000
$97,200
$100,000
$110,000
$120,000
$130,000
$140,000
$150,000
$160,000
$170,000
$180,000
$190,000
$200,000
$210,000
$220,000
$230,000
$240,000
$250,000
$300,000
$350,000
$400,000
$450,000
$500,000
Tax Decrease or Increase or Unchanged under the Act 1 tax structure
→
$972
$872
$772
$672
$572
$472
$372
$272
$172
$72
$0
-$28
-$128
-$228
-$328
-$428
-$528
-$628
-$728
-$828
-$928
-$1,028
-$1,128
-$1,228
-$1,328
-$1,428
-$1,528
-$2,028
-$2,528
-$3,028
-$3,528
-$4,028
4/30/2015
Senior CitizenBreak Even Household
47
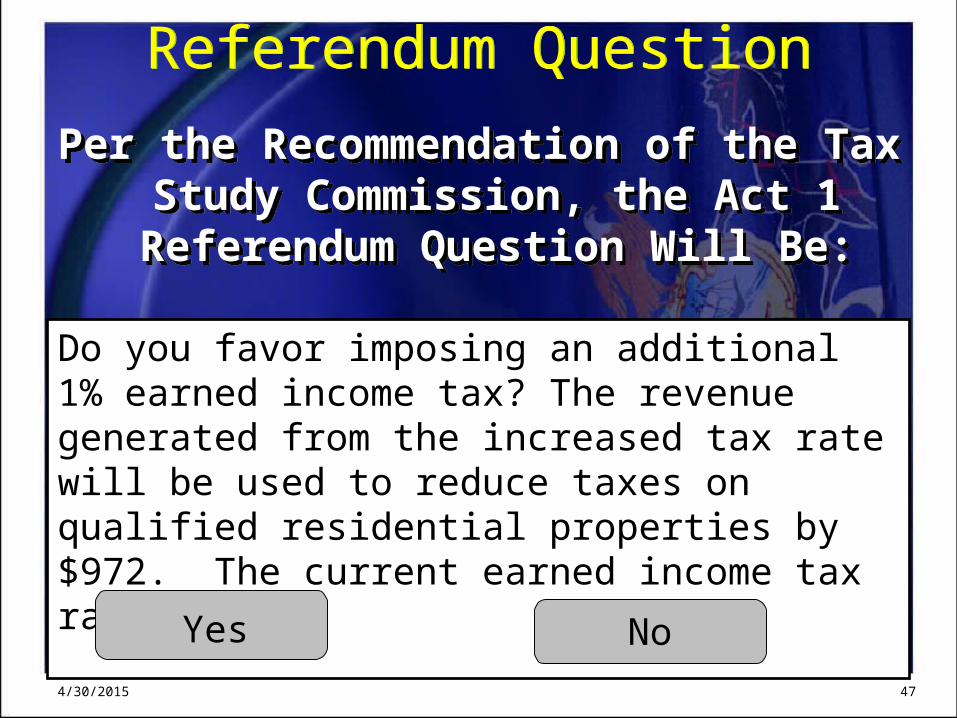
Referendum QuestionReferendum Question
Per the Recommendation of the Tax Study Commission, the Act 1 Referendum
Question Will Be:
Per the Recommendation of the Tax Study Commission, the Act 1 Referendum
Question Will Be:
4/30/2015
Do you favor imposing an additional 1% earned income tax? The revenue generated from the increased tax rate will be used to reduce taxes on qualified residential properties by $972. The current earned income tax rate is .5%.
Yes No
484/30/2015
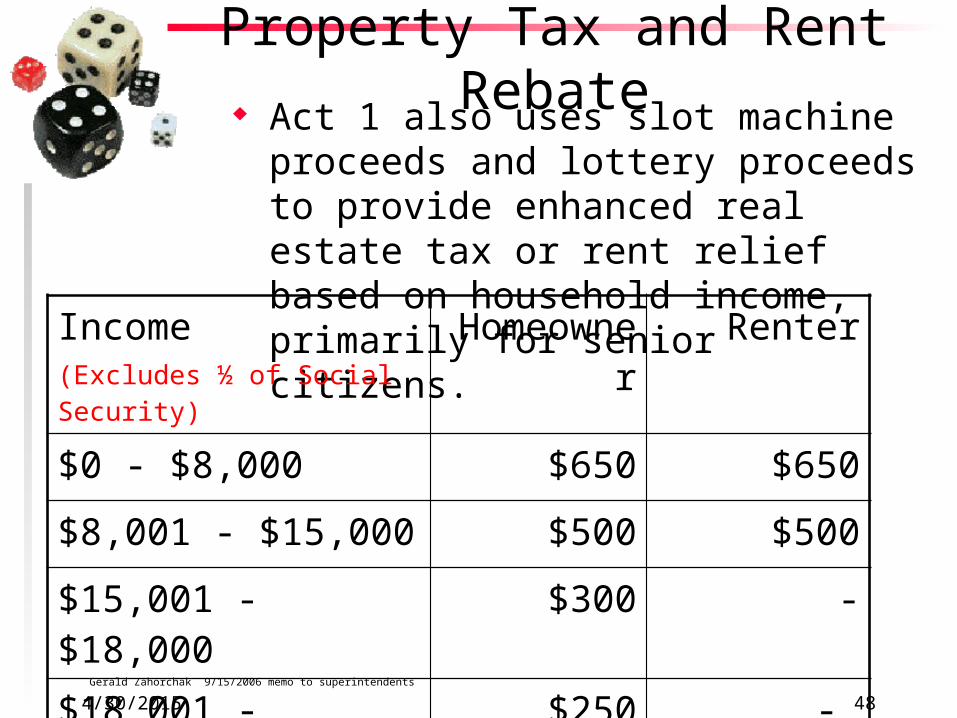
Property Tax and Rent Rebate Act 1 also uses slot machine proceeds and
lottery proceeds to provide enhanced real estate tax or rent relief based on household income, primarily for senior citizens.
Income (Excludes ½ of Social Security)
Homeowner Renter
$0 - $8,000 $650 $650
$8,001 - $15,000 $500 $500
$15,001 - $18,000 $300 -
$18,001 - $35,000 $250 -
Gerald Zahorchak 9/15/2006 memo to superintendents
494/30/2015
FUNDING PUBLIC EDUCATION
Questions?