Embed Size (px)
Citation preview

November 1, 2010. 8:00am – 9:30am
MICHAEL FLYNNChief Executive OfficerSmith Senior Living
43-B: Financial Ratios: Tools to Measure Organizational Success
MICHAEL KELLYManaging DirectorZiegler
KEVIN MULHEARNCFO, Senior MinistriesAlexian Brothers Health System

2
Jeffrey Boland ParenteBeard LLCDave Bond CCRC Actuaries, LLCKaren Christiansen ACTS Retirement-Life Communities, Inc.Michael Connell Asbury Communities, Inc.Michael Flynn Smith Senior LivingAmy Hayman Cain Brothers & CompanyLeonard Huck Consumer, ViMichael Jacobs Deer Meadows Retirement CommunityMichael Kelly ZieglerGeary Milliken Carroll Lutheran VillageKevin Mulhearn * Alexian Brothers Health SystemTimothy Myers The Kendal CorporationJ. Wickliffe Peterson Senior Resource Group, LLCBrian Williamson Standard & Poor's * FAP Chair
This Session is presented by theCARF-CCAC Financial Advisory Panel

3
Information About CARF-CCAC
• For general information:– Booth #815– www.carf.org/aging, 1-866-888-1122
• CARF-CCAC Peer Accreditation Surveyors may receive CARF continuing education credits for this session. Sign orange sheet in back of room upon exit.
• To become a peer surveyor:Please go to www.carf.org/surveyor for criteria and downloadable application.

4
2010 Ratio Trends Publication
• CARF-CCAC accredited providers receive complimentary copies by mail automatically as a value-add
• CARF-CCAC booth #815 to purchase a copy
• http://bookstore.carf.org foronline ordering

55
Presentation Outline
Section 1 - Financial Ratios in Focus
Section 2 - Going Beyond Financial Ratios
Section 3 - Innovative Ways to Communicate Information to Leadership and the Board
Questions & Answers

Financial Ratios in Focus
Section 1
TOM MEYERSManaging DirectorZiegler Capital Markets
MICHAEL KELLYManaging DirectorZiegler

77
Senior Living MarketplaceSenior Living Success: Key Drivers
Senior Living Financial StrengthSenior Living Financial StrengthSenior Living Financial Strength
BaselineOperationsBaselineBaseline
OperationsOperationsNet Proceeds from
Entrance FeesNet Proceeds fromNet Proceeds from
Entrance FeesEntrance Fees
ContributionsContributionsContributions TreasuryManagement
TreasuryTreasuryManagementManagementCapital
StructureCapitalCapital
StructureStructure

88
2010 CARF-CCAC PublicationFinancial Ratios & Trend Analysis
• 2010 marks 18th publication• Three types of ratios:
– Profitability (5)– Liquidity (3)– Capital Structure (9)
• Single-sites (167) and multi-sites (30)
• Predominantly not-for-profit (just 3 for-profit orgs)
• Partners in the publication: CARF-CCAC, ParenteBeard, Ziegler
9
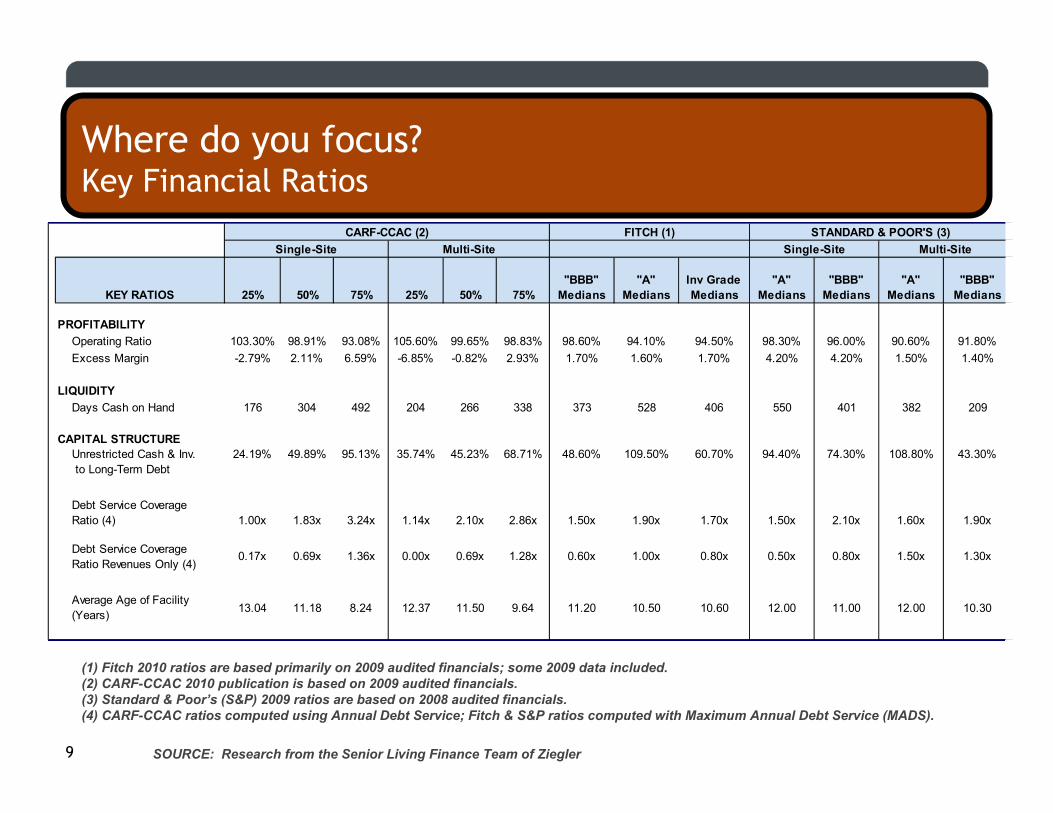
Where do you focus? Key Financial Ratios
25% 50% 75% 25% 50% 75%"BBB"
Medians"A"
MediansInv Grade Medians
"A"Medians
"BBB"Medians
"A"Medians
"BBB"Medians
Operating Ratio 103.30% 98.91% 93.08% 105.60% 99.65% 98.83% 98.60% 94.10% 94.50% 98.30% 96.00% 90.60% 91.80%Excess Margin -2.79% 2.11% 6.59% -6.85% -0.82% 2.93% 1.70% 1.60% 1.70% 4.20% 4.20% 1.50% 1.40%
Days Cash on Hand 176 304 492 204 266 338 373 528 406 550 401 382 209
Unrestricted Cash & Inv. to Long-Term Debt
24.19% 49.89% 95.13% 35.74% 45.23% 68.71% 48.60% 109.50% 60.70% 94.40% 74.30% 108.80% 43.30%
Debt Service CoverageRatio (4) 1.00x 1.83x 3.24x 1.14x 2.10x 2.86x 1.50x 1.90x 1.70x 1.50x 2.10x 1.60x 1.90x
Debt Service CoverageRatio Revenues Only (4)
0.17x 0.69x 1.36x 0.00x 0.69x 1.28x 0.60x 1.00x 0.80x 0.50x 0.80x 1.50x 1.30x
Average Age of Facility (Years) 13.04 11.18 8.24 12.37 11.50 9.64 11.20 10.50 10.60 12.00 11.00 12.00 10.30
PROFITABILITY
FITCH (1) STANDARD & POOR'S (3)Single-Site Multi-Site
LIQUIDITY
Multi-SiteCARF-CCAC (2)
CAPITAL STRUCTURE
Single-Site
KEY RATIOS
SOURCE: Research from the Senior Living Finance Team of Ziegler
(1) Fitch 2010 ratios are based primarily on 2009 audited financials; some 2009 data included.(2) CARF-CCAC 2010 publication is based on 2009 audited financials.(3) Standard & Poor’s (S&P) 2009 ratios are based on 2008 audited financials.(4) CARF-CCAC ratios computed using Annual Debt Service; Fitch & S&P ratios computed with Maximum Annual Debt Service (MADS).

101010
Trends In RatingsKey Financial Ratios - Comparison of Published Ratios
Liquidity Ratios Fitch CCAC S&PDays Cash on Hand (Unrestricted) (1) � � �Cushion Ratio � � �Cash to Debt � � �Net Days in Accounts Receivable � � NoDays in Current Liabilities � No No
Profitability RatiosOperating Margin � � (2) � (4)Operating and Investment Income Margin No No �Operating Ratio � � � (5)Excess Margin � � �Net Operating Margin No � NoNet Operating Margin (Includes Net Entry Fees) No � No
Capital Structure RatiosDebt Service Coverage Ratio (Includes Net Entry Fees) � � (3) �Debt Service Coverage Ratio-Revenue Only � � (3) �MADS as a % of Revenue � � (3) �Debt to Capitalization � � �Debt to Capitalization-Adj. (Includes Deferred Revenue) � � �Debt to Assets � � NoAverage Age of Facility � � NoCapital Expenditures as a % of Depreciation � � No
(1) None provide good guidance as to what constitutes “Unrestricted Cash”(2) CCAC computes ratio excluding contributions(3) CCAC computes ratio using annual debt service(4) S&P computes ratio excluding investment income and contributions(5) S&P computes ratio excluding interest expense

111111
Key Financial RatiosRatio Strengths
• Ratios are a useful tool in analyzing an organization’s financial strengths and weaknesses
• Ratios are most useful in identifying trends
• Arithmetic computations are easy to use for comparisons, both internally and externally
• Ratios are useful in identifying unusual operating results
• Ratios are a useful reporting tool
• Ratios are widely accepted by the external credit markets (rating agencies, banks, etc.)

121212
Key Financial RatiosRatio Limitations
• Flashlight problem– Ratios are very specific as to what they measure
• Trees through the forest problem– What does the big picture look like?
• Comparability problem– Accredited and rated facilities may operate at a higher
financial level than the average– Lifecycle issues– Contract issues– Organization structure/composition
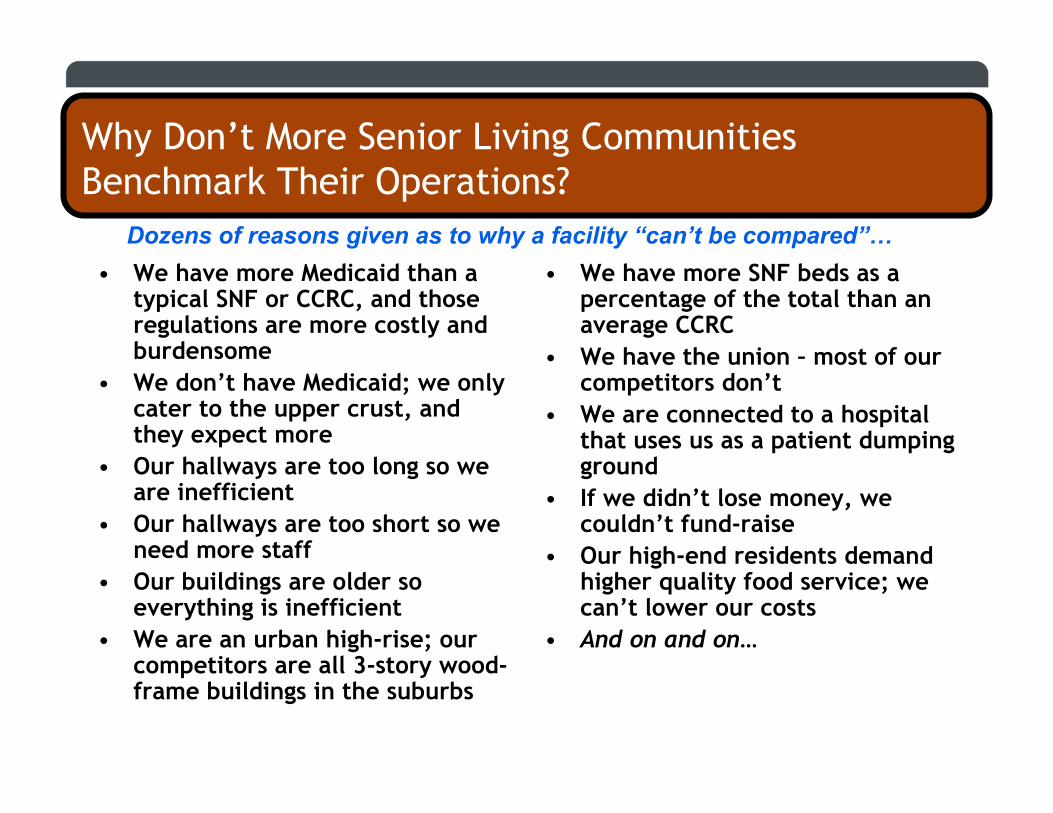
Dozens of reasons given as to why a facility “can’t be compared”…
Why Don’t More Senior Living Communities Benchmark Their Operations?
• We have more Medicaid than a typical SNF or CCRC, and those regulations are more costly and burdensome
• We don’t have Medicaid; we only cater to the upper crust, and they expect more
• Our hallways are too long so we are inefficient
• Our hallways are too short so we need more staff
• Our buildings are older so everything is inefficient
• We are an urban high-rise; our competitors are all 3-story wood-frame buildings in the suburbs
• We have more SNF beds as a percentage of the total than an average CCRC
• We have the union – most of our competitors don’t
• We are connected to a hospital that uses us as a patient dumping ground
• If we didn’t lose money, we couldn’t fund-raise
• Our high-end residents demand higher quality food service; we can’t lower our costs
• And on and on…

1414
Operational ExcellenceNuances of Financial Ratios
Net Operating Margin RatioNet Operating Margin Ratio – Focuses on the core operations: resident revenue – resident expense. Excludes non-resident revenues and excludes interest/dividend income, interest expense, depreciation, taxes, amortization, contributions and entry fee amortization.
Net Operating Margin RatioNet Operating Margin Ratio--AdjustedAdjusted – Same as above, but including net entry fees received.
Operating RatioOperating Ratio –– Differs from NOM only in that it includes interest income, interest expense and net assets released for operations. Like NOM --- cash-based.
Operating MarginOperating Margin –– Includes the impact of non-cash operating items such as earned entry fees and depreciation
Total Excess MarginTotal Excess Margin – Builds on the Operating Margin Ratio but adds impact of realized investment gains or losses, contributions and other non-operating revenues/gains.
CORESERVICES
ALLRESOURCES

151515
Key Financial Definitions*Profitability Ratios (Cont’d)
•• Net Operating Margin RatioNet Operating Margin Ratio – focuses on the core operations. Resident revenue - operating expenses plus interest, depreciation, taxes and amortization expenses.
•• Net Operating Margin RatioNet Operating Margin Ratio--AdjustedAdjusted - same as above, but including net entry fees received.
* Highlighting CARF- CCAC Throughout

161616
Key Financial Definitions*Profitability Ratios
•• Operating MarginOperating Margin - reflects the percentage of operating revenue retained after payment of operating expenses. Primary measure of profitability.
•• Operating RatioOperating Ratio - measures the percentage of cash expenses as related to revenue and is a measurement of the efficiency of an operation.
•• Total Excess MarginTotal Excess Margin - same as operating margin except this ratio includes non-operating revenue.
* Highlighting CARF- CCAC Throughout

171717
Fourteen-Year Trends Net Operating Margin Ratio
Source: Financial Ratios & Trend Analysis of CARF-CCAC Accredited Organizations, 2010.
• Median for both provider types improved markedly• Highest value in history of study
• As in the past, the operating performance of multi-site providers is generally weaker than the single-site providers• BUT the gap narrowed in 2009
• Providers continue to face• Medicaid reimbursement issues• Occupancy challenges from
housing market
50th PERCENTILE
-8.00
-6.00
-4.00
-2.00
0.00
2.00
4.00
6.00
8.00
1996
1997
1998
1999
2000
2001
2002
2003
2004
2005
2006
2007
2008
2009
(Per
cent
ages
)
Single-Site Multi-Site

181818
View from CARF-CCAC Definition of Net Operating Margin
EBITDA NOM
NET INCOME NET INCOME- non-resident revenues+ non-resident expenses
+Interest Expense +Interest Expense+Taxes +Taxes+ Depreciation + Depreciation+ Amortization + Amortization

191919
Fourteen-Year Trends Net Operating Margin- Adj. Ratio (NOM-A)
• NOM-A highlights importance of cash flow from entrance fees, compared to NOM (where net entrance fee receipts are excluded)
• Creditors, regulators, rating agencies, etc. acknowledge importance of entrance fees in offsetting healthcare risk, operating costs
• Performance of both provider types has converged over the years with multi sites improving
50th PERCENTILE
5.50
7.50
9.50
11.50
13.50
15.50
17.50
19.50
21.50
1996
1997
1998
1999
2000
2001
2002
2003
2004
2005
2006
2007
2008
2009
(Per
cent
ages
)
Single-Site Multi-Site
Source: Financial Ratios & Trend Analysis of CARF-CCAC Accredited Organizations, 2010.

202020
Nineteen-Year Trends Total Excess Margin (TEM)
• TEM provides the “all-in” look of an organization’s profitability– Including non-operating sources
of revenues and gains and charitable contributions
• Equity markets and charitable giving play important roles– Average realized loss for multi-
sites was approximately $3 M but average charitable contributionsincreased
– Single-sites faced double whammy: average realized losses increased and average charitable contributions declined
50th PERCENTILE
-2.00
-1.00
0.00
1.00
2.00
3.00
4.00
5.00
6.00
7.00
8.00
1991
1992
1993
1994
1995
1996
1997
1998
1999
2000
2001
2002
2003
2004
2005
2006
2007
2008
2009
(Per
cent
ages
)
Single-Site Multi-Site
Source: Financial Ratios & Trend Analysis of CARF-CCAC Accredited Organizations, 2010.

212121
Key Financial Definitions*Liquidity Ratios
•• Days Cash on HandDays Cash on Hand - measures days of cash available to cover operating expenses.
•• Cushion RatioCushion Ratio - measures the amount of cash to annual debt service.
•• Days in Accounts ReceivableDays in Accounts Receivable - measures the average number of days’ accounts receivables remain outstanding.
* Highlighting CARF-CCAC Throughout
222222
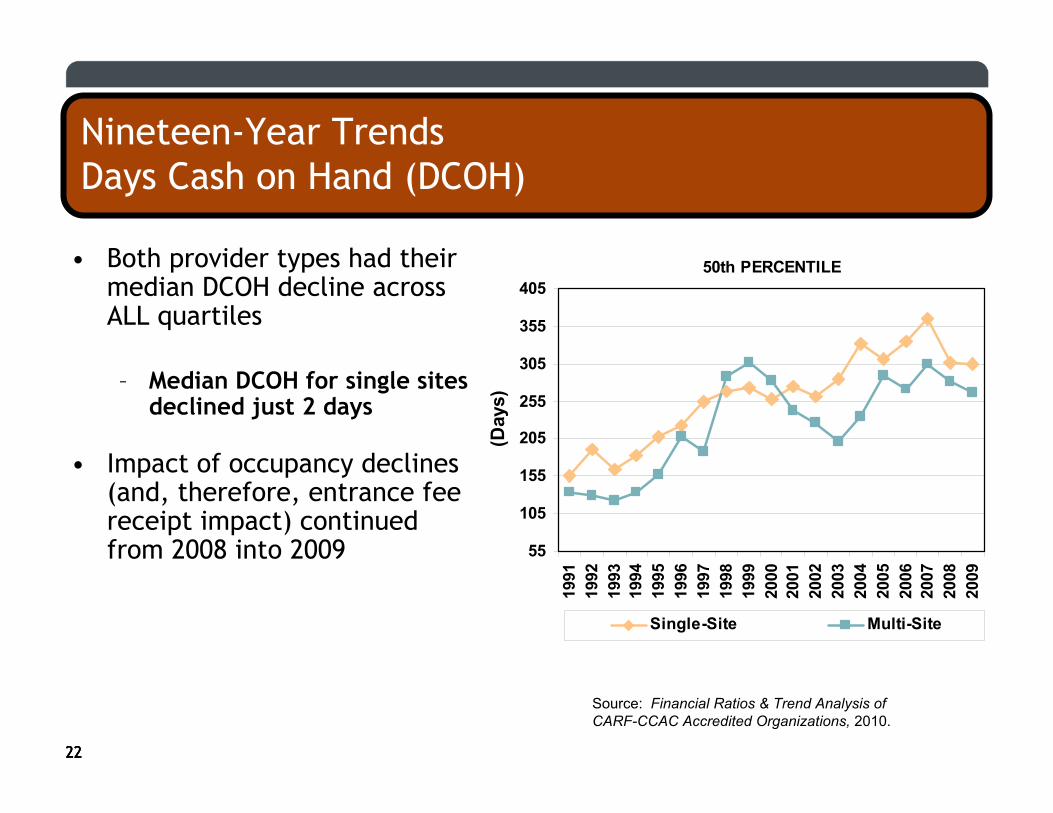
Nineteen-Year Trends Days Cash on Hand (DCOH)
• Both provider types had their median DCOH decline across ALL quartiles
– Median DCOH for single sites declined just 2 days
• Impact of occupancy declines (and, therefore, entrance fee receipt impact) continued from 2008 into 2009
50th PERCENTILE
55
105
155
205
255
305
355
405
1991
1992
1993
1994
1995
1996
1997
1998
1999
2000
2001
2002
2003
2004
2005
2006
2007
2008
2009
(Day
s)
Single-Site Multi-Site
Source: Financial Ratios & Trend Analysis of CARF-CCAC Accredited Organizations, 2010.

232323
Key Financial Definitions*Capital Structure Ratios
•• Debt Service Coverage RatioDebt Service Coverage Ratio - measures the ability of the organization to pay its long-term debt through operations.
•• Debt Service Coverage RatioDebt Service Coverage Ratio--Revenue BasisRevenue Basis - more stringent measure of Debt Service Coverage by excluding net entrance fees received.
* Highlighting CARF-CCAC Throughout

242424
Key Financial Definitions*Capital Structure Ratios (Cont’d)
•• Debt Service as a Percentage of RevenueDebt Service as a Percentage of Revenue - measures percentage of total revenue applied to annual debt reductions.
•• Unrestricted Cash and Investments to LongUnrestricted Cash and Investments to Long--Term DebtTerm Debt -- gaugesthe relative strength of organization’s cash (and equivalents) position as related to long-term debt.
* Highlighting CARF-CCAC Throughout
•• LongLong--Term Debt as a Percentage of Total Capital RatioTerm Debt as a Percentage of Total Capital Ratio - measure of extent to which a business has relied on debt versus retainedearnings and invested or donated capital.
•• LongLong--Term Debt as a Percentage of Total Capital Ratio AdjustedTerm Debt as a Percentage of Total Capital Ratio Adjusted -similar to the Long-Term Debt as a Percentage of Total Capital Ratio, except that it adds deferred revenue from entry fees to the denominator.

252525
Key Financial Definitions*Capital Structure Ratios (Cont’d)
•• LongLong--Term Debt to Total AssetsTerm Debt to Total Assets - measures percentage of the organization owned by creditors.
•• Average Age of FacilityAverage Age of Facility - shows evidence of a commitment to renewal through renovation and/or replacement of their buildingsand grounds.
•• Capital Expenditures as a Percentage of DepreciationCapital Expenditures as a Percentage of Depreciation – a tool for understanding the sufficiency of their annual reinvestment in their physical plant.
* Highlighting CARF- CCAC Throughout

262626
Nineteen-Year Trends Debt Service Coverage Ratio (DSCR)
• Debt Service Coverage (DSCR) ratio is generally considered to be the most important ratio for evaluating an organization’s short- and long-term financial viability
Reflects an organization’s ability to fund debt service with cash flow from net cash revenues and net entrance fees
• DSCR declined across all quartiles for both provider types
50th PERCENTILE
1.00
1.50
2.00
2.50
3.00
3.50
1991
1992
1993
1994
1995
1996
1997
1998
1999
2000
2001
2002
2003
2004
2005
2006
2007
2008
2009
(Rat
io)
Single-Site Multi-Site
Source: Financial Ratios & Trend Analysis of CARF-CCAC Accredited Organizations, 2010.

272727
Nineteen-Year TrendsDebt Service Coverage Ratio-Revenue Basis
• Measures an organization’s ability to meet debt serviceobligations THROUGH REVENUES ALONE
• Results are substantially impacted by pricing policies and contract types
• Multi-sites generally able to manage operations relative to annual debt service more effectively than single-sites but performance converged in 2009
50th PERCENTILE
0.00
0.20
0.40
0.60
0.80
1.00
1.20
1.40
1.60
1991
1992
1993
1994
1995
1996
1997
1998
1999
2000
2001
2002
2003
2004
2005
2006
2007
2008
2009
(Rat
io)
Single-Site Multi-Site
Source: Financial Ratios & Trend Analysis of CARF-CCAC Accredited Organizations, 2010.

282828
Fourteen-Year Trends Average Age of Facility (AGE)
50th PERCENTILE
7.50
8.00
8.50
9.00
9.50
10.00
10.50
11.00
11.50
12.00
1995
1996
1997
1998
1999
2000
2001
2002
2003
2004
2005
2006
2007
2008
2009
(Yea
rs)
Single-Site Multi-Site
Source: Financial Ratios & Trend Analysis of CARF-CCAC Accredited Organizations, 2010.
• This ratio (AGE) measures an organization’s commitment to maintaining its physical plant
• Many organizations are embarking upon repositionings and renovations, but AGE suggests the investment isn’t sufficient to counter the aging of their physical plants– Rating agencies are
increasingly pushing for equivalency between annual capital expenditures and annual deprecation expense

292929
Capital Expenditures as a Percentage of Depreciation
• First year of data collection so no trending possible
• Important for organizations to show commitment to reinvest in physical plant at least to level of annual depreciation
Source: Financial Ratios & Trend Analysis of CARF-CCAC Accredited Organizations, 2010.
50th PERCENTILE
0
20
40
60
80
100
120
2009
(Per
cent
age)
Single-Site Multi-Site

303030
Operational ExcellenceThe Strong
• Views emerging from actively serving over 200 senior living organizations from an investment bank (Ziegler, of course!)
The strong are getting stronger… when: management is proactive, understanding the key drivers of financial success… when: the board keeps a strategic focus… when: planning is a priority, built on the strengths and addressing the weaknesses of past, present and future operations

313131
Operational ExcellenceThe Weak
The weak are getting weaker… when: management is distracted or unwilling to tackle challenging issues (e.g., fee increases)… when: the board lacks focus or interest on key strategic initiatives needed to keep organization surviving and thriving… when: planning is reactive

Going Beyond Financial Ratios
Section 2
TOM GIBBONSManaging DirectorZiegler Capital Markets
KEVIN MULHEARNCFO, Senior MinistriesAlexian Brothers Health System

3333
Alexian Brothers Health System
• AZ 100 #: 11 (Hospital-Sponsored) Headquarters Location: Arlington Heights, IL
• Year Founded: 1259Senior Living Founded: 1980’s
• Total Units (as of 12/31/08): 1,507– 704 ILUs– 304 ALUs– 494 NCBs
• Total # of Communities: 9 # of CCRCs: 2
• Debt Rating: Yes Fitch: A- Moody’s : A-3
• Affordable Housing: St. Louis, Chicago
• Home & Community Based : PACE, Live at Home, Senior Centers, Home Care, Senior Centers, Senior Employment programs

3434
What’s Important Depends on Your Perspective
• Employees
• Managers
• Senior Leadership Team
• Board of Directors
• Residents
• Other Stakeholders

3535
What’s Important Depends on Your Perspective
• Employees– Individual Hours Worked– PTO Available– Census
• Managers– Census– Financial Performance Compared To Budget– Departmental Expenses Compared To Budget– Per Unit Costs– Staffing Variances

3636
What’s Important Depends on Your Perspective
• Senior Leadership Team– Census– Financial Performance Compared To Budget– Departmental Expenses Compared To Budget– Staffing Variances– Capital Expenditures
• Board of Directors– Census– Financial Performance Compared To Budget– Financial Performance Compared To Benchmarks– Capital Expenditures– Quality Indicators– Debt Compliance

3737
What’s Important Depends on Your Perspective
• Residents– Census– Financial Performance Compared To Budget– Benchmark Comparison to Industry/Others– CMS Five Star Ratings
• Other Stakeholders

3838
Picking Your Key Financial Ratios
Financial Ratio's Actual Budget Variance Actual Budget Variance Prior Year
Operating Margin % 16.5% 22.9% 6.3% 23.6% 23.6% -0.1% 31.5%
Operating Ratio 78.5% 72.4% -6.1% 71.6% 71.7% 0.1% 64.6%
Excess Margin % 16.5% 22.9% 6.3% 23.6% 23.6% -0.1% 31.5%
Operating Cash Flow (in 000's) $ 175 $ 221 $ 46 $ 1,960 $ 1,990 $ 31 $ 2,164
Operating Cash Flow Margin % 19.1% 23.7% 4.6% 23.7% 23.6% -0.1% 26.3%
Days in Accounts Receivable 32.0 48.8
Days Cash on Hand 788.6 679.3

3939
What Other Ratios Are Important
• Revenue – Volumes– Capacity– Payor Mix– Flow
• Staffing– F.T.E.’S– F.T.E.’s Per Occupied Unit– Overtime Hours as % of Total Hours– Non-Productive Hours as % of Total Hours– Nursing Hours Per Resident Day
• Gross• Net

4040
Communicating the Information Effectively
• KISS Principle - Keep It Simple– What are the Key Drivers
Marketing and Occupancy:
4141
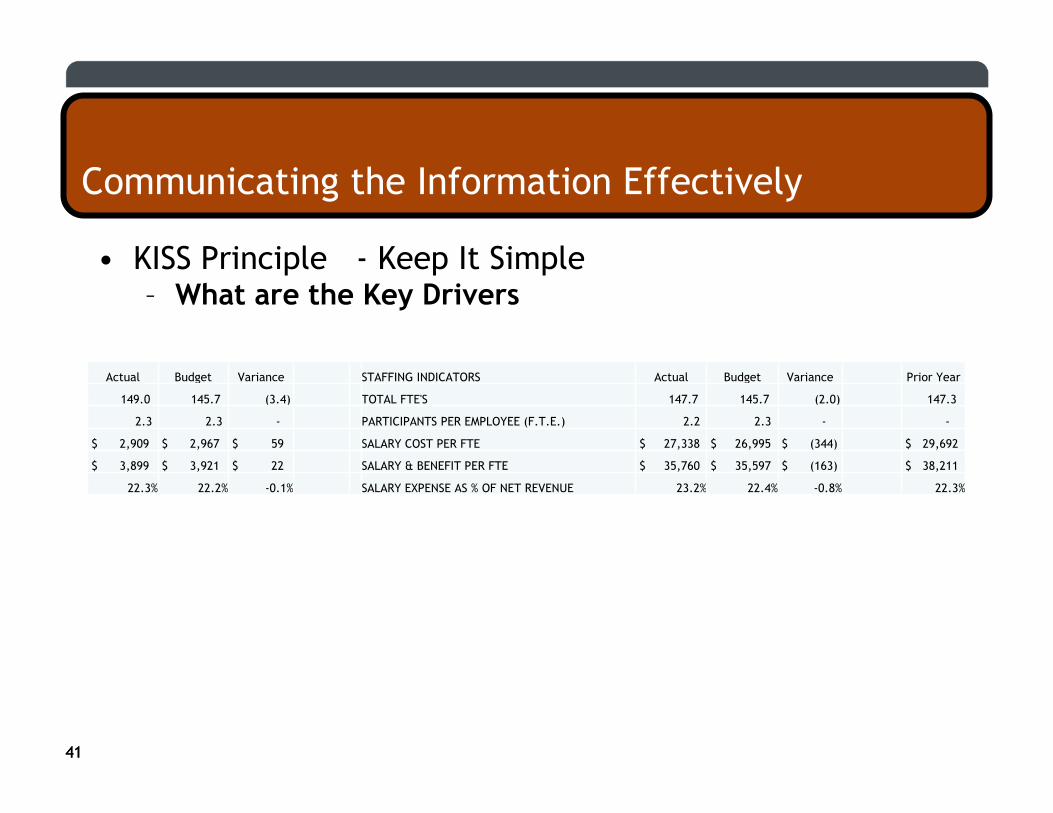
Communicating the Information Effectively
• KISS Principle - Keep It Simple– What are the Key Drivers
Actual Budget Variance STAFFING INDICATORS Actual Budget Variance Prior Year
149.0 145.7 (3.4) TOTAL FTE'S 147.7 145.7 (2.0) 147.3
2.3 2.3 - PARTICIPANTS PER EMPLOYEE (F.T.E.) 2.2 2.3 - -
$ 2,909 $ 2,967 $ 59 SALARY COST PER FTE $ 27,338 $ 26,995 $ (344) $ 29,692
$ 3,899 $ 3,921 $ 22 SALARY & BENEFIT PER FTE $ 35,760 $ 35,597 $ (163) $ 38,211
22.3% 22.2% -0.1% SALARY EXPENSE AS % OF NET REVENUE 23.2% 22.4% -0.8% 22.3%

4242
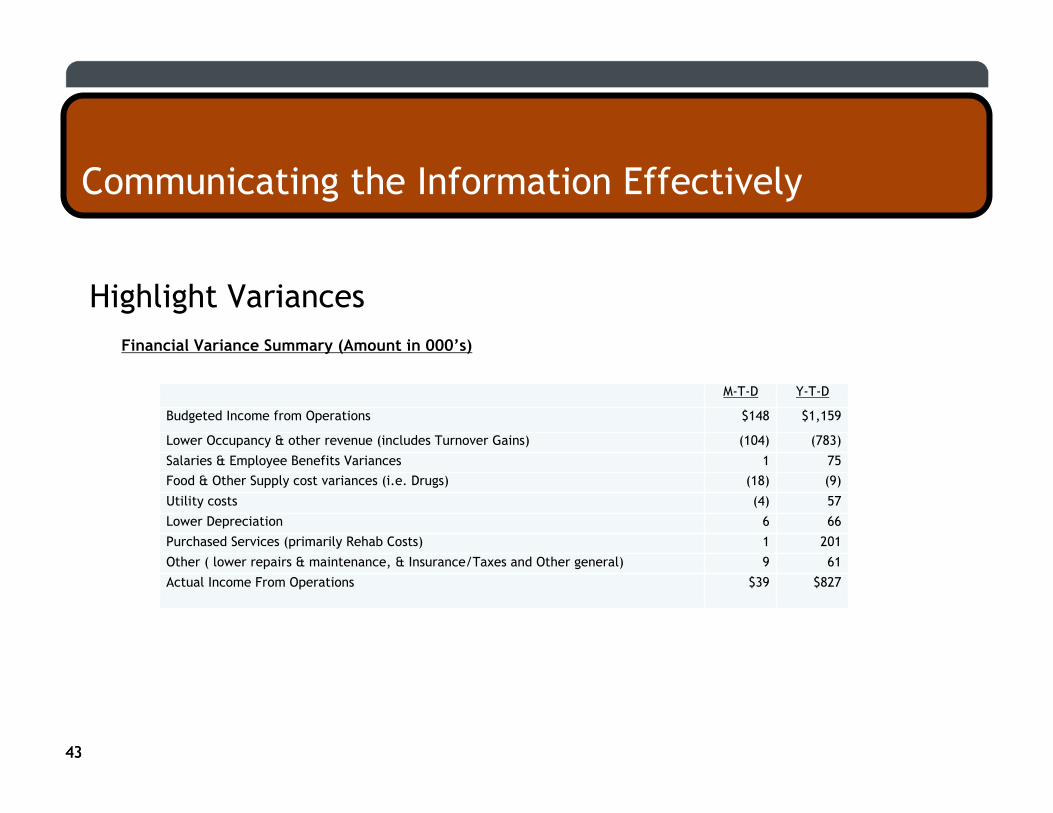
Communicating the Information Effectively
Highlight Variances
09/30/10 Budget F.T.E.’s 254.9Therapy F.T.E.’s – Previously Contract Service 5.5
Beauty Shop F.T.E.’s – Changed to Contract Service (3.0)
Lower Nursing, Assisted Living and Wellness Staffing levels (8.9)
Other (.7)
09/30/10 Actual F.T.E.’s 247.8
4343
Communicating the Information Effectively
Highlight Variances
M-T-D Y-T-D
Budgeted Income from Operations $148 $1,159
Lower Occupancy & other revenue (includes Turnover Gains) (104) (783)
Salaries & Employee Benefits Variances 1 75Food & Other Supply cost variances (i.e. Drugs) (18) (9)
Utility costs (4) 57
Lower Depreciation 6 66
Purchased Services (primarily Rehab Costs) 1 201
Other ( lower repairs & maintenance, & Insurance/Taxes and Other general) 9 61
Actual Income From Operations $39 $827
Financial Variance Summary (Amount in 000’s)

4444
Communicating the Information Effectively
Variance Analysis
Alexian Brothers Health System
Threshold AnalysisSort
Column Threshold
Month ending: September 30, 2010 H $ 1,000
FSSummary: E_Supplies
Prior Mth Prior Mth Prior Mth Prior Current Mth Prior Avg Current Red
Dept Description Acct Type Account June July August Average September Variance Budget Flag
1046201MIL Non-Certified Nursing 6001Expense 6001-Client Supplies 6,283 4,084 5,755 5,374 1,059 (4,315) 7,333 O
1046301MIL Village Square (Alu) 6001Expense 6001-Client Supplies 662 322 602 528 32 (496) 417
1046501MIL Village Wellness (Supp Care) 6001Expense 6001-Client Supplies 107 - 680 263 220 (43) 42
1046601MIL Adult Day Care 6001Expense 6001-Client Supplies 91 64 105 86 52 (34) 71
1046701MIL Residential/Assisted Living 6001Expense 6001-Client Supplies 246 151 95 164 - (164) 500

4545
Communicating the Information Effectively
• Trending Data
Month To Date Performance: Jan Feb Mar Apr May June July Aug Sep Oct Nov Dec Actual BudgetOperating revenues:
Gross Resident Services Revenue $ 1,278 $ 1,139 $ 1,265 $ 1,220 $ 1,298 $ 1,107 $ 1,158 $ 1,292 $ 1,248 $ - $ - $11,005 $ 14,783 Less: Deductions 325 289 324 311 404 310 364 388 364 - - 3,079 4672
Gross Resident Services Revenue 953 850 941 909 894 797 794 904 884 - - - 7,926 10,111
Other Operating Revenues: 4 - 2 2 2 2 9 1 2 - - 24 30Total Operating Revenues: $ 957 $ 850 $ 943 $ 911 $ 896 $ 799 $ 803 $ 905 $ 886 $ - $ - $ - $ 7,950 $ 10,141
Operating expenses:Salaries & Benefits $ 401 $ 350 $ 392 $ 358 $ 395 $ 385 $ 414 $ 378 $ 385 $ - $ - $ 3,458 $ 5,002 Supplies, Purch. Svcs & Other General 323 287 341 293 318 302 311 351 348 - - 2,874 3,479 Provision for uncollectible receivables 4 4 12 22 13 11 3 36 25 - - 130 13Insurance & Taxes 72 72 71 72 72 72 65 67 67 - - 630 684Utilities 27 18 26 9 17 21 28 23 24 - - 193 216Depreciation & Amortization 36 36 36 36 36 36 35 34 36 - - 321 379Total Operating Expenses: 863 767 878 790 851 827 856 889 885 - - - 7,606 9,773
Income From Operations: $ 94 $ 83 $ 65 $ 121 $ 45 $ (28) $ (53) $ 16 $ 1 $ - $ - $ - $ 344 $ 368
Other revenues and expenses:Investment Income $ 39 $ 6 $ 69 $ 95 $ 100 $ (90) $ (29) $ 126 $ 16 $ - $ - $ 332 401Interest Expense - - - - - - - - - - - - 0Other - - - - - - - - - - - - 0Total other revenues and expenses $ 39 $ 6 $ 69 $ 95 $ 100 $ (90) $ (29) $ 126 $ 16 $ - $ - $ - $ 332 $ 401 Net Income/(Loss) $ 133 $ 89 $ 134 $ 216 $ 145 $ (118) $ (82) $ 142 $ 17 $ - $ - $ - $ 676 $ 769 Budgeted Net Income $ 88 $ 46 $ 87 $ 72 $ 85 $ 71 $ 84 $ 85 $ 68 $ 83 $ 70 $ 82 Prior Year Net Income $ 208 $ (92) $ 27 $ 221 $ 233 $ 244 $ 76 $ 267 $ 95 $ 224 $ (38) $ (42)

4646
Communicating the Information Effectively
• Graphs

Innovative Ways to Communicate Information to Leadership and The Board
Section 3
TOM GIBBONSManaging DirectorZiegler Capital Markets
MICHAEL FLYNNChief Executive OfficerSmith Senior Living

48
Smith Senior Living Organizational Structure
48

49
Smith Senior Living Units
49
Unit Type Smith Village Smith Crossing Total
Independent 152 97 249
Assisted 58 32 90
Assisted Memory 24 16 40
Skilled 61 30 91
Skilled Memory 39 0 39
Total 334 175 509

5050
Paperless Environment
• A Microsoft product called SharePoint is used to disseminate information through the organization’s intranet.– Financial statements and key indicator reports are
distributed through the intranet to avoid hard copy distribution
– Accounts payable invoices, receiving documents, etc. are scanned and routed to the appropriate manager for review and approval
– Planning is underway to distribute board materials electronically and use I-Pads in lieu of paper

51
Management Information Tools
• Daily Census Reports
• Payroll Dashboards
51

52
Daily Census Report
52

53
Payroll Dashboards
53
54
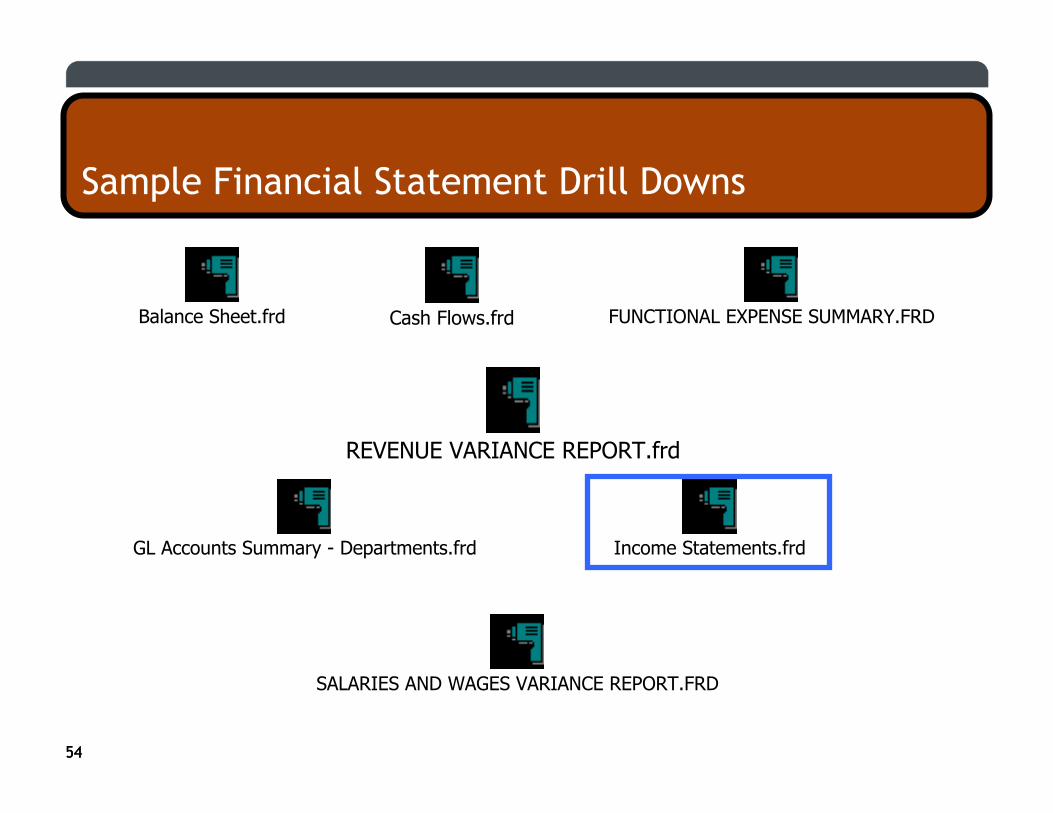
Sample Financial Statement Drill Downs
54
Balance Sheet.frd Cash Flows.frd FUNCTIONAL EXPENSE SUMMARY.FRD
GL Accounts Summary - Departments.frd
REVENUE VARIANCE REPORT.frd
SALARIES AND WAGES VARIANCE REPORT.FRD
Income Statements.frd

55
Income Statement Drill Down Menu
55

56
Smith Village Income Statement
56

57
General & Administrative Expenses
57

58
Pre-employment details
58

59
Paperless Processing
E-mails are sent to department heads to approve items forpayment electronically
59

60
Accounts Payable Approval Screen
60

61
Detail that supports approval request
61
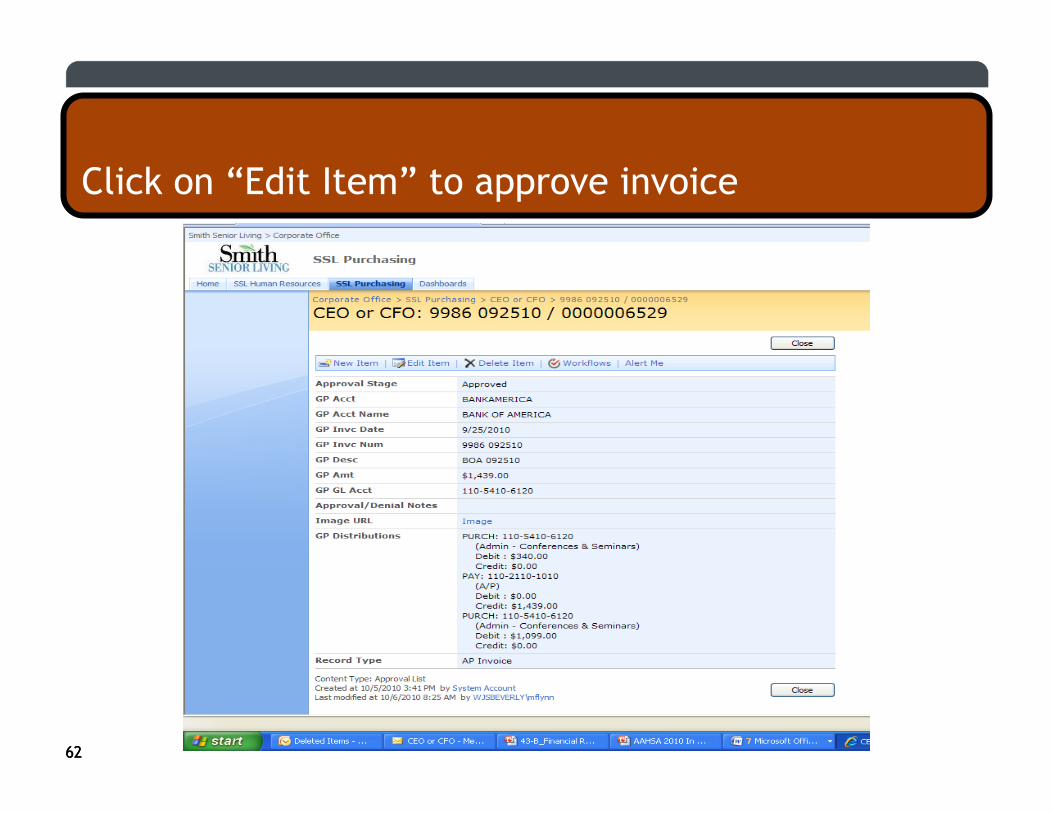
62
Click on “Edit Item” to approve invoice
62

63
Board Materials
• Organization of Board materials allows for use of electronic devices such as laptops or I-Pads.
63

64
Board of Trustees Meeting Materials
64

65
Drill down through laptop or I-Pad to specific page
65
66
Library of Public Information
A secure board portal is in place for easy access to publicdocuments such as:• 990 Tax Returns• Audited Financial Statements• Interim Financial Results• Financial Ratios

67
Board Portal Home Screen
67
To Log InIn the upper right corner of the display box click “Log in”.

68
Log-in Screen
68
Your Username is your first initial followed by your last name. By example:dhart = Deborah Hartmflynn = Mike Flynn
The password is XXXXXXAfter you enter the above information, click on the Log In button.

69
Select Charts
69
There are two areas for you to see information.ChartsClick on the word Charts from the Home Page. The following screen will populate.

70
Sample Dashboard Charts
70
These charts are populated from financial information as it is captured from the census and financial records of the company. Financial, Ancillary and Census Dashboards are updated when a month is closed in the general ledger system. Therefore month end results will not be available until after the 15th day of the following month. Publishing dates may vary.Payroll Dashboards are updated after each payroll is processed.To Navigate through the charts, simply click on the entity under each title.

71
Report Browser Screen
71
The browser is a repository of published reports. All reports are listed to the left by file name. You can sort columns by clicking on the title to each column. Multiple columns can be sorted by holding down the shift key during the column selection process. When columns are sorted, a small triangle will appear to show you if the column is presented in ascending or descending order.

72
Topics Selection “Cloud”
72
Because the repository is quite large and will only grow, it is recommended to use the topics selection area (cloud) to narrow down the index to find a document of your choice. The topic selection area can be made larger by sliding the divide bar. Hover over the bar until the dual directional arrows appear, hold down the left mouse button and drag side to side to change its shape.

73
Select Tax Return Category
73
Click on topics in the upper right box that help narrow your selection. These selections will appear in the lower right box. Selections can be removed from the lower right box by clicking on the ‘x’.

74
Pick the specific return you are looking for
74
For instance, if you are looking for the 990 Tax Return for 2006 for Smith Village, then click on Smith Village. You can then click on the smallicon to the left of the 2006 990 return.

75
990 Tax Return Detail
75
Navigation of the screen:Using your mouse, you can use the mouse wheel to zoom in/out. You can double click on a certain page and it will zoom to that page. You can use the arrows on the right or left to move pages.You can hold down the left mouse button and drag to position the document.You can print a page or the entire document via Adobe Acrobat by clicking on the Adobe icon in the lower right hand corner.The return arrow in the lower right corner will return you to the report browser selection box.

Questions & Answers