Embed Size (px)
Citation preview
4/2016

4/2016
BULGARIAN NATIONAL
BANK
Economic Review
Economic Review • 4/2016 2
The BNB quarterly Economic Review presents information and analysis of balance of payments dynamics, monetary and credit aggregates, their link with the development of the real economy, and their bearing on price stability. Pro-cesses and trends in the external environment are also analysed since the Bulgarian economy is directly influenced by them. This publication contains also quantitative assessments of the development in major macroeconomic indicators in the short run: inflation, economic growth, exports, imports, trade balance and BoP current account, foreign direct investment, monetary and credit aggregate dynamics.
The Economic Review, issue 4/2016 was presented to the BNB Governing Council at its 9 February 2017 meeting. It employs statistical data published up to 26 January 2017.
The estimates and projections published in this issue should not be regarded as advice or recommendation. Exclu-sively the information user is liable for any consequences thereof.
The Economic Review is available at the BNB website, Research and Publications menu, Periodical Publications sub-menu. Please address notes, comments and suggestions to the BNB Economic Research and Projections Directo-rate at 1000 Sofia, 1, Knyaz Alexander I Square.
© Bulgarian National Bank, 2016
1000 Sofia, 1, Knyaz Alexander I Square
Tel.: (+359 2) 9145 1351, 9145 1209, 9145 1231
Website: www.bnb.bg
This issue includes materials and data received up to 14 February 2017.
The contents of the BNB Economic Review may be quoted or reproduced without further permission. Due acknowledgement is requested.
Editing, typesetting and printing: BNB Publications Division of the Administrative Directorate.
ISSN 1312 – 420X (print)ISSN 2367 – 4962 (online)
3 Bulgarian National Bank
Summary .................................................................................................................................................................................7
1. External Environment ........................................................................................................................................................ 9
CurrentBusinessSituation............................................................................................................................................ 9
InternationalCommodityPrices.................................................................................................................................. 17
2. Financial Flows, Money and Credit ............................................................................................................................ 19
ExternalFinancialFlows.............................................................................................................................................. 19
MonetaryandCreditAggregates............................................................................................................................... 22
InterestRates.............................................................................................................................................................. 27
FinancialFlowsbetweentheGeneralGovernmentandOtherSectorsoftheEconomy............................................ 31
3. Economic Activity ............................................................................................................................................................. 34
CurrentEconomicEnvironment.................................................................................................................................. 34
HouseholdBehaviour.................................................................................................................................................. 36
FiscalPolicyEffectsontheEconomy......................................................................................................................... 39
BehaviourofFirmsandCompetitiveness................................................................................................................... 43
ExportsandImportsofGoodsandServices.............................................................................................................. 46
4. Inflation ................................................................................................................................................................................ 53
5. Bulgarian National Bank Forecast of Key Macroeconomic Indicators for 2016–2018 ............................ 61
Forecast..................................................................................................................................................................... 61
GDPDataRevisionsPublishedinOctober2016..................................................................................................... 63
RiskstotheForecast.................................................................................................................................................. 64
Contents
Highlights
• Basic Parameters of the 2017–2019 Budgetary Framework........ 41
Economic Review • 4/2016 4
Charts
GlobalPMIs....................................................................................9
WorldTrade....................................................................................9
InflationMeasuredthroughCPI....................................................10
ContributionstoRealGDPGrowthintheEuroAreabyCountry(Quarterly)..................................................................10
ContributionstoRealGDPGrowthintheEuroAreabyComponent(Quarterly)............................................................10
EuroAreaConsumerConfidenceIndices....................................11
ChangesinGDPand PMIs ofManufacturingandServices.......11
EuroAreaUnemploymentRateandEmploymentGrowth...........11
EuroAreaInflationRate................................................................12
ECBInterestRates,EONIAandExcessLiquidityintheEuroAreaBankingSystem.................................................12
EURIBORDynamics.....................................................................13
ContributiontoUSGDPGrowthbyComponent(Quarterly)........13
USManufacturingandServicesISM-PMIsandGDPGrowth(Quarterly)........................................................13
USConsumerConfidenceIndices...............................................14
USInflationRate..........................................................................14
USUnemploymentRateandNumberofNewEmployeesintheUSNon-farmSector...........................................................14
China’sQuarterlyandAnnualRealGDPGrowth.........................15
ManufacturingPMIsinChinaandMainSub-components...........15
TotalFixedCapitalInvestmentinSelectedSectorsinChina......15
InflationIndicesinChina..............................................................16
HousePricesinChina..................................................................16
CNY/USDExchangeRateandCNYEffectiveExchangeRateIndex...................................................................16
InternationalReservesofChina...................................................16
BrentCrudeOilPrices..................................................................17
WorldCrudeOilSupplyandDemand(Quarterly).......................17
BrentCrudeOilFuturesPrices....................................................17
PriceIndicesofMajorRawMaterialsandCommodityGroups...18
CurrentandCapitalAccountDynamicsandContributionbyComponent(onanAnnualBasis)...........................................19
FinancialAccountDynamicsandContributionbyComponent(onanAnnualBasis)...........................................20
DirectInvestmentLiabilitiesbyTypeofInvestment(onanAnnualBasis)....................................................................21
AnnualRateofChangeinМ3andContributionbyComponent..............................................................................22
AnnualGrowthoftheNon-governmentSector’sDepositsandContributionbySector..........................................................22
ReserveMoney.............................................................................22
BankDepositswiththeBNB........................................................23
CurrencyinCirculation.................................................................23
ForeignCurrencyPurchasesandSalesbetweentheBNBandBanks(onaMonthlyBasis)...................................................24
AnnualGrowthofLoanstoNon-financialCorporationsandContributionsofIndividualTypesofLoans...........................24
NewLoanstoNon-financialCorporations(MonthlyVolumes)........................................................................25
AnnualGrowthofHouseholdCreditandContributionsofIndividualTypesofLoans........................................................25
NewLoanstoHouseholds(MonthlyVolumes).............................25
ChangesinCreditStandards.......................................................26
InterbankMoneyMarketInstrumentsYieldCurve........................27
InterestRatesonThree-monthDeposits......................................27
InterbankMoneyMarketInterestRatesonOvernightDeposits..................................................................27
InterestRatesonNewTimeDeposits..........................................28
DistributionofInterestRatesonNewHouseholdTimeLevDeposits.................................................................................28
InterestRatesonNewLoanstoNon-financialCorporationsbyCurrency..................................................................................29
InterestRatesandAnnualPercentageRateofChargesonNewHouseholdLoans............................................................29
DistributionofInterestRatesonNewHousingLoansinEuro......30
InterestRatesonTen-Year-and-Six-MonthGovernmentSecuritiesonthePrimaryandSecondaryMarkets.....................30
EffectofConsolidatedBudgetonOtherSectors’Liquidity(Quarterly)....................................................................................31
ContributiontoGDPGrowthbyFinalUseComponent................34
BusinessClimateandConsumerConfidence.............................34
ExpectationsaboutFutureEconomicActivity.............................35
FactorsLimitingEconomicActivitiesofCorporations................35
EmploymentandNominalWageBill............................................36
EconomicActivityandShareofDiscouragedPersons................36
UnemploymentRate.....................................................................36
PrivateConsumptionandConsumerConfidence........................37
HouseholdPropensitytoSaveandExpectations........................37
ContributionofMajorGroupsofRevenuetoGrowthinTotalRevenueandGrants,Cumulatively(onanAnnualBasis)...........39
ContributionofMajorTaxGroupstoTaxRevenueGrowth,Cumulatively(onanAnnualBasis)...............................................39
ContributionofMajorGroupsofExpendituretoTotalExpenditureGrowth,Cumulatively(onanAnnualBasis).............40
ContributionofGovernmentConsumptionComponentstoRealGDPGrowth.....................................................................40
ValueAddedGrowthandContributionbySector.......................43
IndustrialTurnoverDynamics.......................................................43
5 Bulgarian National Bank
ConstructionProductionDynamicsandNewBuildingsPermitsIssued.............................................................................43
GrossOperatingSurplusatCurrentPrices..................................44
ContributiontoChangesintheNumberofEmployedbyEconomicSector.....................................................................44
LabourProductivityDevelopments(ValueAddedperEmployee)....................................................................................44
CompensationperEmployeeatCurrentPrices..........................45
UnitLabourCosts.........................................................................45
IndustrialProductionIndexandProductionCapacityUtilisationinIndustry...................................................................45
ContributionofChangesinProductionFactorstoGDPGrowth............................................................................45
DynamicsofExportsandImportsofGoods................................46
DynamicsofExportsandImportsofServices.............................47
DynamicsofExportstoEUandnon-EUCountries......................47
ExportsofGoods:GeographicalBreakdown...............................47
ExportsofMachines,Vehicles,Appliances,InstrumentsandWeapons............................................................48
ExportsofMineralProductsandFuels.......................................48
ExportsofBaseMetalsandRelatedProducts.............................49
ExportsofAnimalandPlantProducts,Food,DrinksandTobacco......................................................................49
ExportsofChemicalProducts,PlasticsandRubber..................50
AnnualChangeofExportsofServicesandContributionbySub-components....................................................................50
ImportsofEnergyResources.......................................................51
ImportsofRawMaterials.............................................................51
ImportsofConsumerGoods........................................................51
ImportsofInvestmentGoods.......................................................52
AnnualChangeofImportsofServicesandContributionbySub-components....................................................................52
AnnualInflationandContributionofMajorCommodityandServicesGroupstoIt.............................................................53
RateofChangeoftheTelecommunicationsPriceIndexinBulgariaandtheEU.................................................................54
RateofChangeoftheTransportPriceIndexinBulgariaandtheEU...................................................................................54
RateofChangeinManufacturingPPIandHICP.........................54
RateofchangeinPPIontheDomesticMarketandContributionbyMajorSub-sectors......................................55
MonthlyRateofChangeinthePricesofBrentCrudeOilandA95Petrol..............................................................................55
RateofChangeinProducerPricesontheDomesticMarketbyMajorIndustrialGroupings.....................................................55
RateofChangeofFoodPriceIndex............................................56
ContributionofMajorSub-groupsofUnprocessedFoodtoOverallinflation.........................................................................56
ContributionofNon-foodGoods(ExcludingEnergyProducts)andMajorGoodsSub-groupstoOverallInflation......56
GrowthRateofNominalRetailTradeVolumesExcludingTradeinMotorVehiclesandMotorcycles....................................57
GrowthRateofNominalRetailTradeinNon-foodGoodsExcludingTradeinAutomobileFuelsandLubricants.................57
CoreInflation................................................................................57
ContributionofServicesandMajorServicesSub-groupstoOverallInflation........................................................................58
ContributionofTobaccoProductsandMajorSub-groupsofGoodswithAdministrativelyControlledPricestoOverallInflation.........................................................................58
DiffusionIndexofMajorGoodsandServicesGroups................59
SellingPricesExpectationsinIndustry,RetailTradeandServicesovertheNextThreeMonths...................................60
ShareofFirmsbySectorsPointingtoInsufficientDemandasaFactorLimitingTheirActivity.................................................60
FanChartoftheExpectedAnnualRateofChangeofGDP........65
FanChartoftheExpectedAnnualRateofChangeinInflationattheEndofthePeriod..............................................65
Tables
ProjectionsoftheAnnualRateofChangeofEuroAreaRealGDP......................................................................................12
ProjectionsofAnnualInflationintheEuroArea...........................12
FlowsonBalanceofPaymentsAccounts...................................20
Banks’FlowsonBalanceofPaymentsFinancialAccount..........20
GrossExternalDebtasofOctober2016....................................21
RealGDPGrowthbyComponentofFinalUse............................35
EmploymentandIncomeDynamics............................................38
RetailTradeTurnover....................................................................38
KeyBudgetIndicatorsPerformancefor2015-2016....................41
GrossValueAddedGrowth..........................................................46
NetExportsofCommodityGroupsbyUse,January–October2016.................................................................46
ExportsbyCommodityGroup,January–October2016...............48
ImportsofCommodityGroupsbyUse,January–October2016.................................................................50
GrowthRatesofMajorGoodsandServicesGroupsPricesandContributionofTheseGroupstoInflation..................60
RevisionsofrealGDPgrowthdataandcomponents(13October2016vis-Ў-vis2September2016)...........................64
ForecastofKeyMacroeconomicIndicatorsfor2016–2018.........66
Economic Review • 4/2016 6
Abbreviations
ABSPP Asset-BackedSecuritiesPurchaseProgrammeAPP AssetPurchaseProgrammeAPRC AnnualpercentagerateofchargeBIR BaseinterestrateBOP BalanceofPaymentsBTC BulgarianTelecommunicationsCompanyb.p. basispointsCBPP3 CoveredBondPurchaseProgrammeCEECs CentralandEastEuropeancountriesCEFTA CentralEuropeanFreeTradeAssociationCFP ConsolidatedFiscalProgrammeCIF Cost,insurance,freightCNY ChineseYuanCPI ConsumerPriceIndexDXY anindexmeasuringtheexchangerateoftheUSdollaragainstthe
basketofsixmajorcurrenciesEA EmploymentAgencyEC EuropeanCommissionECB EuropeanCentralBankEIB EuropeanInvestmentBankEMBI EmergingMarketsBondIndexEONIA EuroOverNightIndexAverageEU EuropeanUnionEURIBOR EuroInterbankOfferedRateEWRC EnergyandWaterRegulatoryCommissionFDI ForeignDirectInvestmentFOB FreeonBoardFRS FederalReserveSystemGDP GrossDomesticProductGFMS GoldFieldsMineralServicesHICP HarmonizedIndexofConsumerPricesHRW HardRedWheatHUF HungarianforintIEA InternationalEnergyAgencyIMF InternationalMonetaryFundISM InstituteforSupplyManagementLEONIA LEvOverNightIndexAverageLIBOR LondonInterbankOfferedRateМ1 narrowmoneyМ2 М1andquasi-moneyМ3 broadmoneyMF MinistryofFinanceMFIs MonetaryFinancialInstitutionsmt metrictonsNPISHs Non-profitinstitutionsservinghouseholdsNSI NationalStatisticalInstituteOECD OrganizationforEconomicCooperationandDevelopmentOPEC OrganizationofPetroleumExportingCountriesOTC over-the-couterPBoC People’sBankofChinaPMI PurchasingManagers’Indexp.p. percentagepointsPPP PurchasingPowerParityPSPP PublicSectorPurchaseProgrammeRON RomaniannewleuSITC StandardInternationalTradeClassificationWTI WestTexasIntermediate
Summary7
In the fourth quarter of 2016 the global economic indicator continued to increase, signalling moderate acceleration in global economic growth. Both industrial production and services sectors contributed to this increase. Across regions, expectations about economic activity improved mostly in advanced econ-omies, while economic growth prospects in some developing countries, like India, Brazil, Mexico and Turkey, worsened.
Over the review period global inflation started to accelerate mainly driven by increasing commodity prices. Consumer price growth accelerated in both developing and developed economic regions. In the ECB’s view, increased inflation in the euro area was not due to sustainable factors, and therefore the ECB Governing Council decided at its December 2016 meeting to extend the duration and adjust the parameters of the expanded public and private sector asset purchase programme. US inflation indica-tors underwent no significant changes over the fourth quarter of 2016 but given the strong improvement in economic outlooks for the USA, the Federal Open Market Committee (FOMC) decided unanimously at its December meeting to raise the federal funds rate corridor by 25 basis points to 0.50–0.75 per cent. In addition, FOMC members revised upwards US GDP growth projections for 2017 to 2019, with projec-tion medians of individual members showing three key interest rate hikes in 2017.
In the first half of 2017 external demand for Bulgarian goods and services is expected to increase further on an annual basis in line with the improving international situation. There are, however, risks to the global economic activity in the short run, mainly related to the policy measures announced by the new US Administration, the likelihood of a significant tightening in global financial conditions and greater than expected moderation in China’s growth. Risks of lower growth in external demand for Bul-garian goods and services compared with the base scenario continue to reflect mainly developments in the European Union where economic prospects may be negatively affected by a potential uncertainty increase caused by surrounding negotiations over Brexit, pending elections in some of Bulgaria’s major trading partners (Germany, France, the Netherlands), and political instability in Italy. In addition, the worsened economic environment in Turkey also poses risks to external demand for Bulgarian exports.
Between January and November 2016 the current and capital account surplus posted a strong increase from the corresponding period of 2015 due to lower deficits on the trade balance and net primary income item along with a higher surplus of services, net. Over the first half of 2017 the current and capital account surplus as a share of GDP is expected to shrink on an annual basis compared to the end of 2016, mainly due to increased trade balance and net primary income deficits and lower capital account inflows.
In 2016 non-government sector’s deposits in the banking system continued growing at comparatively high rates. Credit to non-financial corporations and households recorded a gradual decline in its nega-tive growth rate. At the end of the year low positive growth was recorded, more pronounced in loans to households. In the first half of 2017 new time deposit and lending rates are expected to remain at the achieved comparatively low levels. This dynamics will take advantage of the continued growth in attracted funds and high liquidity sustained in the banking system. Credit to non-financial corporations and households is expected to gradually accelerate its growth rate. Continued improvements in the macroeconomic environment are projected to be a factor behind both higher demand for loans amid comparatively low interest rates and increased risk appetite of banks in providing credit.
In the third quarter of 2016 real GDP rose by 0.7 per cent on a quarterly basis. Domestic demand had the main contribution, while net exports had neutral contribution to growth.
Summary
Economic Review • 4/2016 8
Short-term economic indicators over the third and fourth quarters of 2016 give mostly positive signs about the economic development. The sustained low petroleum prices, high capacity utilisation and increasing demand for goods and services favour the creation of conditions for further growth in con-sumption and investment activity. Accordingly, import growth is expected to accelerate along with yhe increasing exports of goods and services. As a result of the lower positive contribution of net exports, quarterly GDP growth is anticipated to slightly decelerate in the first and second quarters of 2017. The external environment remains a source of uncertainty to the expected growth.
In 2016 annual inflation was negative at -0.5 per cent at the end of the year. This was mainly driven by the negative contributions of durable goods, telecommunication and transport services prices. Reten-tion of consumer price deflation in 2016 reflected also the significant decline in international crude oil prices at the start of the year and their pass-through into domestic fuel, natural gas and heating prices. Tobacco products and goods and services with administratively controlled prices had positive contribu-tions to inflation due mainly to raised tobacco excise duties and road fees since early 2016, as well as more expensive urban transport since June. Increased domestic demand and higher unit labour costs exerted no upward pressure on final consumer prices in the context of lower production costs of firms reflecting cheaper intermediate consumption goods.
In the first two quarters of 2017 inflation is expected to turn positive as a result mainly of projected gradual increases in international oil and commodity prices.
This issue of Economic Review includes the BNB forecast of key macroeconomic indicators for the 2016–2018 period. It is based on information published as of 15 December 2016 and employs ECB, EC and IMF assumptions of global economic developments as of 8 December 2016.
In 2016 global economic growth is expected to slow down from 2015 due to lower annual growth in developed economies and real growth rates in developing countries are expected to remain close to their previous year’s levels. Based on latest ECB, EC and IMF forecasts of the global economic devel-opment, in the 2017–2018 period economic activity in Bulgaria’s major trading partners is expected to accelerate and external demand for Bulgarian goods and services to increase accordingly.
In 2016 international commodity prices remained lower than in the previous year due to the high level of inventories and output. In the second half of 2016 the global demand-supply gap tended to decrease, with expectations showing further declines in 2017 and 2018. As a result, from 2017 interna-tional commodity prices are anticipated to start increasing on an annual basis.
In 2016 real growth in Bulgaria is projected to reach 3.4 per cent (3.6 per cent in 2015). In 2017 growth is expected to slow down to 2.8 per cent, and to accelerate slowly to 2.9 per cent in 2018. Domestic demand will have the main positive contribution to this growth. As a result, growth in imports of goods and services is anticipated to accelerate. Irrespective of growing imports, the average contri-bution of net exports over the projection horizon is expected to be almost neutral. Risks to the outlook of economic activity in 2016 are assessed as broadly balanced. It is estimated that there are some risks of lower than projected growth in the 2017–2018 period. Uncertainty about global economic devel-opments remains high and would adversely affect both external demand for Bulgarian goods and ser-vices and Bulgaria’s investment activity. Lower than expected private investment in Bulgaria would have a limiting effect on household consumption and confidence, and lower absorption of EU funds may result in weaker government investment.
In the 2017–2018 period inflation is expected to be low and follow a pattern of a gradual increase in line with the assumed upward dynamics in international prices. Administratively controlled prices will have a low positive contribution to overall inflation due to the projected rise in excise duty on tobacco products. Risks to the inflation outlook are assessed as balanced. Faster than expected rates of increase in international oil and commodity prices and related possible rises in some administratively controlled prices may prompt higher than projected inflation. A continued deflationary trend in some services and durable goods, however, is a precondition for lower than projected inflation.
External Environment9
1. External Environment
In the fourth quarter the global economic indicator continued its upward trend of mid-2016. Both industrial production and services contributed to the PMI increase, most pronounced in developed countries. Global inflation started to accelerate driven by increasing international commodity prices. In the ECB’s view, the observed increase of inflation in the euro area is not sustainable, and therefore the Governing Council decided at its December 2016 meeting to extend the duration and adjust the parameters of the expanded public and private sector asset purchase programme. US inflation indicators did not change significantly over the fourth quarter of 2016 but the Federal Reserve System raised at its December meeting the federal funds rate corridor by 25 basis points to 0.50–0.75 per cent.
Current Business Situation
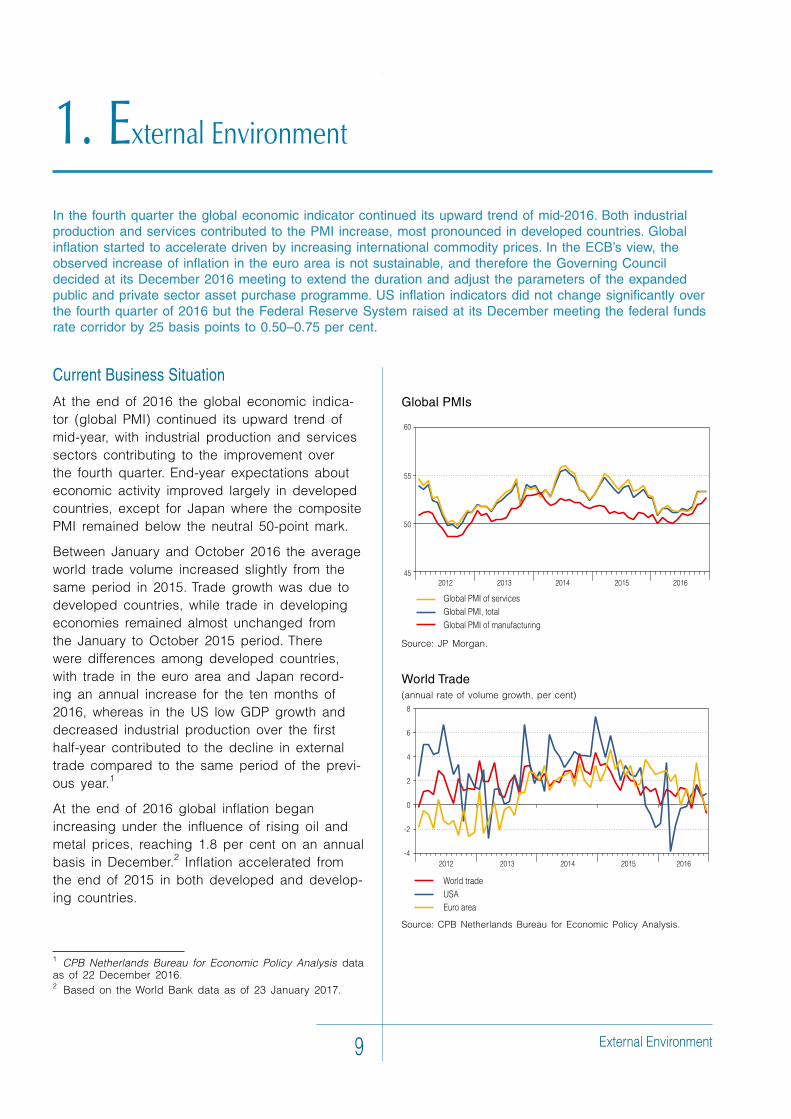
At the end of 2016 the global economic indica-tor (global PMI) continued its upward trend of mid-year, with industrial production and services sectors contributing to the improvement over the fourth quarter. End-year expectations about economic activity improved largely in developed countries, except for Japan where the composite PMI remained below the neutral 50-point mark.
Between January and October 2016 the average world trade volume increased slightly from the same period in 2015. Trade growth was due to developed countries, while trade in developing economies remained almost unchanged from the January to October 2015 period. There were differences among developed countries, with trade in the euro area and Japan record-ing an annual increase for the ten months of 2016, whereas in the US low GDP growth and decreased industrial production over the first half-year contributed to the decline in external trade compared to the same period of the previ-ous year.1
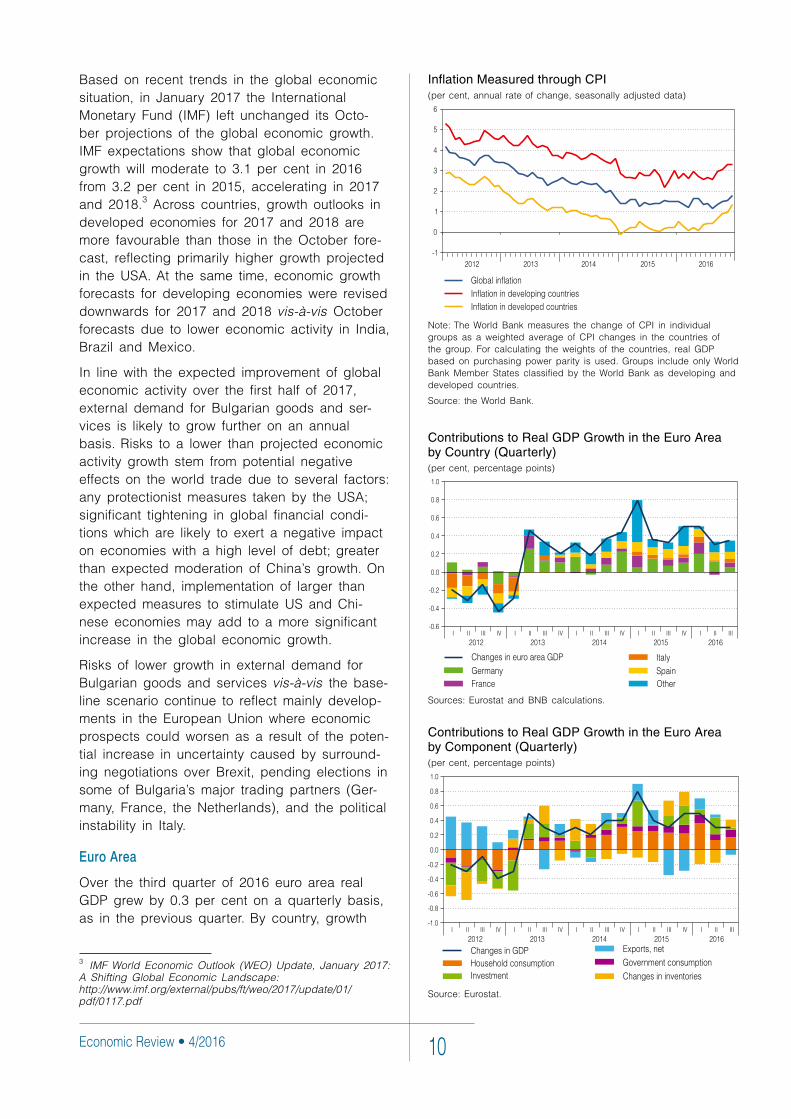
At the end of 2016 global inflation began increasing under the influence of rising oil and metal prices, reaching 1.8 per cent on an annual basis in December.2 Inflation accelerated from the end of 2015 in both developed and develop-ing countries.
1 CPB Netherlands Bureau for Economic Policy Analysis data as of 22 December 2016.2 Based on the World Bank data as of 23 January 2017.
Global PMIs
Source: JP Morgan.
World Trade(annual rate of volume growth, per cent)
Source: CPB Netherlands Bureau for Economic Policy Analysis.
Economic Review • 4/2016 10
Based on recent trends in the global economic situation, in January 2017 the International Monetary Fund (IMF) left unchanged its Octo-ber projections of the global economic growth. IMF expectations show that global economic growth will moderate to 3.1 per cent in 2016 from 3.2 per cent in 2015, accelerating in 2017 and 2018.3 Across countries, growth outlooks in developed economies for 2017 and 2018 are more favourable than those in the October fore-cast, reflecting primarily higher growth projected in the USA. At the same time, economic growth forecasts for developing economies were revised downwards for 2017 and 2018 vis-Ў-vis October forecasts due to lower economic activity in India, Brazil and Mexico.
In line with the expected improvement of global economic activity over the first half of 2017, external demand for Bulgarian goods and ser-vices is likely to grow further on an annual basis. Risks to a lower than projected economic activity growth stem from potential negative effects on the world trade due to several factors: any protectionist measures taken by the USA; significant tightening in global financial condi-tions which are likely to exert a negative impact on economies with a high level of debt; greater than expected moderation of China’s growth. On the other hand, implementation of larger than expected measures to stimulate US and Chi-nese economies may add to a more significant increase in the global economic growth.
Risks of lower growth in external demand for Bulgarian goods and services vis-Ў-vis the base-line scenario continue to reflect mainly develop-ments in the European Union where economic prospects could worsen as a result of the poten-tial increase in uncertainty caused by surround-ing negotiations over Brexit, pending elections in some of Bulgaria’s major trading partners (Ger-many, France, the Netherlands), and the political instability in Italy.
Euro Area
Over the third quarter of 2016 euro area real GDP grew by 0.3 per cent on a quarterly basis, as in the previous quarter. By country, growth
3 IMF World Economic Outlook (WEO) Update, January 2017: A Shifting Global Economic Landscape: http://www.imf.org/external/pubs/ft/weo/2017/update/01/pdf/0117.pdf
Contributions to Real GDP Growth in the Euro Area by Component (Quarterly)(per cent, percentage points)
Source: Eurostat.
Inflation Measured through CPI(per cent, annual rate of change, seasonally adjusted data)
Note: The World Bank measures the change of CPI in individual groups as a weighted average of CPI changes in the countries of the group. For calculating the weights of the countries, real GDP based on purchasing power parity is used. Groups include only World Bank Member States classified by the World Bank as developing and developed countries.
Source: the World Bank.
Contributions to Real GDP Growth in the Euro Area by Country (Quarterly)(per cent, percentage points)
Sources: Eurostat and BNB calculations.
External Environment11
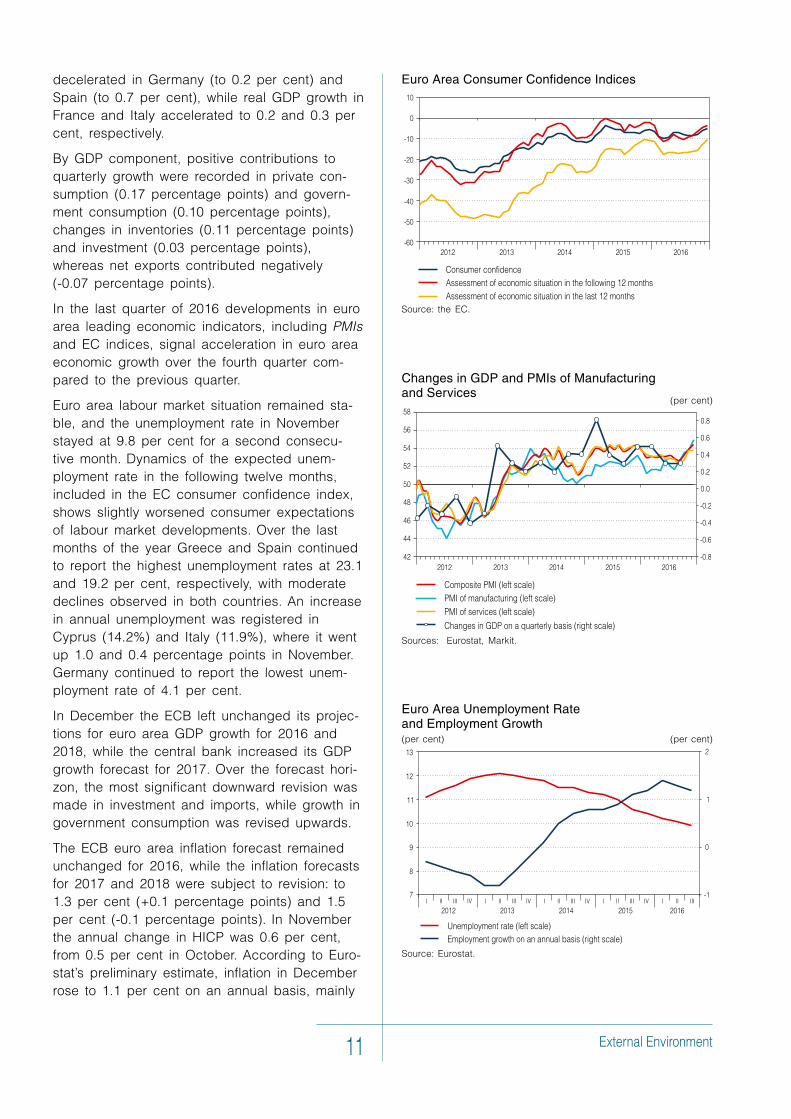
decelerated in Germany (to 0.2 per cent) and Spain (to 0.7 per cent), while real GDP growth in France and Italy accelerated to 0.2 and 0.3 per cent, respectively.
By GDP component, positive contributions to quarterly growth were recorded in private con-sumption (0.17 percentage points) and govern-ment consumption (0.10 percentage points), changes in inventories (0.11 percentage points) and investment (0.03 percentage points), whereas net exports contributed negatively (-0.07 percentage points).
In the last quarter of 2016 developments in euro area leading economic indicators, including PMIs and EC indices, signal acceleration in euro area economic growth over the fourth quarter com-pared to the previous quarter.
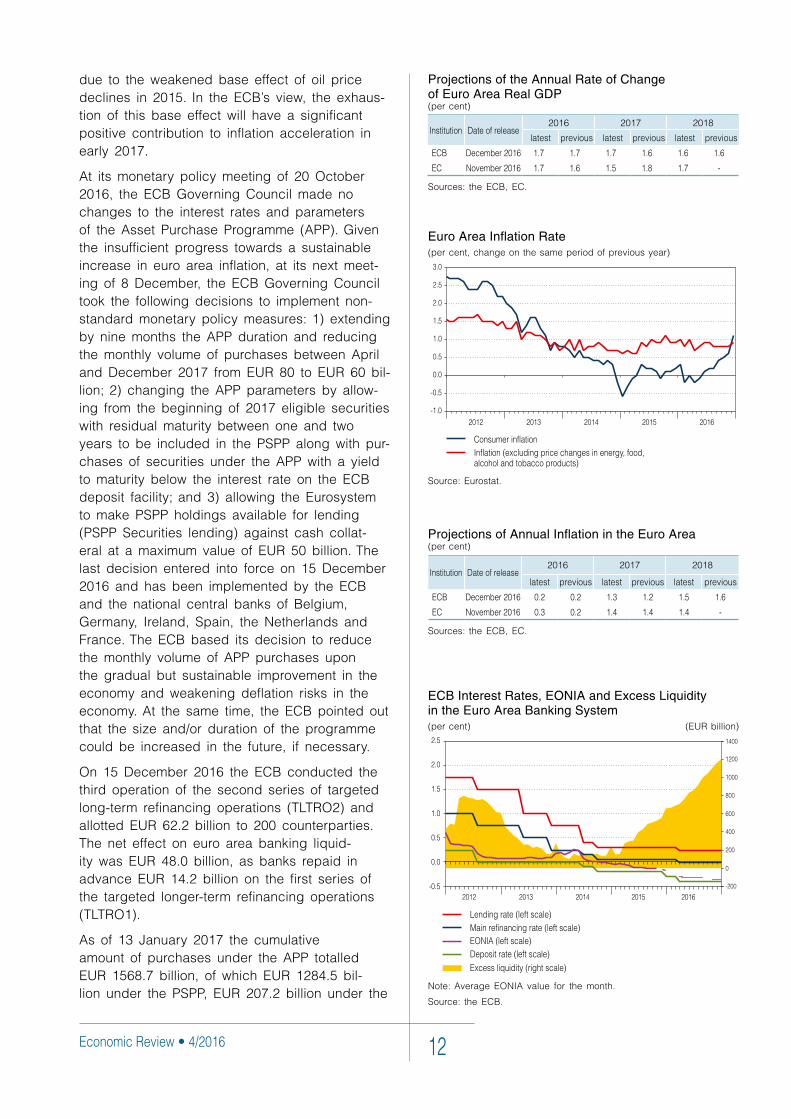
Euro area labour market situation remained sta-ble, and the unemployment rate in November stayed at 9.8 per cent for a second consecu-tive month. Dynamics of the expected unem-ployment rate in the following twelve months, included in the EC consumer confidence index, shows slightly worsened consumer expectations of labour market developments. Over the last months of the year Greece and Spain continued to report the highest unemployment rates at 23.1 and 19.2 per cent, respectively, with moderate declines observed in both countries. An increase in annual unemployment was registered in Cyprus (14.2%) and Italy (11.9%), where it went up 1.0 and 0.4 percentage points in November. Germany continued to report the lowest unem-ployment rate of 4.1 per cent.
In December the ECB left unchanged its projec-tions for euro area GDP growth for 2016 and 2018, while the central bank increased its GDP growth forecast for 2017. Over the forecast hori-zon, the most significant downward revision was made in investment and imports, while growth in government consumption was revised upwards.
The ECB euro area inflation forecast remained unchanged for 2016, while the inflation forecasts for 2017 and 2018 were subject to revision: to 1.3 per cent (+0.1 percentage points) and 1.5 per cent (-0.1 percentage points). In November the annual change in HICP was 0.6 per cent, from 0.5 per cent in October. According to Euro-stat’s preliminary estimate, inflation in December rose to 1.1 per cent on an annual basis, mainly
Euro Area Consumer Confidence Indices
Source: the EC.
Changes in GDP and PMIs of Manufacturing and Services (per cent)
Sources: Eurostat, Markit.
Euro Area Unemployment Rate and Employment Growth(per cent) (per cent)
Source: Eurostat.
Economic Review • 4/2016 12
due to the weakened base effect of oil price declines in 2015. In the ECB’s view, the exhaus-tion of this base effect will have a significant positive contribution to inflation acceleration in early 2017.
At its monetary policy meeting of 20 October 2016, the ECB Governing Council made no changes to the interest rates and parameters of the Asset Purchase Programme (APP). Given the insufficient progress towards a sustainable increase in euro area inflation, at its next meet-ing of 8 December, the ECB Governing Council took the following decisions to implement non-standard monetary policy measures: 1) extending by nine months the APP duration and reducing the monthly volume of purchases between April and December 2017 from EUR 80 to EUR 60 bil-lion; 2) changing the APP parameters by allow-ing from the beginning of 2017 eligible securities with residual maturity between one and two years to be included in the PSPP along with pur-chases of securities under the APP with a yield to maturity below the interest rate on the ECB deposit facility; and 3) allowing the Eurosystem to make PSPP holdings available for lending (PSPP Securities lending) against cash collat-eral at a maximum value of EUR 50 billion. The last decision entered into force on 15 December 2016 and has been implemented by the ECB and the national central banks of Belgium, Germany, Ireland, Spain, the Netherlands and France. The ECB based its decision to reduce the monthly volume of APP purchases upon the gradual but sustainable improvement in the economy and weakening deflation risks in the economy. At the same time, the ECB pointed out that the size and/or duration of the programme could be increased in the future, if necessary.
On 15 December 2016 the ECB conducted the third operation of the second series of targeted long-term refinancing operations (TLTRO2) and allotted EUR 62.2 billion to 200 counterparties. The net effect on euro area banking liquid-ity was EUR 48.0 billion, as banks repaid in advance EUR 14.2 billion on the first series of the targeted longer-term refinancing operations (TLTRO1).
As of 13 January 2017 the cumulative amount of purchases under the APP totalled EUR 1568.7 billion, of which EUR 1284.5 bil-lion under the PSPP, EUR 207.2 billion under the
Euro Area Inflation Rate(per cent, change on the same period of previous year)
Source: Eurostat.
ECB Interest Rates, EONIA and Excess Liquidity in the Euro Area Banking System(per cent) (EUR billion)
Note: Average EONIA value for the month.
Source: the ECB.
Projections of Annual Inflation in the Euro Area(per cent)
Institution Dateofrelease2016 2017 2018
latest previous latest previous latest previous
ECB December2016 0.2 0.2 1.3 1.2 1.5 1.6
EC November2016 0.3 0.2 1.4 1.4 1.4 -
Sources: the ECB, EC.
Projections of the Annual Rate of Change of Euro Area Real GDP(per cent)
Institution Dateofrelease2016 2017 2018
latest previous latest previous latest previous
ECB December2016 1.7 1.7 1.7 1.6 1.6 1.6
EC November2016 1.7 1.6 1.5 1.8 1.7 -
Sources: the ECB, EC.
External Environment13
Contribution to US GDP Growth by Component (Quarterly)(per cent; percentage points)
Source: Bureau of Economic Analysis.
EURIBOR Dynamics(basis points)
Source: the ECB.
US Manufacturing and Services ISM-PMIs and GDP Growth (Quarterly) (per cent)
Note: The dotted line shows the economic growth forecast for the USA according to the Federal Reserve Bank of Atlanta model (GDPNowTM).
Sources: Institute for Supply Management, Bureau of Economic Analy-sis (BEA), Federal Reserve Bank of Atlanta and BNB calculations.
CBPP3, EUR 23.0 billion under the ABSPP and EUR 54.0 billion under the CSPP.
As a result of continuing APP purchases and allocation of funds under TLTRO2, as of 13 January 2017 excess liquidity in the euro area banking system increased to EUR 1279.6 billion from EUR 1040.7 billion at the end of September 2016, with the ECB balance sheet figure reach-ing EUR 3.697 trillion.
The increased excess liquidity in the euro area banking system continued to contribute to the decline in EONIA, its average value reaching -0.35 per cent between 1 October 2016 and 13 January 2017. The trade volume of over-night deposits on the interbank market in the euro area also decreased slightly, with its daily average coming to EUR 8.6 billion from 1 Octo-ber 2016 to 13 January 2017 (EUR 10.1 billion for the third quarter of 2016).
EURIBOR interest rates on interbank mar-ket deposits continued to follow a downward trend in the fourth quarter of 2016 and early 2017. On 13 January 2017 one-month interest rates reached -0.37 per cent (-0.1 basis points from the end of 2016), and those with maturi-ties of six and 12 months fell to -0.24 per cent (-3.3 basis points from the end of September) and -0.09 per cent (-3.0 basis points from the end of September).
The United States
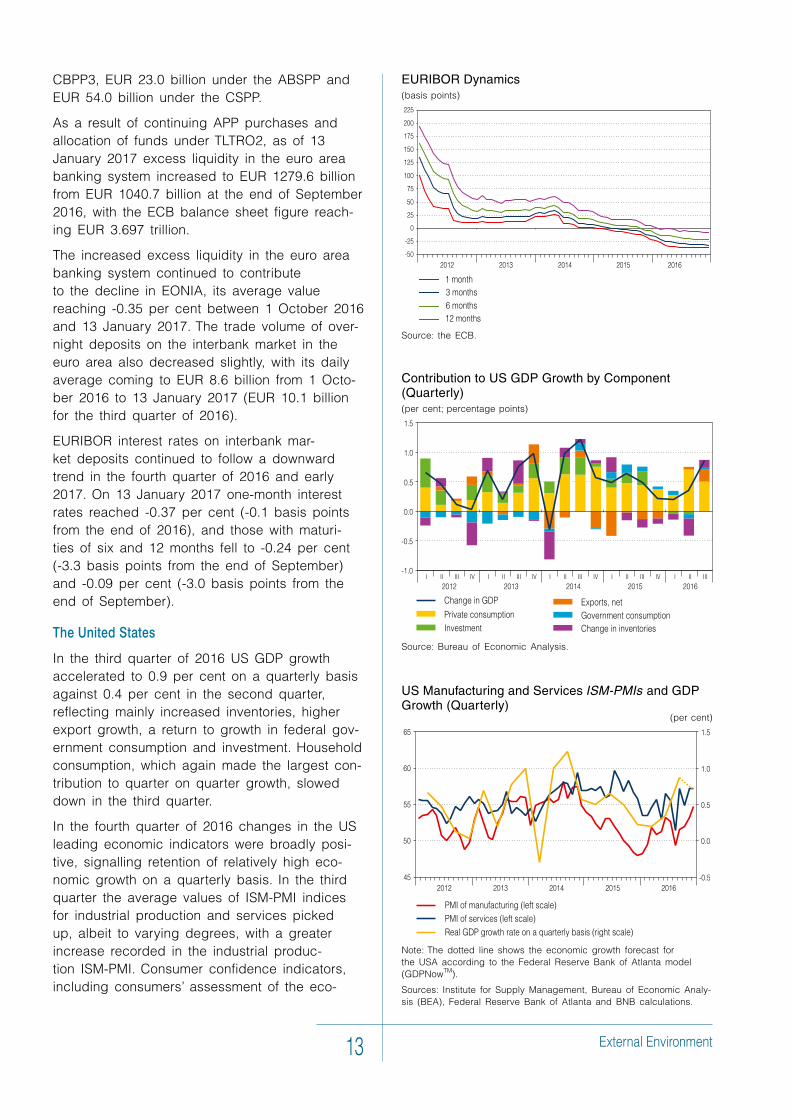
In the third quarter of 2016 US GDP growth accelerated to 0.9 per cent on a quarterly basis against 0.4 per cent in the second quarter, reflecting mainly increased inventories, higher export growth, a return to growth in federal gov-ernment consumption and investment. Household consumption, which again made the largest con-tribution to quarter on quarter growth, slowed down in the third quarter.
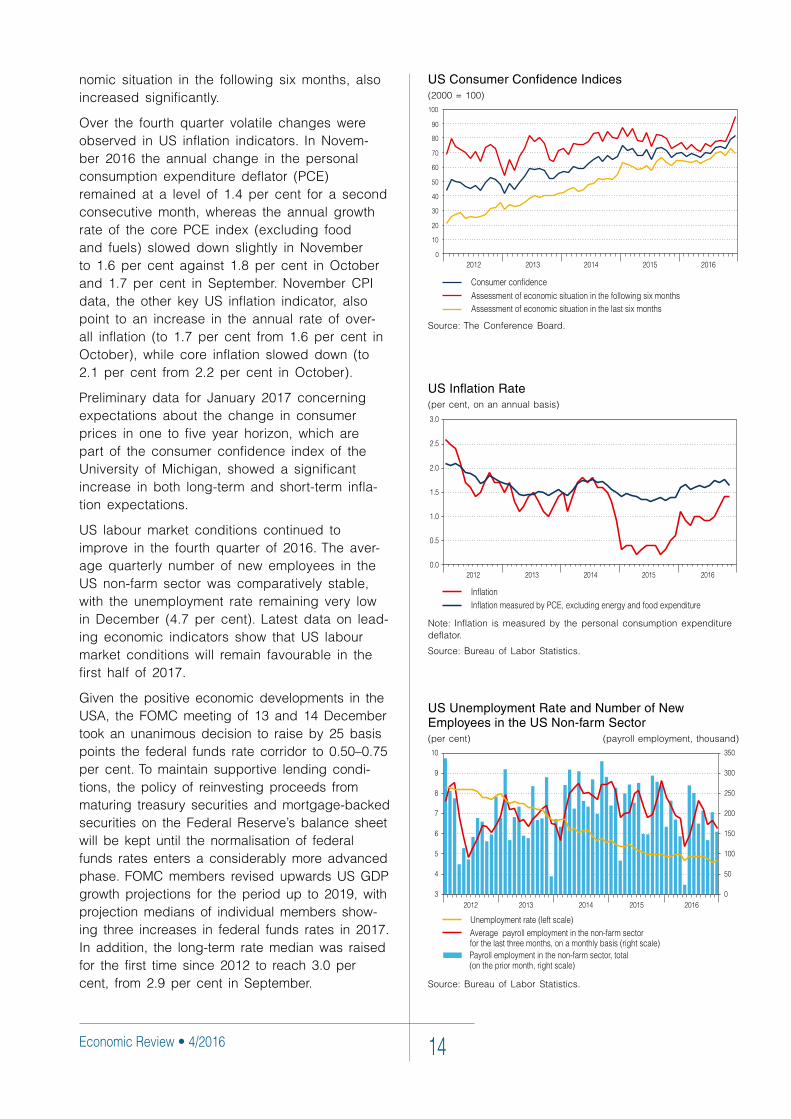
In the fourth quarter of 2016 changes in the US leading economic indicators were broadly posi-tive, signalling retention of relatively high eco-nomic growth on a quarterly basis. In the third quarter the average values of ISM-PMI indices for industrial production and services picked up, albeit to varying degrees, with a greater increase recorded in the industrial produc-tion ISM-PMI. Consumer confidence indicators, including consumers’ assessment of the eco-
Economic Review • 4/2016 14
US Unemployment Rate and Number of New Employees in the US Non-farm Sector (per cent) (payroll employment, thousand)
Source: Bureau of Labor Statistics.
nomic situation in the following six months, also increased significantly.
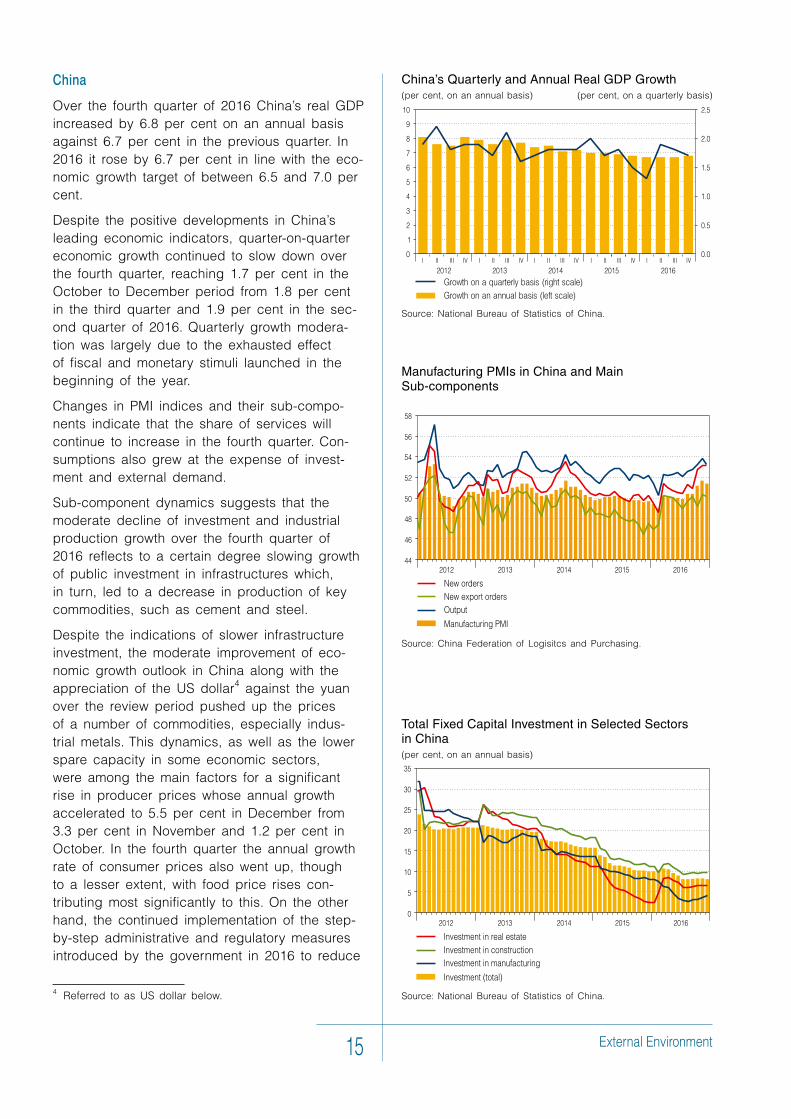
Over the fourth quarter volatile changes were observed in US inflation indicators. In Novem-ber 2016 the annual change in the personal consumption expenditure deflator (PCE) remained at a level of 1.4 per cent for a second consecutive month, whereas the annual growth rate of the core PCE index (excluding food and fuels) slowed down slightly in November to 1.6 per cent against 1.8 per cent in October and 1.7 per cent in September. November CPI data, the other key US inflation indicator, also point to an increase in the annual rate of over-all inflation (to 1.7 per cent from 1.6 per cent in October), while core inflation slowed down (to 2.1 per cent from 2.2 per cent in October).
Preliminary data for January 2017 concerning expectations about the change in consumer prices in one to five year horizon, which are part of the consumer confidence index of the University of Michigan, showed a significant increase in both long-term and short-term infla-tion expectations.
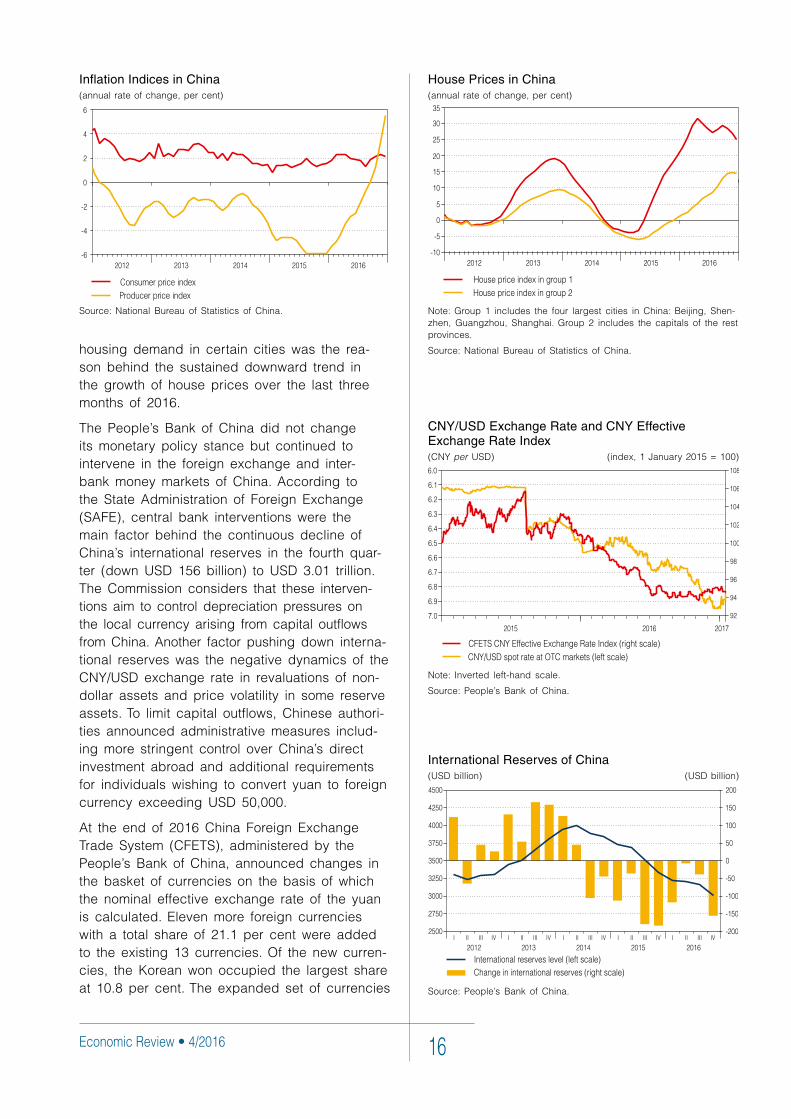
US labour market conditions continued to improve in the fourth quarter of 2016. The aver-age quarterly number of new employees in the US non-farm sector was comparatively stable, with the unemployment rate remaining very low in December (4.7 per cent). Latest data on lead-ing economic indicators show that US labour market conditions will remain favourable in the first half of 2017.
Given the positive economic developments in the USA, the FOMC meeting of 13 and 14 December took an unanimous decision to raise by 25 basis points the federal funds rate corridor to 0.50–0.75 per cent. To maintain supportive lending condi-tions, the policy of reinvesting proceeds from maturing treasury securities and mortgage-backed securities on the Federal Reserve’s balance sheet will be kept until the normalisation of federal funds rates enters a considerably more advanced phase. FOMC members revised upwards US GDP growth projections for the period up to 2019, with projection medians of individual members show-ing three increases in federal funds rates in 2017. In addition, the long-term rate median was raised for the first time since 2012 to reach 3.0 per cent, from 2.9 per cent in September.
US Inflation Rate (per cent, on an annual basis)
Note: Inflation is measured by the personal consumption expenditure deflator.
Source: Bureau of Labor Statistics.
US Consumer Confidence Indices(2000 = 100)
Source: The Conference Board.
External Environment15
Total Fixed Capital Investment in Selected Sectors in China (per cent, on an annual basis)
Source: National Bureau of Statistics of China.
China
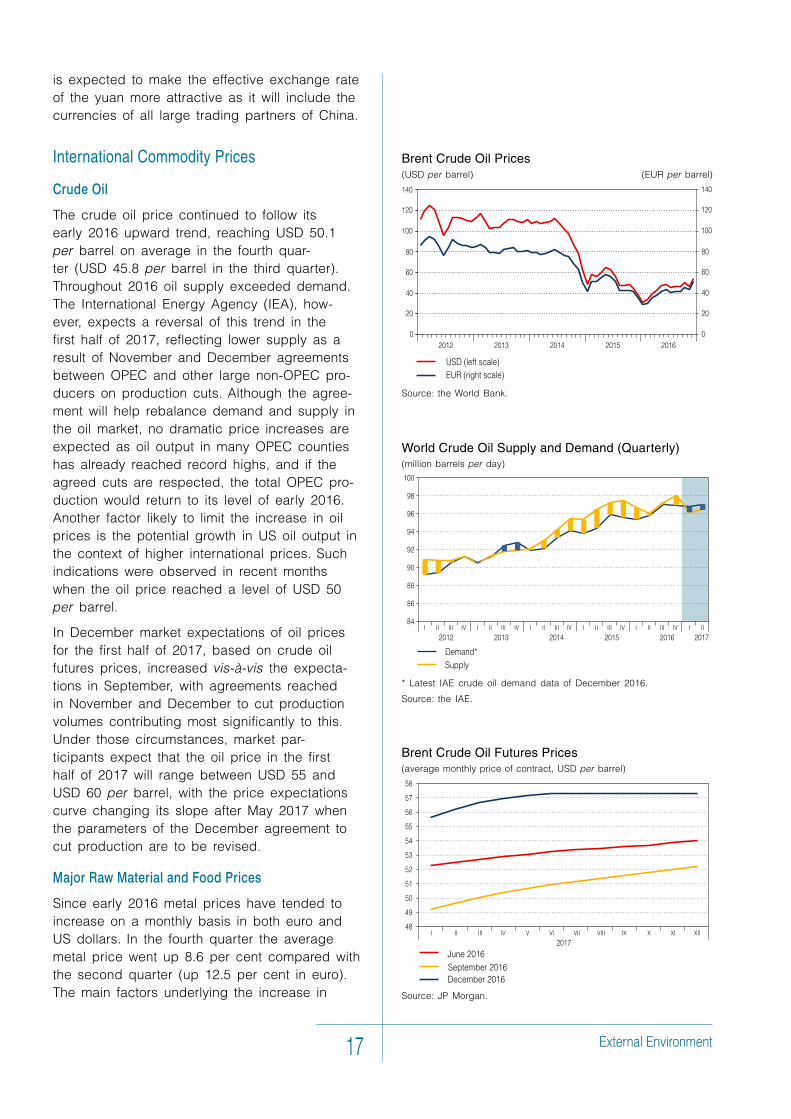
Over the fourth quarter of 2016 China’s real GDP increased by 6.8 per cent on an annual basis against 6.7 per cent in the previous quarter. In 2016 it rose by 6.7 per cent in line with the eco-nomic growth target of between 6.5 and 7.0 per cent.
Despite the positive developments in China’s leading economic indicators, quarter-on-quarter economic growth continued to slow down over the fourth quarter, reaching 1.7 per cent in the October to December period from 1.8 per cent in the third quarter and 1.9 per cent in the sec-ond quarter of 2016. Quarterly growth modera-tion was largely due to the exhausted effect of fiscal and monetary stimuli launched in the beginning of the year.
Changes in PMI indices and their sub-compo-nents indicate that the share of services will continue to increase in the fourth quarter. Con-sumptions also grew at the expense of invest-ment and external demand.
Sub-component dynamics suggests that the moderate decline of investment and industrial production growth over the fourth quarter of 2016 reflects to a certain degree slowing growth of public investment in infrastructures which, in turn, led to a decrease in production of key commodities, such as cement and steel.
Despite the indications of slower infrastructure investment, the moderate improvement of eco-nomic growth outlook in China along with the appreciation of the US dollar4 against the yuan over the review period pushed up the prices of a number of commodities, especially indus-trial metals. This dynamics, as well as the lower spare capacity in some economic sectors, were among the main factors for a significant rise in producer prices whose annual growth accelerated to 5.5 per cent in December from 3.3 per cent in November and 1.2 per cent in October. In the fourth quarter the annual growth rate of consumer prices also went up, though to a lesser extent, with food price rises con-tributing most significantly to this. On the other hand, the continued implementation of the step-by-step administrative and regulatory measures introduced by the government in 2016 to reduce
4 Referred to as US dollar below.
Manufacturing PMIs in China and Main Sub-components
Source: China Federation of Logisitcs and Purchasing.
China’s Quarterly and Annual Real GDP Growth(per cent, on an annual basis) (per cent, on a quarterly basis)
Source: National Bureau of Statistics of China.
Economic Review • 4/2016 16
housing demand in certain cities was the rea-son behind the sustained downward trend in the growth of house prices over the last three months of 2016.
The People’s Bank of China did not change its monetary policy stance but continued to intervene in the foreign exchange and inter-bank money markets of China. According to the State Administration of Foreign Exchange (SAFE), central bank interventions were the main factor behind the continuous decline of China’s international reserves in the fourth quar-ter (down USD 156 billion) to USD 3.01 trillion. The Commission considers that these interven-tions aim to control depreciation pressures on the local currency arising from capital outflows from China. Another factor pushing down interna-tional reserves was the negative dynamics of the CNY/USD exchange rate in revaluations of non-dollar assets and price volatility in some reserve assets. To limit capital outflows, Chinese authori-ties announced administrative measures includ-ing more stringent control over China’s direct investment abroad and additional requirements for individuals wishing to convert yuan to foreign currency exceeding USD 50,000.
At the end of 2016 China Foreign Exchange Trade System (CFETS), administered by the People’s Bank of China, announced changes in the basket of currencies on the basis of which the nominal effective exchange rate of the yuan is calculated. Eleven more foreign currencies with a total share of 21.1 per cent were added to the existing 13 currencies. Of the new curren-cies, the Korean won occupied the largest share at 10.8 per cent. The expanded set of currencies
International Reserves of China(USD billion) (USD billion)
Source: People’s Bank of China.
CNY/USD Exchange Rate and CNY Effective Exchange Rate Index(CNY per USD) (index, 1 January 2015 = 100)
Note: Inverted left-hand scale.
Source: People’s Bank of China.
House Prices in China(annual rate of change, per cent)
Note: Group 1 includes the four largest cities in China: Beijing, Shen-zhen, Guangzhou, Shanghai. Group 2 includes the capitals of the rest provinces.
Source: National Bureau of Statistics of China.
Inflation Indices in China(annual rate of change, per cent)
Source: National Bureau of Statistics of China.
External Environment17
Brent Crude Oil Futures Prices (average monthly price of contract, USD per barrel)
Source: JP Morgan.
World Crude Oil Supply and Demand (Quarterly)(million barrels per day)
* Latest IAE crude oil demand data of December 2016.
Source: the IAE.
is expected to make the effective exchange rate of the yuan more attractive as it will include the currencies of all large trading partners of China.
International Commodity Prices
Crude Oil
The crude oil price continued to follow its early 2016 upward trend, reaching USD 50.1 per barrel on average in the fourth quar-ter (USD 45.8 per barrel in the third quarter). Throughout 2016 oil supply exceeded demand. The International Energy Agency (IEA), how-ever, expects a reversal of this trend in the first half of 2017, reflecting lower supply as a result of November and December agreements between OPEC and other large non-OPEC pro-ducers on production cuts. Although the agree-ment will help rebalance demand and supply in the oil market, no dramatic price increases are expected as oil output in many OPEC counties has already reached record highs, and if the agreed cuts are respected, the total OPEC pro-duction would return to its level of early 2016. Another factor likely to limit the increase in oil prices is the potential growth in US oil output in the context of higher international prices. Such indications were observed in recent months when the oil price reached a level of USD 50 per barrel.
In December market expectations of oil prices for the first half of 2017, based on crude oil futures prices, increased vis-Ў-vis the expecta-tions in September, with agreements reached in November and December to cut production volumes contributing most significantly to this. Under those circumstances, market par-ticipants expect that the oil price in the first half of 2017 will range between USD 55 and USD 60 per barrel, with the price expectations curve changing its slope after May 2017 when the parameters of the December agreement to cut production are to be revised.
Major Raw Material and Food Prices
Since early 2016 metal prices have tended to increase on a monthly basis in both euro and US dollars. In the fourth quarter the average metal price went up 8.6 per cent compared with the second quarter (up 12.5 per cent in euro). The main factors underlying the increase in
Brent Crude Oil Prices(USD per barrel) (EUR per barrel)
Source: the World Bank.
Economic Review • 4/2016 18
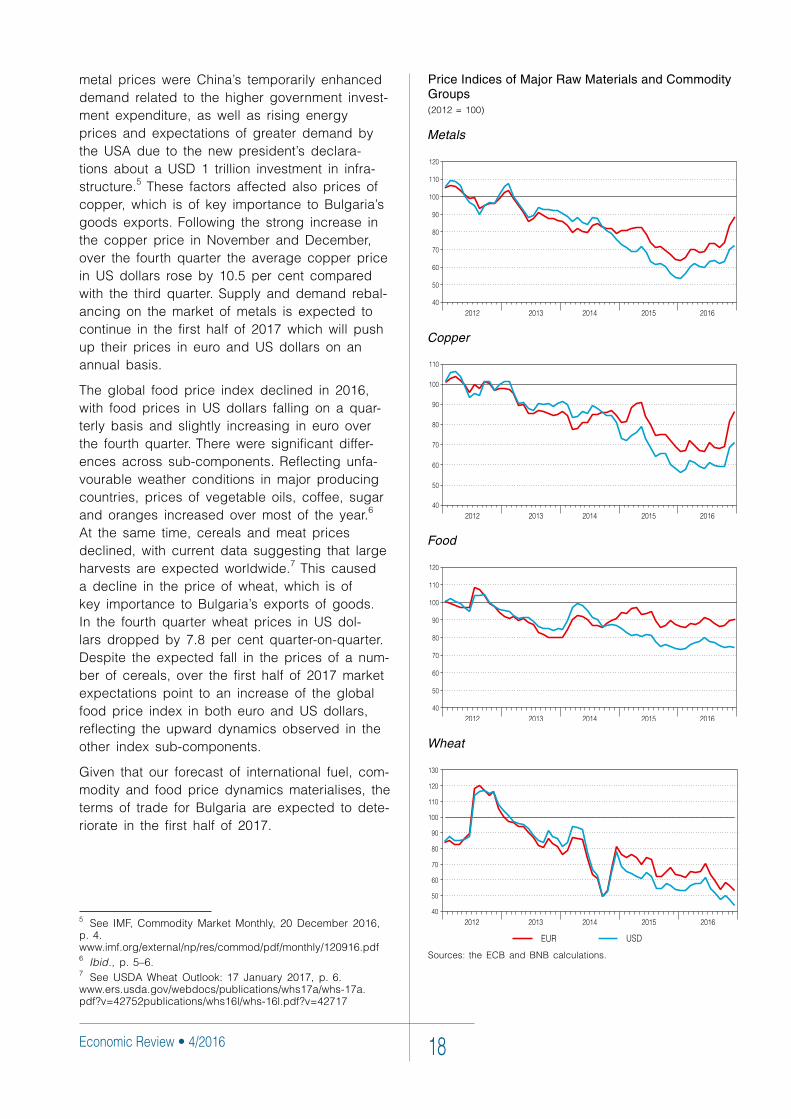
metal prices were China’s temporarily enhanced demand related to the higher government invest-ment expenditure, as well as rising energy prices and expectations of greater demand by the USA due to the new president’s declara-tions about a USD 1 trillion investment in infra-structure.5 These factors affected also prices of copper, which is of key importance to Bulgaria’s goods exports. Following the strong increase in the copper price in November and December, over the fourth quarter the average copper price in US dollars rose by 10.5 per cent compared with the third quarter. Supply and demand rebal-ancing on the market of metals is expected to continue in the first half of 2017 which will push up their prices in euro and US dollars on an annual basis.
The global food price index declined in 2016, with food prices in US dollars falling on a quar-terly basis and slightly increasing in euro over the fourth quarter. There were significant differ-ences across sub-components. Reflecting unfa-vourable weather conditions in major producing countries, prices of vegetable oils, coffee, sugar and oranges increased over most of the year.6 At the same time, cereals and meat prices declined, with current data suggesting that large harvests are expected worldwide.7 This caused a decline in the price of wheat, which is of key importance to Bulgaria’s exports of goods. In the fourth quarter wheat prices in US dol-lars dropped by 7.8 per cent quarter-on-quarter. Despite the expected fall in the prices of a num-ber of cereals, over the first half of 2017 market expectations point to an increase of the global food price index in both euro and US dollars, reflecting the upward dynamics observed in the other index sub-components.
Given that our forecast of international fuel, com-modity and food price dynamics materialises, the terms of trade for Bulgaria are expected to dete-riorate in the first half of 2017.
5 See IMF, Commodity Market Monthly, 20 December 2016, p. 4. www.imf.org/external/np/res/commod/pdf/monthly/120916.pdf6 Ibid., p. 5–6.7 See USDA Wheat Outlook: 17 January 2017, p. 6. www.ers.usda.gov/webdocs/publications/whs17a/whs-17a.pdf?v=42752publications/whs16l/whs-16l.pdf?v=42717
Price Indices of Major Raw Materials and Commodity Groups(2012 = 100)
Metals
Copper
Food
Wheat
Sources: the ECB and BNB calculations.
Financial Flows, Money and Credit19
2. Financial Flows, Money and Credit
Between January and November 2016 the current and capital account surplus posted a strong increase from the corresponding period of 2015 due to lower deficits on the trade balance and net primary income item along with a higher surplus on trade in services, net. Over the first half of 2017 the current and capital account surplus is expected to shrink as a share of GDP on an annual basis compared with the end of 2016, mainly due to the increased deficits on the trade balance and net primary income and lower capital account inflows.
In 2016 non-government sector’s deposits in the banking system continued growing at comparatively high rates. Credit to non-financial corporations and households recorded a gradual decline in its negative growth rate. At the end of the year low positive growth was reported, more pronounced in loans to households. In the first half of 2017 new time deposit and lending rates are expected to remain at the achieved com-paratively low levels. This dynamics will take advantage of the continued growth in attracted funds and high liquidity sustained in the banking system. Credit to non-financial corporations and households is expected to gradually accelerate its growth rate. Continued improvements in the macroeconomic environment are projected to be a factor behind both higher demand for loans amid comparatively low interest rates and increased lending risk appetite of banks.
Current and Capital Account Dynamics and Contribution by Component (on an Annual Basis)(EUR million)
Source: the BNB.
External Financial Flows
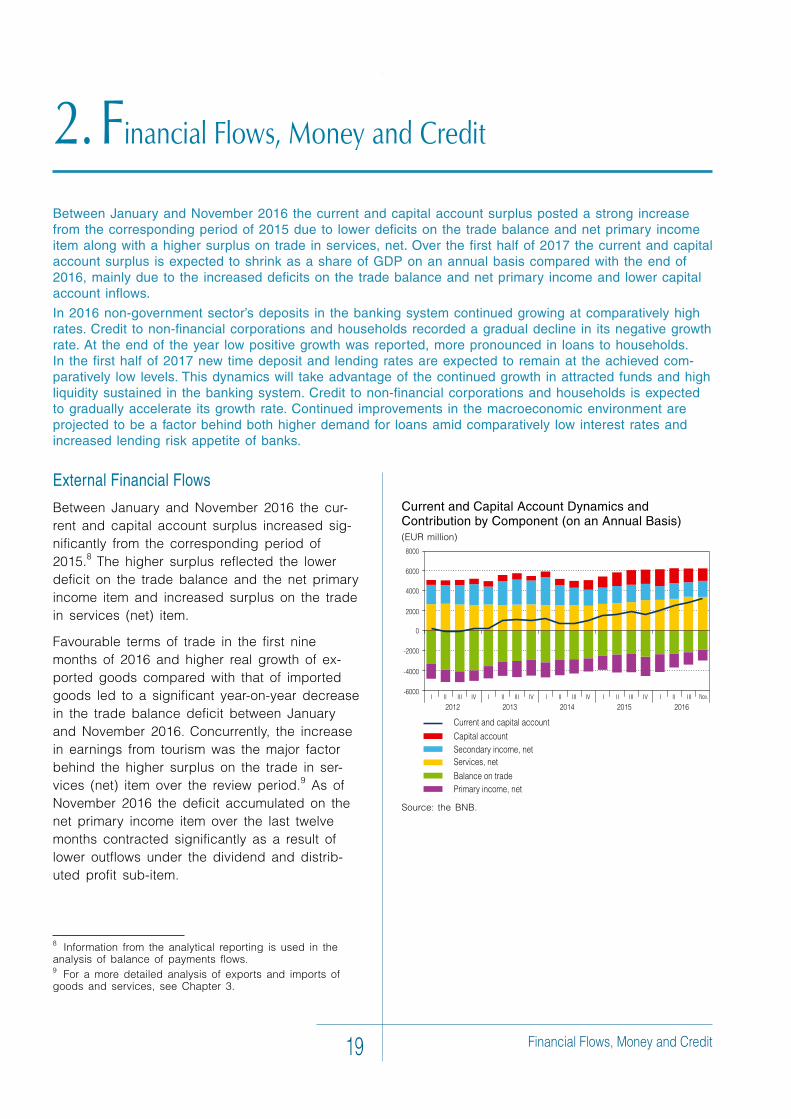
Between January and November 2016 the cur-rent and capital account surplus increased sig-nificantly from the corresponding period of 2015.8 The higher surplus reflected the lower deficit on the trade balance and the net primary income item and increased surplus on the trade in services (net) item.
Favourable terms of trade in the first nine months of 2016 and higher real growth of ex-ported goods compared with that of imported goods led to a significant year-on-year decrease in the trade balance deficit between January and November 2016. Concurrently, the increase in earnings from tourism was the major factor behind the higher surplus on the trade in ser-vices (net) item over the review period.9 As of November 2016 the deficit accumulated on the net primary income item over the last twelve months contracted significantly as a result of lower outflows under the dividend and distrib-uted profit sub-item.
8 Information from the analytical reporting is used in the analysis of balance of payments flows.9 For a more detailed analysis of exports and imports of goods and services, see Chapter 3.
Economic Review • 4/2016 20
The increase in the current and capital account surplus in the January–November 2016 period as compared with the corresponding period of 2015 was limited by the drop in the capital account surplus and, to a lesser extent, by the lower net secondary income surplus. After the expenditure incurred in the final stage of the 2007–2013 pro-gramming period had been refunded by the EU in the first seven months of 2016 together with the advance payments for the 2014–2020 pro-gramming period, receipts were limited in the second half-year due to the still low absorption of funds under new operational programmes. As a result the surplus on the net secondary in-come and on the capital account was lower than in the corresponding period of 2015.
In the first half of 2017 the positive overall bal-ance on the current and capital account is ex-pected to decrease on an annual basis as a percentage of GDP compared with end-2016, reflecting the impact of the expected increase in the deficit on the trade balance and on the net primary income item. Given the projected real growth of imports is higher than that of exported goods and the terms of trade worsen, the trade balance deficit is anticipated to increase as a percentage of GDP in the first half of 2017. Con-currently, gross operating surplus is expected to contribute to an increase in payment of divi-dends to non-residents, which will push up the deficit on the net primary income accordingly. The dynamics of capital account flows will be determined by the still low absorption of funds under the EU-funded operational programmes for the 2014–2020 programming period.
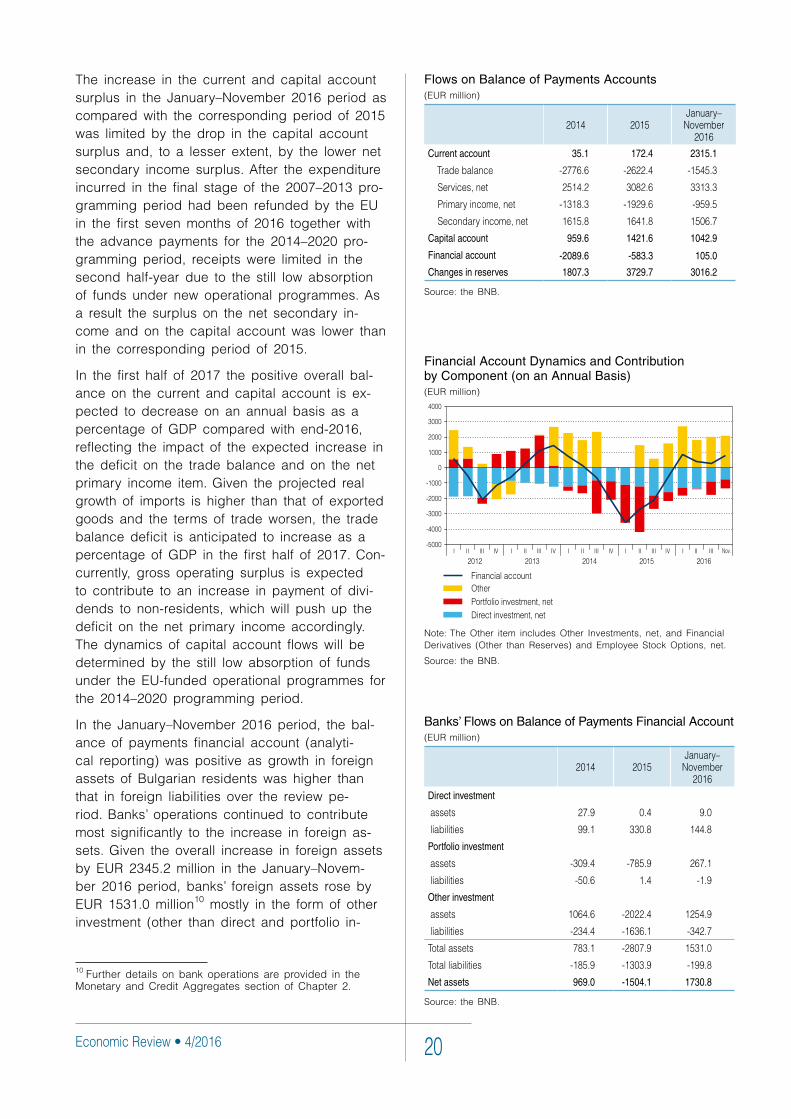
In the January–November 2016 period, the bal-ance of payments financial account (analyti-cal reporting) was positive as growth in foreign assets of Bulgarian residents was higher than that in foreign liabilities over the review pe-riod. Banks’ operations continued to contribute most significantly to the increase in foreign as-sets. Given the overall increase in foreign assets by EUR 2345.2 million in the January–Novem-ber 2016 period, banks’ foreign assets rose by EUR 1531.0 million10 mostly in the form of other investment (other than direct and portfolio in-
10 Further details on bank operations are provided in the Monetary and Credit Aggregates section of Chapter 2.
Banks’ Flows on Balance of Payments Financial Account (EUR million)
2014 2015January–
November2016
Direct investment
assets 27.9 0.4 9.0
liabilities 99.1 330.8 144.8
Portfolio investment
assets -309.4 -785.9 267.1
liabilities -50.6 1.4 -1.9
Other investment
assets 1064.6 -2022.4 1254.9
liabilities -234.4 -1636.1 -342.7
Totalassets 783.1 -2807.9 1531.0
Totalliabilities -185.9 -1303.9 -199.8
Net assets 969.0 -1504.1 1730.8
Source: the BNB.
Flows on Balance of Payments Accounts (EUR million)
2014 2015January–
November2016
Current account 35.1 172.4 2315.1
Tradebalance -2776.6 -2622.4 -1545.3
Services,net 2514.2 3082.6 3313.3
Primaryincome,net -1318.3 -1929.6 -959.5
Secondaryincome,net 1615.8 1641.8 1506.7
Capital account 959.6 1421.6 1042.9
Financial account -2089.6 -583.3 105.0
Changes in reserves 1807.3 3729.7 3016.2
Source: the BNB.
Financial Account Dynamics and Contribution by Component (on an Annual Basis)(EUR million)
Note: The Other item includes Other Investments, net, and Financial Derivatives (Other than Reserves) and Employee Stock Options, net.
Source: the BNB.
Financial Flows, Money and Credit21
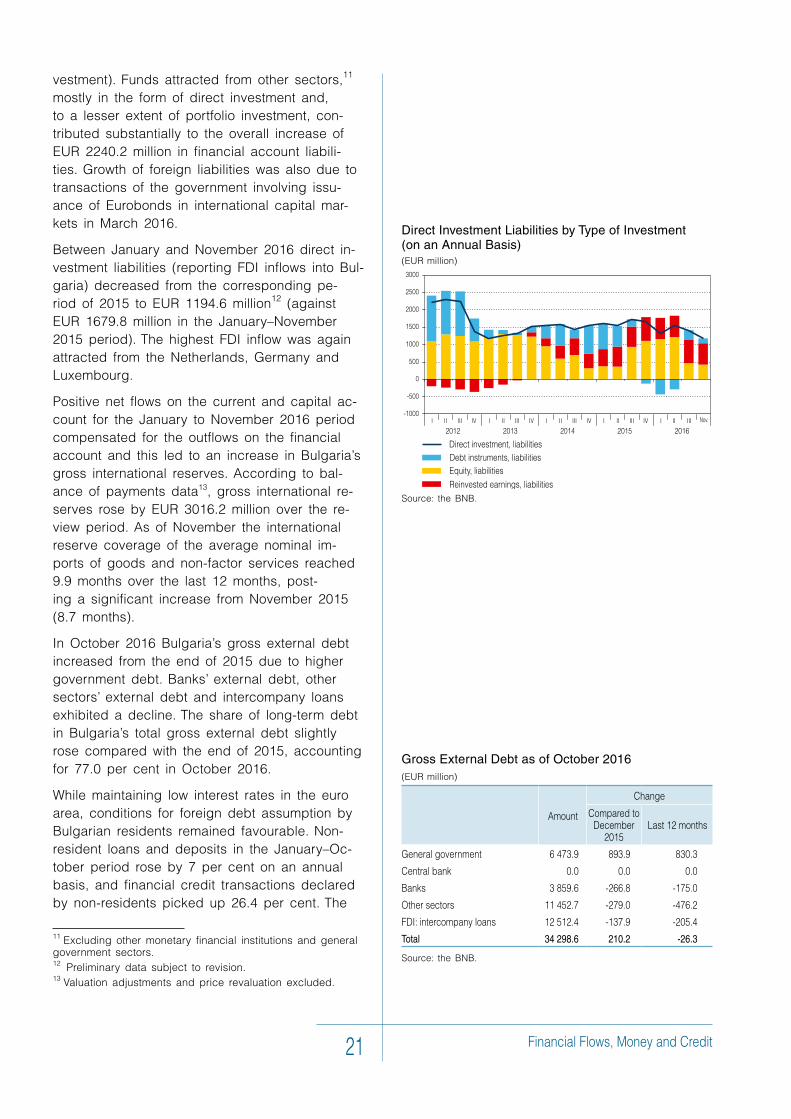
vestment). Funds attracted from other sectors,11 mostly in the form of direct investment and, to a lesser extent of portfolio investment, con-tributed substantially to the overall increase of EUR 2240.2 million in financial account liabili-ties. Growth of foreign liabilities was also due to transactions of the government involving issu-ance of Eurobonds in international capital mar-kets in March 2016.
Between January and November 2016 direct in-vestment liabilities (reporting FDI inflows into Bul-garia) decreased from the corresponding pe-riod of 2015 to EUR 1194.6 million12 (against EUR 1679.8 million in the January–November 2015 period). The highest FDI inflow was again attracted from the Netherlands, Germany and Luxembourg.
Positive net flows on the current and capital ac-count for the January to November 2016 period compensated for the outflows on the financial account and this led to an increase in Bulgaria’s gross international reserves. According to bal-ance of payments data13, gross international re-serves rose by EUR 3016.2 million over the re-view period. As of November the international reserve coverage of the average nominal im-ports of goods and non-factor services reached 9.9 months over the last 12 months, post-ing a significant increase from November 2015 (8.7 months).
In October 2016 Bulgaria’s gross external debt increased from the end of 2015 due to higher government debt. Banks’ external debt, other sectors’ external debt and intercompany loans exhibited a decline. The share of long-term debt in Bulgaria’s total gross external debt slightly rose compared with the end of 2015, accounting for 77.0 per cent in October 2016.
While maintaining low interest rates in the euro area, conditions for foreign debt assumption by Bulgarian residents remained favourable. Non-resident loans and deposits in the January–Oc-tober period rose by 7 per cent on an annual basis, and financial credit transactions declared by non-residents picked up 26.4 per cent. The
11 Excluding other monetary financial institutions and general government sectors.12 Preliminary data subject to revision.13 Valuation adjustments and price revaluation excluded.
Direct Investment Liabilities by Type of Investment (on an Annual Basis)(EUR million)
Source: the BNB.
Gross External Debt as of October 2016 (EUR million)
Amount
Change
ComparedtoDecember
2015Last12months
Generalgovernment 6473.9 893.9 830.3
Centralbank 0.0 0.0 0.0
Banks 3859.6 -266.8 -175.0
Othersectors 11452.7 -279.0 -476.2
FDI:intercompanyloans 12512.4 -137.9 -205.4
Total 34 298.6 210.2 -26.3
Source: the BNB.
Economic Review • 4/2016 22
Annual Rate of Change in М3 and Contribution by Component(per cent, percentage points)
Note: The marketable instruments component is not shown on the chart due to its insignificant contribution to broad money growth.
Source: the BNB.
share of long-term loans in total new loans in-creased further to 58.7 per cent of all new loans (against 51.3 per cent in January–October 2015).
Monetary and Credit Aggregates
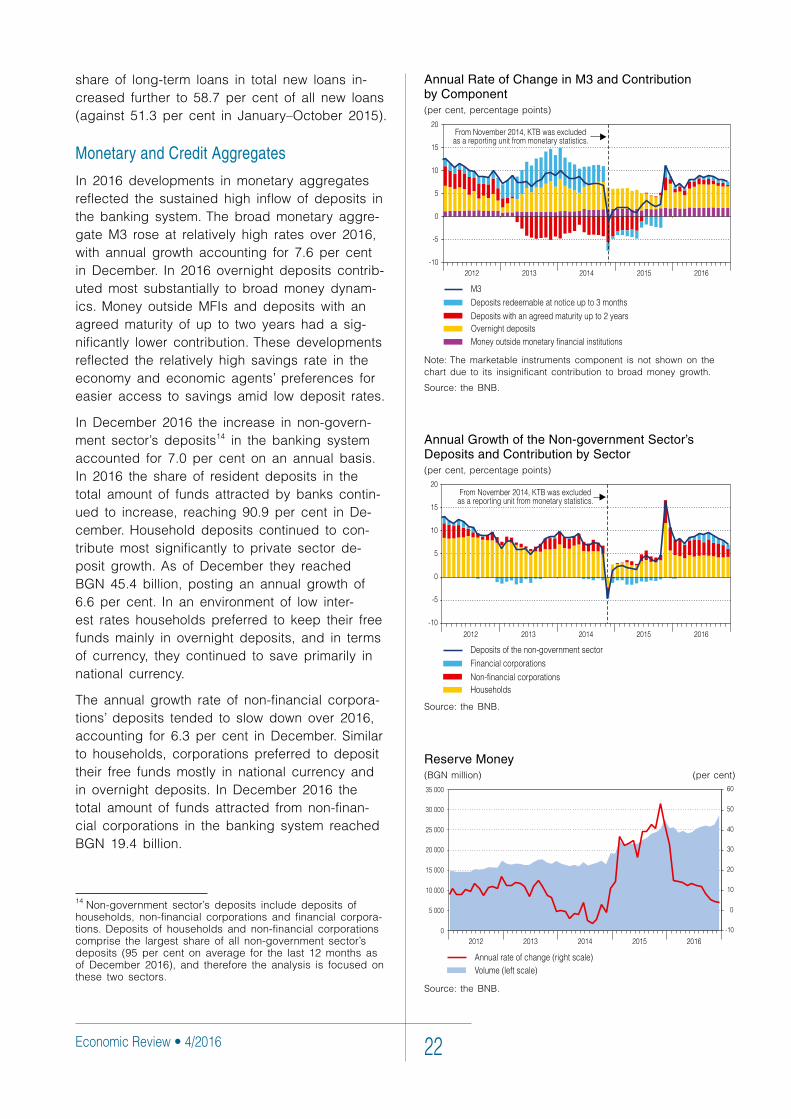
In 2016 developments in monetary aggregates reflected the sustained high inflow of deposits in the banking system. The broad monetary aggre-gate М3 rose at relatively high rates over 2016, with annual growth accounting for 7.6 per cent in December. In 2016 overnight deposits contrib-uted most substantially to broad money dynam-ics. Money outside MFIs and deposits with an agreed maturity of up to two years had a sig-nificantly lower contribution. These developments reflected the relatively high savings rate in the economy and economic agents’ preferences for easier access to savings amid low deposit rates.
In December 2016 the increase in non-govern-ment sector’s deposits14 in the banking system accounted for 7.0 per cent on an annual basis. In 2016 the share of resident deposits in the total amount of funds attracted by banks contin-ued to increase, reaching 90.9 per cent in De-cember. Household deposits continued to con-tribute most significantly to private sector de-posit growth. As of December they reached BGN 45.4 billion, posting an annual growth of 6.6 per cent. In an environment of low inter-est rates households preferred to keep their free funds mainly in overnight deposits, and in terms of currency, they continued to save primarily in national currency.
The annual growth rate of non-financial corpora-tions’ deposits tended to slow down over 2016, accounting for 6.3 per cent in December. Similar to households, corporations preferred to deposit their free funds mostly in national currency and in overnight deposits. In December 2016 the total amount of funds attracted from non-finan-cial corporations in the banking system reached BGN 19.4 billion.
14 Non-government sector’s deposits include deposits of households, non-financial corporations and financial corpora-tions. Deposits of households and non-financial corporations comprise the largest share of all non-government sector’s deposits (95 per cent on average for the last 12 months as of December 2016), and therefore the analysis is focused on these two sectors.
Reserve Money(BGN million) (per cent)
Source: the BNB.
Annual Growth of the Non-government Sector’s Deposits and Contribution by Sector(per cent, percentage points)
Source: the BNB.
Financial Flows, Money and Credit23
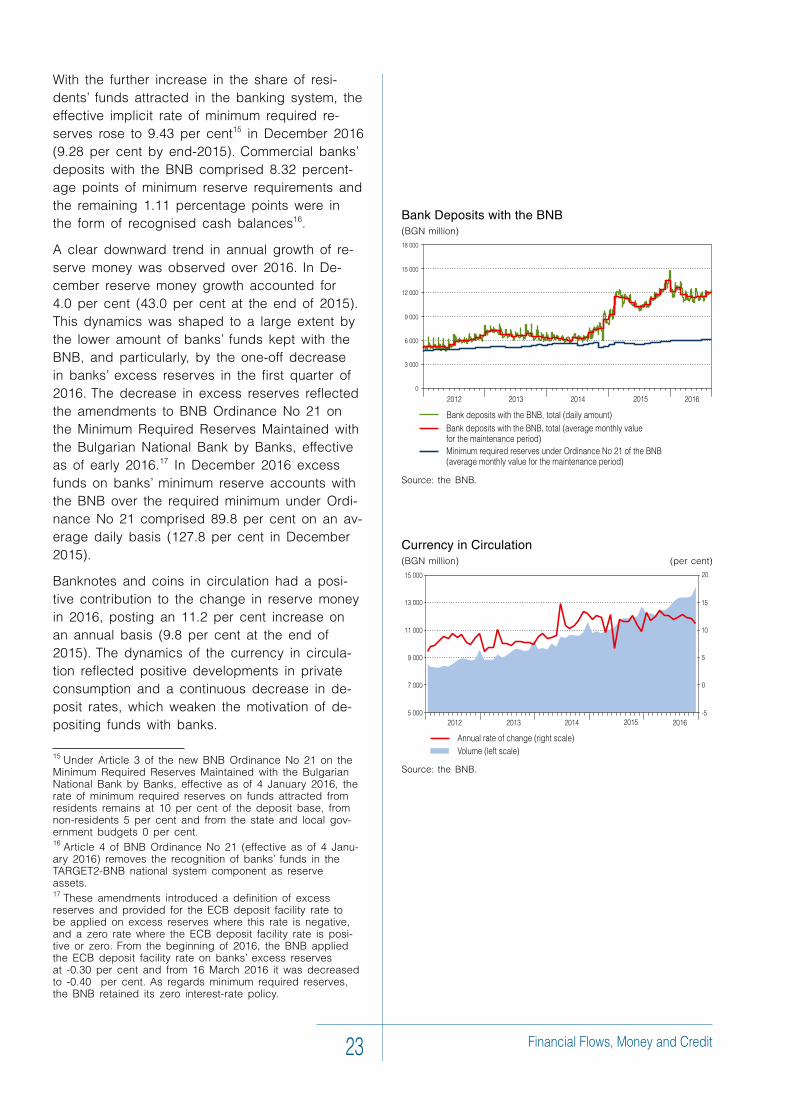
With the further increase in the share of resi-dents’ funds attracted in the banking system, the effective implicit rate of minimum required re-serves rose to 9.43 per cent15 in December 2016 (9.28 per cent by end-2015). Commercial banks’ deposits with the BNB comprised 8.32 percent-age points of minimum reserve requirements and the remaining 1.11 percentage points were in the form of recognised cash balances16.
A clear downward trend in annual growth of re-serve money was observed over 2016. In De-cember reserve money growth accounted for 4.0 per cent (43.0 per cent at the end of 2015). This dynamics was shaped to a large extent by the lower amount of banks’ funds kept with the BNB, and particularly, by the one-off decrease in banks’ excess reserves in the first quarter of 2016. The decrease in excess reserves reflected the amendments to BNB Ordinance No 21 on the Minimum Required Reserves Maintained with the Bulgarian National Bank by Banks, effective as of early 2016.17 In December 2016 excess funds on banks’ minimum reserve accounts with the BNB over the required minimum under Ordi-nance No 21 comprised 89.8 per cent on an av-erage daily basis (127.8 per cent in December 2015).
Banknotes and coins in circulation had a posi-tive contribution to the change in reserve money in 2016, posting an 11.2 per cent increase on an annual basis (9.8 per cent at the end of 2015). The dynamics of the currency in circula-tion reflected positive developments in private consumption and a continuous decrease in de-posit rates, which weaken the motivation of de-positing funds with banks.
15 Under Article 3 of the new BNB Ordinance No 21 on the Minimum Required Reserves Maintained with the Bulgarian National Bank by Banks, effective as of 4 January 2016, the rate of minimum required reserves on funds attracted from residents remains at 10 per cent of the deposit base, from non-residents 5 per cent and from the state and local gov-ernment budgets 0 per cent.16 Article 4 of BNB Ordinance No 21 (effective as of 4 Janu-ary 2016) removes the recognition of banks’ funds in the TARGET2-BNB national system component as reserve assets.17 These amendments introduced a definition of excess reserves and provided for the ECB deposit facility rate to be applied on excess reserves where this rate is negative, and a zero rate where the ECB deposit facility rate is posi-tive or zero. From the beginning of 2016, the BNB applied the ECB deposit facility rate on banks’ excess reserves at -0.30 per cent and from 16 March 2016 it was decreased to -0.40 per cent. As regards minimum required reserves, the BNB retained its zero interest-rate policy.
Currency in Circulation(BGN million) (per cent)
Source: the BNB.
Bank Deposits with the BNB(BGN million)
Source: the BNB.
Economic Review • 4/2016 24
Foreign Currency Purchases and Sales between the BNB and Banks (on a Monthly Basis)(EUR million) (EUR million)
Note: Net means currency purchased minus currency sold by the BNB. Data refer to all bank transactions in foreign currency, including liquidity management operations related to the transfer of own funds from lev accounts with the BNB to own accounts with the BNB in euro and vice versa.
Source: the BNB.
Annual Growth of Loans to Non-financial Corporations and Contributions of Individual Types of Loans(per cent, percentage points)
Source: the BNB.
In 2016 the banking sector retained its high li-quidity position, with the liquid asset ratio ac-counting for 37.94 per cent in November (36.71 per cent at the end of 2015). Banks pre-ferred to increase their investment mostly outside Bulgaria but used a portion of their resources to raise their Bulgarian government bond portfolios, for lending to the non-government sector and for payment of foreign liabilities.
The currency trade with the BNB in euro is the major instrument of banks for liquidity manage-ment under currency board arrangements. In 2016 the BNB was a net purchaser of foreign currency from banks, unlike the previous three years when euro sales exceeded purchases. In 2016 BNB purchases (net) from banks came to EUR 1 billion.
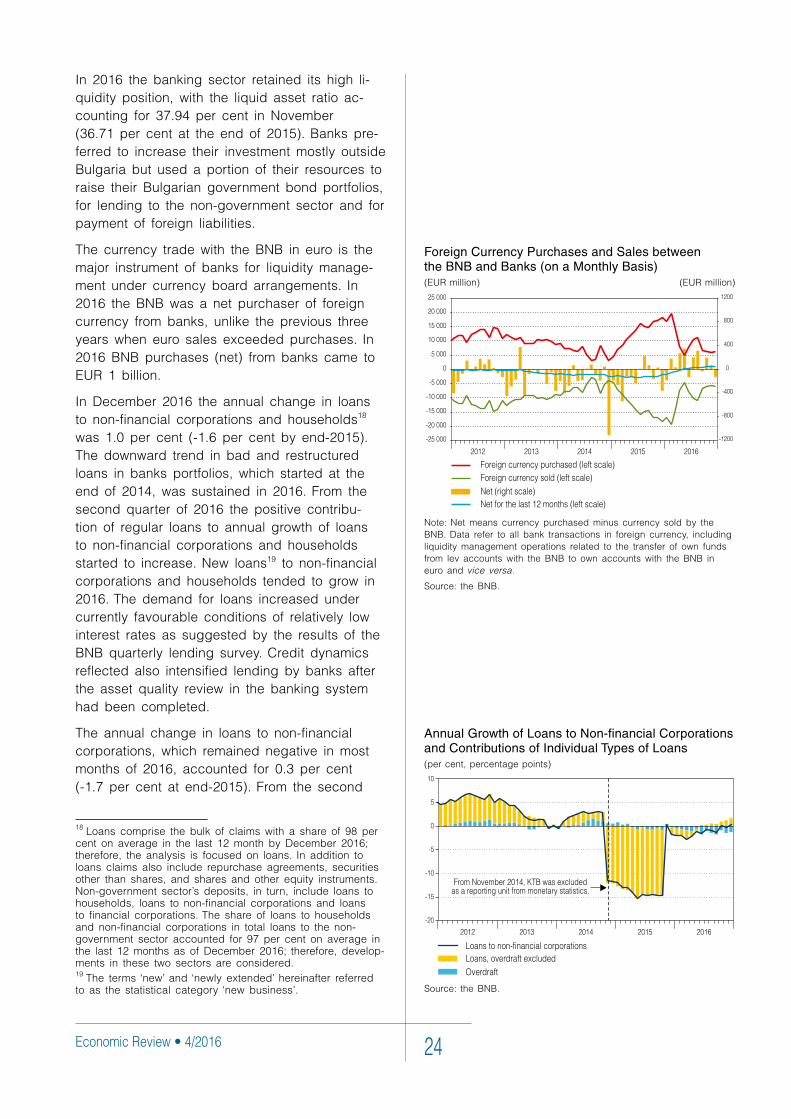
In December 2016 the annual change in loans to non-financial corporations and households18 was 1.0 per cent (-1.6 per cent by end-2015). The downward trend in bad and restructured loans in banks portfolios, which started at the end of 2014, was sustained in 2016. From the second quarter of 2016 the positive contribu-tion of regular loans to annual growth of loans to non-financial corporations and households started to increase. New loans19 to non-financial corporations and households tended to grow in 2016. The demand for loans increased under currently favourable conditions of relatively low interest rates as suggested by the results of the BNB quarterly lending survey. Credit dynamics reflected also intensified lending by banks after the asset quality review in the banking system had been completed.
The annual change in loans to non-financial corporations, which remained negative in most months of 2016, accounted for 0.3 per cent (-1.7 per cent at end-2015). From the second
18 Loans comprise the bulk of claims with a share of 98 per cent on average in the last 12 month by December 2016; therefore, the analysis is focused on loans. In addition to loans claims also include repurchase agreements, securities other than shares, and shares and other equity instruments. Non-government sector’s deposits, in turn, include loans to households, loans to non-financial corporations and loans to financial corporations. The share of loans to households and non-financial corporations in total loans to the non-government sector accounted for 97 per cent on average in the last 12 months as of December 2016; therefore, develop-ments in these two sectors are considered.19 The terms ‘new’ and ‘newly extended’ hereinafter referred to as the statistical category ‘new business’.
Financial Flows, Money and Credit25
half of 2016 loans to corporations, excluding overdraft, contributed positively to the annual change. The positive contribution of regular cor-porate loans to the annual change in loans to non-financial corporations also increased from the second quarter of 2016.
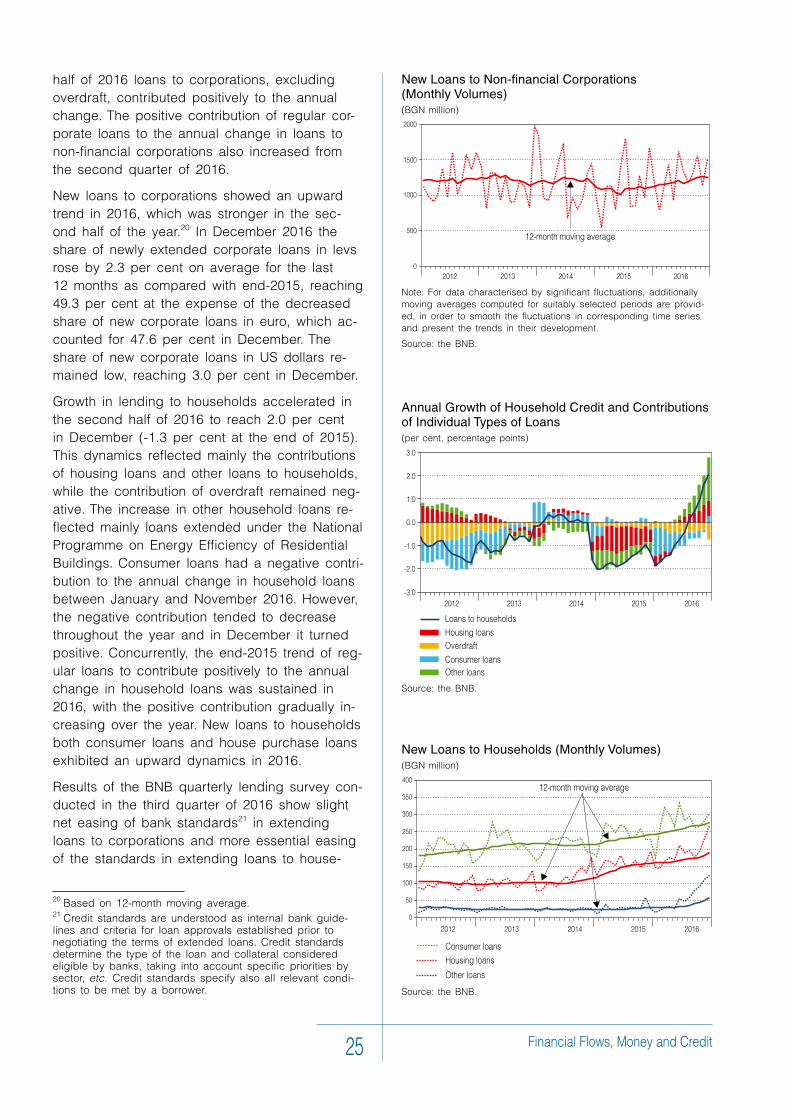
New loans to corporations showed an upward trend in 2016, which was stronger in the sec-ond half of the year.20 In December 2016 the share of newly extended corporate loans in levs rose by 2.3 per cent on average for the last 12 months as compared with end-2015, reaching 49.3 per cent at the expense of the decreased share of new corporate loans in euro, which ac-counted for 47.6 per cent in December. The share of new corporate loans in US dollars re-mained low, reaching 3.0 per cent in December.
Growth in lending to households accelerated in the second half of 2016 to reach 2.0 per cent in December (-1.3 per cent at the end of 2015). This dynamics reflected mainly the contributions of housing loans and other loans to households, while the contribution of overdraft remained neg-ative. The increase in other household loans re-flected mainly loans extended under the National Programme on Energy Efficiency of Residential Buildings. Consumer loans had a negative contri-bution to the annual change in household loans between January and November 2016. However, the negative contribution tended to decrease throughout the year and in December it turned positive. Concurrently, the end-2015 trend of reg-ular loans to contribute positively to the annual change in household loans was sustained in 2016, with the positive contribution gradually in-creasing over the year. New loans to households both consumer loans and house purchase loans exhibited an upward dynamics in 2016.
Results of the BNB quarterly lending survey con-ducted in the third quarter of 2016 show slight net easing of bank standards21 in extending loans to corporations and more essential easing of the standards in extending loans to house-
20 Based on 12-month moving average.21 Credit standards are understood as internal bank guide-lines and criteria for loan approvals established prior to negotiating the terms of extended loans. Credit standards determine the type of the loan and collateral considered eligible by banks, taking into account specific priorities by sector, etc. Credit standards specify also all relevant condi-tions to be met by a borrower.
New Loans to Households (Monthly Volumes)(BGN million)
Source: the BNB.
Annual Growth of Household Credit and Contributions of Individual Types of Loans (per cent, percentage points)
Source: the BNB.
New Loans to Non-financial Corporations (Monthly Volumes)(BGN million)
Note: For data characterised by significant fluctuations, additionally moving averages computed for suitably selected periods are provid-ed, in order to smooth the fluctuations in corresponding time series and present the trends in their development.
Source: the BNB.
Economic Review • 4/2016 26
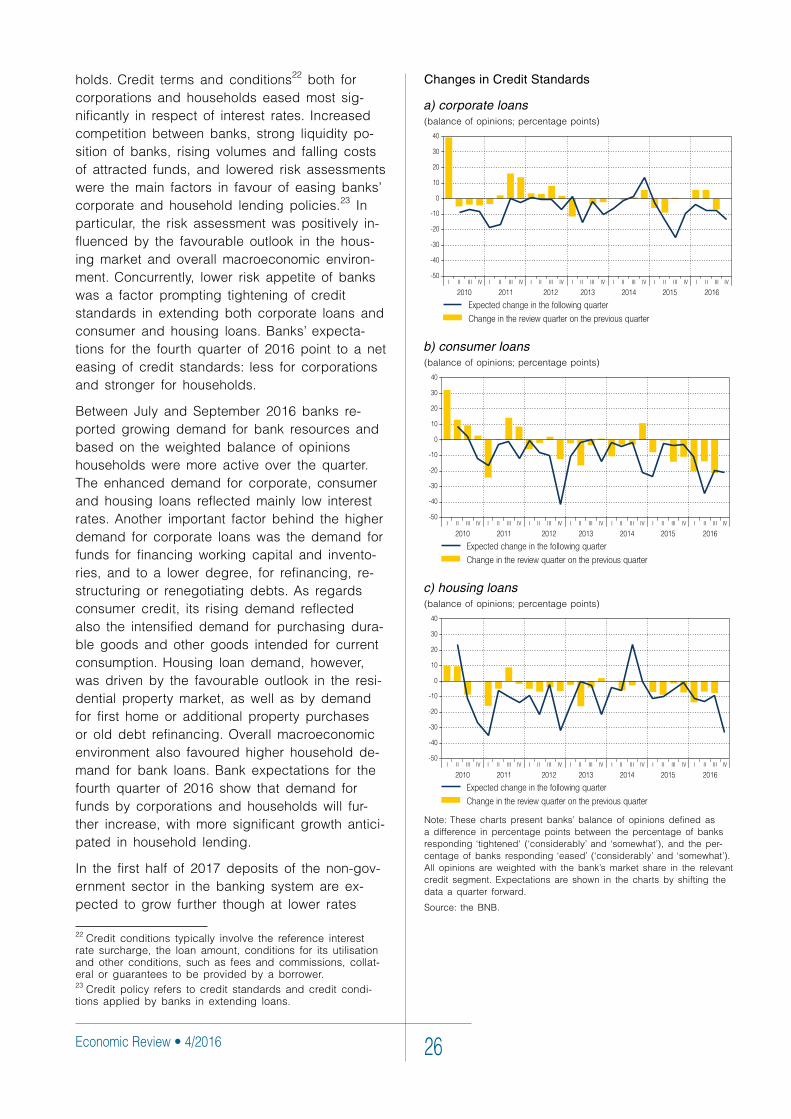
Changes in Credit Standards
а) corporate loans (balance of opinions; percentage points)
b) consumer loans (balance of opinions; percentage points)
c) housing loans (balance of opinions; percentage points)
Note: These charts present banks’ balance of opinions defined as a difference in percentage points between the percentage of banks responding ‘tightened' (‘considerably’ and ‘somewhat’), and the per-centage of banks responding ‘eased’ (‘considerably’ and ‘somewhat’). All opinions are weighted with the bank’s market share in the relevant credit segment. Expectations are shown in the charts by shifting the data a quarter forward.
Source: the BNB.
holds. Credit terms and conditions22 both for corporations and households eased most sig-nificantly in respect of interest rates. Increased competition between banks, strong liquidity po-sition of banks, rising volumes and falling costs of attracted funds, and lowered risk assessments were the main factors in favour of easing banks’ corporate and household lending policies.23 In particular, the risk assessment was positively in-fluenced by the favourable outlook in the hous-ing market and overall macroeconomic environ-ment. Concurrently, lower risk appetite of banks was a factor prompting tightening of credit standards in extending both corporate loans and consumer and housing loans. Banks’ expecta-tions for the fourth quarter of 2016 point to a net easing of credit standards: less for corporations and stronger for households.
Between July and September 2016 banks re-ported growing demand for bank resources and based on the weighted balance of opinions households were more active over the quarter. The enhanced demand for corporate, consumer and housing loans reflected mainly low interest rates. Another important factor behind the higher demand for corporate loans was the demand for funds for financing working capital and invento-ries, and to a lower degree, for refinancing, re-structuring or renegotiating debts. As regards consumer credit, its rising demand reflected also the intensified demand for purchasing dura-ble goods and other goods intended for current consumption. Housing loan demand, however, was driven by the favourable outlook in the resi-dential property market, as well as by demand for first home or additional property purchases or old debt refinancing. Overall macroeconomic environment also favoured higher household de-mand for bank loans. Bank expectations for the fourth quarter of 2016 show that demand for funds by corporations and households will fur-ther increase, with more significant growth antici-pated in household lending.
In the first half of 2017 deposits of the non-gov-ernment sector in the banking system are ex-pected to grow further though at lower rates
22 Credit conditions typically involve the reference interest rate surcharge, the loan amount, conditions for its utilisation and other conditions, such as fees and commissions, collat-eral or guarantees to be provided by a borrower. 23 Credit policy refers to credit standards and credit condi-tions applied by banks in extending loans.
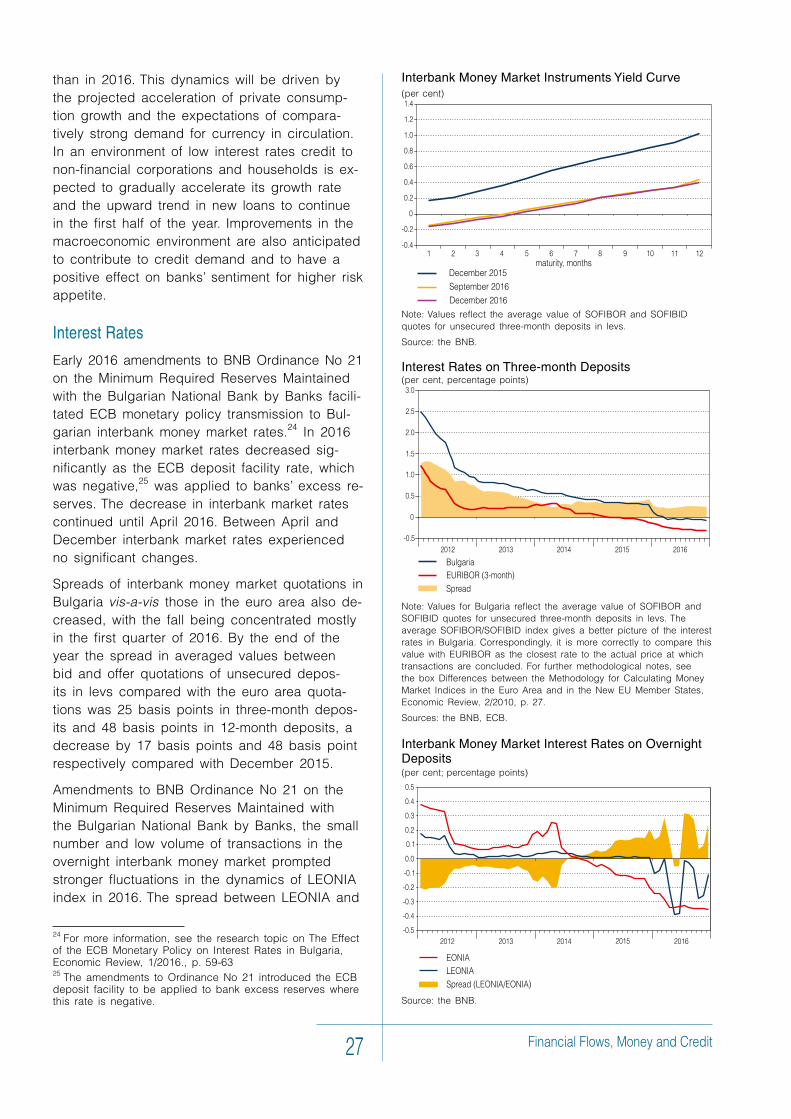
Financial Flows, Money and Credit27
than in 2016. This dynamics will be driven by the projected acceleration of private consump-tion growth and the expectations of compara-tively strong demand for currency in circulation. In an environment of low interest rates credit to non-financial corporations and households is ex-pected to gradually accelerate its growth rate and the upward trend in new loans to continue in the first half of the year. Improvements in the macroeconomic environment are also anticipated to contribute to credit demand and to have a positive effect on banks’ sentiment for higher risk appetite.
Interest Rates
Early 2016 amendments to BNB Ordinance No 21 on the Minimum Required Reserves Maintained with the Bulgarian National Bank by Banks facili-tated ECB monetary policy transmission to Bul-garian interbank money market rates.24 In 2016 interbank money market rates decreased sig-nificantly as the ECB deposit facility rate, which was negative,25 was applied to banks’ excess re-serves. The decrease in interbank market rates continued until April 2016. Between April and December interbank market rates experienced no significant changes.
Spreads of interbank money market quotations in Bulgaria vis-a-vis those in the euro area also de-creased, with the fall being concentrated mostly in the first quarter of 2016. By the end of the year the spread in averaged values between bid and offer quotations of unsecured depos-its in levs compared with the euro area quota-tions was 25 basis points in three-month depos-its and 48 basis points in 12-month deposits, a decrease by 17 basis points and 48 basis point respectively compared with December 2015.
Amendments to BNB Ordinance No 21 on the Minimum Required Reserves Maintained with the Bulgarian National Bank by Banks, the small number and low volume of transactions in the overnight interbank money market prompted stronger fluctuations in the dynamics of LEONIA index in 2016. The spread between LEONIA and
24 For more information, see the research topic on The Effect of the ECB Monetary Policy on Interest Rates in Bulgaria, Economic Review, 1/2016., p. 59-6325 The amendments to Ordinance No 21 introduced the ECB deposit facility to be applied to bank excess reserves where this rate is negative.
Interbank Money Market Interest Rates on Overnight Deposits(per cent; percentage points)
Source: the BNB.
Interest Rates on Three-month Deposits(per cent, percentage points)
Note: Values for Bulgaria reflect the average value of SOFIBOR and SOFIBID quotes for unsecured three-month deposits in levs. The average SOFIBOR/SOFIBID index gives a better picture of the interest rates in Bulgaria. Correspondingly, it is more correctly to compare this value with EURIBOR as the closest rate to the actual price at which transactions are concluded. For further methodological notes, see the box Differences between the Methodology for Calculating Money Market Indices in the Euro Area and in the New EU Member States, Economic Review, 2/2010, p. 27.
Sources: the BNB, ECB.
Interbank Money Market Instruments Yield Curve(per cent)
Note: Values reflect the average value of SOFIBOR and SOFIBID quotes for unsecured three-month deposits in levs.
Source: the BNB.
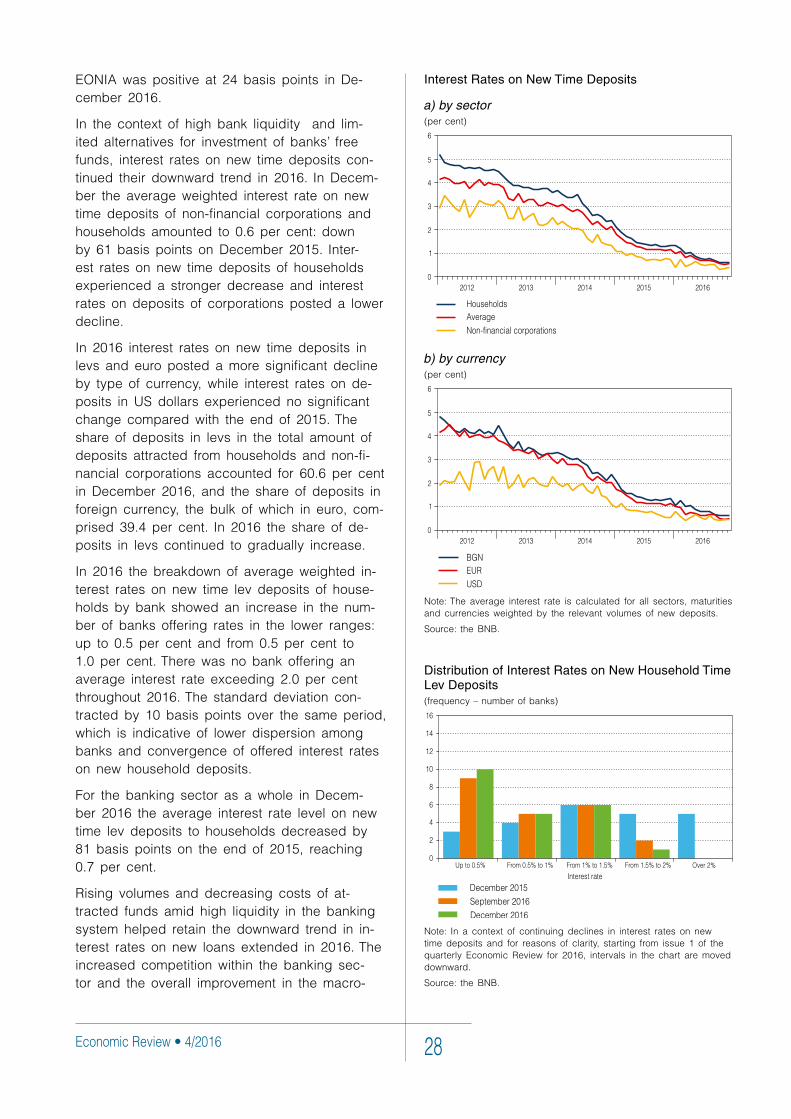
Economic Review • 4/2016 28
Interest Rates on New Time Deposits
a) by sector(per cent)
b) by currency(per cent)
Note: The average interest rate is calculated for all sectors, maturities and currencies weighted by the relevant volumes of new deposits.
Source: the BNB.
Distribution of Interest Rates on New Household Time Lev Deposits(frequency – number of banks)
Note: In a context of continuing declines in interest rates on new time deposits and for reasons of clarity, starting from issue 1 of the quarterly Economic Review for 2016, intervals in the chart are moved downward.
Source: the BNB.
EONIA was positive at 24 basis points in De-cember 2016.
In the context of high bank liquidity and lim-ited alternatives for investment of banks’ free funds, interest rates on new time deposits con-tinued their downward trend in 2016. In Decem-ber the average weighted interest rate on new time deposits of non-financial corporations and households amounted to 0.6 per cent: down by 61 basis points on December 2015. Inter-est rates on new time deposits of households experienced a stronger decrease and interest rates on deposits of corporations posted a lower decline.
In 2016 interest rates on new time deposits in levs and euro posted a more significant decline by type of currency, while interest rates on de-posits in US dollars experienced no significant change compared with the end of 2015. The share of deposits in levs in the total amount of deposits attracted from households and non-fi-nancial corporations accounted for 60.6 per cent in December 2016, and the share of deposits in foreign currency, the bulk of which in euro, com-prised 39.4 per cent. In 2016 the share of de-posits in levs continued to gradually increase.
In 2016 the breakdown of average weighted in-terest rates on new time lev deposits of house-holds by bank showed an increase in the num-ber of banks offering rates in the lower ranges: up to 0.5 per cent and from 0.5 per cent to 1.0 per cent. There was no bank offering an average interest rate exceeding 2.0 per cent throughout 2016. The standard deviation con-tracted by 10 basis points over the same period, which is indicative of lower dispersion among banks and convergence of offered interest rates on new household deposits.
For the banking sector as a whole in Decem-ber 2016 the average interest rate level on new time lev deposits to households decreased by 81 basis points on the end of 2015, reaching 0.7 per cent.
Rising volumes and decreasing costs of at-tracted funds amid high liquidity in the banking system helped retain the downward trend in in-terest rates on new loans extended in 2016. The increased competition within the banking sec-tor and the overall improvement in the macro-
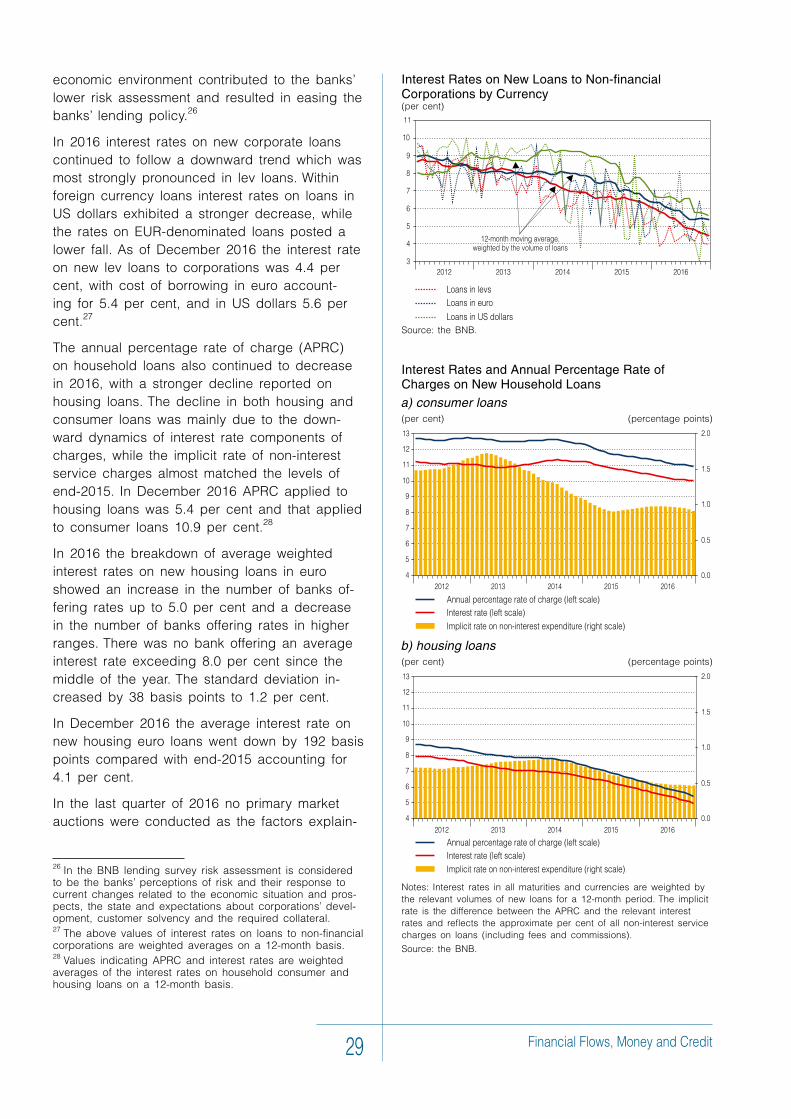
Financial Flows, Money and Credit29
economic environment contributed to the banks’ lower risk assessment and resulted in easing the banks’ lending policy.26
In 2016 interest rates on new corporate loans continued to follow a downward trend which was most strongly pronounced in lev loans. Within foreign currency loans interest rates on loans in US dollars exhibited a stronger decrease, while the rates on EUR-denominated loans posted a lower fall. As of December 2016 the interest rate on new lev loans to corporations was 4.4 per cent, with cost of borrowing in euro account-ing for 5.4 per cent, and in US dollars 5.6 per cent.27
The annual percentage rate of charge (APRC) on household loans also continued to decrease in 2016, with a stronger decline reported on housing loans. The decline in both housing and consumer loans was mainly due to the down-ward dynamics of interest rate components of charges, while the implicit rate of non-interest service charges almost matched the levels of end-2015. In December 2016 APRC applied to housing loans was 5.4 per cent and that applied to consumer loans 10.9 per cent.28
In 2016 the breakdown of average weighted interest rates on new housing loans in euro showed an increase in the number of banks of-fering rates up to 5.0 per cent and a decrease in the number of banks offering rates in higher ranges. There was no bank offering an average interest rate exceeding 8.0 per cent since the middle of the year. The standard deviation in-creased by 38 basis points to 1.2 per cent.
In December 2016 the average interest rate on new housing euro loans went down by 192 basis points compared with end-2015 accounting for 4.1 per cent.
In the last quarter of 2016 no primary market auctions were conducted as the factors explain-
26 In the BNB lending survey risk assessment is considered to be the banks’ perceptions of risk and their response to current changes related to the economic situation and pros-pects, the state and expectations about corporations’ devel-opment, customer solvency and the required collateral.27 The above values of interest rates on loans to non-financial corporations are weighted averages on a 12-month basis.28 Values indicating APRC and interest rates are weighted averages of the interest rates on household consumer and housing loans on a 12-month basis.
Interest Rates and Annual Percentage Rate of Charges on New Household Loans
a) consumer loans(per cent) (percentage points)
b) housing loans(per cent) (percentage points)
Notes: Interest rates in all maturities and currencies are weighted by the relevant volumes of new loans for a 12-month period. The implicit rate is the difference between the APRC and the relevant interest rates and reflects the approximate per cent of all non-interest service charges on loans (including fees and commissions).
Source: the BNB.
Interest Rates on New Loans to Non-financial Corporations by Currency(per cent)
Source: the BNB.
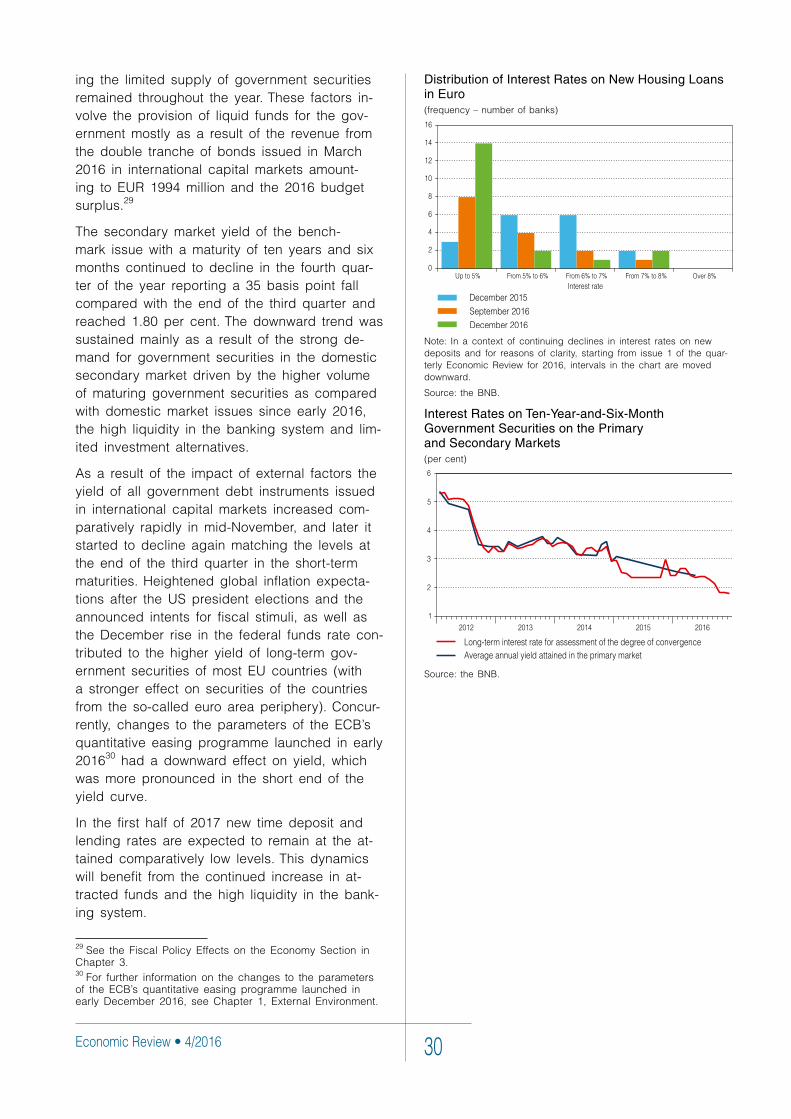
Economic Review • 4/2016 30
Distribution of Interest Rates on New Housing Loans in Euro(frequency – number of banks)
Note: In a context of continuing declines in interest rates on new deposits and for reasons of clarity, starting from issue 1 of the quar-terly Economic Review for 2016, intervals in the chart are moved downward.
Source: the BNB.
Interest Rates on Ten-Year-and-Six-Month Government Securities on the Primary and Secondary Markets (per cent)
Source: the BNB.
ing the limited supply of government securities remained throughout the year. These factors in-volve the provision of liquid funds for the gov-ernment mostly as a result of the revenue from the double tranche of bonds issued in March 2016 in international capital markets amount-ing to EUR 1994 million and the 2016 budget surplus.29
The secondary market yield of the bench-mark issue with a maturity of ten years and six months continued to decline in the fourth quar-ter of the year reporting a 35 basis point fall compared with the end of the third quarter and reached 1.80 per cent. The downward trend was sustained mainly as a result of the strong de-mand for government securities in the domestic secondary market driven by the higher volume of maturing government securities as compared with domestic market issues since early 2016, the high liquidity in the banking system and lim-ited investment alternatives.
As a result of the impact of external factors the yield of all government debt instruments issued in international capital markets increased com-paratively rapidly in mid-November, and later it started to decline again matching the levels at the end of the third quarter in the short-term maturities. Heightened global inflation expecta-tions after the US president elections and the announced intents for fiscal stimuli, as well as the December rise in the federal funds rate con-tributed to the higher yield of long-term gov-ernment securities of most EU countries (with a stronger effect on securities of the countries from the so-called euro area periphery). Concur-rently, changes to the parameters of the ECB’s quantitative easing programme launched in early 201630 had a downward effect on yield, which was more pronounced in the short end of the yield curve.
In the first half of 2017 new time deposit and lending rates are expected to remain at the at-tained comparatively low levels. This dynamics will benefit from the continued increase in at-tracted funds and the high liquidity in the bank-ing system.
29 See the Fiscal Policy Effects on the Economy Section in Chapter 3.30 For further information on the changes to the parameters of the ECB’s quantitative easing programme launched in early December 2016, see Chapter 1, External Environment.
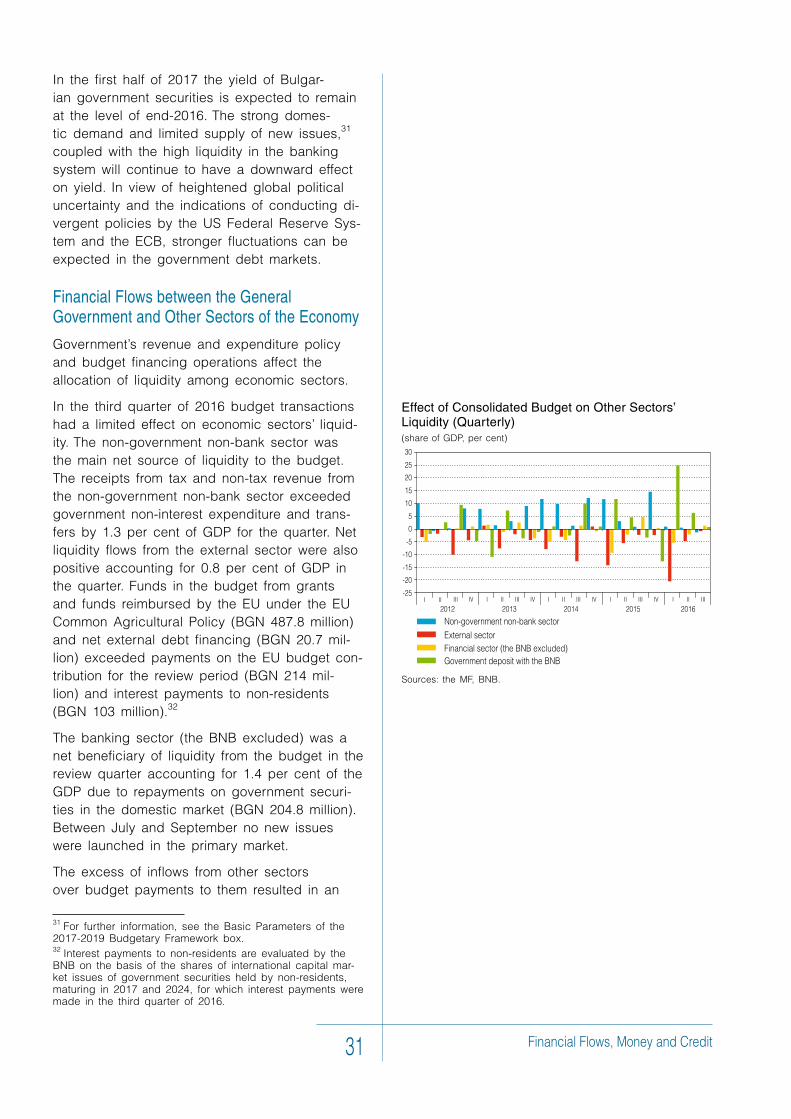
Financial Flows, Money and Credit31
In the first half of 2017 the yield of Bulgar-ian government securities is expected to remain at the level of end-2016. The strong domes-tic demand and limited supply of new issues,31 coupled with the high liquidity in the banking system will continue to have a downward effect on yield. In view of heightened global political uncertainty and the indications of conducting di-vergent policies by the US Federal Reserve Sys-tem and the ECB, stronger fluctuations can be expected in the government debt markets.
Financial Flows between the General Government and Other Sectors of the Economy
Government’s revenue and expenditure policy and budget financing operations affect the allocation of liquidity among economic sectors.
In the third quarter of 2016 budget transactions had a limited effect on economic sectors’ liquid-ity. The non-government non-bank sector was the main net source of liquidity to the budget. The receipts from tax and non-tax revenue from the non-government non-bank sector exceeded government non-interest expenditure and trans-fers by 1.3 per cent of GDP for the quarter. Net liquidity flows from the external sector were also positive accounting for 0.8 per cent of GDP in the quarter. Funds in the budget from grants and funds reimbursed by the EU under the EU Common Agricultural Policy (BGN 487.8 million) and net external debt financing (BGN 20.7 mil-lion) exceeded payments on the EU budget con-tribution for the review period (BGN 214 mil-lion) and interest payments to non-residents (BGN 103 million).32
The banking sector (the BNB excluded) was a net beneficiary of liquidity from the budget in the review quarter accounting for 1.4 per cent of the GDP due to repayments on government securi-ties in the domestic market (BGN 204.8 million). Between July and September no new issues were launched in the primary market.
The excess of inflows from other sectors over budget payments to them resulted in an
31 For further information, see the Basic Parameters of the 2017-2019 Budgetary Framework box.32 Interest payments to non-residents are evaluated by the BNB on the basis of the shares of international capital mar-ket issues of government securities held by non-residents, maturing in 2017 and 2024, for which interest payments were made in the third quarter of 2016.
Effect of Consolidated Budget on Other Sectors’ Liquidity (Quarterly)(share of GDP, per cent)
Sources: the MF, BNB.
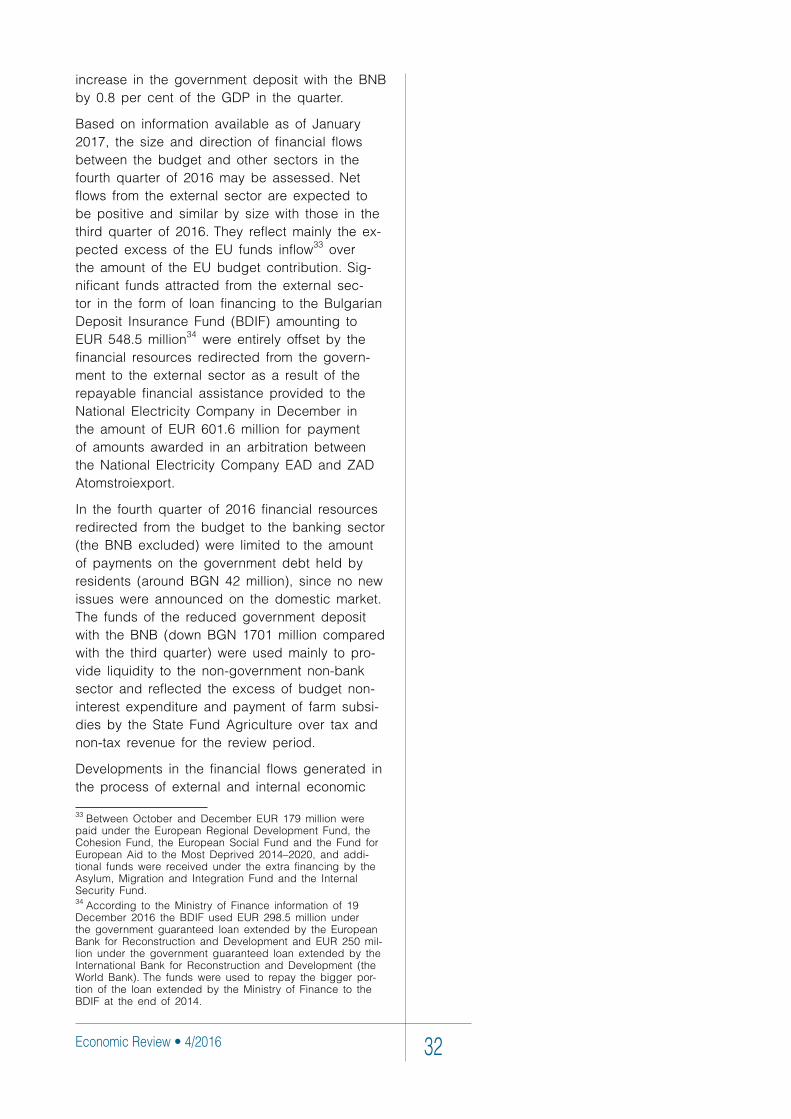
Economic Review • 4/2016 32
increase in the government deposit with the BNB by 0.8 per cent of the GDP in the quarter.
Based on information available as of January 2017, the size and direction of financial flows between the budget and other sectors in the fourth quarter of 2016 may be assessed. Net flows from the external sector are expected to be positive and similar by size with those in the third quarter of 2016. They reflect mainly the ex-pected excess of the EU funds inflow33 over the amount of the EU budget contribution. Sig-nificant funds attracted from the external sec-tor in the form of loan financing to the Bulgarian Deposit Insurance Fund (BDIF) amounting to EUR 548.5 million34 were entirely offset by the financial resources redirected from the govern-ment to the external sector as a result of the repayable financial assistance provided to the National Electricity Company in December in the amount of EUR 601.6 million for payment of amounts awarded in an arbitration between the National Electricity Company EAD and ZAD Atomstroiexport.
In the fourth quarter of 2016 financial resources redirected from the budget to the banking sector (the BNB excluded) were limited to the amount of payments on the government debt held by residents (around BGN 42 million), since no new issues were announced on the domestic market. The funds of the reduced government deposit with the BNB (down BGN 1701 million compared with the third quarter) were used mainly to pro-vide liquidity to the non-government non-bank sector and reflected the excess of budget non-interest expenditure and payment of farm subsi-dies by the State Fund Agriculture over tax and non-tax revenue for the review period.
Developments in the financial flows generated in the process of external and internal economic
33 Between October and December EUR 179 million were paid under the European Regional Development Fund, the Cohesion Fund, the European Social Fund and the Fund for European Aid to the Most Deprived 2014–2020, and addi-tional funds were received under the extra financing by the Asylum, Migration and Integration Fund and the Internal Security Fund. 34 According to the Ministry of Finance information of 19 December 2016 the BDIF used EUR 298.5 million under the government guaranteed loan extended by the European Bank for Reconstruction and Development and EUR 250 mil-lion under the government guaranteed loan extended by the International Bank for Reconstruction and Development (the World Bank). The funds were used to repay the bigger por-tion of the loan extended by the Ministry of Finance to the BDIF at the end of 2014.
Financial Flows, Money and Credit33
factor interaction contributed to growth in gross international reserves in 2016. In December the market value of international reserves (assets on the BNB Issue Department balance sheet) rose from the end of the 2015 by EUR 3.6 billion to EUR 23.9 billion (BGN 46.7 billion). According to the currency board principles, the increase in in-ternational reserves corresponds to the increase in the Issue Department balance sheet liabilities. The government deposit with the BNB, where Eurobonds proceeds in March and the large sur-plus accumulated on the consolidated fiscal pro-gramme were invested, contributed most signifi-cantly to the rise in liabilities. The increase in currency in circulation had a weaker effect on the dynamics of liabilities. Concurrently, reduced liabilities to banks vis-Ў-vis the end of 2015 lim-ited growth in Issue Department’s liabilities.
In the first half of 2017 banks’ reserves with the BNB are expected to remain at levels close to the average 2016 levels. The dynamics of the government deposit with the BNB will be driven mainly by the budget balance in the first half of 2017, and the pending EU reimburse-ment of subsidies for farmers paid in Decem-ber 2016 will have a positive effect. As a result of projected acceleration of private consumption growth and keeping the deposit rates at the at-tained low levels, currency in circulation is ex-pected to increase at comparatively high rates on an annual basis over the projection horizon.
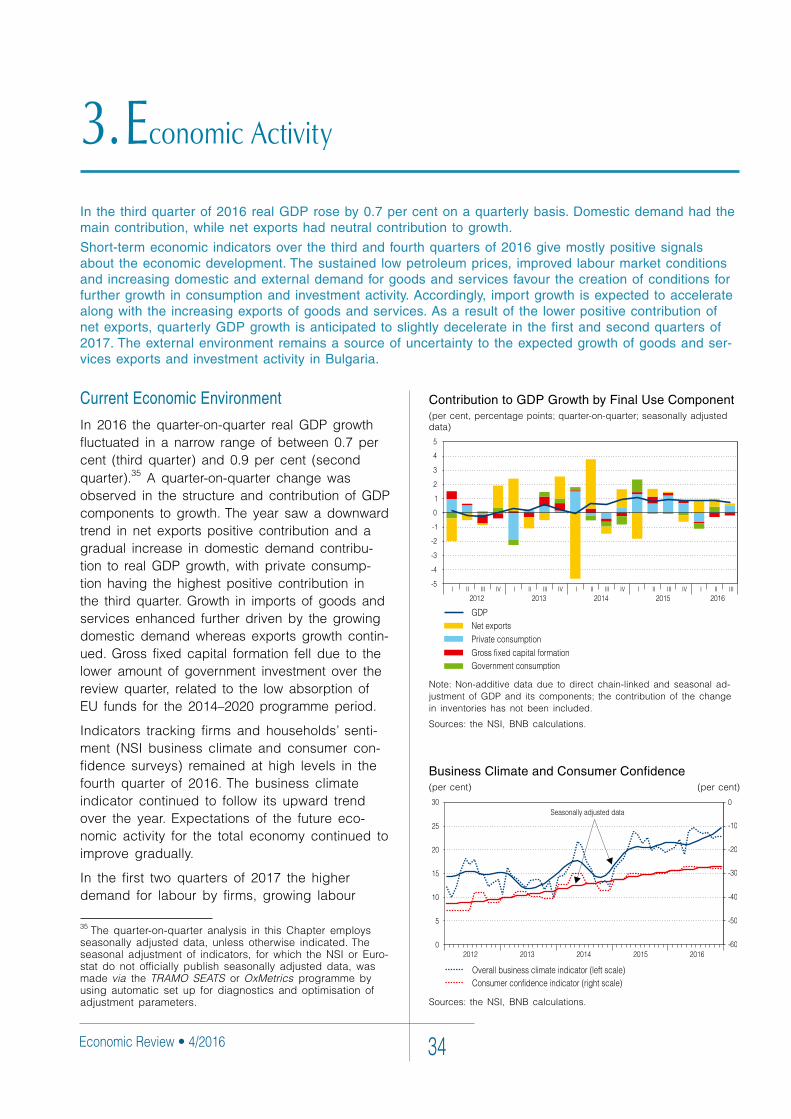
Economic Review • 4/2016 34
Current Economic Environment
In 2016 the quarter-on-quarter real GDP growth fluctuated in a narrow range of between 0.7 per cent (third quarter) and 0.9 per cent (second quarter).35 A quarter-on-quarter change was observed in the structure and contribution of GDP components to growth. The year saw a downward trend in net exports positive contribution and a gradual increase in domestic demand contribu-tion to real GDP growth, with private consump-tion having the highest positive contribution in the third quarter. Growth in imports of goods and services enhanced further driven by the growing domestic demand whereas exports growth contin-ued. Gross fixed capital formation fell due to the lower amount of government investment over the review quarter, related to the low absorption of EU funds for the 2014–2020 programme period.
Indicators tracking firms and households’ senti-ment (NSI business climate and consumer con-fidence surveys) remained at high levels in the fourth quarter of 2016. The business climate indicator continued to follow its upward trend over the year. Expectations of the future eco-nomic activity for the total economy continued to improve gradually.
In the first two quarters of 2017 the higher demand for labour by firms, growing labour
35 The quarter-on-quarter analysis in this Chapter employs seasonally adjusted data, unless otherwise indicated. The seasonal adjustment of indicators, for which the NSI or Euro-stat do not officially publish seasonally adjusted data, was made via the TRAMO SEATS or OxMetrics programme by using automatic set up for diagnostics and optimisation of adjustment parameters.
In the third quarter of 2016 real GDP rose by 0.7 per cent on a quarterly basis. Domestic demand had the main contribution, while net exports had neutral contribution to growth.
Short-term economic indicators over the third and fourth quarters of 2016 give mostly positive signals about the economic development. The sustained low petroleum prices, improved labour market conditions and increasing domestic and external demand for goods and services favour the creation of conditions for further growth in consumption and investment activity. Accordingly, import growth is expected to accelerate along with the increasing exports of goods and services. As a result of the lower positive contribution of net exports, quarterly GDP growth is anticipated to slightly decelerate in the first and second quarters of 2017. The external environment remains a source of uncertainty to the expected growth of goods and ser-vices exports and investment activity in Bulgaria.
3. Economic Activity
Contribution to GDP Growth by Final Use Component(per cent, percentage points; quarter-on-quarter; seasonally adjusted data)
Note: Non-additive data due to direct chain-linked and seasonal ad-justment of GDP and its components; the contribution of the change in inventories has not been included.
Sources: the NSI, BNB calculations.
Business Climate and Consumer Confidence(per cent) (per cent)
Sources: the NSI, BNB calculations.
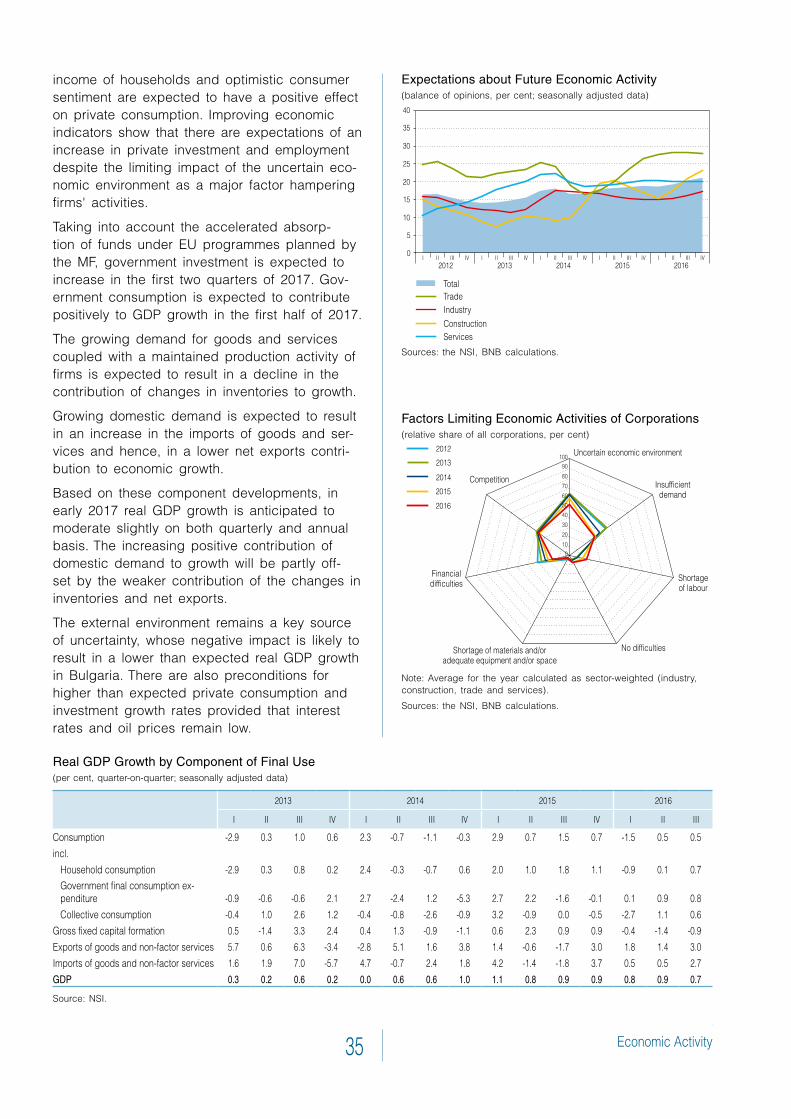
Еconomic Activity35
income of households and optimistic consumer sentiment are expected to have a positive effect on private consumption. Improving economic indicators show that there are expectations of an increase in private investment and employment despite the limiting impact of the uncertain eco-nomic environment as a major factor hampering firms' activities.
Taking into account the accelerated absorp-tion of funds under EU programmes planned by the MF, government investment is expected to increase in the first two quarters of 2017. Gov-ernment consumption is expected to contribute positively to GDP growth in the first half of 2017.
The growing demand for goods and services coupled with a maintained production activity of firms is expected to result in a decline in the contribution of changes in inventories to growth.
Growing domestic demand is expected to result in an increase in the imports of goods and ser-vices and hence, in a lower net exports contri-bution to economic growth.
Based on these component developments, in early 2017 real GDP growth is anticipated to moderate slightly on both quarterly and annual basis. The increasing positive contribution of domestic demand to growth will be partly off-set by the weaker contribution of the changes in inventories and net exports.
The external environment remains a key source of uncertainty, whose negative impact is likely to result in a lower than expected real GDP growth in Bulgaria. There are also preconditions for higher than expected private consumption and investment growth rates provided that interest rates and oil prices remain low.
Factors Limiting Economic Activities of Corporations (relative share of all corporations, per cent)
Note: Average for the year calculated as sector-weighted (industry, construction, trade and services).
Sources: the NSI, BNB calculations.
Expectations about Future Economic Activity (balance of opinions, per cent; seasonally adjusted data)
Sources: the NSI, BNB calculations.
Real GDP Growth by Component of Final Use(per cent, quarter-on-quarter; seasonally adjusted data)
2013 2014 2015 2016
I II III IV I II III IV I II III IV I II III
Consumption -2.9 0.3 1.0 0.6 2.3 -0.7 -1.1 -0.3 2.9 0.7 1.5 0.7 -1.5 0.5 0.5
incl.
Householdconsumption -2.9 0.3 0.8 0.2 2.4 -0.3 -0.7 0.6 2.0 1.0 1.8 1.1 -0.9 0.1 0.7
Governmentfinalconsumptionex-penditure -0.9 -0.6 -0.6 2.1 2.7 -2.4 1.2 -5.3 2.7 2.2 -1.6 -0.1 0.1 0.9 0.8
Collectiveconsumption -0.4 1.0 2.6 1.2 -0.4 -0.8 -2.6 -0.9 3.2 -0.9 0.0 -0.5 -2.7 1.1 0.6
Grossfixedcapitalformation 0.5 -1.4 3.3 2.4 0.4 1.3 -0.9 -1.1 0.6 2.3 0.9 0.9 -0.4 -1.4 -0.9
Exportsofgoodsandnon-factorservices 5.7 0.6 6.3 -3.4 -2.8 5.1 1.6 3.8 1.4 -0.6 -1.7 3.0 1.8 1.4 3.0
Importsofgoodsandnon-factorservices 1.6 1.9 7.0 -5.7 4.7 -0.7 2.4 1.8 4.2 -1.4 -1.8 3.7 0.5 0.5 2.7
GDP 0.3 0.2 0.6 0.2 0.0 0.6 0.6 1.0 1.1 0.8 0.9 0.9 0.8 0.9 0.7
Source: NSI.
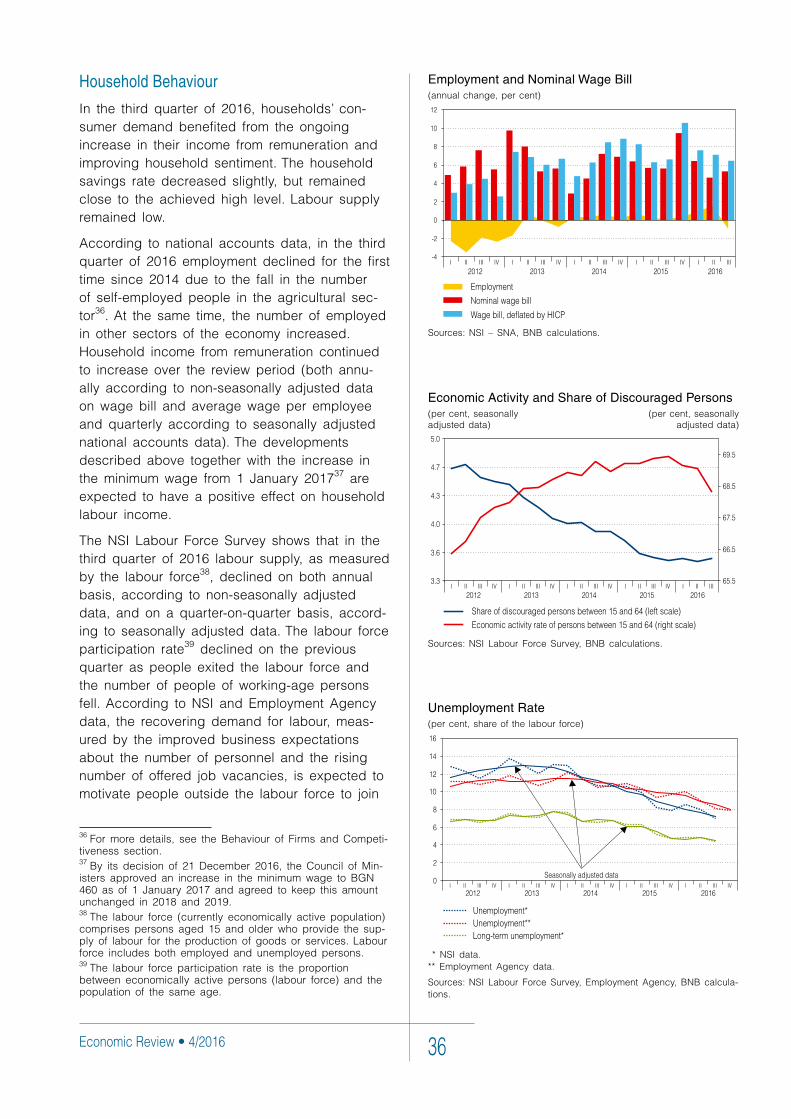
Economic Review • 4/2016 36
Household Behaviour
In the third quarter of 2016, households’ con-sumer demand benefited from the ongoing increase in their income from remuneration and improving household sentiment. The household savings rate decreased slightly, but remained close to the achieved high level. Labour supply remained low.
According to national accounts data, in the third quarter of 2016 employment declined for the first time since 2014 due to the fall in the number of self-employed people in the agricultural sec-tor36. At the same time, the number of employed in other sectors of the economy increased. Household income from remuneration continued to increase over the review period (both annu-ally according to non-seasonally adjusted data on wage bill and average wage per employee and quarterly according to seasonally adjusted national accounts data). The developments described above together with the increase in the minimum wage from 1 January 201737 are expected to have a positive effect on household labour income.
The NSI Labour Force Survey shows that in the third quarter of 2016 labour supply, as measured by the labour force38, declined on both annual basis, according to non-seasonally adjusted data, and on a quarter-on-quarter basis, accord-ing to seasonally adjusted data. The labour force participation rate39 declined on the previous quarter as people exited the labour force and the number of people of working-age persons fell. According to NSI and Employment Agency data, the recovering demand for labour, meas-ured by the improved business expectations about the number of personnel and the rising number of offered job vacancies, is expected to motivate people outside the labour force to join
36 For more details, see the Behaviour of Firms and Competi-tiveness section.37 By its decision of 21 December 2016, the Council of Min-isters approved an increase in the minimum wage to BGN 460 as of 1 January 2017 and agreed to keep this amount unchanged in 2018 and 2019.38 The labour force (currently economically active population) comprises persons aged 15 and older who provide the sup-ply of labour for the production of goods or services. Labour force includes both employed and unemployed persons.39 The labour force participation rate is the proportion between economically active persons (labour force) and the population of the same age.
Employment and Nominal Wage Bill(annual change, per cent)
Sources: NSI – SNA, BNB calculations.
Economic Activity and Share of Discouraged Persons(per cent, seasonally (per cent, seasonally adjusted data) adjusted data)
Sources: NSI Labour Force Survey, BNB calculations.
Unemployment Rate(per cent, share of the labour force)
* NSI data. ** Employment Agency data.
Sources: NSI Labour Force Survey, Employment Agency, BNB calcula-tions.
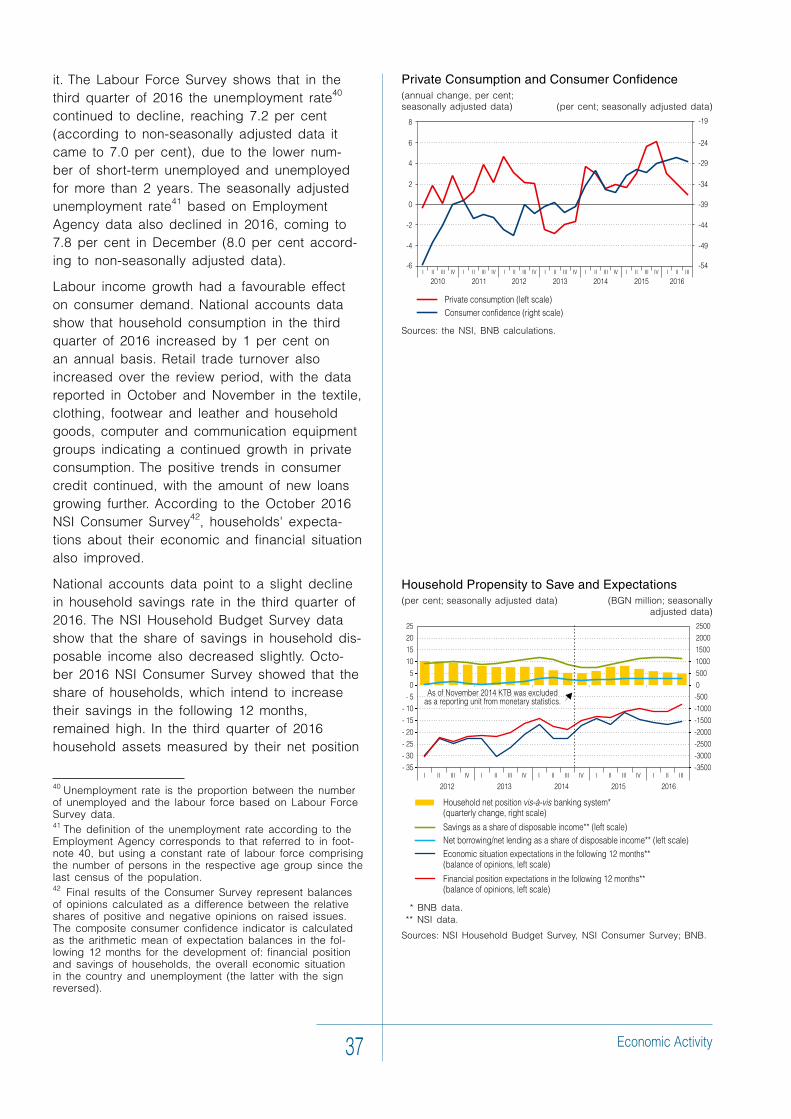
Еconomic Activity37
it. The Labour Force Survey shows that in the third quarter of 2016 the unemployment rate40 continued to decline, reaching 7.2 per cent (according to non-seasonally adjusted data it came to 7.0 per cent), due to the lower num-ber of short-term unemployed and unemployed for more than 2 years. The seasonally adjusted unemployment rate41 based on Employment Agency data also declined in 2016, coming to 7.8 per cent in December (8.0 per cent accord-ing to non-seasonally adjusted data).
Labour income growth had a favourable effect on consumer demand. National accounts data show that household consumption in the third quarter of 2016 increased by 1 per cent on an annual basis. Retail trade turnover also increased over the review period, with the data reported in October and November in the textile, clothing, footwear and leather and household goods, computer and communication equipment groups indicating a continued growth in private consumption. The positive trends in consumer credit continued, with the amount of new loans growing further. According to the October 2016 NSI Consumer Survey42, households' expecta-tions about their economic and financial situation also improved.
National accounts data point to a slight decline in household savings rate in the third quarter of 2016. The NSI Household Budget Survey data show that the share of savings in household dis-posable income also decreased slightly. Octo-ber 2016 NSI Consumer Survey showed that the share of households, which intend to increase their savings in the following 12 months, remained high. In the third quarter of 2016 household assets measured by their net position
40 Unemployment rate is the proportion between the number of unemployed and the labour force based on Labour Force Survey data.41 The definition of the unemployment rate according to the Employment Agency corresponds to that referred to in foot-note 40, but using a constant rate of labour force comprising the number of persons in the respective age group since the last census of the population. 42 Final results of the Consumer Survey represent balances of opinions calculated as a difference between the relative shares of positive and negative opinions on raised issues. The composite consumer confidence indicator is calculated as the arithmetic mean of expectation balances in the fol-lowing 12 months for the development of: financial position and savings of households, the overall economic situation in the country and unemployment (the latter with the sign reversed).
Private Consumption and Consumer Confidence(annual change, per cent; seasonally adjusted data) (per cent; seasonally adjusted data)
Sources: the NSI, BNB calculations.
Household Propensity to Save and Expectations(per cent; seasonally adjusted data) (BGN million; seasonally
adjusted data)
* BNB data. ** NSI data.
Sources: NSI Household Budget Survey, NSI Consumer Survey; BNB.
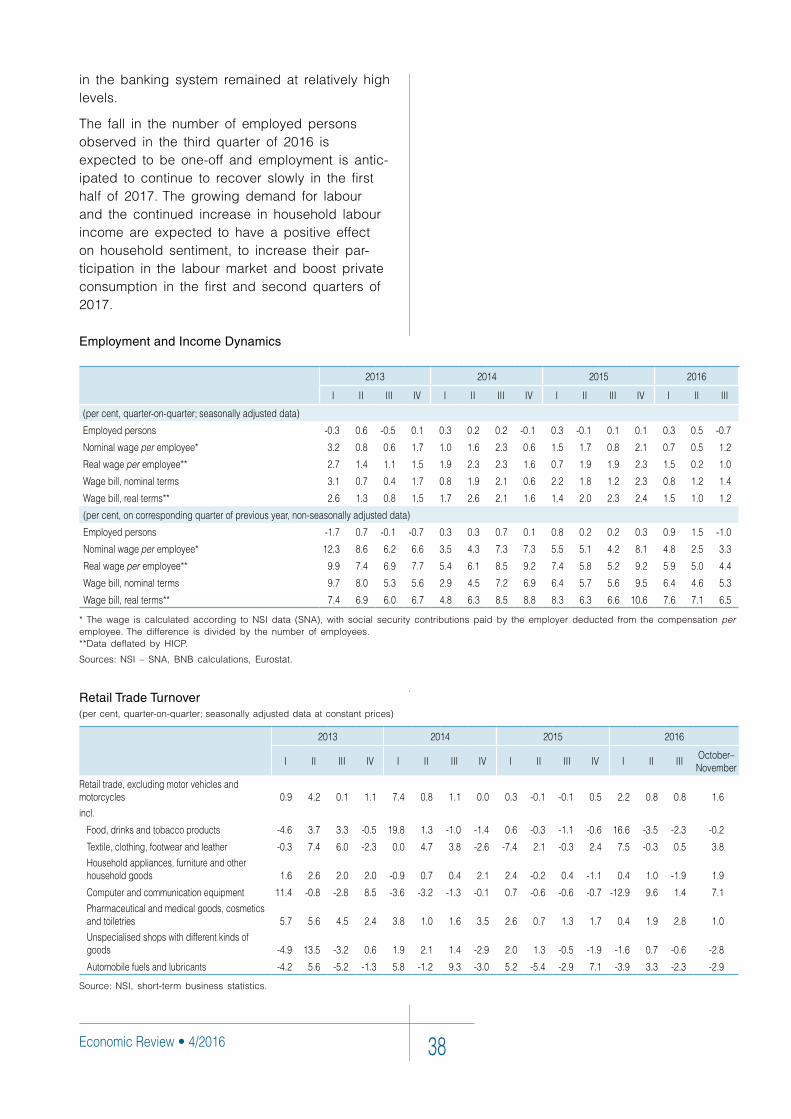
Economic Review • 4/2016 38
in the banking system remained at relatively high levels.
The fall in the number of employed persons observed in the third quarter of 2016 is expected to be one-off and employment is antic-ipated to continue to recover slowly in the first half of 2017. The growing demand for labour and the continued increase in household labour income are expected to have a positive effect on household sentiment, to increase their par-ticipation in the labour market and boost private consumption in the first and second quarters of 2017.
Employment and Income Dynamics
2013 2014 2015 2016
I II III IV I II III IV I II III IV I II III
(percent,quarter-on-quarter;seasonallyadjusteddata)
Employedpersons -0.3 0.6 -0.5 0.1 0.3 0.2 0.2 -0.1 0.3 -0.1 0.1 0.1 0.3 0.5 -0.7
Nominalwageperemployee* 3.2 0.8 0.6 1.7 1.0 1.6 2.3 0.6 1.5 1.7 0.8 2.1 0.7 0.5 1.2
Realwageperemployee** 2.7 1.4 1.1 1.5 1.9 2.3 2.3 1.6 0.7 1.9 1.9 2.3 1.5 0.2 1.0
Wagebill,nominalterms 3.1 0.7 0.4 1.7 0.8 1.9 2.1 0.6 2.2 1.8 1.2 2.3 0.8 1.2 1.4
Wagebill,realterms** 2.6 1.3 0.8 1.5 1.7 2.6 2.1 1.6 1.4 2.0 2.3 2.4 1.5 1.0 1.2
(percent,oncorrespondingquarterofpreviousyear,non-seasonallyadjusteddata)
Employedpersons -1.7 0.7 -0.1 -0.7 0.3 0.3 0.7 0.1 0.8 0.2 0.2 0.3 0.9 1.5 -1.0
Nominalwageperemployee* 12.3 8.6 6.2 6.6 3.5 4.3 7.3 7.3 5.5 5.1 4.2 8.1 4.8 2.5 3.3
Realwageperemployee** 9.9 7.4 6.9 7.7 5.4 6.1 8.5 9.2 7.4 5.8 5.2 9.2 5.9 5.0 4.4
Wagebill,nominalterms 9.7 8.0 5.3 5.6 2.9 4.5 7.2 6.9 6.4 5.7 5.6 9.5 6.4 4.6 5.3
Wagebill,realterms** 7.4 6.9 6.0 6.7 4.8 6.3 8.5 8.8 8.3 6.3 6.6 10.6 7.6 7.1 6.5
* The wage is calculated according to NSI data (SNA), with social security contributions paid by the employer deducted from the compensation per employee. The difference is divided by the number of employees. **Data deflated by HICP.
Sources: NSI – SNA, BNB calculations, Eurostat.
Retail Trade Turnover(per cent, quarter-on-quarter; seasonally adjusted data at constant prices)
2013 2014 2015 2016
I II III IV I II III IV I II III IV I II IIIOctober–November
Retailtrade,excludingmotorvehiclesandmotorcycles 0.9 4.2 0.1 1.1 7.4 0.8 1.1 0.0 0.3 -0.1 -0.1 0.5 2.2 0.8 0.8 1.6
incl.
Food,drinksandtobaccoproducts -4.6 3.7 3.3 -0.5 19.8 1.3 -1.0 -1.4 0.6 -0.3 -1.1 -0.6 16.6 -3.5 -2.3 -0.2
Textile,clothing,footwearandleather -0.3 7.4 6.0 -2.3 0.0 4.7 3.8 -2.6 -7.4 2.1 -0.3 2.4 7.5 -0.3 0.5 3.8
Householdappliances,furnitureandotherhouseholdgoods 1.6 2.6 2.0 2.0 -0.9 0.7 0.4 2.1 2.4 -0.2 0.4 -1.1 0.4 1.0 -1.9 1.9
Computerandcommunicationequipment 11.4 -0.8 -2.8 8.5 -3.6 -3.2 -1.3 -0.1 0.7 -0.6 -0.6 -0.7 -12.9 9.6 1.4 7.1
Pharmaceuticalandmedicalgoods,cosmeticsandtoiletries 5.7 5.6 4.5 2.4 3.8 1.0 1.6 3.5 2.6 0.7 1.3 1.7 0.4 1.9 2.8 1.0
Unspecialisedshopswithdifferentkindsofgoods -4.9 13.5 -3.2 0.6 1.9 2.1 1.4 -2.9 2.0 1.3 -0.5 -1.9 -1.6 0.7 -0.6 -2.8
Automobilefuelsandlubricants -4.2 5.6 -5.2 -1.3 5.8 -1.2 9.3 -3.0 5.2 -5.4 -2.9 7.1 -3.9 3.3 -2.3 -2.9
Source: NSI, short-term business statistics.
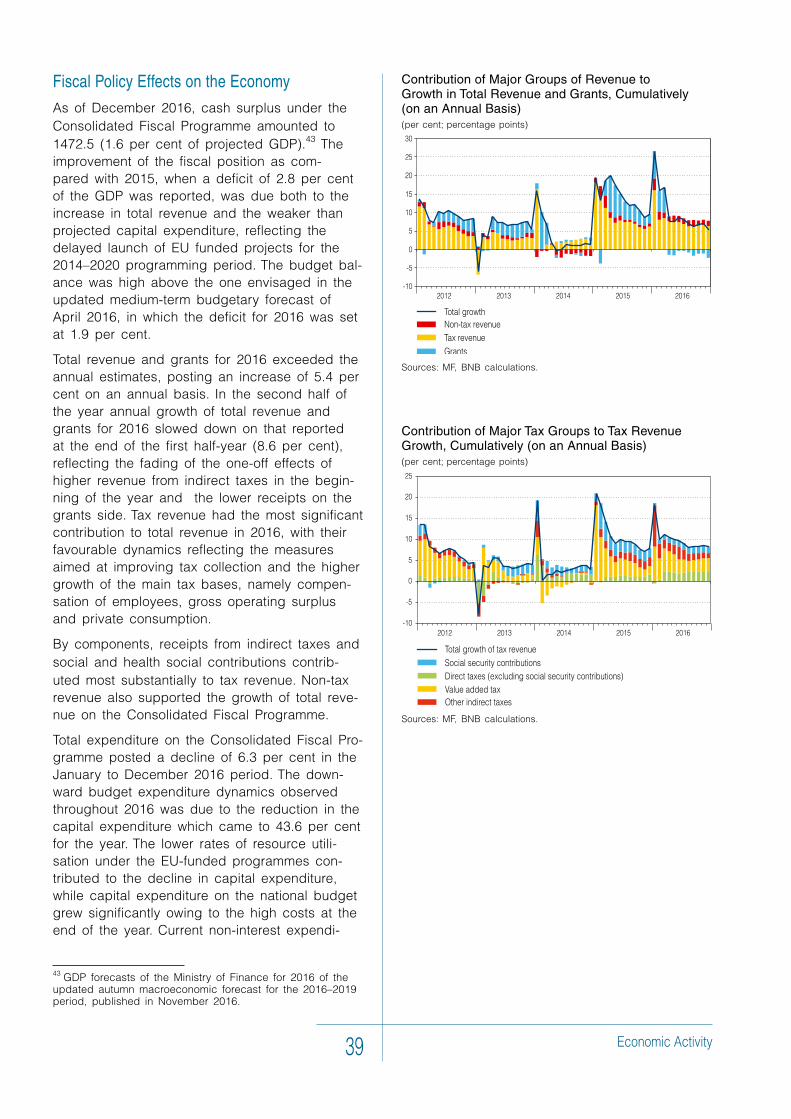
Еconomic Activity39
Fiscal Policy Effects on the Economy
As of December 2016, cash surplus under the Consolidated Fiscal Programme amounted to 1472.5 (1.6 per cent of projected GDP).43 The improvement of the fiscal position as com-pared with 2015, when a deficit of 2.8 per cent of the GDP was reported, was due both to the increase in total revenue and the weaker than projected capital expenditure, reflecting the delayed launch of EU funded projects for the 2014–2020 programming period. The budget bal-ance was high above the one envisaged in the updated medium-term budgetary forecast of April 2016, in which the deficit for 2016 was set at 1.9 per cent.
Total revenue and grants for 2016 exceeded the annual estimates, posting an increase of 5.4 per cent on an annual basis. In the second half of the year annual growth of total revenue and grants for 2016 slowed down on that reported at the end of the first half-year (8.6 per cent), reflecting the fading of the one-off effects of higher revenue from indirect taxes in the begin-ning of the year and the lower receipts on the grants side. Tax revenue had the most significant contribution to total revenue in 2016, with their favourable dynamics reflecting the measures aimed at improving tax collection and the higher growth of the main tax bases, namely compen-sation of employees, gross operating surplus and private consumption.
By components, receipts from indirect taxes and social and health social contributions contrib-uted most substantially to tax revenue. Non-tax revenue also supported the growth of total reve-nue on the Consolidated Fiscal Programme.
Total expenditure on the Consolidated Fiscal Pro-gramme posted a decline of 6.3 per cent in the January to December 2016 period. The down-ward budget expenditure dynamics observed throughout 2016 was due to the reduction in the capital expenditure which came to 43.6 per cent for the year. The lower rates of resource utili-sation under the EU-funded programmes con-tributed to the decline in capital expenditure, while capital expenditure on the national budget grew significantly owing to the high costs at the end of the year. Current non-interest expendi-
43 GDP forecasts of the Ministry of Finance for 2016 of the updated autumn macroeconomic forecast for the 2016–2019 period, published in November 2016.
Contribution of Major Groups of Revenue to Growth in Total Revenue and Grants, Cumulatively (on an Annual Basis)(per cent; percentage points)
Sources: MF, BNB calculations.
Contribution of Major Tax Groups to Tax Revenue Growth, Cumulatively (on an Annual Basis)(per cent; percentage points)
Sources: MF, BNB calculations.
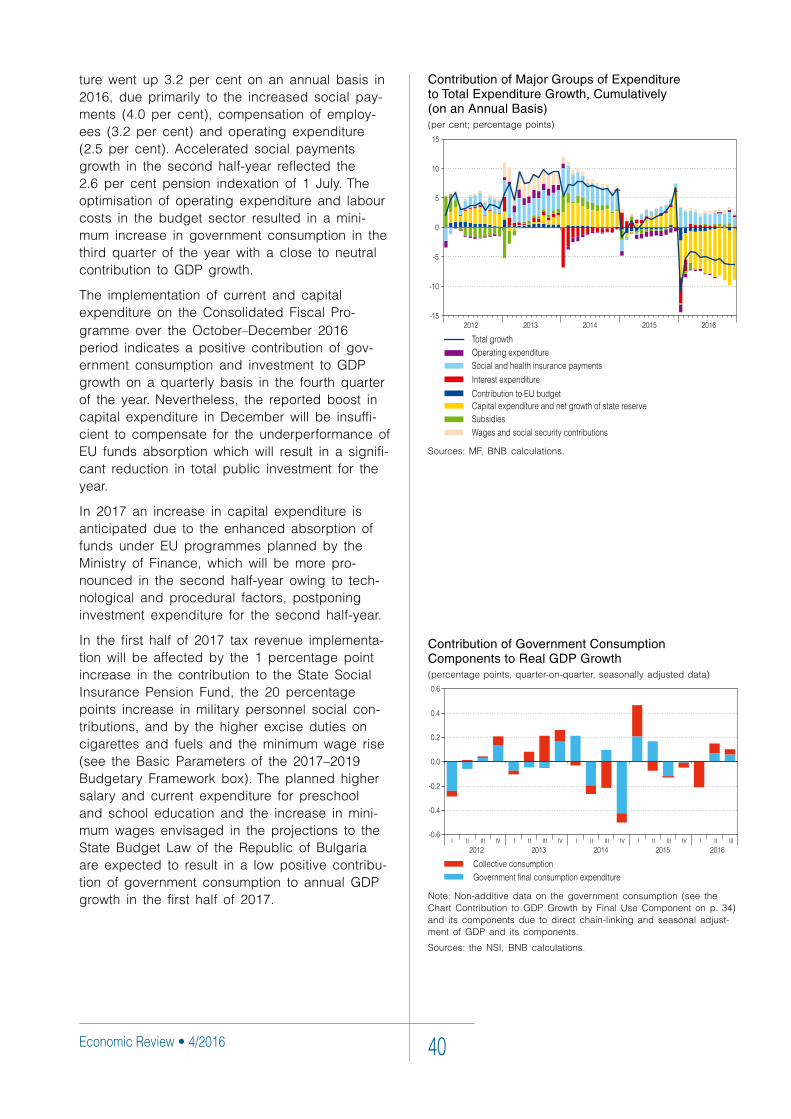
Economic Review • 4/2016 40
ture went up 3.2 per cent on an annual basis in 2016, due primarily to the increased social pay-ments (4.0 per cent), compensation of employ-ees (3.2 per cent) and operating expenditure (2.5 per cent). Accelerated social payments growth in the second half-year reflected the 2.6 per cent pension indexation of 1 July. The optimisation of operating expenditure and labour costs in the budget sector resulted in a mini-mum increase in government consumption in the third quarter of the year with a close to neutral contribution to GDP growth.
The implementation of current and capital expenditure on the Consolidated Fiscal Pro-gramme over the October–December 2016 period indicates a positive contribution of gov-ernment consumption and investment to GDP growth on a quarterly basis in the fourth quarter of the year. Nevertheless, the reported boost in capital expenditure in December will be insuffi-cient to compensate for the underperformance of EU funds absorption which will result in a signifi-cant reduction in total public investment for the year.
In 2017 an increase in capital expenditure is anticipated due to the enhanced absorption of funds under EU programmes planned by the Ministry of Finance, which will be more pro-nounced in the second half-year owing to tech-nological and procedural factors, postponing investment expenditure for the second half-year.
In the first half of 2017 tax revenue implementa-tion will be affected by the 1 percentage point increase in the contribution to the State Social Insurance Pension Fund, the 20 percentage points increase in military personnel social con-tributions, and by the higher excise duties on cigarettes and fuels and the minimum wage rise (see the Basic Parameters of the 2017–2019 Budgetary Framework box). The planned higher salary and current expenditure for preschool and school education and the increase in mini-mum wages envisaged in the projections to the State Budget Law of the Republic of Bulgaria are expected to result in a low positive contribu-tion of government consumption to annual GDP growth in the first half of 2017.
Contribution of Major Groups of Expenditure to Total Expenditure Growth, Cumulatively (on an Annual Basis)(per cent; percentage points)
Sources: MF, BNB calculations.
Contribution of Government Consumption Components to Real GDP Growth(percentage points, quarter-on-quarter, seasonally adjusted data)
Note: Non-additive data on the government consumption (see the Chart Contribution to GDP Growth by Final Use Component on p. 34) and its components due to direct chain-linking and seasonal adjust-ment of GDP and its components.
Sources: the NSI, BNB calculations.
Basic Parameters of the 2017–2019 Budgetary FrameworkAccording to the October 2016 update of the government’s medium-term budget forecast for the 2017–2019
period, which constitutes the motives to the draft Law on the State Budget of the Republic of Bulgaria for 2017, the cash deficit on the consolidated fiscal programme for 2017 is planned at BGN 1330 million (1.4 per cent of projected GDP). A fiscal consolidation process is foreseen for the next two years whereby the consolidated fiscal programme cash deficit is to decrease to BGN 1 billion (1.0 per cent of projected GDP) in 2018 and to BGN 540.0 million (0.5 per cent of projected GDP) in 2019. The updated medium-term budget forecast for 2017–2019 includes for the first time a projection of the budget indicators of the general government sector made following the ESA 2010 meth-odology. The ESA 2010 budget balance of the general government sector is planned to improve from -0.7 per cent of GDP in 2017 to +0.1 per cent of GDP in 2019. The budget programme for 2017 and the fiscal consolidation in 2018 and 2019 envisaged in the medium-term budget forecast are in line with the requirements of the Growth and Stability Pact and national legislation.
A more significant increase in consolidated fiscal programme revenues for 2017 as compared to the expected as of October 2016 annual performance for 2016 is planned with respect to revenue from taxes and social contribu-tions and non-tax revenue: up 5.5 and 16.7 per cent respectively, while receipts from grants are expected to go up by 3.9 per cent. Higher pension contributions (up 1 percentage point), the minimum wage and minimum insurance income increases (from BGN 420 to BGN 460) and higher excise duty rates on cigarettes are the main contributors to the planned tax and social contributions revenue rise. The 20 percentage points rise in contributions to the Pension Fund for the persons under Article 69 of the Social Security Code1 and the increase in the share of insurance income
1 These are insured persons in the defence and security sector.
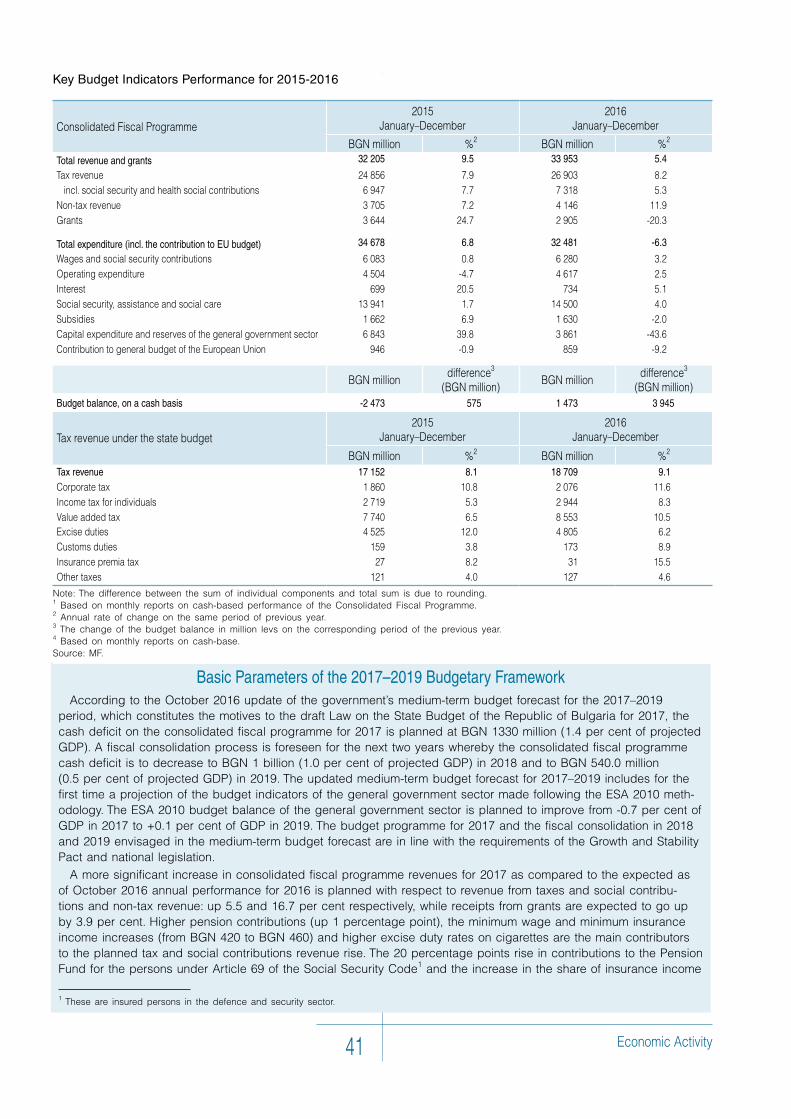
Еconomic Activity41
Basic Parameters of the 2017–2019 Budgetary FrameworkAccording to the October 2016 update of the government’s medium-term budget forecast for the 2017–2019
period, which constitutes the motives to the draft Law on the State Budget of the Republic of Bulgaria for 2017, the cash deficit on the consolidated fiscal programme for 2017 is planned at BGN 1330 million (1.4 per cent of projected GDP). A fiscal consolidation process is foreseen for the next two years whereby the consolidated fiscal programme cash deficit is to decrease to BGN 1 billion (1.0 per cent of projected GDP) in 2018 and to BGN 540.0 million (0.5 per cent of projected GDP) in 2019. The updated medium-term budget forecast for 2017–2019 includes for the first time a projection of the budget indicators of the general government sector made following the ESA 2010 meth-odology. The ESA 2010 budget balance of the general government sector is planned to improve from -0.7 per cent of GDP in 2017 to +0.1 per cent of GDP in 2019. The budget programme for 2017 and the fiscal consolidation in 2018 and 2019 envisaged in the medium-term budget forecast are in line with the requirements of the Growth and Stability Pact and national legislation.
A more significant increase in consolidated fiscal programme revenues for 2017 as compared to the expected as of October 2016 annual performance for 2016 is planned with respect to revenue from taxes and social contribu-tions and non-tax revenue: up 5.5 and 16.7 per cent respectively, while receipts from grants are expected to go up by 3.9 per cent. Higher pension contributions (up 1 percentage point), the minimum wage and minimum insurance income increases (from BGN 420 to BGN 460) and higher excise duty rates on cigarettes are the main contributors to the planned tax and social contributions revenue rise. The 20 percentage points rise in contributions to the Pension Fund for the persons under Article 69 of the Social Security Code1 and the increase in the share of insurance income
1 These are insured persons in the defence and security sector.
Key Budget Indicators Performance for 2015-2016
2015January–December
2016January–DecemberConsolidatedFiscalProgramme
BGNmillion %2 BGNmillion %2
Total revenue and grants 32 205 9.5 33 953 5.4
Taxrevenue 24856 7.9 26903 8.2
incl.socialsecurityandhealthsocialcontributions 6947 7.7 7318 5.3
Non-taxrevenue 3705 7.2 4146 11.9
Grants 3644 24.7 2905 -20.3
Total expenditure (incl. the contribution to EU budget) 34 678 6.8 32 481 -6.3
Wagesandsocialsecuritycontributions 6083 0.8 6280 3.2
Operatingexpenditure 4504 -4.7 4617 2.5
Interest 699 20.5 734 5.1
Socialsecurity,assistanceandsocialcare 13941 1.7 14500 4.0
Subsidies 1662 6.9 1630 -2.0
Capitalexpenditureandreservesofthegeneralgovernmentsector 6843 39.8 3861 -43.6
ContributiontogeneralbudgetoftheEuropeanUnion 946 -0.9 859 -9.2
BGNmilliondifference3
(BGNmillion)BGNmillion
difference3(BGNmillion)
Budget balance, on a cash basis -2 473 575 1 473 3 945
2015January–December
2016January–DecemberTaxrevenueunderthestatebudget
BGNmillion %2 BGNmillion %2
Tax revenue 17 152 8.1 18 709 9.1Corporatetax 1860 10.8 2076 11.6
Incometaxforindividuals 2719 5.3 2944 8.3
Valueaddedtax 7740 6.5 8553 10.5Exciseduties 4525 12.0 4805 6.2
Customsduties 159 3.8 173 8.9
Insurancepremiatax 27 8.2 31 15.5
Othertaxes 121 4.0 127 4.6
Note: The difference between the sum of individual components and total sum is due to rounding. 1 Based on monthly reports on cash-based performance of the Consolidated Fiscal Programme. 2 Annual rate of change on the same period of previous year.3 The change of the budget balance in million levs on the corresponding period of the previous year.4 Based on monthly reports on cash-base.Source: MF.
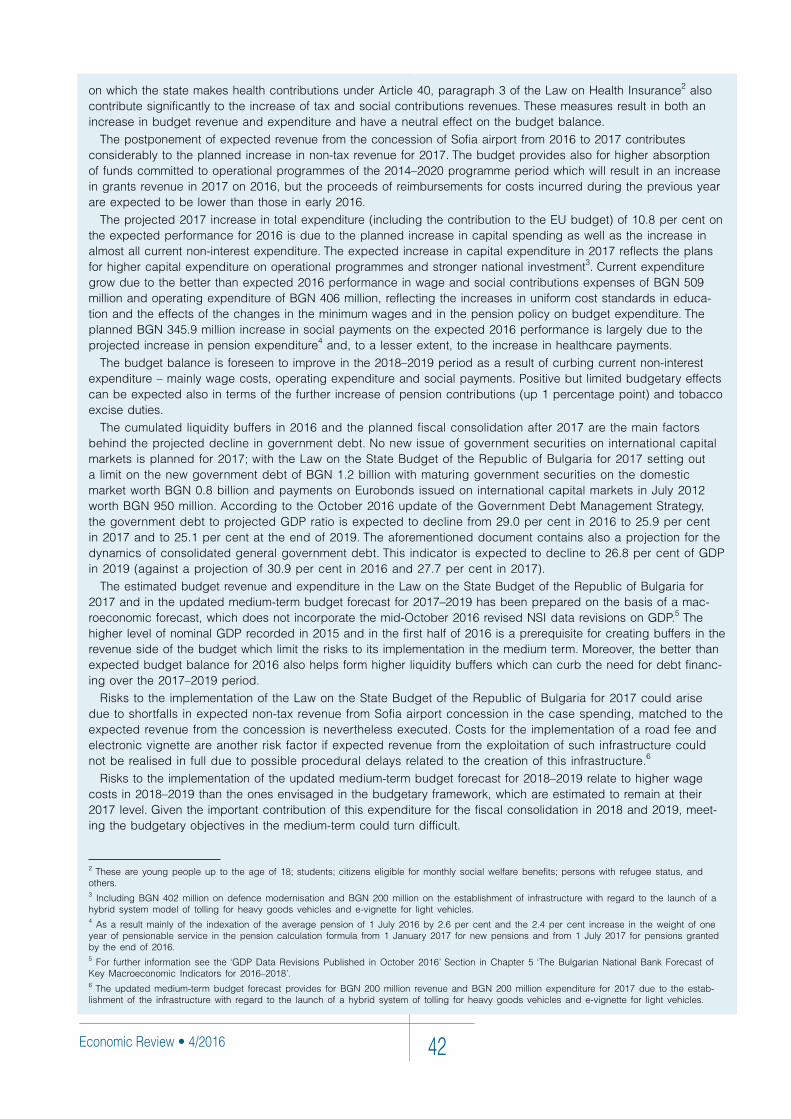
Economic Review • 4/2016 42
on which the state makes health contributions under Article 40, paragraph 3 of the Law on Health Insurance2 also contribute significantly to the increase of tax and social contributions revenues. These measures result in both an increase in budget revenue and expenditure and have a neutral effect on the budget balance.
The postponement of expected revenue from the concession of Sofia airport from 2016 to 2017 contributes considerably to the planned increase in non-tax revenue for 2017. The budget provides also for higher absorption of funds committed to operational programmes of the 2014–2020 programme period which will result in an increase in grants revenue in 2017 on 2016, but the proceeds of reimbursements for costs incurred during the previous year are expected to be lower than those in early 2016.
The projected 2017 increase in total expenditure (including the contribution to the EU budget) of 10.8 per cent on the expected performance for 2016 is due to the planned increase in capital spending as well as the increase in almost all current non-interest expenditure. The expected increase in capital expenditure in 2017 reflects the plans for higher capital expenditure on operational programmes and stronger national investment3. Current expenditure grow due to the better than expected 2016 performance in wage and social contributions expenses of BGN 509 million and operating expenditure of BGN 406 million, reflecting the increases in uniform cost standards in educa-tion and the effects of the changes in the minimum wages and in the pension policy on budget expenditure. The planned BGN 345.9 million increase in social payments on the expected 2016 performance is largely due to the projected increase in pension expenditure4 and, to a lesser extent, to the increase in healthcare payments.
The budget balance is foreseen to improve in the 2018–2019 period as a result of curbing current non-interest expenditure – mainly wage costs, operating expenditure and social payments. Positive but limited budgetary effects can be expected also in terms of the further increase of pension contributions (up 1 percentage point) and tobacco excise duties.
The cumulated liquidity buffers in 2016 and the planned fiscal consolidation after 2017 are the main factors behind the projected decline in government debt. No new issue of government securities on international capital markets is planned for 2017; with the Law on the State Budget of the Republic of Bulgaria for 2017 setting out a limit on the new government debt of BGN 1.2 billion with maturing government securities on the domestic market worth BGN 0.8 billion and payments on Eurobonds issued on international capital markets in July 2012 worth BGN 950 million. According to the October 2016 update of the Government Debt Management Strategy, the government debt to projected GDP ratio is expected to decline from 29.0 per cent in 2016 to 25.9 per cent in 2017 and to 25.1 per cent at the end of 2019. The aforementioned document contains also a projection for the dynamics of consolidated general government debt. This indicator is expected to decline to 26.8 per cent of GDP in 2019 (against a projection of 30.9 per cent in 2016 and 27.7 per cent in 2017).
The estimated budget revenue and expenditure in the Law on the State Budget of the Republic of Bulgaria for 2017 and in the updated medium-term budget forecast for 2017–2019 has been prepared on the basis of a mac-roeconomic forecast, which does not incorporate the mid-October 2016 revised NSI data revisions on GDP.5 The higher level of nominal GDP recorded in 2015 and in the first half of 2016 is a prerequisite for creating buffers in the revenue side of the budget which limit the risks to its implementation in the medium term. Moreover, the better than expected budget balance for 2016 also helps form higher liquidity buffers which can curb the need for debt financ-ing over the 2017–2019 period.
Risks to the implementation of the Law on the State Budget of the Republic of Bulgaria for 2017 could arise due to shortfalls in expected non-tax revenue from Sofia airport concession in the case spending, matched to the expected revenue from the concession is nevertheless executed. Costs for the implementation of a road fee and electronic vignette are another risk factor if expected revenue from the exploitation of such infrastructure could not be realised in full due to possible procedural delays related to the creation of this infrastructure.6
Risks to the implementation of the updated medium-term budget forecast for 2018–2019 relate to higher wage costs in 2018–2019 than the ones envisaged in the budgetary framework, which are estimated to remain at their 2017 level. Given the important contribution of this expenditure for the fiscal consolidation in 2018 and 2019, meet-ing the budgetary objectives in the medium-term could turn difficult.
2 These are young people up to the age of 18; students; citizens eligible for monthly social welfare benefits; persons with refugee status, and others.3 Including BGN 402 million on defence modernisation and BGN 200 million on the establishment of infrastructure with regard to the launch of a hybrid system model of tolling for heavy goods vehicles and e-vignette for light vehicles. 4 As a result mainly of the indexation of the average pension of 1 July 2016 by 2.6 per cent and the 2.4 per cent increase in the weight of one year of pensionable service in the pension calculation formula from 1 January 2017 for new pensions and from 1 July 2017 for pensions granted by the end of 2016.5 For further information see the ‘GDP Data Revisions Published in October 2016’ Section in Chapter 5 ‘The Bulgarian National Bank Forecast of Key Macroeconomic Indicators for 2016–2018’.6 The updated medium-term budget forecast provides for BGN 200 million revenue and BGN 200 million expenditure for 2017 due to the estab-lishment of the infrastructure with regard to the launch of a hybrid system of tolling for heavy goods vehicles and e-vignette for light vehicles.
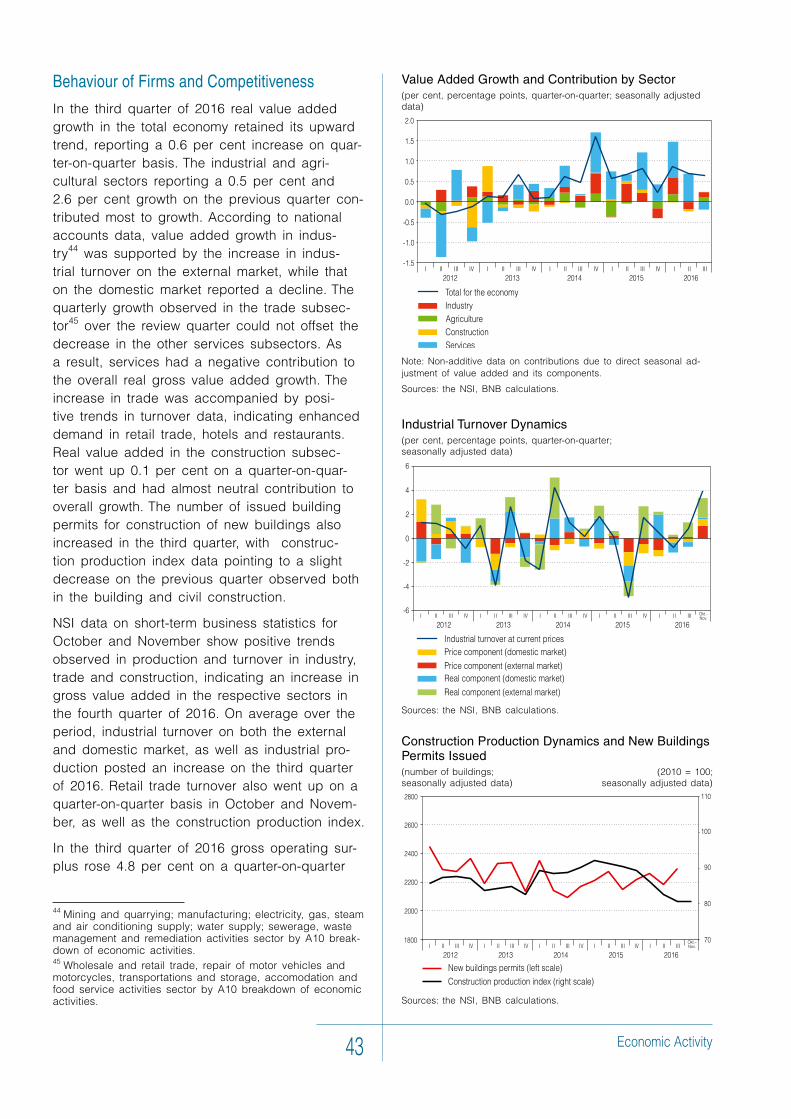
Еconomic Activity43
Value Added Growth and Contribution by Sector (per cent, percentage points, quarter-on-quarter; seasonally adjusted data)
Note: Non-additive data on contributions due to direct seasonal ad-justment of value added and its components.
Sources: the NSI, BNB calculations.
Industrial Turnover Dynamics(per cent, percentage points, quarter-on-quarter; seasonally adjusted data)
Sources: the NSI, BNB calculations.
Behaviour of Firms and Competitiveness
In the third quarter of 2016 real value added growth in the total economy retained its upward trend, reporting a 0.6 per cent increase on quar-ter-on-quarter basis. The industrial and agri-cultural sectors reporting a 0.5 per cent and 2.6 per cent growth on the previous quarter con-tributed most to growth. According to national accounts data, value added growth in indus-try44 was supported by the increase in indus-trial turnover on the external market, while that on the domestic market reported a decline. The quarterly growth observed in the trade subsec-tor45 over the review quarter could not offset the decrease in the other services subsectors. As a result, services had a negative contribution to the overall real gross value added growth. The increase in trade was accompanied by posi-tive trends in turnover data, indicating enhanced demand in retail trade, hotels and restaurants. Real value added in the construction subsec-tor went up 0.1 per cent on a quarter-on-quar-ter basis and had almost neutral contribution to overall growth. The number of issued building permits for construction of new buildings also increased in the third quarter, with construc-tion production index data pointing to a slight decrease on the previous quarter observed both in the building and civil construction.
NSI data on short-term business statistics for October and November show positive trends observed in production and turnover in industry, trade and construction, indicating an increase in gross value added in the respective sectors in the fourth quarter of 2016. On average over the period, industrial turnover on both the external and domestic market, as well as industrial pro-duction posted an increase on the third quarter of 2016. Retail trade turnover also went up on a quarter-on-quarter basis in October and Novem-ber, as well as the construction production index.
In the third quarter of 2016 gross operating sur-plus rose 4.8 per cent on a quarter-on-quarter
44 Mining and quarrying; manufacturing; electricity, gas, steam and air conditioning supply; water supply; sewerage, waste management and remediation activities sector by A10 break-down of economic activities.45 Wholesale and retail trade, repair of motor vehicles and motorcycles, transportations and storage, accomodation and food service activities sector by A10 breakdown of economic activities.
Construction Production Dynamics and New Buildings Permits Issued (number of buildings; (2010 = 100; seasonally adjusted data) seasonally adjusted data)
Sources: the NSI, BNB calculations.
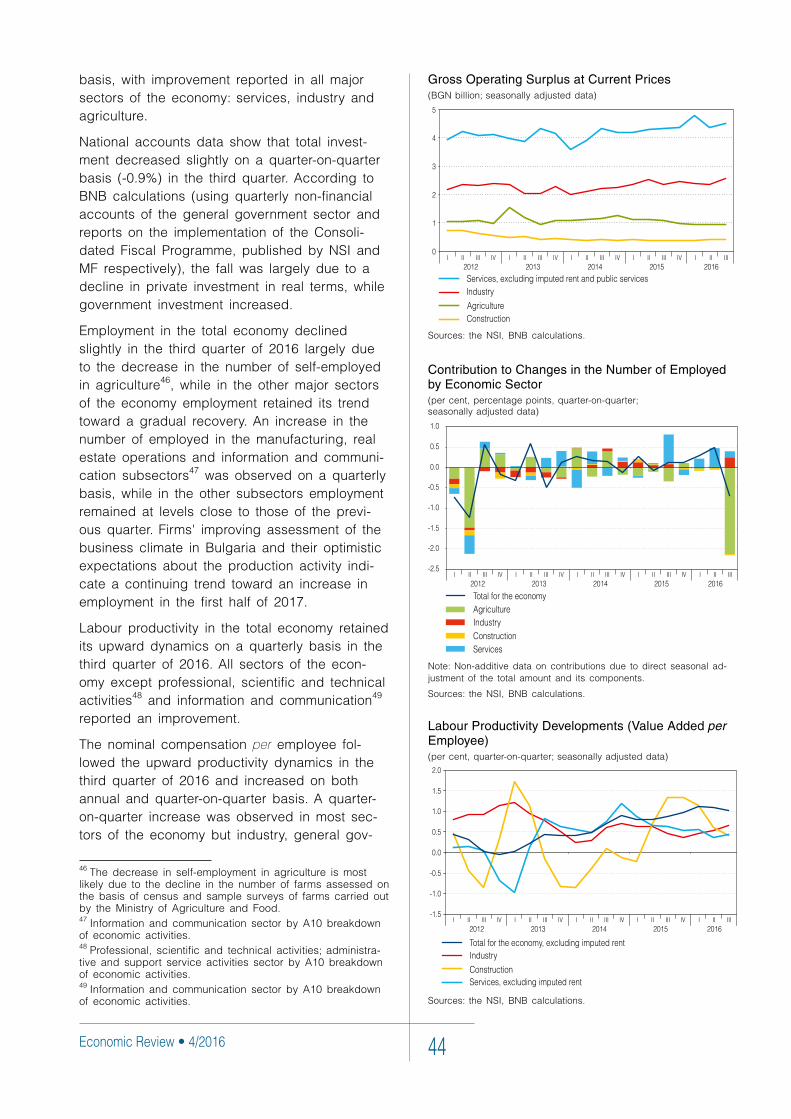
Economic Review • 4/2016 44
basis, with improvement reported in all major sectors of the economy: services, industry and agriculture.
National accounts data show that total invest-ment decreased slightly on a quarter-on-quarter basis (-0.9%) in the third quarter. According to BNB calculations (using quarterly non-financial accounts of the general government sector and reports on the implementation of the Consoli-dated Fiscal Programme, published by NSI and MF respectively), the fall was largely due to a decline in private investment in real terms, while government investment increased.
Employment in the total economy declined slightly in the third quarter of 2016 largely due to the decrease in the number of self-employed in agriculture46, while in the other major sectors of the economy employment retained its trend toward a gradual recovery. An increase in the number of employed in the manufacturing, real estate operations and information and communi-cation subsectors47 was observed on a quarterly basis, while in the other subsectors employment remained at levels close to those of the previ-ous quarter. Firms' improving assessment of the business climate in Bulgaria and their optimistic expectations about the production activity indi-cate a continuing trend toward an increase in employment in the first half of 2017.
Labour productivity in the total economy retained its upward dynamics on a quarterly basis in the third quarter of 2016. All sectors of the econ-omy except professional, scientific and technical activities48 and information and communication49 reported an improvement.
The nominal compensation per employee fol-lowed the upward productivity dynamics in the third quarter of 2016 and increased on both annual and quarter-on-quarter basis. A quarter-on-quarter increase was observed in most sec-tors of the economy but industry, general gov-
46 The decrease in self-employment in agriculture is most likely due to the decline in the number of farms assessed on the basis of census and sample surveys of farms carried out by the Ministry of Agriculture and Food.47 Information and communication sector by A10 breakdown of economic activities.48 Professional, scientific and technical activities; administra-tive and support service activities sector by A10 breakdown of economic activities.49 Information and communication sector by A10 breakdown of economic activities.
Gross Operating Surplus at Current Prices(BGN billion; seasonally adjusted data)
Sources: the NSI, BNB calculations.
Contribution to Changes in the Number of Employed by Economic Sector(per cent, percentage points, quarter-on-quarter; seasonally adjusted data)
Note: Non-additive data on contributions due to direct seasonal ad-justment of the total amount and its components.
Sources: the NSI, BNB calculations.
Labour Productivity Developments (Value Added per Employee)(per cent, quarter-on-quarter; seasonally adjusted data)
Sources: the NSI, BNB calculations.
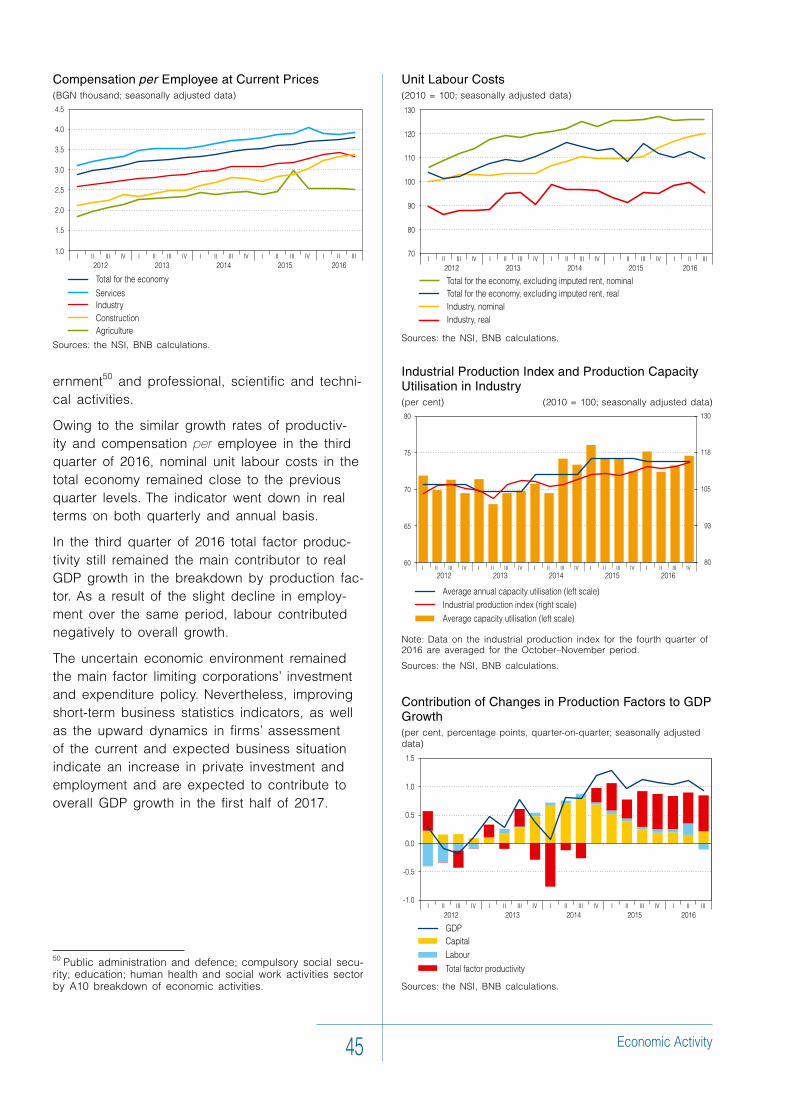
Еconomic Activity45
Compensation per Employee at Current Prices (BGN thousand; seasonally adjusted data)
Sources: the NSI, BNB calculations.
Unit Labour Costs(2010 = 100; seasonally adjusted data)
Sources: the NSI, BNB calculations.
ernment50 and professional, scientific and techni-cal activities.
Owing to the similar growth rates of productiv-ity and compensation per employee in the third quarter of 2016, nominal unit labour costs in the total economy remained close to the previous quarter levels. The indicator went down in real terms on both quarterly and annual basis.
In the third quarter of 2016 total factor produc-tivity still remained the main contributor to real GDP growth in the breakdown by production fac-tor. As a result of the slight decline in employ-ment over the same period, labour contributed negatively to overall growth.
The uncertain economic environment remained the main factor limiting corporations’ investment and expenditure policy. Nevertheless, improving short-term business statistics indicators, as well as the upward dynamics in firms’ assessment of the current and expected business situation indicate an increase in private investment and employment and are expected to contribute to overall GDP growth in the first half of 2017.
50 Public administration and defence; compulsory social secu-rity; education; human health and social work activities sector by A10 breakdown of economic activities.
Contribution of Changes in Production Factors to GDP Growth (per cent, percentage points, quarter-on-quarter; seasonally adjusted data)
Sources: the NSI, BNB calculations.
Industrial Production Index and Production Capacity Utilisation in Industry (per cent) (2010 = 100; seasonally adjusted data)
Note: Data on the industrial production index for the fourth quarter of 2016 are averaged for the October–November period.
Sources: the NSI, BNB calculations.
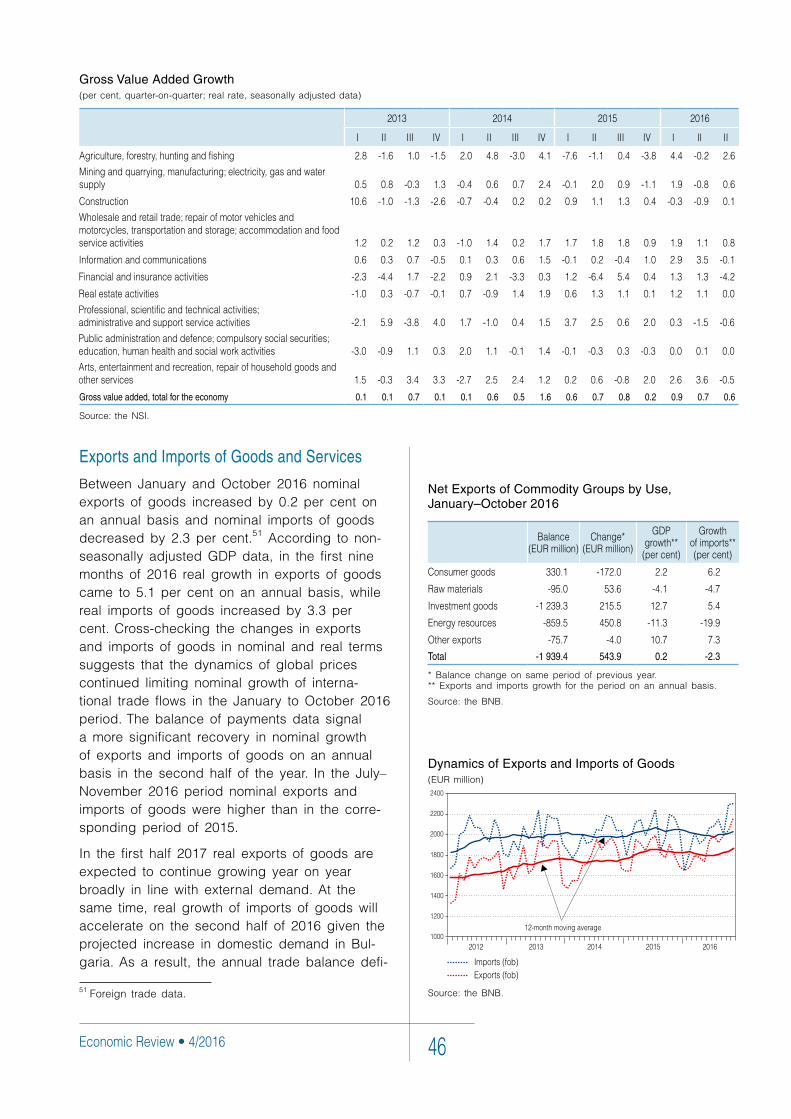
Economic Review • 4/2016 46
Gross Value Added Growth(per cent, quarter-on-quarter; real rate, seasonally adjusted data)
2013 2014 2015 2016
I II III IV I II III IV I II III IV I II II
Agriculture,forestry,huntingandfishing 2.8 -1.6 1.0 -1.5 2.0 4.8 -3.0 4.1 -7.6 -1.1 0.4 -3.8 4.4 -0.2 2.6
Miningandquarrying,manufacturing;electricity,gasandwatersupply 0.5 0.8 -0.3 1.3 -0.4 0.6 0.7 2.4 -0.1 2.0 0.9 -1.1 1.9 -0.8 0.6
Construction 10.6 -1.0 -1.3 -2.6 -0.7 -0.4 0.2 0.2 0.9 1.1 1.3 0.4 -0.3 -0.9 0.1
Wholesaleandretailtrade;repairofmotorvehiclesandmotorcycles,transportationandstorage;accommodationandfoodserviceactivities 1.2 0.2 1.2 0.3 -1.0 1.4 0.2 1.7 1.7 1.8 1.8 0.9 1.9 1.1 0.8
Informationandcommunications 0.6 0.3 0.7 -0.5 0.1 0.3 0.6 1.5 -0.1 0.2 -0.4 1.0 2.9 3.5 -0.1
Financialandinsuranceactivities -2.3 -4.4 1.7 -2.2 0.9 2.1 -3.3 0.3 1.2 -6.4 5.4 0.4 1.3 1.3 -4.2
Realestateactivities -1.0 0.3 -0.7 -0.1 0.7 -0.9 1.4 1.9 0.6 1.3 1.1 0.1 1.2 1.1 0.0
Professional,scientificandtechnicalactivities;administrativeandsupportserviceactivities -2.1 5.9 -3.8 4.0 1.7 -1.0 0.4 1.5 3.7 2.5 0.6 2.0 0.3 -1.5 -0.6
Publicadministrationanddefence;compulsorysocialsecurities;education,humanhealthandsocialworkactivities -3.0 -0.9 1.1 0.3 2.0 1.1 -0.1 1.4 -0.1 -0.3 0.3 -0.3 0.0 0.1 0.0
Arts,entertainmentandrecreation,repairofhouseholdgoodsandotherservices 1.5 -0.3 3.4 3.3 -2.7 2.5 2.4 1.2 0.2 0.6 -0.8 2.0 2.6 3.6 -0.5
Gross value added, total for the economy 0.1 0.1 0.7 0.1 0.1 0.6 0.5 1.6 0.6 0.7 0.8 0.2 0.9 0.7 0.6
Source: the NSI.
Exports and Imports of Goods and Services
Between January and October 2016 nominal exports of goods increased by 0.2 per cent on an annual basis and nominal imports of goods decreased by 2.3 per cent.51 According to non-seasonally adjusted GDP data, in the first nine months of 2016 real growth in exports of goods came to 5.1 per cent on an annual basis, while real imports of goods increased by 3.3 per cent. Cross-checking the changes in exports and imports of goods in nominal and real terms suggests that the dynamics of global prices continued limiting nominal growth of interna-tional trade flows in the January to October 2016 period. The balance of payments data signal a more significant recovery in nominal growth of exports and imports of goods on an annual basis in the second half of the year. In the July–November 2016 period nominal exports and imports of goods were higher than in the corre-sponding period of 2015.
In the first half 2017 real exports of goods are expected to continue growing year on year broadly in line with external demand. At the same time, real growth of imports of goods will accelerate on the second half of 2016 given the projected increase in domestic demand in Bul-garia. As a result, the annual trade balance defi-
51 Foreign trade data.
Net Exports of Commodity Groups by Use, January–October 2016
Balance(EURmillion)
Change*(EURmillion)
GDPgrowth**
(percent)
Growthofimports**(percent)
Consumergoods 330.1 -172.0 2.2 6.2
Rawmaterials -95.0 53.6 -4.1 -4.7
Investmentgoods -1239.3 215.5 12.7 5.4
Energyresources -859.5 450.8 -11.3 -19.9
Otherexports -75.7 -4.0 10.7 7.3
Total -1 939.4 543.9 0.2 -2.3
* Balance change on same period of previous year. ** Exports and imports growth for the period on an annual basis.
Source: the BNB.
Dynamics of Exports and Imports of Goods(EUR million)
Source: the BNB.
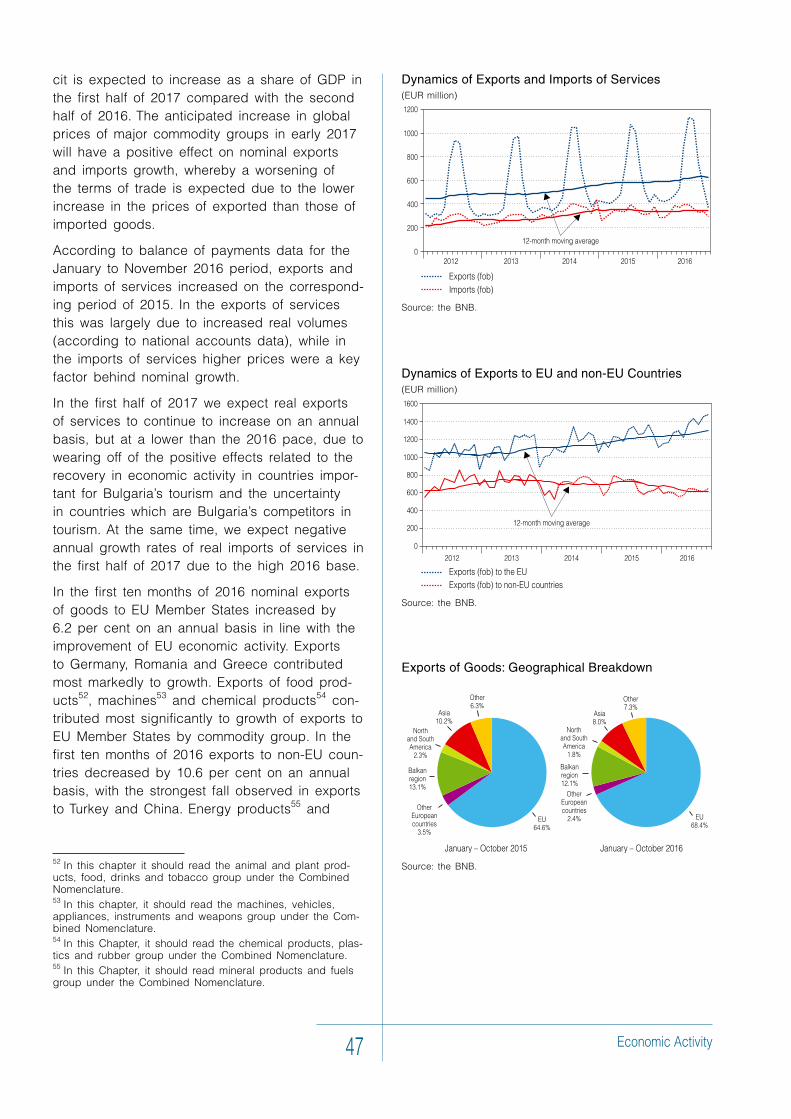
Еconomic Activity47
cit is expected to increase as a share of GDP in the first half of 2017 compared with the second half of 2016. The anticipated increase in global prices of major commodity groups in early 2017 will have a positive effect on nominal exports and imports growth, whereby a worsening of the terms of trade is expected due to the lower increase in the prices of exported than those of imported goods.
According to balance of payments data for the January to November 2016 period, exports and imports of services increased on the correspond-ing period of 2015. In the exports of services this was largely due to increased real volumes (according to national accounts data), while in the imports of services higher prices were a key factor behind nominal growth.
In the first half of 2017 we expect real exports of services to continue to increase on an annual basis, but at a lower than the 2016 pace, due to wearing off of the positive effects related to the recovery in economic activity in countries impor-tant for Bulgaria’s tourism and the uncertainty in countries which are Bulgaria’s competitors in tourism. At the same time, we expect negative annual growth rates of real imports of services in the first half of 2017 due to the high 2016 base.
In the first ten months of 2016 nominal exports of goods to EU Member States increased by 6.2 per cent on an annual basis in line with the improvement of EU economic activity. Exports to Germany, Romania and Greece contributed most markedly to growth. Exports of food prod-ucts52, machines53 and chemical products54 con-tributed most significantly to growth of exports to EU Member States by commodity group. In the first ten months of 2016 exports to non-EU coun-tries decreased by 10.6 per cent on an annual basis, with the strongest fall observed in exports to Turkey and China. Energy products55 and
52 In this chapter it should read the animal and plant prod-ucts, food, drinks and tobacco group under the Combined Nomenclature.53 In this chapter, it should read the machines, vehicles, appliances, instruments and weapons group under the Com-bined Nomenclature.54 In this Chapter, it should read the chemical products, plas-tics and rubber group under the Combined Nomenclature.55 In this Chapter, it should read mineral products and fuels group under the Combined Nomenclature.
Dynamics of Exports to EU and non-EU Countries(EUR million)
Source: the BNB.
Exports of Goods: Geographical Breakdown
Source: the BNB.
Dynamics of Exports and Imports of Services(EUR million)
Source: the BNB.
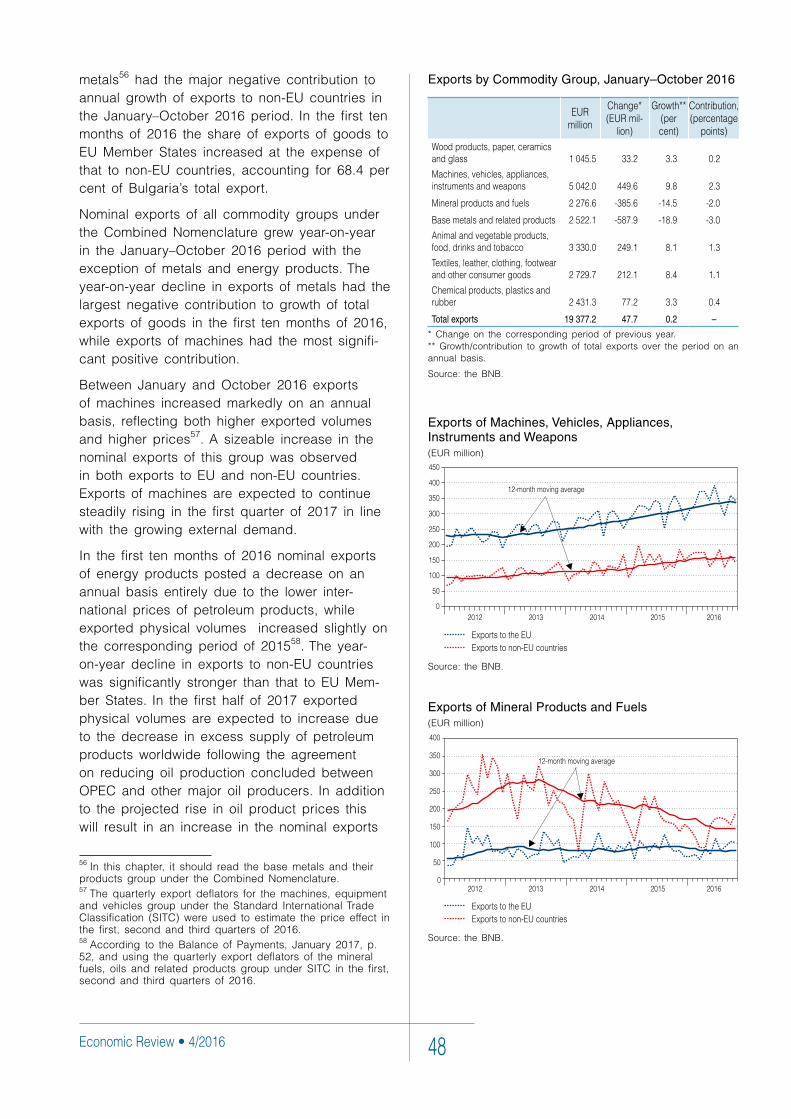
Economic Review • 4/2016 48
Exports by Commodity Group, January–October 2016
EURmillion
Change*(EURmil-
lion)
Growth**(percent)
Contribution,(percentage
points)
Woodproducts,paper,ceramicsandglass 1045.5 33.2 3.3 0.2
Machines,vehicles,appliances,instrumentsandweapons 5042.0 449.6 9.8 2.3
Mineralproductsandfuels 2276.6 -385.6 -14.5 -2.0
Basemetalsandrelatedproducts 2522.1 -587.9 -18.9 -3.0
Animalandvegetableproducts,food,drinksandtobacco 3330.0 249.1 8.1 1.3
Textiles,leather,clothing,footwearandotherconsumergoods 2729.7 212.1 8.4 1.1
Chemicalproducts,plasticsandrubber 2431.3 77.2 3.3 0.4
Total exports 19 377.2 47.7 0.2 –
* Change on the corresponding period of previous year. ** Growth/contribution to growth of total exports over the period on an annual basis.
Source: the BNB.
Exports of Machines, Vehicles, Appliances, Instruments and Weapons(EUR million)
Source: the BNB.
Exports of Mineral Products and Fuels (EUR million)
Source: the BNB.
metals56 had the major negative contribution to annual growth of exports to non-EU countries in the January–October 2016 period. In the first ten months of 2016 the share of exports of goods to EU Member States increased at the expense of that to non-EU countries, accounting for 68.4 per cent of Bulgaria’s total export.
Nominal exports of all commodity groups under the Combined Nomenclature grew year-on-year in the January–October 2016 period with the exception of metals and energy products. The year-on-year decline in exports of metals had the largest negative contribution to growth of total exports of goods in the first ten months of 2016, while exports of machines had the most signifi-cant positive contribution.
Between January and October 2016 exports of machines increased markedly on an annual basis, reflecting both higher exported volumes and higher prices57. A sizeable increase in the nominal exports of this group was observed in both exports to EU and non-EU countries. Exports of machines are expected to continue steadily rising in the first quarter of 2017 in line with the growing external demand.
In the first ten months of 2016 nominal exports of energy products posted a decrease on an annual basis entirely due to the lower inter-national prices of petroleum products, while exported physical volumes increased slightly on the corresponding period of 201558. The year-on-year decline in exports to non-EU countries was significantly stronger than that to EU Mem-ber States. In the first half of 2017 exported physical volumes are expected to increase due to the decrease in excess supply of petroleum products worldwide following the agreement on reducing oil production concluded between OPEC and other major oil producers. In addition to the projected rise in oil product prices this will result in an increase in the nominal exports
56 In this chapter, it should read the base metals and their products group under the Combined Nomenclature.57 The quarterly export deflators for the machines, equipment and vehicles group under the Standard International Trade Classification (SITC) were used to estimate the price effect in the first, second and third quarters of 2016.58 According to the Balance of Payments, January 2017, p. 52, and using the quarterly export deflators of the mineral fuels, oils and related products group under SITC in the first, second and third quarters of 2016.
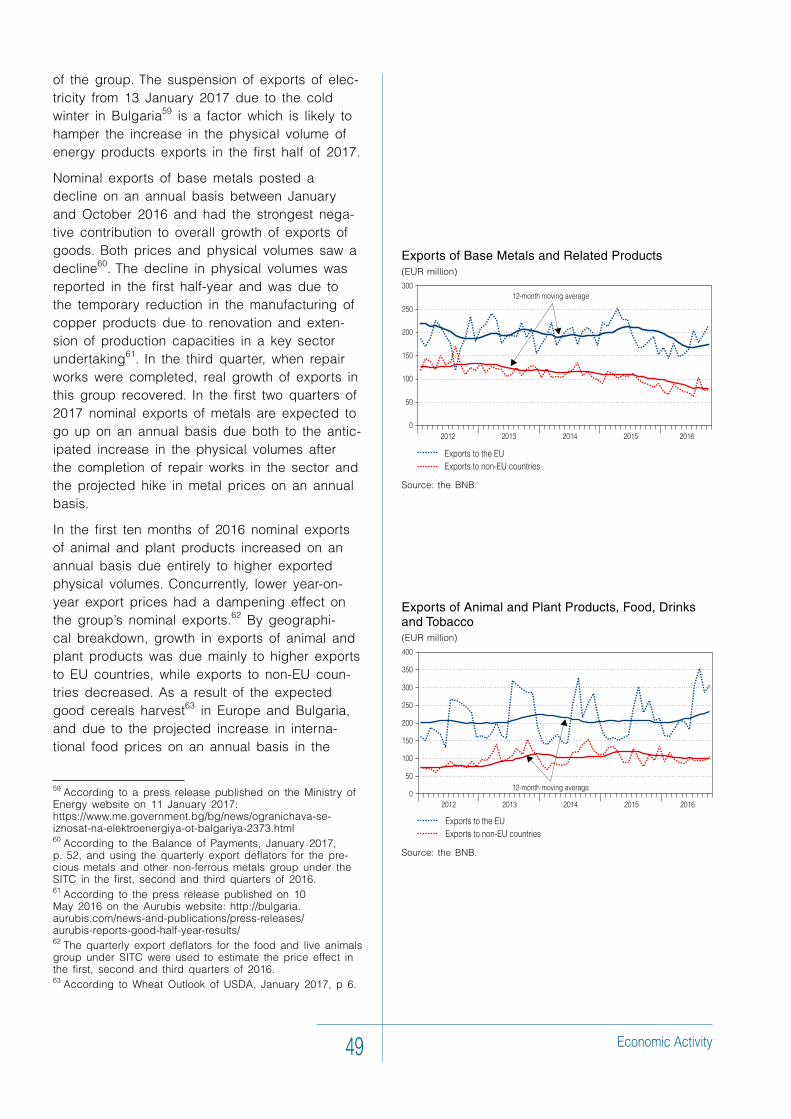
Еconomic Activity49
of the group. The suspension of exports of elec-tricity from 13 January 2017 due to the cold winter in Bulgaria59 is a factor which is likely to hamper the increase in the physical volume of energy products exports in the first half of 2017.
Nominal exports of base metals posted a decline on an annual basis between January and October 2016 and had the strongest nega-tive contribution to overall growth of exports of goods. Both prices and physical volumes saw a decline60. The decline in physical volumes was reported in the first half-year and was due to the temporary reduction in the manufacturing of copper products due to renovation and exten-sion of production capacities in a key sector undertaking61. In the third quarter, when repair works were completed, real growth of exports in this group recovered. In the first two quarters of 2017 nominal exports of metals are expected to go up on an annual basis due both to the antic-ipated increase in the physical volumes after the completion of repair works in the sector and the projected hike in metal prices on an annual basis.
In the first ten months of 2016 nominal exports of animal and plant products increased on an annual basis due entirely to higher exported physical volumes. Concurrently, lower year-on-year export prices had a dampening effect on the group’s nominal exports.62 By geographi-cal breakdown, growth in exports of animal and plant products was due mainly to higher exports to EU countries, while exports to non-EU coun-tries decreased. As a result of the expected good cereals harvest63 in Europe and Bulgaria, and due to the projected increase in interna-tional food prices on an annual basis in the
59 According to a press release published on the Ministry of Energy website on 11 January 2017: https://www.me.government.bg/bg/news/ogranichava-se-iznosat-na-elektroenergiya-ot-balgariya-2373.html60 According to the Balance of Payments, January 2017, p. 52, and using the quarterly export deflators for the pre-cious metals and other non-ferrous metals group under the SITC in the first, second and third quarters of 2016.61 According to the press release published on 10 May 2016 on the Aurubis website: http://bulgaria.aurubis.com/news-and-publications/press-releases/aurubis-reports-good-half-year-results/62 The quarterly export deflators for the food and live animals group under SITC were used to estimate the price effect in the first, second and third quarters of 2016.63 According to Wheat Outlook of USDA, January 2017, p 6.
Exports of Animal and Plant Products, Food, Drinks and Tobacco(EUR million)
Source: the BNB.
Exports of Base Metals and Related Products(EUR million)
Source: the BNB.
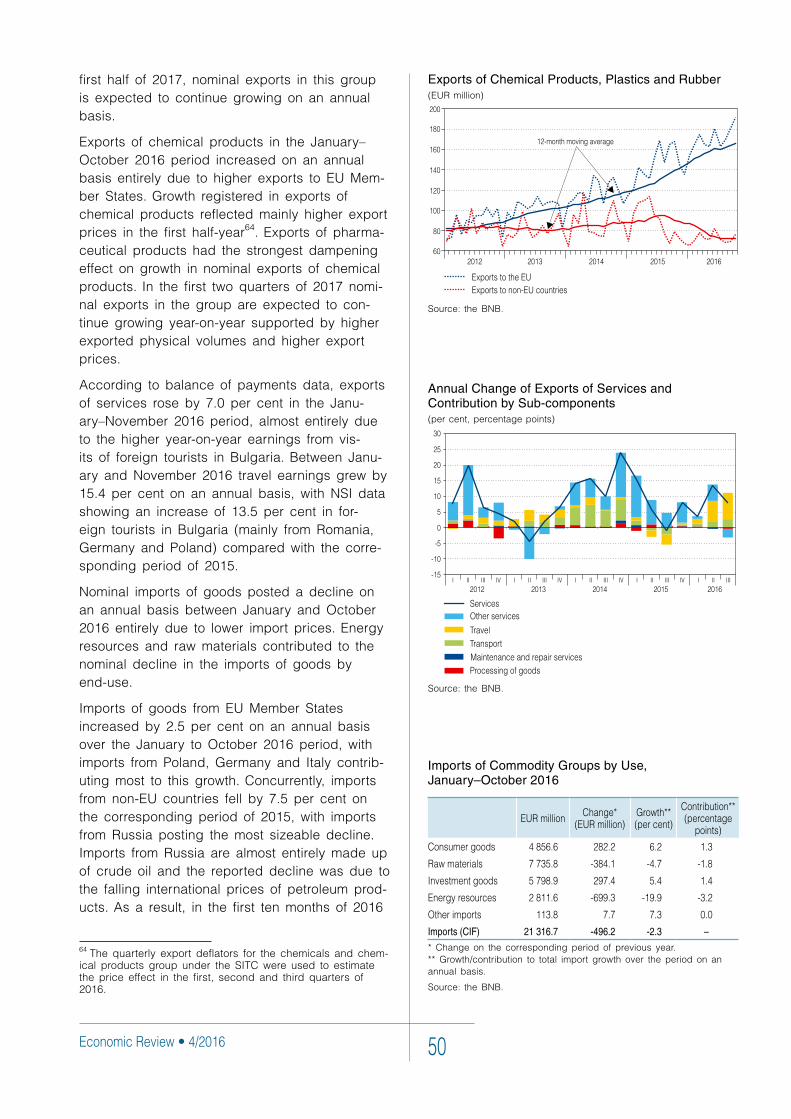
Economic Review • 4/2016 50
Exports of Chemical Products, Plastics and Rubber (EUR million)
Source: the BNB.
Annual Change of Exports of Services and Contribution by Sub-components (per cent, percentage points)
Source: the BNB.
Imports of Commodity Groups by Use, January–October 2016
EURmillion Change*(EURmillion)
Growth**(percent)
Contribution**(percentage
points)
Consumergoods 4856.6 282.2 6.2 1.3
Rawmaterials 7735.8 -384.1 -4.7 -1.8
Investmentgoods 5798.9 297.4 5.4 1.4
Energyresources 2811.6 -699.3 -19.9 -3.2
Otherimports 113.8 7.7 7.3 0.0
Imports (CIF) 21 316.7 -496.2 -2.3 –
* Change on the corresponding period of previous year. ** Growth/contribution to total import growth over the period on an annual basis.
Source: the BNB.
first half of 2017, nominal exports in this group is expected to continue growing on an annual basis.
Exports of chemical products in the January–October 2016 period increased on an annual basis entirely due to higher exports to EU Mem-ber States. Growth registered in exports of chemical products reflected mainly higher export prices in the first half-year64. Exports of pharma-ceutical products had the strongest dampening effect on growth in nominal exports of chemical products. In the first two quarters of 2017 nomi-nal exports in the group are expected to con-tinue growing year-on-year supported by higher exported physical volumes and higher export prices.
According to balance of payments data, exports of services rose by 7.0 per cent in the Janu-ary–November 2016 period, almost entirely due to the higher year-on-year earnings from vis-its of foreign tourists in Bulgaria. Between Janu-ary and November 2016 travel earnings grew by 15.4 per cent on an annual basis, with NSI data showing an increase of 13.5 per cent in for-eign tourists in Bulgaria (mainly from Romania, Germany and Poland) compared with the corre-sponding period of 2015.
Nominal imports of goods posted a decline on an annual basis between January and October 2016 entirely due to lower import prices. Energy resources and raw materials contributed to the nominal decline in the imports of goods by end-use.
Imports of goods from EU Member States increased by 2.5 per cent on an annual basis over the January to October 2016 period, with imports from Poland, Germany and Italy contrib-uting most to this growth. Concurrently, imports from non-EU countries fell by 7.5 per cent on the corresponding period of 2015, with imports from Russia posting the most sizeable decline. Imports from Russia are almost entirely made up of crude oil and the reported decline was due to the falling international prices of petroleum prod-ucts. As a result, in the first ten months of 2016
64 The quarterly export deflators for the chemicals and chem-ical products group under the SITC were used to estimate the price effect in the first, second and third quarters of 2016.
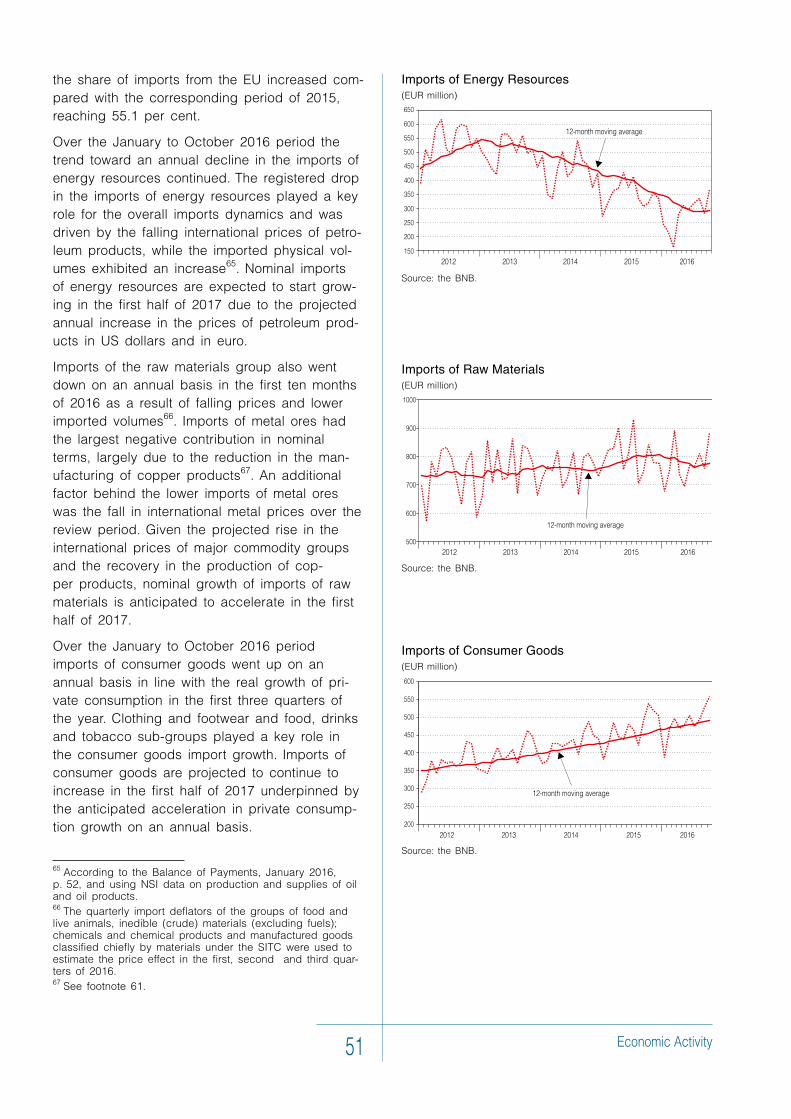
Еconomic Activity51
Imports of Consumer Goods(EUR million)
Source: the BNB.
the share of imports from the EU increased com-pared with the corresponding period of 2015, reaching 55.1 per cent.
Over the January to October 2016 period the trend toward an annual decline in the imports of energy resources continued. The registered drop in the imports of energy resources played a key role for the overall imports dynamics and was driven by the falling international prices of petro-leum products, while the imported physical vol-umes exhibited an increase65. Nominal imports of energy resources are expected to start grow-ing in the first half of 2017 due to the projected annual increase in the prices of petroleum prod-ucts in US dollars and in euro.
Imports of the raw materials group also went down on an annual basis in the first ten months of 2016 as a result of falling prices and lower imported volumes66. Imports of metal ores had the largest negative contribution in nominal terms, largely due to the reduction in the man-ufacturing of copper products67. An additional factor behind the lower imports of metal ores was the fall in international metal prices over the review period. Given the projected rise in the international prices of major commodity groups and the recovery in the production of cop-per products, nominal growth of imports of raw materials is anticipated to accelerate in the first half of 2017.
Over the January to October 2016 period imports of consumer goods went up on an annual basis in line with the real growth of pri-vate consumption in the first three quarters of the year. Clothing and footwear and food, drinks and tobacco sub-groups played a key role in the consumer goods import growth. Imports of consumer goods are projected to continue to increase in the first half of 2017 underpinned by the anticipated acceleration in private consump-tion growth on an annual basis.
65 According to the Balance of Payments, January 2016, p. 52, and using NSI data on production and supplies of oil and oil products.66 The quarterly import deflators of the groups of food and live animals, inedible (crude) materials (excluding fuels); chemicals and chemical products and manufactured goods classified chiefly by materials under the SITC were used to estimate the price effect in the first, second and third quar-ters of 2016.67 See footnote 61.
Imports of Raw Materials (EUR million)
Source: the BNB.
Imports of Energy Resources(EUR million)
Source: the BNB.
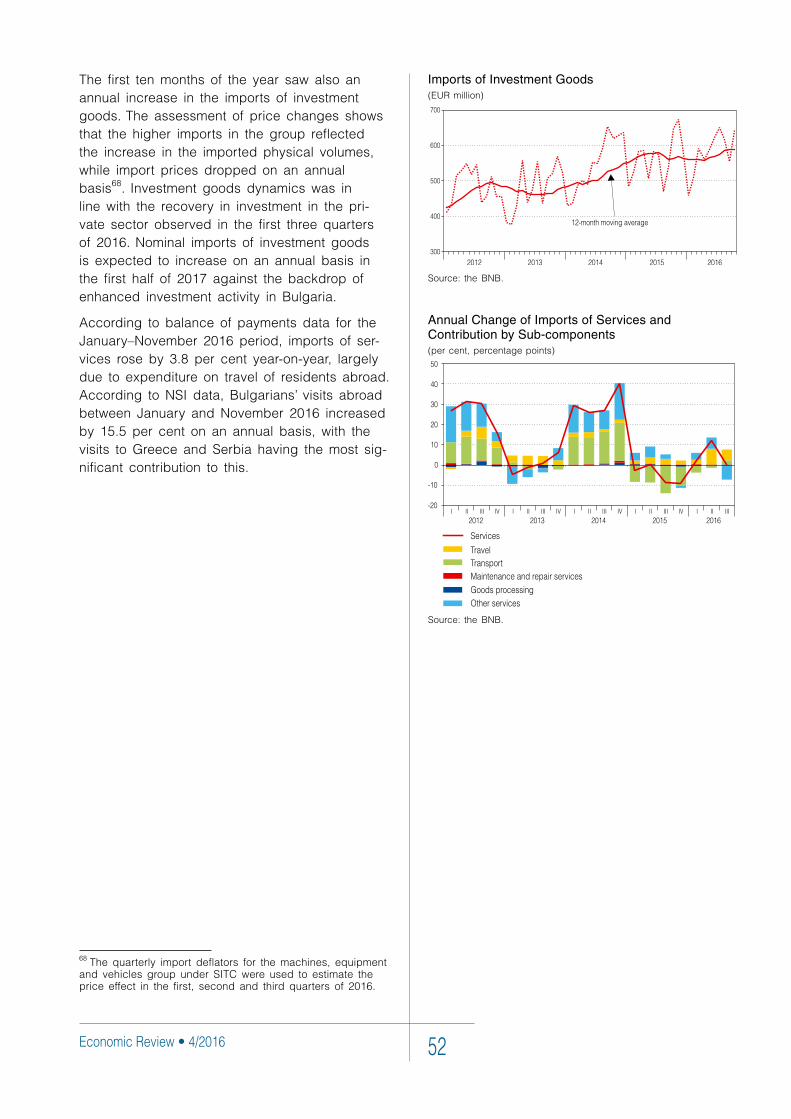
Economic Review • 4/2016 52
Imports of Investment Goods(EUR million)
Source: the BNB.
Annual Change of Imports of Services and Contribution by Sub-components (per cent, percentage points)
Source: the BNB.
The first ten months of the year saw also an annual increase in the imports of investment goods. The assessment of price changes shows that the higher imports in the group reflected the increase in the imported physical volumes, while import prices dropped on an annual basis68. Investment goods dynamics was in line with the recovery in investment in the pri-vate sector observed in the first three quarters of 2016. Nominal imports of investment goods is expected to increase on an annual basis in the first half of 2017 against the backdrop of enhanced investment activity in Bulgaria.
According to balance of payments data for the January–November 2016 period, imports of ser-vices rose by 3.8 per cent year-on-year, largely due to expenditure on travel of residents abroad. According to NSI data, Bulgarians’ visits abroad between January and November 2016 increased by 15.5 per cent on an annual basis, with the visits to Greece and Serbia having the most sig-nificant contribution to this.
68 The quarterly import deflators for the machines, equipment and vehicles group under SITC were used to estimate the price effect in the first, second and third quarters of 2016.
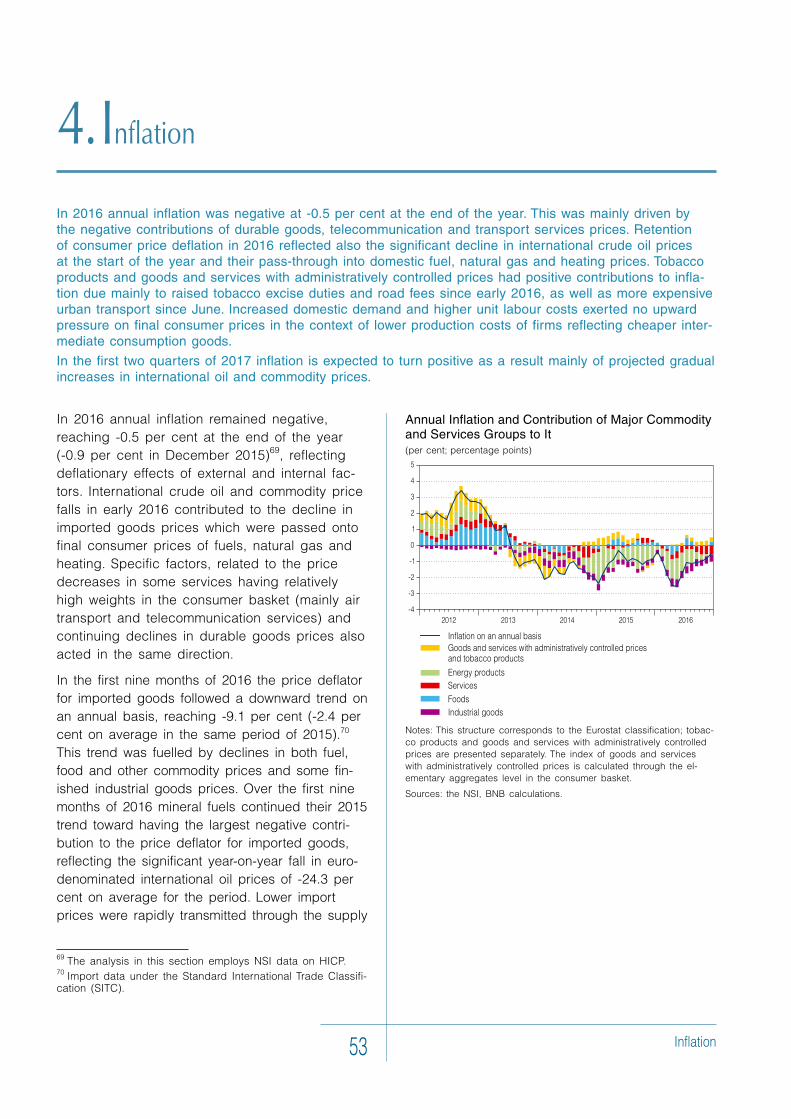
Inflation53
In 2016 annual inflation remained negative, reaching -0.5 per cent at the end of the year (-0.9 per cent in December 2015)69, reflecting deflationary effects of external and internal fac-tors. International crude oil and commodity price falls in early 2016 contributed to the decline in imported goods prices which were passed onto final consumer prices of fuels, natural gas and heating. Specific factors, related to the price decreases in some services having relatively high weights in the consumer basket (mainly air transport and telecommunication services) and continuing declines in durable goods prices also acted in the same direction.
In the first nine months of 2016 the price deflator for imported goods followed a downward trend on an annual basis, reaching -9.1 per cent (-2.4 per cent on average in the same period of 2015).70 This trend was fuelled by declines in both fuel, food and other commodity prices and some fin-ished industrial goods prices. Over the first nine months of 2016 mineral fuels continued their 2015 trend toward having the largest negative contri-bution to the price deflator for imported goods, reflecting the significant year-on-year fall in euro-denominated international oil prices of -24.3 per cent on average for the period. Lower import prices were rapidly transmitted through the supply
69 The analysis in this section employs NSI data on HICP.70 Import data under the Standard International Trade Classifi-cation (SITC).
4. Inflation
In 2016 annual inflation was negative at -0.5 per cent at the end of the year. This was mainly driven by the negative contributions of durable goods, telecommunication and transport services prices. Retention of consumer price deflation in 2016 reflected also the significant decline in international crude oil prices at the start of the year and their pass-through into domestic fuel, natural gas and heating prices. Tobacco products and goods and services with administratively controlled prices had positive contributions to infla-tion due mainly to raised tobacco excise duties and road fees since early 2016, as well as more expensive urban transport since June. Increased domestic demand and higher unit labour costs exerted no upward pressure on final consumer prices in the context of lower production costs of firms reflecting cheaper inter-mediate consumption goods.
In the first two quarters of 2017 inflation is expected to turn positive as a result mainly of projected gradual increases in international oil and commodity prices.
Annual Inflation and Contribution of Major Commodity and Services Groups to It(per cent; percentage points)
Notes: This structure corresponds to the Eurostat classification; tobac-co products and goods and services with administratively controlled prices are presented separately. The index of goods and services with administratively controlled prices is calculated through the el-ementary aggregates level in the consumer basket.
Sources: the NSI, BNB calculations.
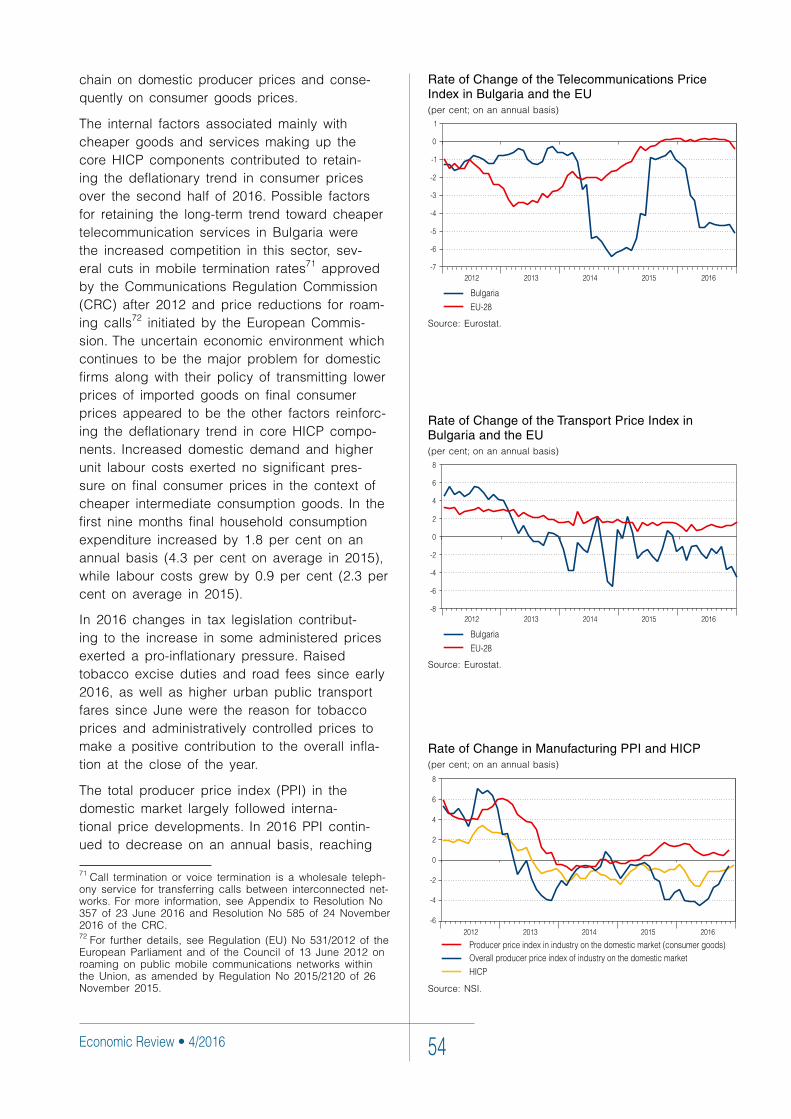
Economic Review • 4/2016 54
chain on domestic producer prices and conse-quently on consumer goods prices.
The internal factors associated mainly with cheaper goods and services making up the core HICP components contributed to retain-ing the deflationary trend in consumer prices over the second half of 2016. Possible factors for retaining the long-term trend toward cheaper telecommunication services in Bulgaria were the increased competition in this sector, sev-eral cuts in mobile termination rates71 approved by the Communications Regulation Commission (CRC) after 2012 and price reductions for roam-ing calls72 initiated by the European Commis-sion. The uncertain economic environment which continues to be the major problem for domestic firms along with their policy of transmitting lower prices of imported goods on final consumer prices appeared to be the other factors reinforc-ing the deflationary trend in core HICP compo-nents. Increased domestic demand and higher unit labour costs exerted no significant pres-sure on final consumer prices in the context of cheaper intermediate consumption goods. In the first nine months final household consumption expenditure increased by 1.8 per cent on an annual basis (4.3 per cent on average in 2015), while labour costs grew by 0.9 per cent (2.3 per cent on average in 2015).
In 2016 changes in tax legislation contribut-ing to the increase in some administered prices exerted a pro-inflationary pressure. Raised tobacco excise duties and road fees since early 2016, as well as higher urban public transport fares since June were the reason for tobacco prices and administratively controlled prices to make a positive contribution to the overall infla-tion at the close of the year.
The total producer price index (PPI) in the domestic market largely followed interna-tional price developments. In 2016 PPI contin-ued to decrease on an annual basis, reaching
71 Call termination or voice termination is a wholesale teleph-ony service for transferring calls between interconnected net-works. For more information, see Appendix to Resolution No 357 of 23 June 2016 and Resolution No 585 of 24 November 2016 of the CRC.72 For further details, see Regulation (EU) No 531/2012 of the European Parliament and of the Council of 13 June 2012 on roaming on public mobile communications networks within the Union, as amended by Regulation No 2015/2120 of 26 November 2015.
Rate of Change of the Telecommunications Price Index in Bulgaria and the EU(per cent; on an annual basis)
Source: Eurostat.
Rate of Change of the Transport Price Index in Bulgaria and the EU(per cent; on an annual basis)
Source: Eurostat.
Rate of Change in Manufacturing PPI and HICP(per cent; on an annual basis)
Source: NSI.
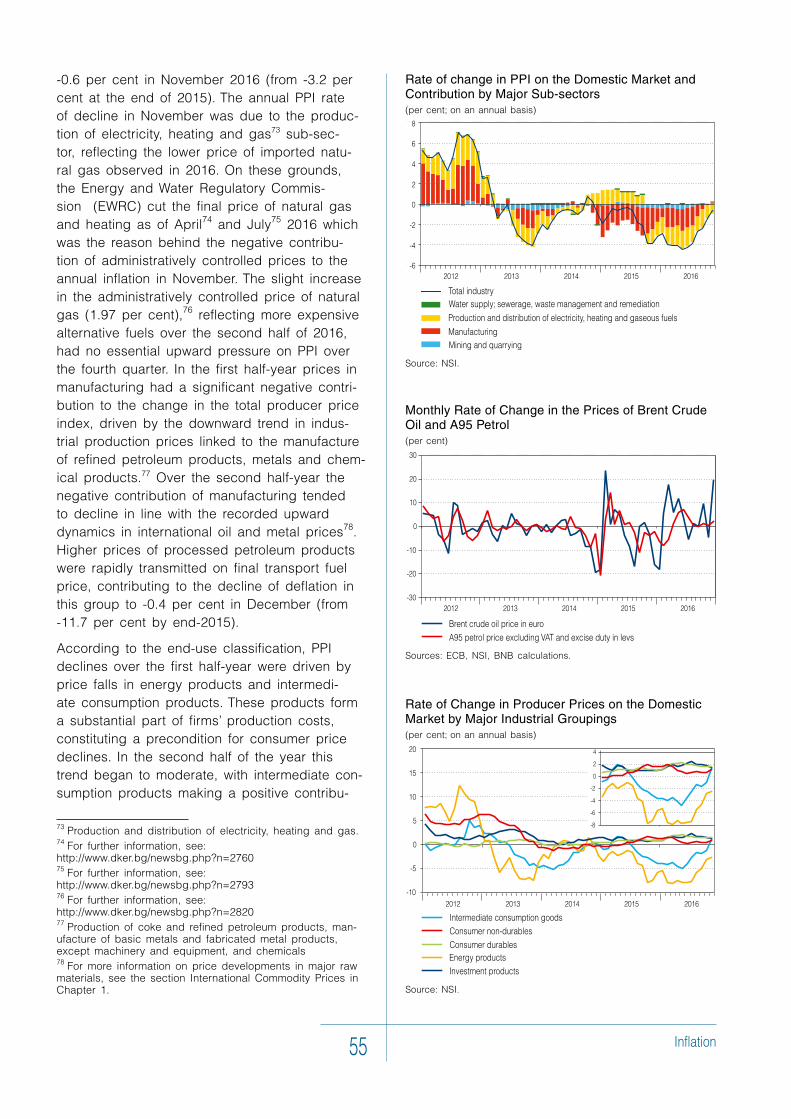
Inflation55
-0.6 per cent in November 2016 (from -3.2 per cent at the end of 2015). The annual PPI rate of decline in November was due to the produc-tion of electricity, heating and gas73 sub-sec-tor, reflecting the lower price of imported natu-ral gas observed in 2016. On these grounds, the Energy and Water Regulatory Commis-sion (EWRC) cut the final price of natural gas and heating as of April74 and July75 2016 which was the reason behind the negative contribu-tion of administratively controlled prices to the annual inflation in November. The slight increase in the administratively controlled price of natural gas (1.97 per cent),76 reflecting more expensive alternative fuels over the second half of 2016, had no essential upward pressure on PPI over the fourth quarter. In the first half-year prices in manufacturing had a significant negative contri-bution to the change in the total producer price index, driven by the downward trend in indus-trial production prices linked to the manufacture of refined petroleum products, metals and chem-ical products.77 Over the second half-year the negative contribution of manufacturing tended to decline in line with the recorded upward dynamics in international oil and metal prices78. Higher prices of processed petroleum products were rapidly transmitted on final transport fuel price, contributing to the decline of deflation in this group to -0.4 per cent in December (from -11.7 per cent by end-2015).
According to the end-use classification, PPI declines over the first half-year were driven by price falls in energy products and intermedi-ate consumption products. These products form a substantial part of firms’ production costs, constituting a precondition for consumer price declines. In the second half of the year this trend began to moderate, with intermediate con-sumption products making a positive contribu-
73 Production and distribution of electricity, heating and gas.74 For further information, see: http://www.dker.bg/newsbg.php?n=276075 For further information, see: http://www.dker.bg/newsbg.php?n=279376 For further information, see: http://www.dker.bg/newsbg.php?n=282077 Production of coke and refined petroleum products, man-ufacture of basic metals and fabricated metal products, except machinery and equipment, and chemicals78 For more information on price developments in major raw materials, see the section International Commodity Prices in Chapter 1.
Rate of Change in Producer Prices on the Domestic Market by Major Industrial Groupings (per cent; on an annual basis)
Source: NSI.
Rate of change in PPI on the Domestic Market and Contribution by Major Sub-sectors (per cent; on an annual basis)
Source: NSI.
Monthly Rate of Change in the Prices of Brent Crude Oil and A95 Petrol(per cent)
Sources: ECB, NSI, BNB calculations.
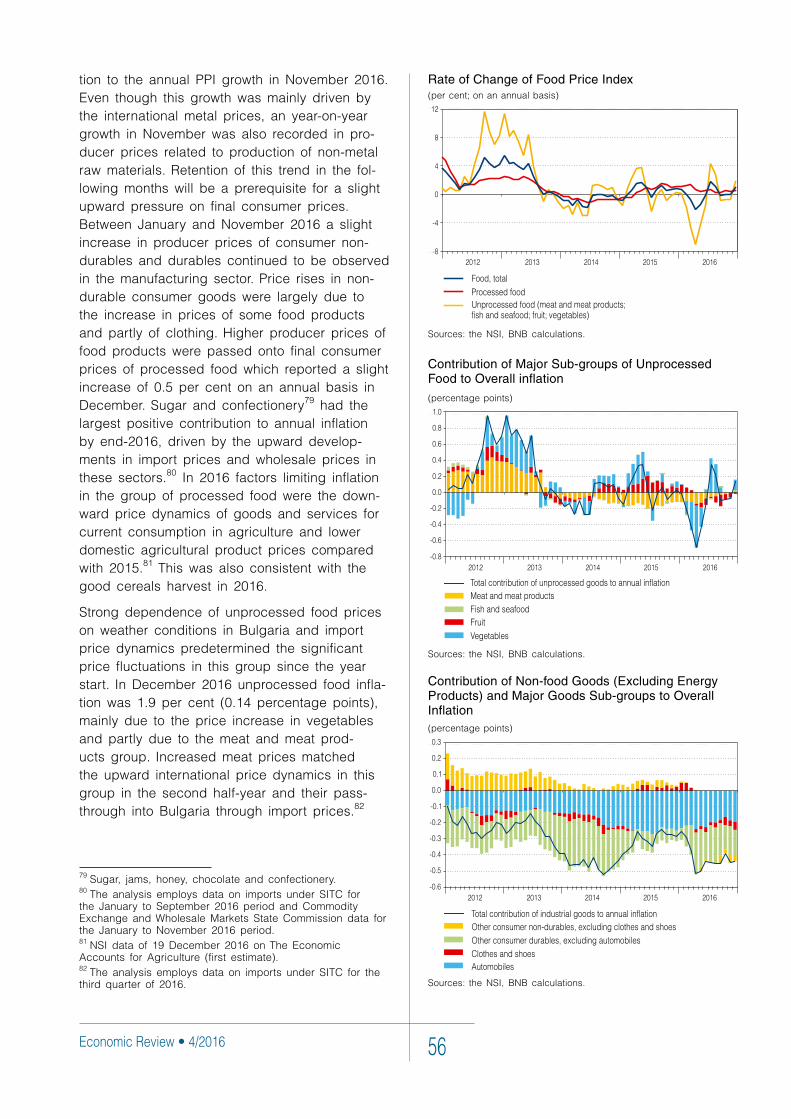
Economic Review • 4/2016 56
Contribution of Non-food Goods (Excluding Energy Products) and Major Goods Sub-groups to Overall Inflation (percentage points)
Sources: the NSI, BNB calculations.
tion to the annual PPI growth in November 2016. Even though this growth was mainly driven by the international metal prices, an year-on-year growth in November was also recorded in pro-ducer prices related to production of non-metal raw materials. Retention of this trend in the fol-lowing months will be a prerequisite for a slight upward pressure on final consumer prices. Between January and November 2016 a slight increase in producer prices of consumer non-durables and durables continued to be observed in the manufacturing sector. Price rises in non-durable consumer goods were largely due to the increase in prices of some food products and partly of clothing. Higher producer prices of food products were passed onto final consumer prices of processed food which reported a slight increase of 0.5 per cent on an annual basis in December. Sugar and confectionery79 had the largest positive contribution to annual inflation by end-2016, driven by the upward develop-ments in import prices and wholesale prices in these sectors.80 In 2016 factors limiting inflation in the group of processed food were the down-ward price dynamics of goods and services for current consumption in agriculture and lower domestic agricultural product prices compared with 2015.81 This was also consistent with the good cereals harvest in 2016.
Strong dependence of unprocessed food prices on weather conditions in Bulgaria and import price dynamics predetermined the significant price fluctuations in this group since the year start. In December 2016 unprocessed food infla-tion was 1.9 per cent (0.14 percentage points), mainly due to the price increase in vegetables and partly due to the meat and meat prod-ucts group. Increased meat prices matched the upward international price dynamics in this group in the second half-year and their pass-through into Bulgaria through import prices.82
79 Sugar, jams, honey, chocolate and confectionery.80 The analysis employs data on imports under SITC for the January to September 2016 period and Commodity Exchange and Wholesale Markets State Commission data for the January to November 2016 period. 81 NSI data of 19 December 2016 on The Economic Accounts for Agriculture (first estimate).82 The analysis employs data on imports under SITC for the third quarter of 2016.
Rate of Change of Food Price Index(per cent; on an annual basis)
Sources: the NSI, BNB calculations.
Contribution of Major Sub-groups of Unprocessed Food to Overall inflation
(percentage points)
Sources: the NSI, BNB calculations.
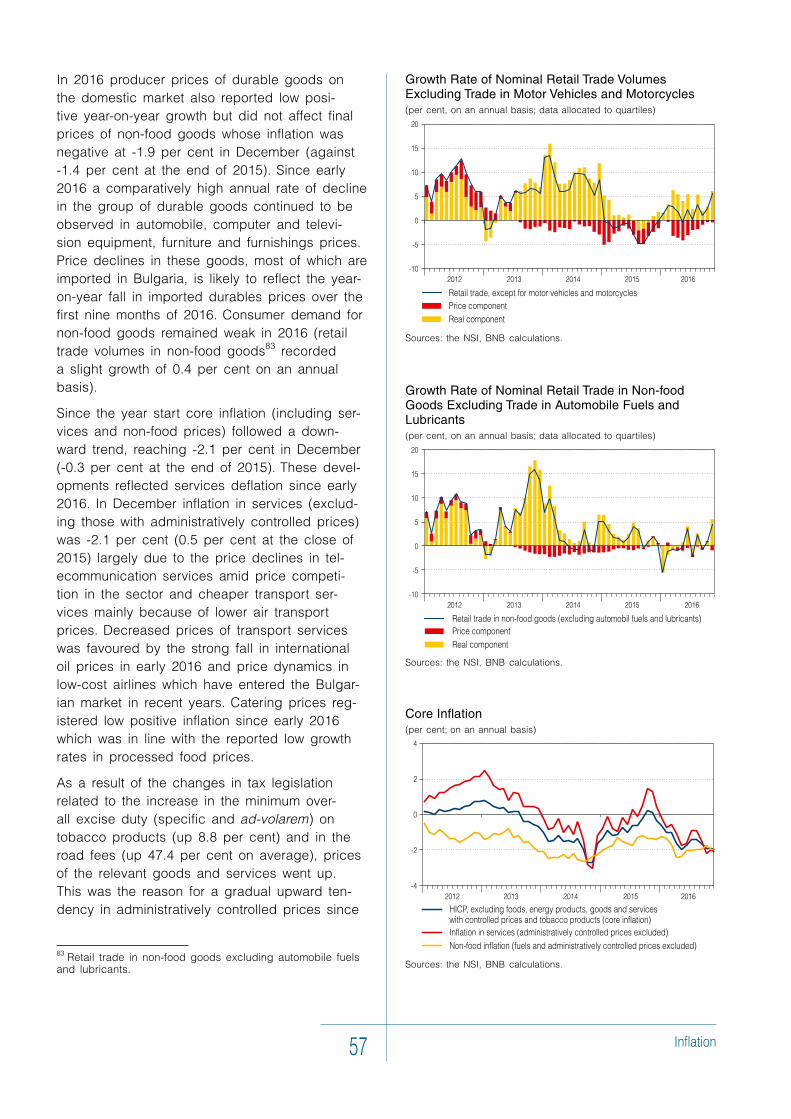
Inflation57
In 2016 producer prices of durable goods on the domestic market also reported low posi-tive year-on-year growth but did not affect final prices of non-food goods whose inflation was negative at -1.9 per cent in December (against -1.4 per cent at the end of 2015). Since early 2016 a comparatively high annual rate of decline in the group of durable goods continued to be observed in automobile, computer and televi-sion equipment, furniture and furnishings prices. Price declines in these goods, most of which are imported in Bulgaria, is likely to reflect the year-on-year fall in imported durables prices over the first nine months of 2016. Consumer demand for non-food goods remained weak in 2016 (retail trade volumes in non-food goods83 recorded a slight growth of 0.4 per cent on an annual basis).
Since the year start core inflation (including ser-vices and non-food prices) followed a down-ward trend, reaching -2.1 per cent in December (-0.3 per cent at the end of 2015). These devel-opments reflected services deflation since early 2016. In December inflation in services (exclud-ing those with administratively controlled prices) was -2.1 per cent (0.5 per cent at the close of 2015) largely due to the price declines in tel-ecommunication services amid price competi-tion in the sector and cheaper transport ser-vices mainly because of lower air transport prices. Decreased prices of transport services was favoured by the strong fall in international oil prices in early 2016 and price dynamics in low-cost airlines which have entered the Bulgar-ian market in recent years. Catering prices reg-istered low positive inflation since early 2016 which was in line with the reported low growth rates in processed food prices.
As a result of the changes in tax legislation related to the increase in the minimum over-all excise duty (specific and ad-volarem) on tobacco products (up 8.8 per cent) and in the road fees (up 47.4 per cent on average), prices of the relevant goods and services went up. This was the reason for a gradual upward ten-dency in administratively controlled prices since
83 Retail trade in non-food goods excluding automobile fuels and lubricants.
Growth Rate of Nominal Retail Trade Volumes Excluding Trade in Motor Vehicles and Motorcycles (per cent, on an annual basis; data allocated to quartiles)
Sources: the NSI, BNB calculations.
Growth Rate of Nominal Retail Trade in Non-food Goods Excluding Trade in Automobile Fuels and Lubricants (per cent, on an annual basis; data allocated to quartiles)
Sources: the NSI, BNB calculations.
Core Inflation(per cent; on an annual basis)
Sources: the NSI, BNB calculations.
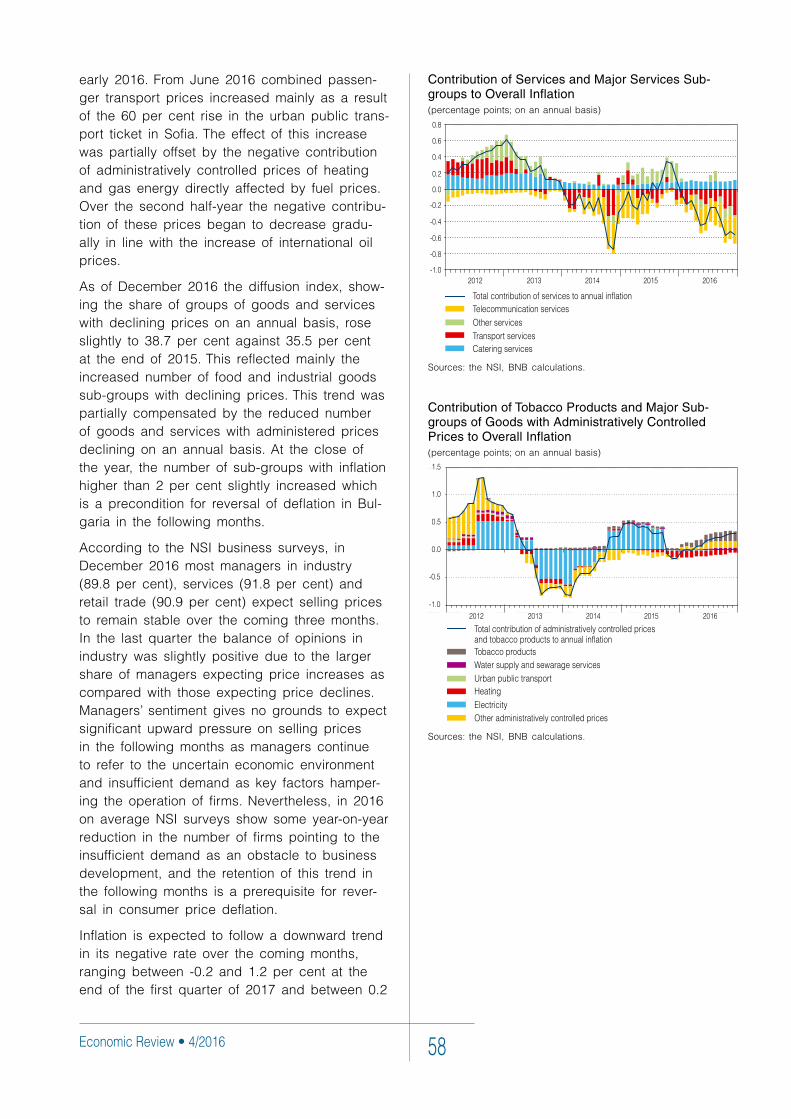
Economic Review • 4/2016 58
early 2016. From June 2016 combined passen-ger transport prices increased mainly as a result of the 60 per cent rise in the urban public trans-port ticket in Sofia. The effect of this increase was partially offset by the negative contribution of administratively controlled prices of heating and gas energy directly affected by fuel prices. Over the second half-year the negative contribu-tion of these prices began to decrease gradu-ally in line with the increase of international oil prices.
As of December 2016 the diffusion index, show-ing the share of groups of goods and services with declining prices on an annual basis, rose slightly to 38.7 per cent against 35.5 per cent at the end of 2015. This reflected mainly the increased number of food and industrial goods sub-groups with declining prices. This trend was partially compensated by the reduced number of goods and services with administered prices declining on an annual basis. At the close of the year, the number of sub-groups with inflation higher than 2 per cent slightly increased which is a precondition for reversal of deflation in Bul-garia in the following months.
According to the NSI business surveys, in December 2016 most managers in industry (89.8 per cent), services (91.8 per cent) and retail trade (90.9 per cent) expect selling prices to remain stable over the coming three months. In the last quarter the balance of opinions in industry was slightly positive due to the larger share of managers expecting price increases as compared with those expecting price declines. Managers’ sentiment gives no grounds to expect significant upward pressure on selling prices in the following months as managers continue to refer to the uncertain economic environment and insufficient demand as key factors hamper-ing the operation of firms. Nevertheless, in 2016 on average NSI surveys show some year-on-year reduction in the number of firms pointing to the insufficient demand as an obstacle to business development, and the retention of this trend in the following months is a prerequisite for rever-sal in consumer price deflation.
Inflation is expected to follow a downward trend in its negative rate over the coming months, ranging between -0.2 and 1.2 per cent at the end of the first quarter of 2017 and between 0.2
Contribution of Services and Major Services Sub-groups to Overall Inflation (percentage points; on an annual basis)
Sources: the NSI, BNB calculations.
Contribution of Tobacco Products and Major Sub-groups of Goods with Administratively Controlled Prices to Overall Inflation(percentage points; on an annual basis)
Sources: the NSI, BNB calculations.
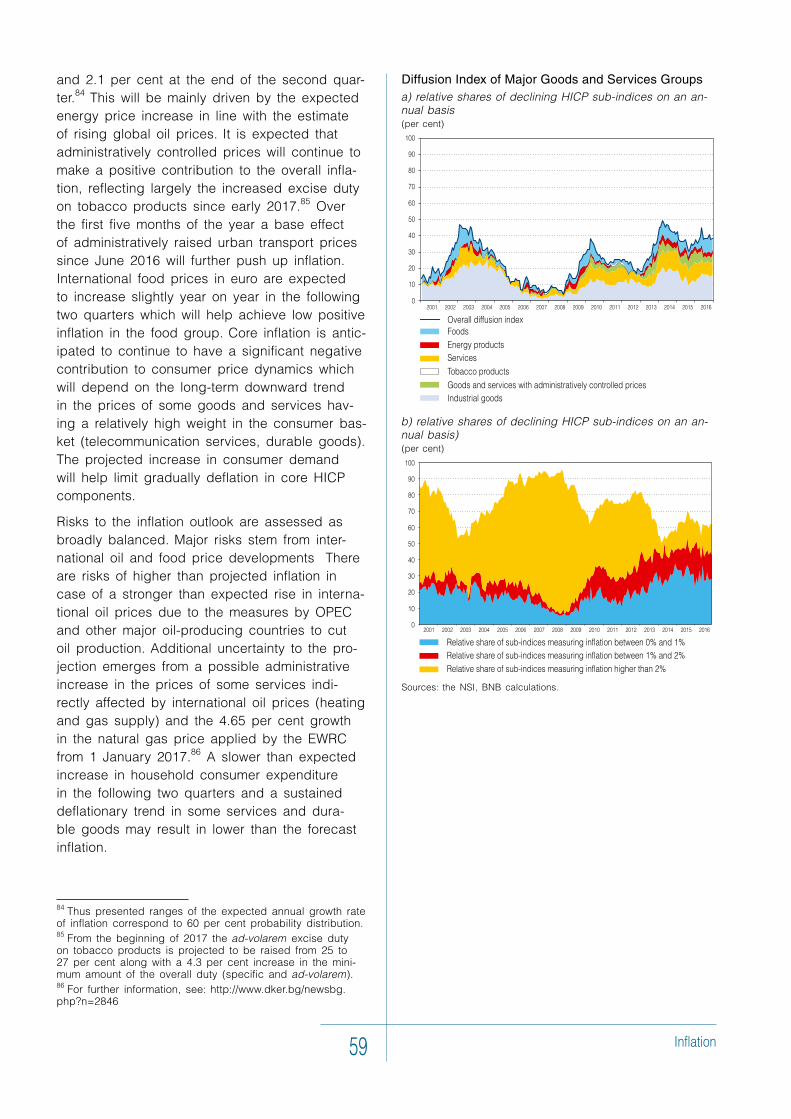
Inflation59
Diffusion Index of Major Goods and Services Groups a) relative shares of declining HICP sub-indices on an an-nual basis(per cent)
b) relative shares of declining HICP sub-indices on an an-nual basis)(per cent)
Sources: the NSI, BNB calculations.
and 2.1 per cent at the end of the second quar-ter.84 This will be mainly driven by the expected energy price increase in line with the estimate of rising global oil prices. It is expected that administratively controlled prices will continue to make a positive contribution to the overall infla-tion, reflecting largely the increased excise duty on tobacco products since early 2017.85 Over the first five months of the year a base effect of administratively raised urban transport prices since June 2016 will further push up inflation. International food prices in euro are expected to increase slightly year on year in the following two quarters which will help achieve low positive inflation in the food group. Core inflation is antic-ipated to continue to have a significant negative contribution to consumer price dynamics which will depend on the long-term downward trend in the prices of some goods and services hav-ing a relatively high weight in the consumer bas-ket (telecommunication services, durable goods). The projected increase in consumer demand will help limit gradually deflation in core HICP components.
Risks to the inflation outlook are assessed as broadly balanced. Major risks stem from inter-national oil and food price developments There are risks of higher than projected inflation in case of a stronger than expected rise in interna-tional oil prices due to the measures by OPEC and other major oil-producing countries to cut oil production. Additional uncertainty to the pro-jection emerges from a possible administrative increase in the prices of some services indi-rectly affected by international oil prices (heating and gas supply) and the 4.65 per cent growth in the natural gas price applied by the EWRC from 1 January 2017.86 A slower than expected increase in household consumer expenditure in the following two quarters and a sustained deflationary trend in some services and dura-ble goods may result in lower than the forecast inflation.
84 Thus presented ranges of the expected annual growth rate of inflation correspond to 60 per cent probability distribution.85 From the beginning of 2017 the ad-volarem excise duty on tobacco products is projected to be raised from 25 to 27 per cent along with a 4.3 per cent increase in the mini-mum amount of the overall duty (specific and ad-volarem).86 For further information, see: http://www.dker.bg/newsbg.php?n=2846
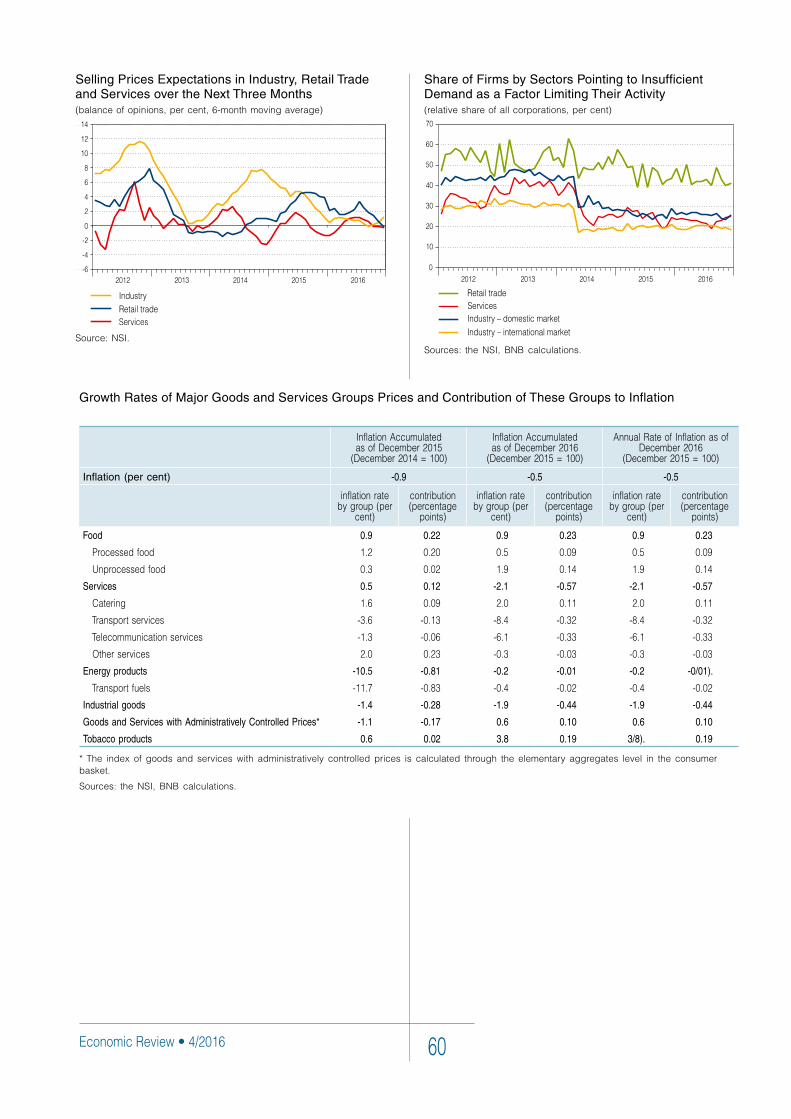
Economic Review • 4/2016 60
Growth Rates of Major Goods and Services Groups Prices and Contribution of These Groups to Inflation
InflationAccumulatedasofDecember2015
(December2014=100)
InflationAccumulatedasofDecember2016
(December2015=100)
AnnualRateofInflationasofDecember2016
(December2015=100)
Inflation (per cent) -0.9 -0.5 -0.5
inflationratebygroup(per
cent)
contribution(percentage
points)
inflationratebygroup(per
cent)
contribution(percentage
points)
inflationratebygroup(per
cent)
contribution(percentage
points)
Food 0.9 0.22 0.9 0.23 0.9 0.23
Processedfood 1.2 0.20 0.5 0.09 0.5 0.09
Unprocessedfood 0.3 0.02 1.9 0.14 1.9 0.14
Services 0.5 0.12 -2.1 -0.57 -2.1 -0.57
Catering 1.6 0.09 2.0 0.11 2.0 0.11
Transportservices -3.6 -0.13 -8.4 -0.32 -8.4 -0.32
Telecommunicationservices -1.3 -0.06 -6.1 -0.33 -6.1 -0.33
Otherservices 2.0 0.23 -0.3 -0.03 -0.3 -0.03
Energy products -10.5 -0.81 -0.2 -0.01 -0.2 -0/01).
Transportfuels -11.7 -0.83 -0.4 -0.02 -0.4 -0.02
Industrial goods -1.4 -0.28 -1.9 -0.44 -1.9 -0.44
Goods and Services with Administratively Controlled Prices* -1.1 -0.17 0.6 0.10 0.6 0.10
Tobacco products 0.6 0.02 3.8 0.19 3/8). 0.19
* The index of goods and services with administratively controlled prices is calculated through the elementary aggregates level in the consumer basket.
Sources: the NSI, BNB calculations.
Share of Firms by Sectors Pointing to Insufficient Demand as a Factor Limiting Their Activity(relative share of all corporations, per cent)
Sources: the NSI, BNB calculations.
Selling Prices Expectations in Industry, Retail Trade and Services over the Next Three Months(balance of opinions, per cent, 6-month moving average)
Source: NSI.
BNB Forecast61
5. Bulgarian National Bank Forecast of Key Macroeconomic Indicators for 2016–2018
The BNB forecast of key macroeconomic indicators is based on data published as of 15 December 2016. ECB, EC and IMF assumptions on the global economic developments as of 8 December 2016 were used.
In 2016 global economic growth is expected to slow down on 2015 due to lower annual growth in advanced economies while the real growth rate in developing countries is expected to remain close to its previous year’s level. Based on latest ECB, EC and IMF forecasts of global economic developments, in the 2017–2018 period economic activity in Bulgaria’s major trading partners is expected to accelerate and external demand for Bulgarian goods and services to increase accordingly.
In 2016 international commodity prices remained lower than in the previous year due to the high level of inventories and output. In the second half of 2016 the global commodities demand-supply gap decreased. This decline is expected to continue in 2017 and 2018. As a result, international prices of commodities are anticipated to start increasing on an annual basis from 2017 onwards.
In 2016 real growth in Bulgaria is expected to reach 3.4 per cent (3.6 per cent in 2015). In 2017 growth is expected to slow down to 2.8 per cent, and then to accelerate slowly to 2.9 per cent in 2018. Domestic demand will have the main positive contribution to growth. As a result, growth of imports of goods and ser-vices is anticipated to accelerate. Irrespective of growing imports, the average contribution of net exports over the projection horizon is expected to be almost neutral. Risks to the outlook of economic activity in 2016 are assessed as broadly balanced. There are some risks of lower than projected growth in the 2017–2018 period. Uncertainty about global economic developments remains high and would adversely affect both external demand for Bulgarian goods and services and Bulgaria’s investment activity. Lower than expected private investment in Bulgaria would have a limiting effect on household consumption and confidence, and the lower absorption of funds under EU programmes will be a prerequisite for lower government investment.
In 2016 inflation in Bulgaria remained negative. Falls in international crude oil and commodity prices contrib-uted to the decline in the prices of imported goods which was passed on final consumer prices in Bulgaria. Specific factors, as price decreases in some services, and further declines in durable goods prices also acted in the same direction. In the 2017–2018 period inflation is expected to remain low following a pattern of a gradual increase in line with the assumed upward dynamics of international prices. Administratively controlled prices will have a low positive contribution to overall inflation due to the projected rise in excise duty on tobacco products. Risks to the inflation outlook are assessed as broadly balanced. Faster than expected rates of increase in oil and commodity prices and related possible rises in some administratively controlled prices may prompt higher than projected inflation. A continued deflationary trend in some services and durable goods, however, is a precondition for lower than projected inflation.
ForecastGlobal economic growth in 2016 is expected to remain lower than in 2015 due to slower growth in the first three quarters of the year. The main factor behind this is lower growth in advanced economies, where despite the positive signs of higher economic activity in the third quarter of 2016, GDP growth re-mains slower than in the previous year. Concurrently, over 2016 growth in developing countries will re-main at its 2015 level. The ECB, EC and IMF forecasts for 2017 and 2018 are for acceleration of global economic growth compared to 2016 as a result of a recovery of economic activity in developing coun-tries and gradually increasing GDP in the USA and the euro area. The expected strengthening in global economic activity will contribute to higher external demand for Bulgarian goods in 2017 and 2018.
In spite of the fact that prices of energy and non-energy products in 2016 were lower than in 2015, the demand-supply gap in international markets decreased in the second half of the year, resulting in higher year-on-year prices of energy and most non-energy products at the close of 2016. The major factors
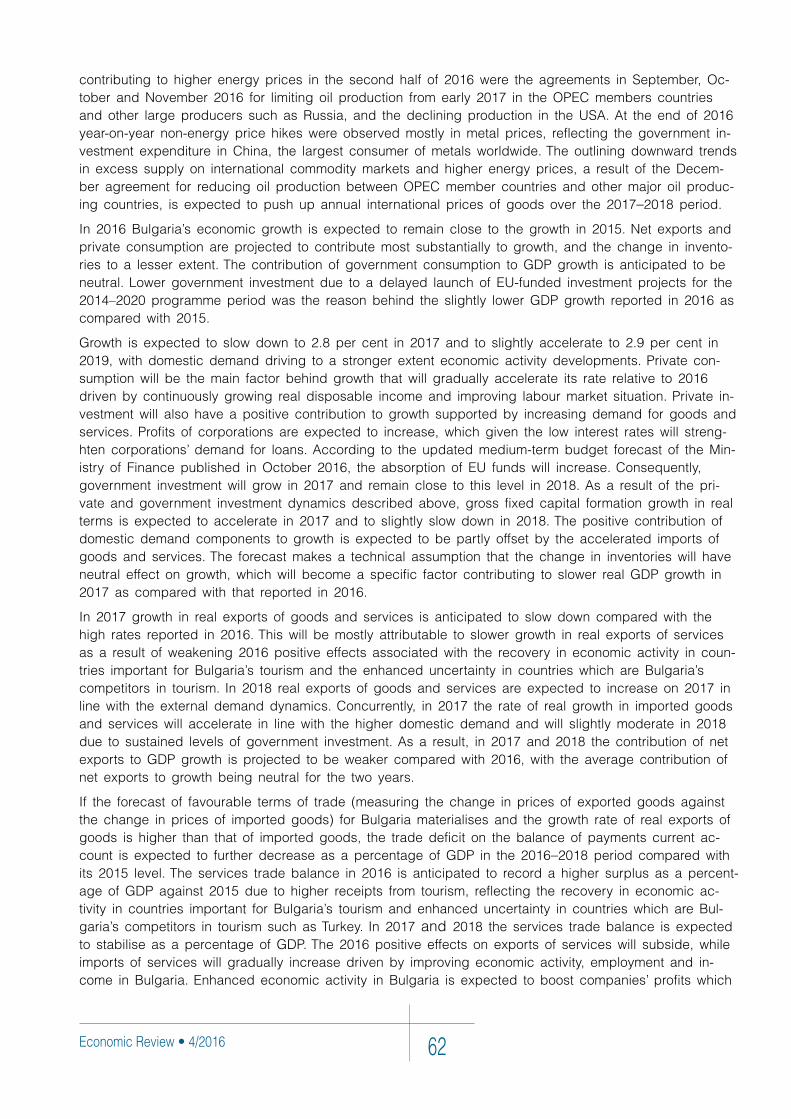
Economic Review • 4/2016 62
contributing to higher energy prices in the second half of 2016 were the agreements in September, Oc-tober and November 2016 for limiting oil production from early 2017 in the OPEC members countries and other large producers such as Russia, and the declining production in the USA. At the end of 2016 year-on-year non-energy price hikes were observed mostly in metal prices, reflecting the government in-vestment expenditure in China, the largest consumer of metals worldwide. The outlining downward trends in excess supply on international commodity markets and higher energy prices, a result of the Decem-ber agreement for reducing oil production between OPEC member countries and other major oil produc-ing countries, is expected to push up annual international prices of goods over the 2017–2018 period.
In 2016 Bulgaria’s economic growth is expected to remain close to the growth in 2015. Net exports and private consumption are projected to contribute most substantially to growth, and the change in invento-ries to a lesser extent. The contribution of government consumption to GDP growth is anticipated to be neutral. Lower government investment due to a delayed launch of EU-funded investment projects for the 2014–2020 programme period was the reason behind the slightly lower GDP growth reported in 2016 as compared with 2015.
Growth is expected to slow down to 2.8 per cent in 2017 and to slightly accelerate to 2.9 per cent in 2019, with domestic demand driving to a stronger extent economic activity developments. Private con-sumption will be the main factor behind growth that will gradually accelerate its rate relative to 2016 driven by continuously growing real disposable income and improving labour market situation. Private in-vestment will also have a positive contribution to growth supported by increasing demand for goods and services. Profits of corporations are expected to increase, which given the low interest rates will streng-hten corporations’ demand for loans. According to the updated medium-term budget forecast of the Min-istry of Finance published in October 2016, the absorption of EU funds will increase. Consequently, government investment will grow in 2017 and remain close to this level in 2018. As a result of the pri-vate and government investment dynamics described above, gross fixed capital formation growth in real terms is expected to accelerate in 2017 and to slightly slow down in 2018. The positive contribution of domestic demand components to growth is expected to be partly offset by the accelerated imports of goods and services. The forecast makes a technical assumption that the change in inventories will have neutral effect on growth, which will become a specific factor contributing to slower real GDP growth in 2017 as compared with that reported in 2016.
In 2017 growth in real exports of goods and services is anticipated to slow down compared with the high rates reported in 2016. This will be mostly attributable to slower growth in real exports of services as a result of weakening 2016 positive effects associated with the recovery in economic activity in coun-tries important for Bulgaria’s tourism and the enhanced uncertainty in countries which are Bulgaria’s competitors in tourism. In 2018 real exports of goods and services are expected to increase on 2017 in line with the external demand dynamics. Concurrently, in 2017 the rate of real growth in imported goods and services will accelerate in line with the higher domestic demand and will slightly moderate in 2018 due to sustained levels of government investment. As a result, in 2017 and 2018 the contribution of net exports to GDP growth is projected to be weaker compared with 2016, with the average contribution of net exports to growth being neutral for the two years.
If the forecast of favourable terms of trade (measuring the change in prices of exported goods against the change in prices of imported goods) for Bulgaria materialises and the growth rate of real exports of goods is higher than that of imported goods, the trade deficit on the balance of payments current ac-count is expected to further decrease as a percentage of GDP in the 2016–2018 period compared with its 2015 level. The services trade balance in 2016 is anticipated to record a higher surplus as a percent-age of GDP against 2015 due to higher receipts from tourism, reflecting the recovery in economic ac-tivity in countries important for Bulgaria’s tourism and enhanced uncertainty in countries which are Bul-garia’s competitors in tourism such as Turkey. In 2017 and 2018 the services trade balance is expected to stabilise as a percentage of GDP. The 2016 positive effects on exports of services will subside, while imports of services will gradually increase driven by improving economic activity, employment and in-come in Bulgaria. Enhanced economic activity in Bulgaria is expected to boost companies’ profits which
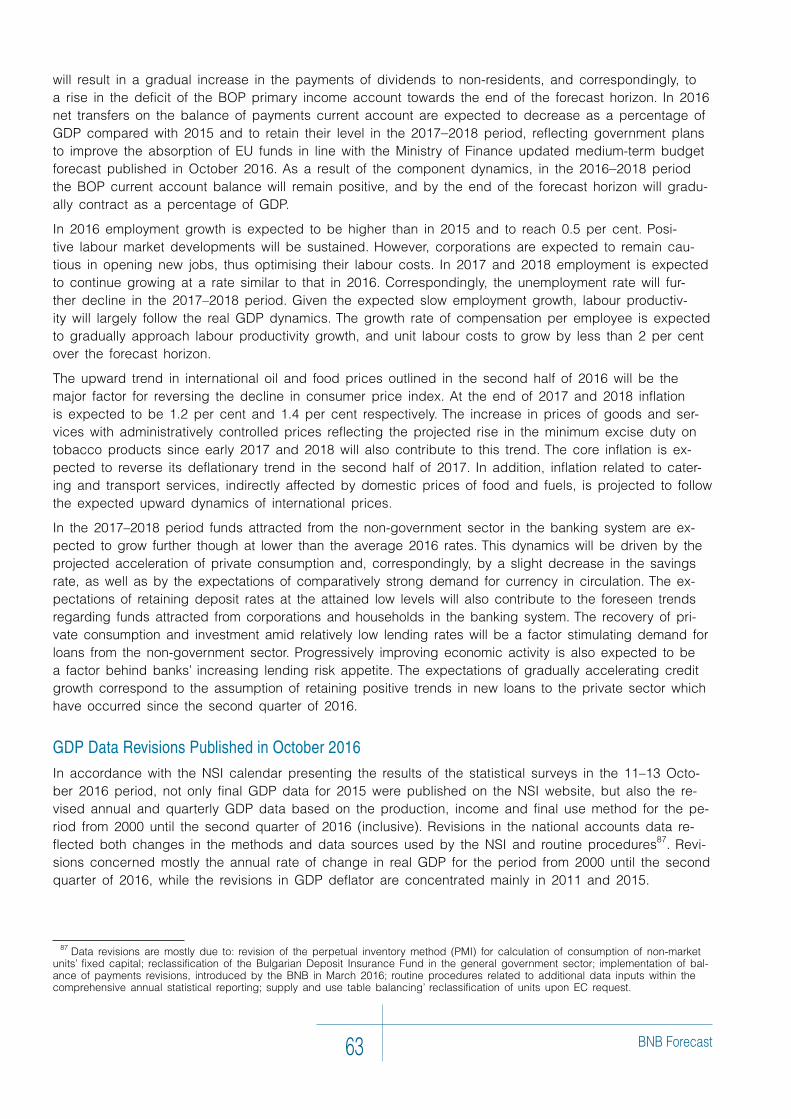
BNB Forecast63
will result in a gradual increase in the payments of dividends to non-residents, and correspondingly, to a rise in the deficit of the BOP primary income account towards the end of the forecast horizon. In 2016 net transfers on the balance of payments current account are expected to decrease as a percentage of GDP compared with 2015 and to retain their level in the 2017–2018 period, reflecting government plans to improve the absorption of EU funds in line with the Ministry of Finance updated medium-term budget forecast published in October 2016. As a result of the component dynamics, in the 2016–2018 period the BOP current account balance will remain positive, and by the end of the forecast horizon will gradu-ally contract as a percentage of GDP.
In 2016 employment growth is expected to be higher than in 2015 and to reach 0.5 per cent. Posi-tive labour market developments will be sustained. However, corporations are expected to remain cau-tious in opening new jobs, thus optimising their labour costs. In 2017 and 2018 employment is expected to continue growing at a rate similar to that in 2016. Correspondingly, the unemployment rate will fur-ther decline in the 2017–2018 period. Given the expected slow employment growth, labour productiv-ity will largely follow the real GDP dynamics. The growth rate of compensation per employee is expected to gradually approach labour productivity growth, and unit labour costs to grow by less than 2 per cent over the forecast horizon.
The upward trend in international oil and food prices outlined in the second half of 2016 will be the major factor for reversing the decline in consumer price index. At the end of 2017 and 2018 inflation is expected to be 1.2 per cent and 1.4 per cent respectively. The increase in prices of goods and ser-vices with administratively controlled prices reflecting the projected rise in the minimum excise duty on tobacco products since early 2017 and 2018 will also contribute to this trend. The core inflation is ex-pected to reverse its deflationary trend in the second half of 2017. In addition, inflation related to cater-ing and transport services, indirectly affected by domestic prices of food and fuels, is projected to follow the expected upward dynamics of international prices.
In the 2017–2018 period funds attracted from the non-government sector in the banking system are ex-pected to grow further though at lower than the average 2016 rates. This dynamics will be driven by the projected acceleration of private consumption and, correspondingly, by a slight decrease in the savings rate, as well as by the expectations of comparatively strong demand for currency in circulation. The ex-pectations of retaining deposit rates at the attained low levels will also contribute to the foreseen trends regarding funds attracted from corporations and households in the banking system. The recovery of pri-vate consumption and investment amid relatively low lending rates will be a factor stimulating demand for loans from the non-government sector. Progressively improving economic activity is also expected to be a factor behind banks’ increasing lending risk appetite. The expectations of gradually accelerating credit growth correspond to the assumption of retaining positive trends in new loans to the private sector which have occurred since the second quarter of 2016.
GDP Data Revisions Published in October 2016In accordance with the NSI calendar presenting the results of the statistical surveys in the 11–13 Octo-ber 2016 period, not only final GDP data for 2015 were published on the NSI website, but also the re-vised annual and quarterly GDP data based on the production, income and final use method for the pe-riod from 2000 until the second quarter of 2016 (inclusive). Revisions in the national accounts data re-flected both changes in the methods and data sources used by the NSI and routine procedures87. Revi-sions concerned mostly the annual rate of change in real GDP for the period from 2000 until the second quarter of 2016, while the revisions in GDP deflator are concentrated mainly in 2011 and 2015.
87 Data revisions are mostly due to: revision of the perpetual inventory method (PMI) for calculation of consumption of non-market units’ fixed capital; reclassification of the Bulgarian Deposit Insurance Fund in the general government sector; implementation of bal-ance of payments revisions, introduced by the BNB in March 2016; routine procedures related to additional data inputs within the comprehensive annual statistical reporting; supply and use table balancing’ reclassification of units upon EC request.
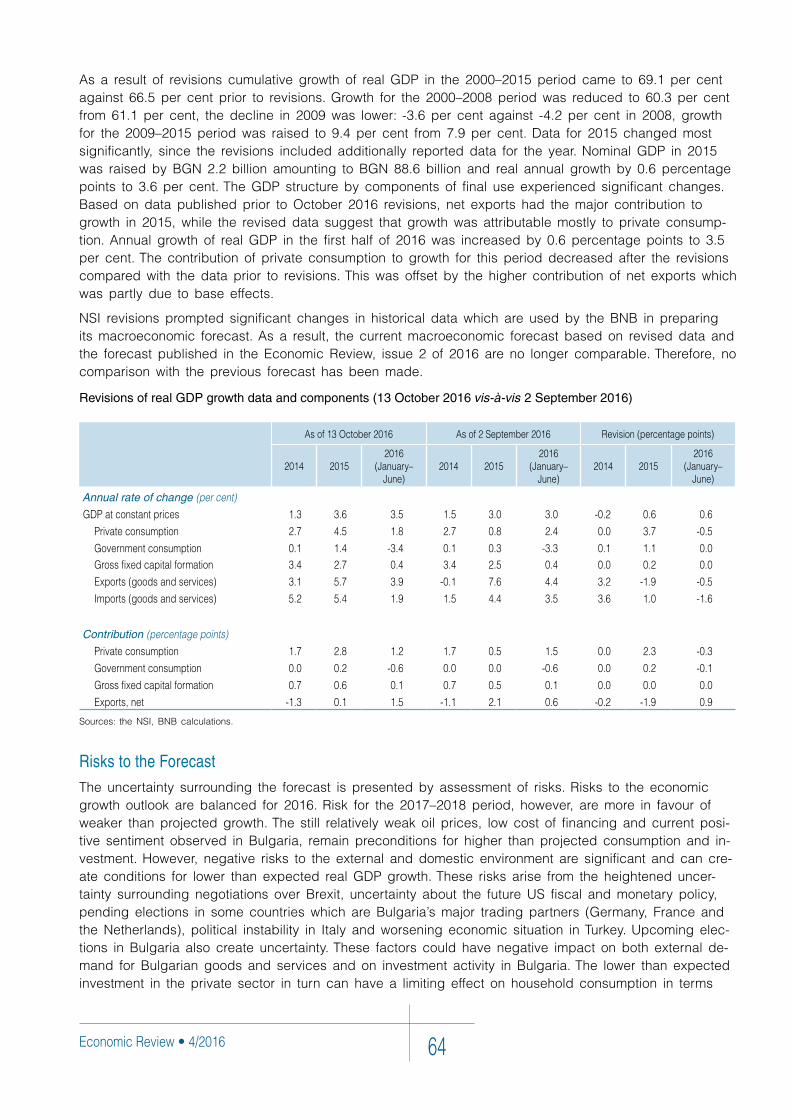
Economic Review • 4/2016 64
As a result of revisions cumulative growth of real GDP in the 2000–2015 period came to 69.1 per cent against 66.5 per cent prior to revisions. Growth for the 2000–2008 period was reduced to 60.3 per cent from 61.1 per cent, the decline in 2009 was lower: -3.6 per cent against -4.2 per cent in 2008, growth for the 2009–2015 period was raised to 9.4 per cent from 7.9 per cent. Data for 2015 changed most significantly, since the revisions included additionally reported data for the year. Nominal GDP in 2015 was raised by BGN 2.2 billion amounting to BGN 88.6 billion and real annual growth by 0.6 percentage points to 3.6 per cent. The GDP structure by components of final use experienced significant changes. Based on data published prior to October 2016 revisions, net exports had the major contribution to growth in 2015, while the revised data suggest that growth was attributable mostly to private consump-tion. Annual growth of real GDP in the first half of 2016 was increased by 0.6 percentage points to 3.5 per cent. The contribution of private consumption to growth for this period decreased after the revisions compared with the data prior to revisions. This was offset by the higher contribution of net exports which was partly due to base effects.
NSI revisions prompted significant changes in historical data which are used by the BNB in preparing its macroeconomic forecast. As a result, the current macroeconomic forecast based on revised data and the forecast published in the Economic Review, issue 2 of 2016 are no longer comparable. Therefore, no comparison with the previous forecast has been made.
Revisions of real GDP growth data and components (13 October 2016 vis-Ў-vis 2 September 2016)
Asof13October2016 Asof2September2016 Revision(percentagepoints)
2014 20152016
(January–June)
2014 20152016
(January–June)
2014 20152016
(January–June)
Annual rate of change (per cent)
GDPatconstantprices 1.3 3.6 3.5 1.5 3.0 3.0 -0.2 0.6 0.6
Privateconsumption 2.7 4.5 1.8 2.7 0.8 2.4 0.0 3.7 -0.5
Governmentconsumption 0.1 1.4 -3.4 0.1 0.3 -3.3 0.1 1.1 0.0
Grossfixedcapitalformation 3.4 2.7 0.4 3.4 2.5 0.4 0.0 0.2 0.0
Exports(goodsandservices) 3.1 5.7 3.9 -0.1 7.6 4.4 3.2 -1.9 -0.5
Imports(goodsandservices) 5.2 5.4 1.9 1.5 4.4 3.5 3.6 1.0 -1.6
Contribution (percentage points)
Privateconsumption 1.7 2.8 1.2 1.7 0.5 1.5 0.0 2.3 -0.3
Governmentconsumption 0.0 0.2 -0.6 0.0 0.0 -0.6 0.0 0.2 -0.1
Grossfixedcapitalformation 0.7 0.6 0.1 0.7 0.5 0.1 0.0 0.0 0.0
Exports,net -1.3 0.1 1.5 -1.1 2.1 0.6 -0.2 -1.9 0.9
Sources: the NSI, BNB calculations.
Risks to the ForecastThe uncertainty surrounding the forecast is presented by assessment of risks. Risks to the economic growth outlook are balanced for 2016. Risk for the 2017–2018 period, however, are more in favour of weaker than projected growth. The still relatively weak oil prices, low cost of financing and current posi-tive sentiment observed in Bulgaria, remain preconditions for higher than projected consumption and in-vestment. However, negative risks to the external and domestic environment are significant and can cre-ate conditions for lower than expected real GDP growth. These risks arise from the heightened uncer-tainty surrounding negotiations over Brexit, uncertainty about the future US fiscal and monetary policy, pending elections in some countries which are Bulgaria’s major trading partners (Germany, France and the Netherlands), political instability in Italy and worsening economic situation in Turkey. Upcoming elec-tions in Bulgaria also create uncertainty. These factors could have negative impact on both external de-mand for Bulgarian goods and services and on investment activity in Bulgaria. The lower than expected investment in the private sector in turn can have a limiting effect on household consumption in terms
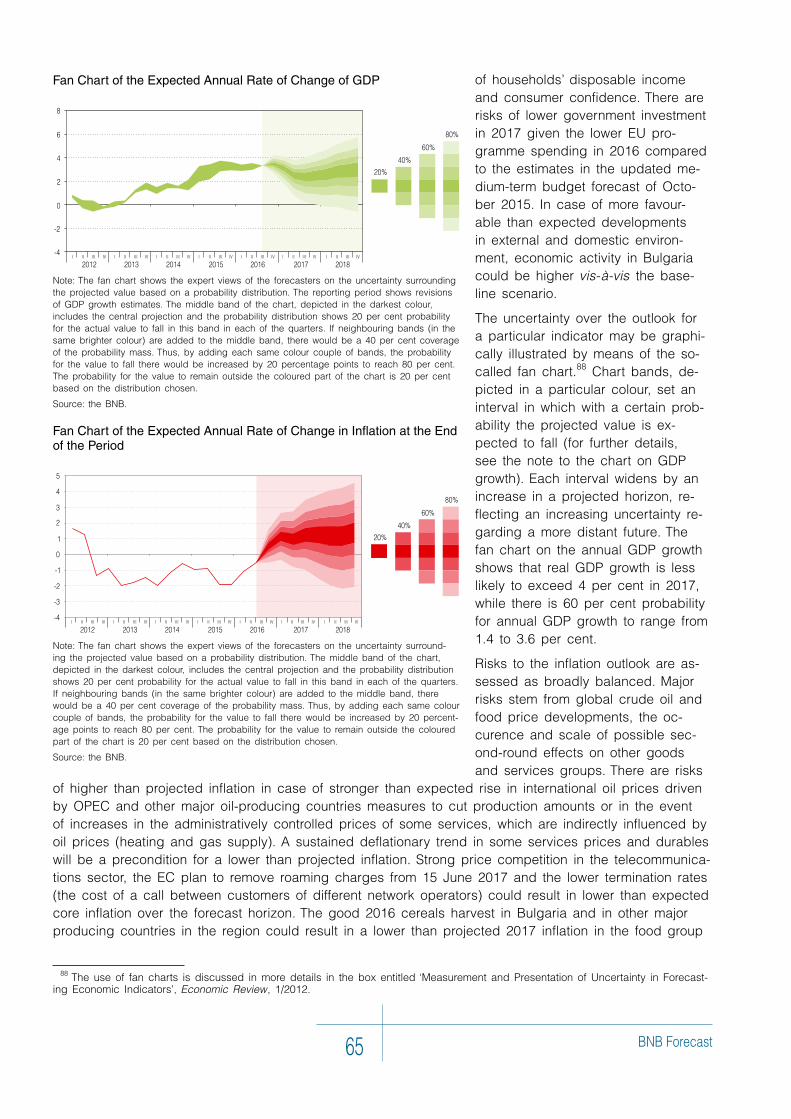
BNB Forecast65
of households’ disposable income and consumer confidence. There are risks of lower government investment in 2017 given the lower EU pro-gramme spending in 2016 compared to the estimates in the updated me-dium-term budget forecast of Octo-ber 2015. In case of more favour-able than expected developments in external and domestic environ-ment, economic activity in Bulgaria could be higher vis-Ў-vis the base-line scenario.
The uncertainty over the outlook for a particular indicator may be graphi-cally illustrated by means of the so-called fan chart.88 Chart bands, de-picted in a particular colour, set an interval in which with a certain prob-ability the projected value is ex-pected to fall (for further details, see the note to the chart on GDP growth). Each interval widens by an increase in a projected horizon, re-flecting an increasing uncertainty re-garding a more distant future. The fan chart on the annual GDP growth shows that real GDP growth is less likely to exceed 4 per cent in 2017, while there is 60 per cent probability for annual GDP growth to range from 1.4 to 3.6 per cent.
Risks to the inflation outlook are as-sessed as broadly balanced. Major risks stem from global crude oil and food price developments, the oc-curence and scale of possible sec-ond-round effects on other goods and services groups. There are risks
of higher than projected inflation in case of stronger than expected rise in international oil prices driven by OPEC and other major oil-producing countries measures to cut production amounts or in the event of increases in the administratively controlled prices of some services, which are indirectly influenced by oil prices (heating and gas supply). A sustained deflationary trend in some services prices and durables will be a precondition for a lower than projected inflation. Strong price competition in the telecommunica-tions sector, the EC plan to remove roaming charges from 15 June 2017 and the lower termination rates (the cost of a call between customers of different network operators) could result in lower than expected core inflation over the forecast horizon. The good 2016 cereals harvest in Bulgaria and in other major producing countries in the region could result in a lower than projected 2017 inflation in the food group
88 The use of fan charts is discussed in more details in the box entitled ‘Measurement and Presentation of Uncertainty in Forecast-ing Economic Indicators’, Economic Review, 1/2012.
Fan Chart of the Expected Annual Rate of Change of GDP
Note: The fan chart shows the expert views of the forecasters on the uncertainty surrounding the projected value based on a probability distribution. The reporting period shows revisions of GDP growth estimates. The middle band of the chart, depicted in the darkest colour, includes the central projection and the probability distribution shows 20 per cent probability for the actual value to fall in this band in each of the quarters. If neighbouring bands (in the same brighter colour) are added to the middle band, there would be a 40 per cent coverage of the probability mass. Thus, by adding each same colour couple of bands, the probability for the value to fall there would be increased by 20 percentage points to reach 80 per cent. The probability for the value to remain outside the coloured part of the chart is 20 per cent based on the distribution chosen.
Source: the BNB.
Fan Chart of the Expected Annual Rate of Change in Inflation at the End of the Period
Note: The fan chart shows the expert views of the forecasters on the uncertainty surround-ing the projected value based on a probability distribution. The middle band of the chart, depicted in the darkest colour, includes the central projection and the probability distribution shows 20 per cent probability for the actual value to fall in this band in each of the quarters. If neighbouring bands (in the same brighter colour) are added to the middle band, there would be a 40 per cent coverage of the probability mass. Thus, by adding each same colour couple of bands, the probability for the value to fall there would be increased by 20 percent-age points to reach 80 per cent. The probability for the value to remain outside the coloured part of the chart is 20 per cent based on the distribution chosen.
Source: the BNB.
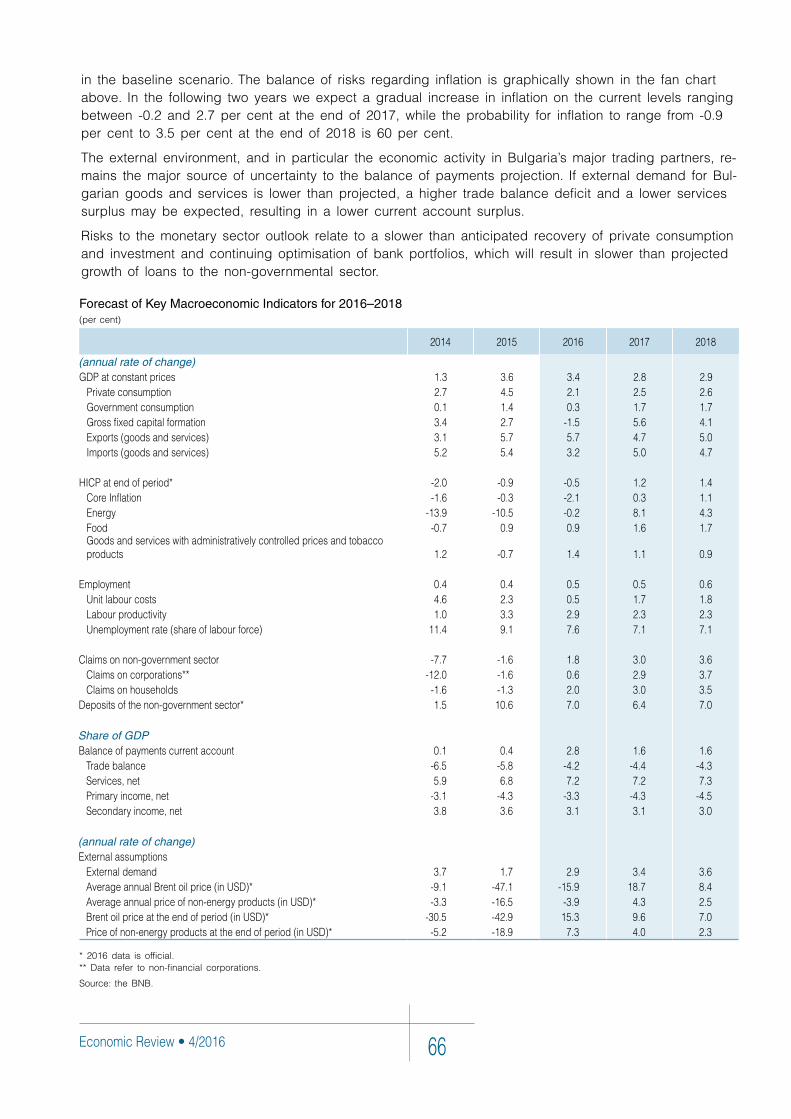
Economic Review • 4/2016 66
in the baseline scenario. The balance of risks regarding inflation is graphically shown in the fan chart above. In the following two years we expect a gradual increase in inflation on the current levels ranging between -0.2 and 2.7 per cent at the end of 2017, while the probability for inflation to range from -0.9 per cent to 3.5 per cent at the end of 2018 is 60 per cent.
The external environment, and in particular the economic activity in Bulgaria’s major trading partners, re-mains the major source of uncertainty to the balance of payments projection. If external demand for Bul-garian goods and services is lower than projected, a higher trade balance deficit and a lower services surplus may be expected, resulting in a lower current account surplus.
Risks to the monetary sector outlook relate to a slower than anticipated recovery of private consumption and investment and continuing optimisation of bank portfolios, which will result in slower than projected growth of loans to the non-governmental sector.
Forecast of Key Macroeconomic Indicators for 2016–2018(per cent)
2014 2015 2016 2017 2018
(annual rate of change)GDPatconstantprices 1.3 3.6 3.4 2.8 2.9
Privateconsumption 2.7 4.5 2.1 2.5 2.6Governmentconsumption 0.1 1.4 0.3 1.7 1.7Grossfixedcapitalformation 3.4 2.7 -1.5 5.6 4.1Exports(goodsandservices) 3.1 5.7 5.7 4.7 5.0Imports(goodsandservices) 5.2 5.4 3.2 5.0 4.7
HICPatendofperiod* -2.0 -0.9 -0.5 1.2 1.4CoreInflation -1.6 -0.3 -2.1 0.3 1.1Energy -13.9 -10.5 -0.2 8.1 4.3Food -0.7 0.9 0.9 1.6 1.7Goodsandserviceswithadministrativelycontrolledpricesandtobaccoproducts 1.2 -0.7 1.4 1.1 0.9
Employment 0.4 0.4 0.5 0.5 0.6Unitlabourcosts 4.6 2.3 0.5 1.7 1.8Labourproductivity 1.0 3.3 2.9 2.3 2.3Unemploymentrate(shareoflabourforce) 11.4 9.1 7.6 7.1 7.1
Claimsonnon-governmentsector -7.7 -1.6 1.8 3.0 3.6Claimsoncorporations** -12.0 -1.6 0.6 2.9 3.7Claimsonhouseholds -1.6 -1.3 2.0 3.0 3.5
Depositsofthenon-governmentsector* 1.5 10.6 7.0 6.4 7.0
Share of GDPBalanceofpaymentscurrentaccount 0.1 0.4 2.8 1.6 1.6
Tradebalance -6.5 -5.8 -4.2 -4.4 -4.3Services,net 5.9 6.8 7.2 7.2 7.3Primaryincome,net -3.1 -4.3 -3.3 -4.3 -4.5Secondaryincome,net 3.8 3.6 3.1 3.1 3.0
(annual rate of change)Externalassumptions
Externaldemand 3.7 1.7 2.9 3.4 3.6AverageannualBrentoilprice(inUSD)* -9.1 -47.1 -15.9 18.7 8.4Averageannualpriceofnon-energyproducts(inUSD)* -3.3 -16.5 -3.9 4.3 2.5Brentoilpriceattheendofperiod(inUSD)* -30.5 -42.9 15.3 9.6 7.0Priceofnon-energyproductsattheendofperiod(inUSD)* -5.2 -18.9 7.3 4.0 2.3
* 2016 data is official.** Data refer to non-financial corporations.
Source: the BNB.