Embed Size (px)
Citation preview
fib SAG7 - group A.2 - draft of chapter 4.2 (Holicky & Sykora)
1 Last modified: 26.10.2011
4.2 Partial factor method based on the design value ap-proach
2nd draft
Milan Holicky & Miroslav Sykora*
* Czech Technical University in Prague, Klokner Institute, Prague, Czech Republic
e-mail: [email protected]; [email protected]
4.2.1 General formulation
This section describes the application of the partial factor method (recommended in the Euro-codes for new structures) for the assessment of existing structures, using the design value ap-proach conforming to ISO 2394 (1998) and EN 1990 (2002). Partial factors derived in this section are intended to be applied in conjunction with load combination rules (6.10), or (6.10a,b) given in EN 1990 (2002). In case of structures without prestressing, the reliability verification format may be written as:
Rd ≥ Ed = ΣjγG,j Gk,j “+” γQ,1 Qk,1 “+” ΣiγQ,i ψ0,i Qk,i; j ≥ 1, i > 1 (4.2-1)
or, alternatively, the less favourable of the two following expressions:
Rd ≥ Ed = ΣjγG,j Gk,j “+” ΣiγQ,i ψ0,i Qk,i; j ≥ 1, i ≥ 1 (4.2-2a) Rd ≥ Ed = Σjξj γG,j Gk,j “+” γQ,1 Qk,1 “+” ΣiγQ,i ψ0,i Qk,i; j ≥ 1, i > 1 (4.2-2b)
where Rd(fck / γC, fyk / γS,…) is the design value of resistance, “+” implies “to be combined with”, Σ “the combined effect of” and ξ is a reduction factor for unfavourable permanent ac-tions G.
In order to apply the design value approach elaborated here, the characteristic values shall be assessed from actual distributions of basic material properties and actions (based on prior in-formation, or results of tests or the combination of both - see chapter ???). The partial factors for material properties and actions can be assessed using procedures described in this section. The values for the factors ξ and ψ0 provided in EN 1990 (2002) are also accepted for the as-sessment of existing structures.
fib SAG7
4.2.2 Material factors
The design value Rd of the resistance partial factor given by (4.1-10) may be assumed as a product of:
γM = γRd γm = γRd1 γRd2 γm
where γRd1 denotes the partial factor accounting for model uncertainty, accounting for geometrical uncertainties and ing for variability of the material
Values of γRd1 = 1.05 for concrete strength and sumed in common cases. However, instance in the case of punching shear where concrete crushing is governing.
A value of γRd2 = 1.05 may be assumed for size or reinforcement position. When relevant measurements on an existininsignificant variability of geometrical properties,
In case the design value method is applied, tshall be derived from the actual distribution of (based on prior information, or results of tests or the combination of bo
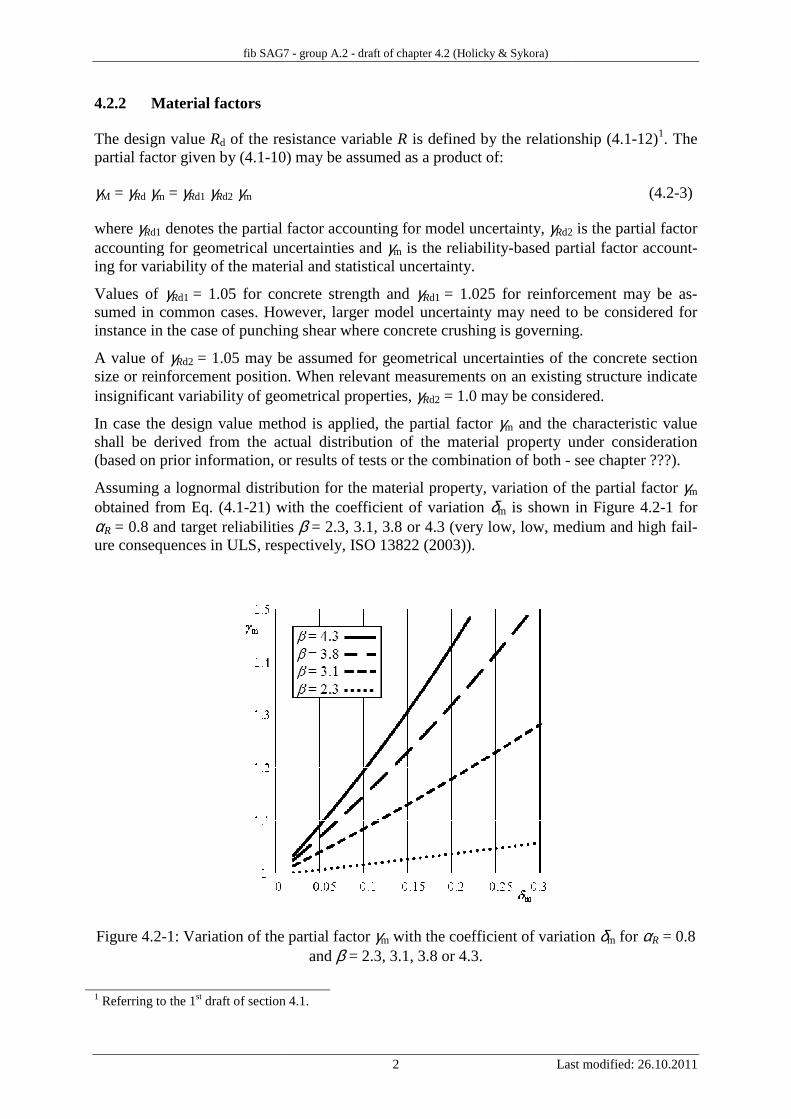
Assuming a lognormal distribution obtained from Eq. (4.1-21) with the coefficient of variation αR = 0.8 and target reliabilities ure consequences in ULS, respectively,
Figure 4.2-1: Variation of the partial factor
1 Referring to the 1st draft of section 4.1.
fib SAG7 - group A.2 - draft of chapter 4.2 (Holicky & Sykora)
2 Last
resistance variable R is defined by the relationship (4.110) may be assumed as a product of:
partial factor accounting for model uncertainty, γRd2
accounting for geometrical uncertainties and γm is the reliability-based partial factor accounmaterial and statistical uncertainty.
= 1.05 for concrete strength and γRd1 = 1.025 for reinforcement may be asumed in common cases. However, larger model uncertainty may need to be considered
punching shear where concrete crushing is governing.
1.05 may be assumed for geometrical uncertainties of thesize or reinforcement position. When relevant measurements on an existininsignificant variability of geometrical properties, γRd2 = 1.0 may be considered.
case the design value method is applied, the partial factor γm and the characteristic value actual distribution of the material property under consideration
(based on prior information, or results of tests or the combination of both -
lognormal distribution for the material property, variation of the partial factor 21) with the coefficient of variation δm is shown in Figure 4.2
= 0.8 and target reliabilities β = 2.3, 3.1, 3.8 or 4.3 (very low, low, medium ure consequences in ULS, respectively, ISO 13822 (2003)).
Variation of the partial factor γm with the coefficient of variation and β = 2.3, 3.1, 3.8 or 4.3.
draft of section 4.1.
Last modified: 26.10.2011
defined by the relationship (4.1-12)1. The
(4.2-3)
d2 is the partial factor partial factor account-
= 1.025 for reinforcement may be as-larger model uncertainty may need to be considered for
punching shear where concrete crushing is governing.
the concrete section size or reinforcement position. When relevant measurements on an existing structure indicate
= 1.0 may be considered.
the characteristic value under consideration see chapter ???).
material property, variation of the partial factor γm is shown in Figure 4.2-1 for
medium and high fail-
with the coefficient of variation δm for αR = 0.8
fib SAG7 - group A.2 - draft of chapter 4.2 (Holicky & Sykora)
3 Last modified: 26.10.2011
As an example, having measurements of geometrical properties and material properties yield-ing coefficients of variation of concrete strength and reinforcement δc = 0.15 and δs = 0.05, the following partial factors are obtained:
for β = 3.8: γC = 1.05 × 1.0 × 1.23 = 1.29; γS = 1.025 × 1.0 × 1.07 = 1.10 for β = 3.1: γS = 1.05 × 1.0 × 1.13 = 1.19; γS = 1.025 × 1.0 × 1.04 = 1.07 (4.2-4)
Note that the partial factor γC = 1.5 provided in EN 1992-1-1 (2004) has been derived consid-ering γRd1 = 1.05, γRd2 = 1.05, δc = 0.15, β = 3.8 and the additional uncertainty due to the fact that in structural design the concrete strength is assessed from samples not taken from a struc-ture (expressed by a conversion factor η ≈ 1.1). The partial factor γS = 1.15 provided in EN 1992-1-1 (2004) has been derived considering γRd1 = 1.025, γRd2 = 1.05, δs = 0.06 and β = 3.8.
4.2.3 Permanent action factor
The design value Gd of the permanent action effect G is defined by the general relationship (4.1-13). The partial factor given by (4.1-9) may be obtained as follows:
γG = γSd,g γg (4.2-5)
where γSd,g denotes the partial factor accounting for model uncertainty and γg is the reliability-based partial factor accounting for variability of the permanent action and the statistical uncer-tainty.
γSd,g = 1.05 is normally assumed in structural design. However, this value may be reduced to γSd,g = 1.0 when:
• the model of the permanent action effect is based on measurements and
• transformation from permanent action to its effect does not yield any significant un-certainties and
• there is no indication that the permanent action will considerably change in future.
In order to apply the design value method, the partial factor γG and the characteristic value shall be derived from the actual distribution of the permanent action under consideration (preferably based on measurements).
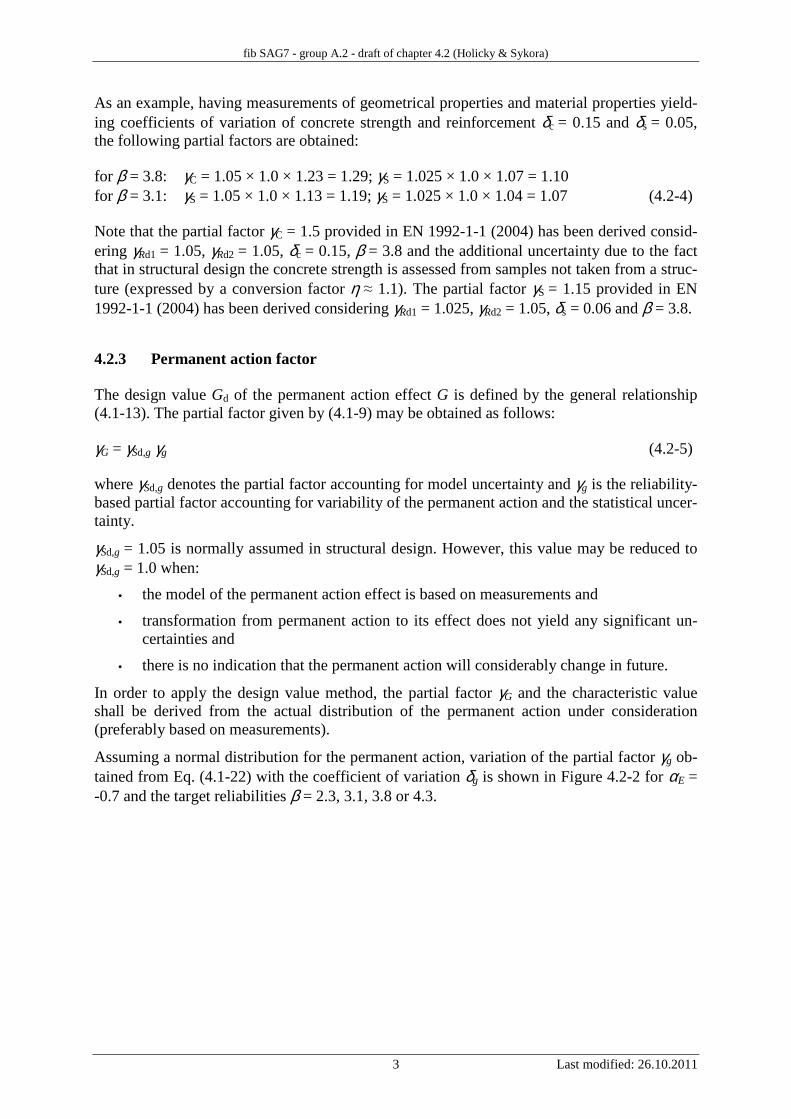
Assuming a normal distribution for the permanent action, variation of the partial factor γg ob-tained from Eq. (4.1-22) with the coefficient of variation δg is shown in Figure 4.2-2 for αE = -0.7 and the target reliabilities β = 2.3, 3.1, 3.8 or 4.3.
fib SAG7
Figure 4.2-2: Variation of the partial factor
As an example, assuming γSd,
and other permanent loads δg1
for β = 3.8: γG0 = 1.0 × 1.13 for β = 3.1: γG0 = 1.0 × 1.11
Note that the partial factor γG
γSd = 1.05, δg = 0.1 and β = 3.8
4.2.4 Variable action factor
In many cases no additional information on variable loadscodes for structural design, is tic values and partial factors for variable loads should such codes. However, if applicable the existing structure with respect to
When site- or structure-specific data on variable loads ment needs to be made, partial factors for variable loads may be derived using the procedure described in this section.
The partial factor for the variable load erence period tref may be obtained as
γQ = FQ,tref-1[Φ(-αE β), tref] / Qk
where FQ,tref-1 = inverse cumulative distribution function of maxima of the variable load effect
during the reference period tref
same reference period tref as used
fib SAG7 - group A.2 - draft of chapter 4.2 (Holicky & Sykora)
4 Last
: Variation of the partial factor γg with the coefficient of variation and β = 2.3, 3.1, 3.8 or 4.3.
d,g = 1.0 and coefficients of variation for self = 0.1, the following partial factors are obtained:
= 1.13; γG1 = 1.0 × 1.27 = 1.27 × 1.11 = 1.11; γG1 = 1.0 × 1.22 = 1.22
G = 1.35 given in EN 1990 (2002) has been derived considering = 3.8.
action factors
additional information on variable loads, except that is available in assessments of existing structures
tic values and partial factors for variable loads should then be based on recommendations of if applicable partial factors should be adjusted to a specific situation of
the existing structure with respect to assumed reliability levels, remaining working lives, etc.
specific data on variable loads can be gathered and needs to be made, partial factors for variable loads may be derived using the procedure
variable load effect Q related to the target reliability level may be obtained as follows:
k
= inverse cumulative distribution function of maxima of the variable load effect ref. The distribution of the load maxima should be based on the
used for the reliability index β, EN 1990 (2002)
Last modified: 26.10.2011
with the coefficient of variation δg for αE = -0.7
self-weight δg0 = 0.05 , the following partial factors are obtained:
(4.2-6)
has been derived considering
, except that provided by valid of existing structures. The characteris-
be based on recommendations of specific situation of
reliability levels, remaining working lives, etc.
and a detailed assess-needs to be made, partial factors for variable loads may be derived using the procedure
related to the target reliability level β and ref-
(4.2-7)
= inverse cumulative distribution function of maxima of the variable load effect istribution of the load maxima should be based on the
EN 1990 (2002).
fib SAG7 - group A.2 - draft of chapter 4.2 (Holicky & Sykora)
5 Last modified: 26.10.2011
In general the remaining working life tr may differ from the reference period tref. Nevertheless, for existing structures exposed to deterioration, it is mostly required to consider tref equal to tr. Note that the target reliability index β may be specified independently of the remaining work-ing life, Holický & Sýkora (2011).
In common cases EN 1990 (2002) allows to approximate the sensitivity factor αE by the value -0.7 for the leading variable action and by -0.28 for an accompanying variable action. How-ever, available measurements may often lead to reduction of uncertainties related to resistance and permanent action effect when assessing existing structures. Then, the sensitivity factors for the resistance and permanent actions decrease and the absolute values of the sensitivity factor for the variable actions increase. However, this case-specific effect can only be treated by a full-probabilistic approach and thus is not further considered in this bulletin.
In general the variable load effect depends on the time-variant component q(t) and on the time-invariant component C0 (including model uncertainties). In most cases the maxima of the load effect related to tref can be obtained as a product of both components:
Qtref = C0 × maxtref[q(t)] = C0 × qtref (4.2-8)
Indicative probabilistic models for the time-invariant and time-variant components of selected variable loads are given in Table 4.2-1, JCSS (2006), Holický & Sýkora (2011) and Holický et al. (2009). More detailed data (e.g. for imposed loads in common types of buildings) are provided by JCSS (2006). The models in Table 4.2-1 should be considered as informative and should always be carefully revised taking into account actual loading, structural conditions, and experimental data relevant for a particular structure.
Table 4.2-1: Indicative probabilistic models of selected variable loads.
X Variable Distr. µX / Xk δX
C0W
vb W
Time-invariant component of the wind action including model uncertainties Annual maxima of the basic wind velocity Annual maxima of the basic wind pressure
LN
LN* Gum
0.65
~ 1 / {1 - δvb[0.45 + 0.78ln(-ln 0.98)]} ~ (1 + δvb
2) / {1 - δvb[0.45 + 0.78ln(-ln 0.98)]}2
0.3
** ***
C0S
S
Time-invariant component of the snow load including model uncertainties Annual maxima of snow load on the ground
LN
Gum
1
~ 1 / {1 - δS[0.45 + 0.78ln(-ln 0.98)]}
0.15
**
C0Q Q
Model uncertainty in the load effect 5-year maxima of the imposed load
LN Gum
1 0.2
0.1 1.1
C0T
T
Time-invariant component of the traffic load on road bridges including model uncertainties Annual maxima of traffic load on road bridges
LN
Gum
1
0.9
0.15
0.03
* Three-parameter lognormal distribution. ** Should be based on meteorological data. Some indicative values of VS: 0.6-0.7 (lowlands in the Czech Repub-lic), 0.4-0.6 (mountains in the Czech Republic). Value of Vvb should always be based on local meteorological data since it is dependent on terrain roughness, orography and altitude. *** δW ≈ δvb (4 - δvb
2 + 6δvbωvb)0.5 / (1 + δvb
2) where ω denotes a sample skewness (in the case of insufficient data, Gumbel distribution may be assumed and ωvb = 1.14 may be considered).
fib SAG7 - group A.2 - draft of chapter 4.2 (Holicky & Sykora)
6 Last modified: 26.10.2011
Assuming the Gumbel distribution of the time-variant component, the mean of qtref is obtained as:
µq,tref = µq + 0.78σq ln (tref / t0) (4.2-9)
where t0 is the basic reference period for q(t) (e.g. 1 year for climatic loads, 5 years for im-posed loads). The standard deviation remains the same, i.e. σq = σq,tref. Note that other theo-retical models such as a three-parameter lognormal distribution may be more suitable than the Gumbel distribution for some variable loads.
In many cases it can be considered – as an approximation – that Qtref has a Gumbel distribu-tion with the following parameters:
µQ,tref ≈ µC0 µq,tref; δQ,tref ≈ √( δC02 + δq,tref
2 + δC02 δq,tref
2) (4.2-10)
where δq,tref = σq / µq,tref. Consequently, the partial factor is assessed as:
γQ ≈ (µQ,tref / Qk) × [1 - δQ,tref(0.45 + 0.78ln(-ln Φ(-αEβt)))] (4.2-11)
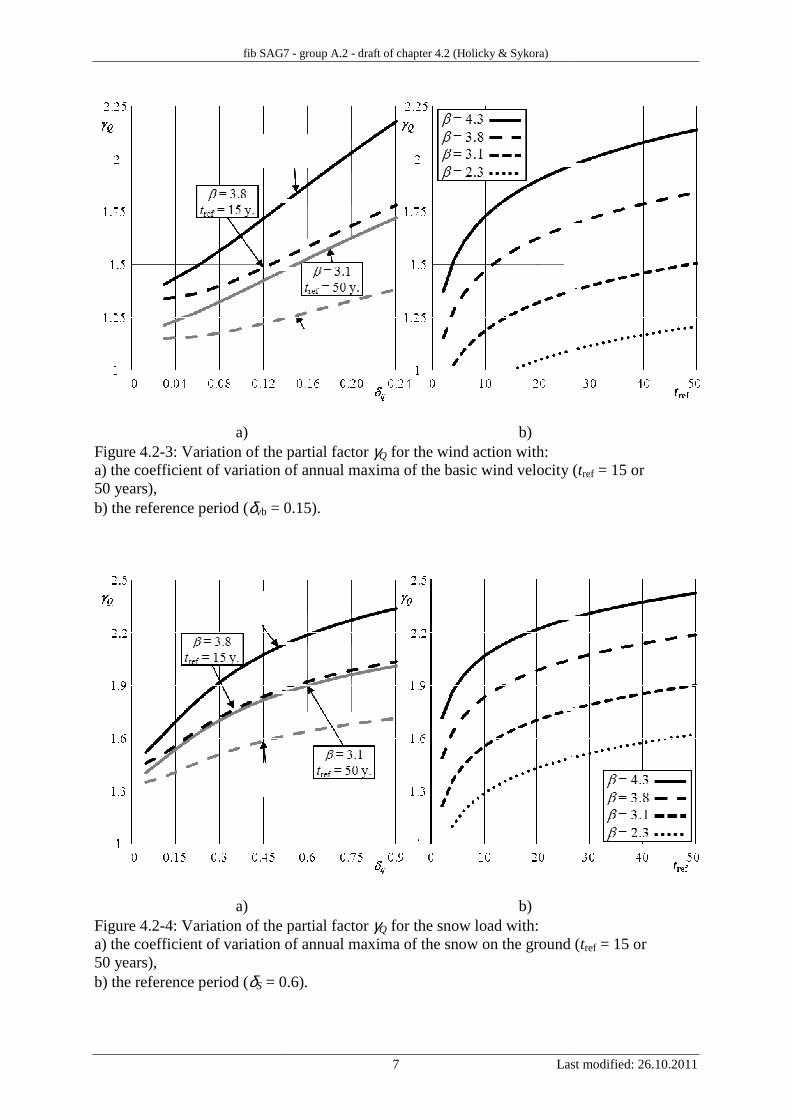
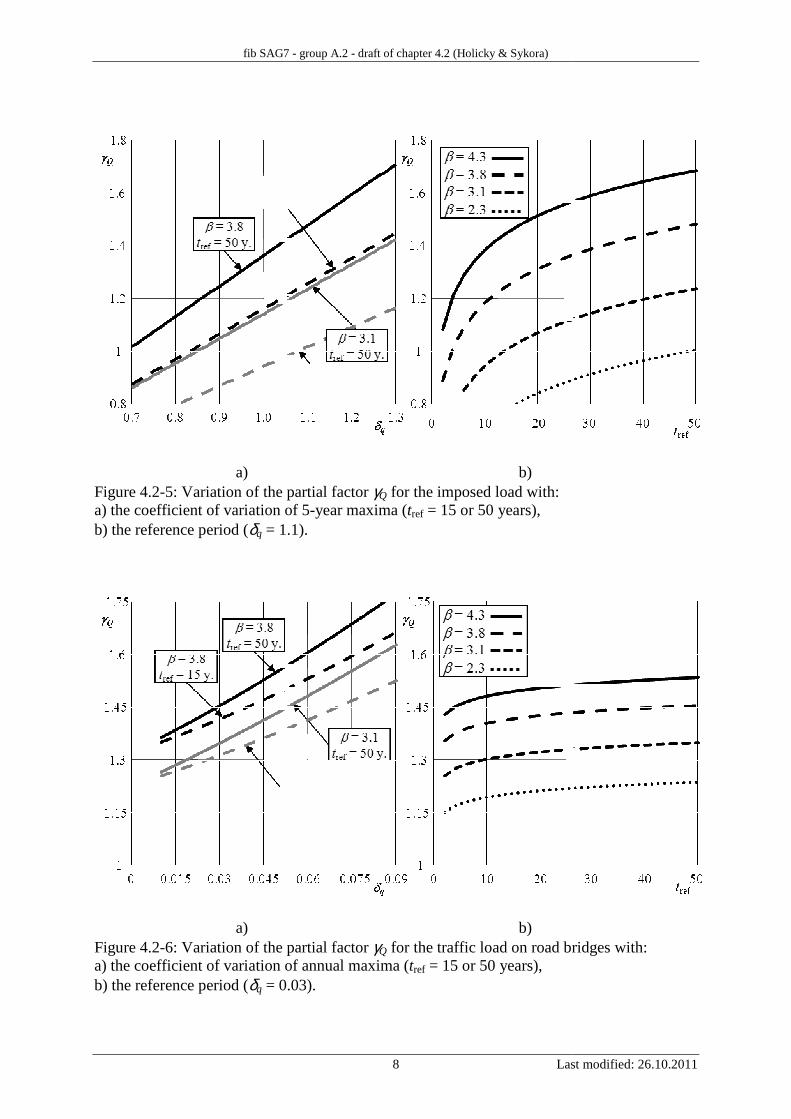
where Qk is the characteristic value applied in the assessment. Considering the probabilistic models given in Table 4.2-1, the partial factors γQ obtained by (4.2-7) are shown in Figures 4.2-3 to 4.2-6 for various coefficients of variation δq and different tref, different β and αE = -0.7.
It is emphasised that the partial factors are significantly dependent on the assumed probabilis-tic models. In the reliability verification of a particular structure, probabilistic models should be carefully specified taking into account actual loading, structural conditions, and relevant experimental data. More detailed analysis should be based on a full-probabilistic approach.
fib SAG7
a) Figure 4.2-3: Variation of the partial factor a) the coefficient of variation of annual maxima 50 years), b) the reference period (δvb = 0.
a) Figure 4.2-4: Variation of the partial factor a) the coefficient of variation of annual maxima of the snow on the ground (50 years), b) the reference period (δS = 0.6).
fib SAG7 - group A.2 - draft of chapter 4.2 (Holicky & Sykora)
7 Last
b) 3: Variation of the partial factor γQ for the wind action with:
of annual maxima of the basic wind velocity
= 0.15).
b) 4: Variation of the partial factor γQ for the snow load with:
coefficient of variation of annual maxima of the snow on the ground (
= 0.6).
Last modified: 26.10.2011
of the basic wind velocity (tref = 15 or
coefficient of variation of annual maxima of the snow on the ground (tref = 15 or
fib SAG7
a) Figure 4.2-5: Variation of the partial factor a) the coefficient of variation of 5b) the reference period (δq = 1.1).
a) Figure 4.2-6: Variation of the partial factor a) the coefficient of variation of annual maxima (b) the reference period (δq = 0.03).
fib SAG7 - group A.2 - draft of chapter 4.2 (Holicky & Sykora)
8 Last
b) 5: Variation of the partial factor γQ for the imposed load with:
a) the coefficient of variation of 5-year maxima (tref = 15 or 50 years), = 1.1).
b) 6: Variation of the partial factor γQ for the traffic load on road bridges with:
a) the coefficient of variation of annual maxima (tref = 15 or 50 years), = 0.03).
Last modified: 26.10.2011
for the traffic load on road bridges with:
fib SAG7 - group A.2 - draft of chapter 4.2 (Holicky & Sykora)
9 Last modified: 26.10.2011
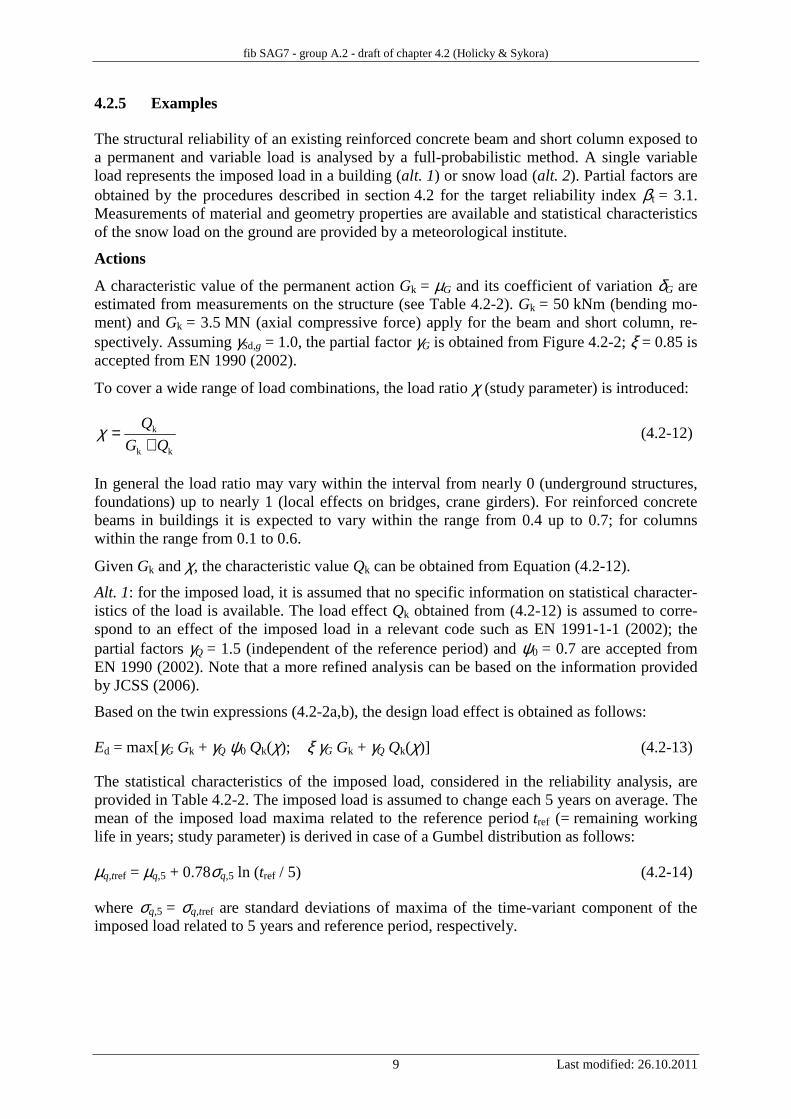
4.2.5 Examples
The structural reliability of an existing reinforced concrete beam and short column exposed to a permanent and variable load is analysed by a full-probabilistic method. A single variable load represents the imposed load in a building (alt. 1) or snow load (alt. 2). Partial factors are obtained by the procedures described in section 4.2 for the target reliability index βt = 3.1. Measurements of material and geometry properties are available and statistical characteristics of the snow load on the ground are provided by a meteorological institute.
Actions
A characteristic value of the permanent action Gk = µG and its coefficient of variation δG are estimated from measurements on the structure (see Table 4.2-2). Gk = 50 kNm (bending mo-ment) and Gk = 3.5 MN (axial compressive force) apply for the beam and short column, re-spectively. Assuming γSd,g = 1.0, the partial factor γG is obtained from Figure 4.2-2; ξ = 0.85 is accepted from EN 1990 (2002).
To cover a wide range of load combinations, the load ratio χ (study parameter) is introduced:
kk
k
QG
Q
+=χ (4.2-12)
In general the load ratio may vary within the interval from nearly 0 (underground structures, foundations) up to nearly 1 (local effects on bridges, crane girders). For reinforced concrete beams in buildings it is expected to vary within the range from 0.4 up to 0.7; for columns within the range from 0.1 to 0.6.
Given Gk and χ, the characteristic value Qk can be obtained from Equation (4.2-12).
Alt. 1: for the imposed load, it is assumed that no specific information on statistical character-istics of the load is available. The load effect Qk obtained from (4.2-12) is assumed to corre-spond to an effect of the imposed load in a relevant code such as EN 1991-1-1 (2002); the partial factors γQ = 1.5 (independent of the reference period) and ψ0 = 0.7 are accepted from EN 1990 (2002). Note that a more refined analysis can be based on the information provided by JCSS (2006).
Based on the twin expressions (4.2-2a,b), the design load effect is obtained as follows:
Ed = max[γG Gk + γQ ψ0 Qk(χ); ξ γG Gk + γQ Qk(χ)] (4.2-13)
The statistical characteristics of the imposed load, considered in the reliability analysis, are provided in Table 4.2-2. The imposed load is assumed to change each 5 years on average. The mean of the imposed load maxima related to the reference period tref (= remaining working life in years; study parameter) is derived in case of a Gumbel distribution as follows:
µq,tref = µq,5 + 0.78σq,5 ln (tref / 5) (4.2-14)
where σq,5 = σq,tref are standard deviations of maxima of the time-variant component of the imposed load related to 5 years and reference period, respectively.
fib SAG7 - group A.2 - draft of chapter 4.2 (Holicky & Sykora)
10 Last modified: 26.10.2011
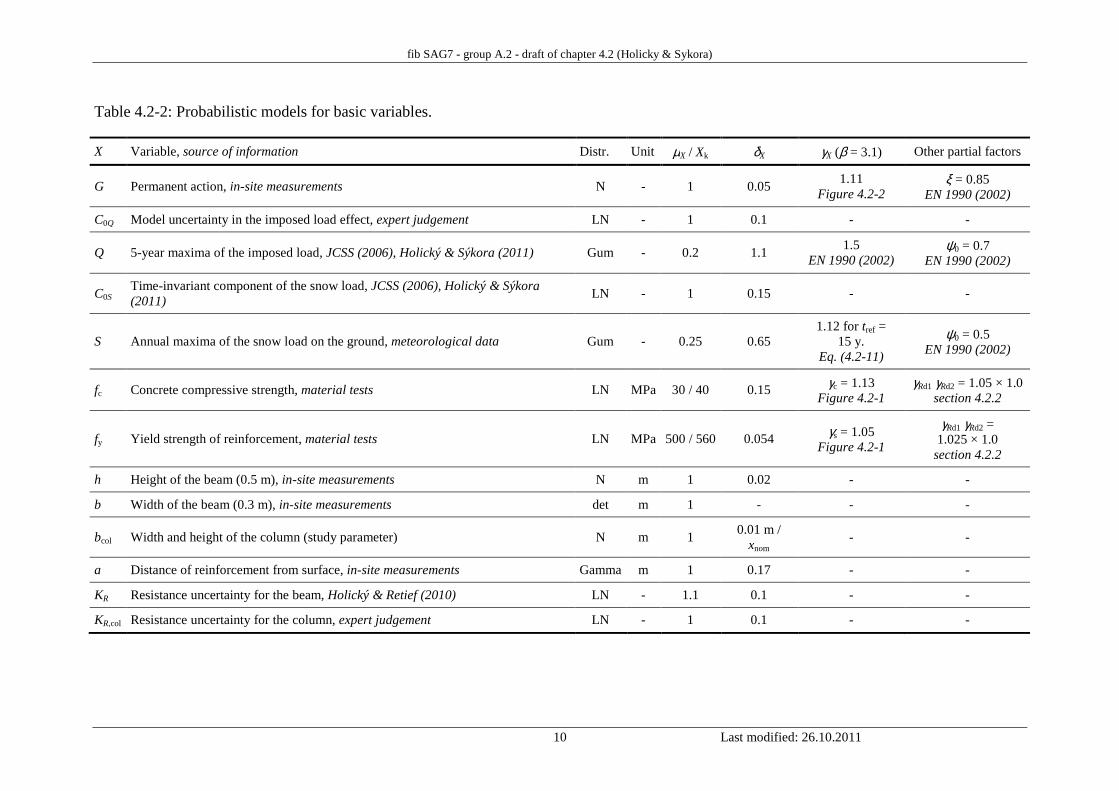
Table 4.2-2: Probabilistic models for basic variables.
X Variable, source of information Distr. Unit µX / Xk δX γX (β = 3.1) Other partial factors
G Permanent action, in-site measurements N - 1 0.05 1.11
Figure 4.2-2 ξ = 0.85
EN 1990 (2002)
C0Q Model uncertainty in the imposed load effect, expert judgement LN - 1 0.1 - -
Q 5-year maxima of the imposed load, JCSS (2006), Holický & Sýkora (2011) Gum - 0.2 1.1 1.5
EN 1990 (2002) ψ0 = 0.7
EN 1990 (2002)
C0S Time-invariant component of the snow load, JCSS (2006), Holický & Sýkora (2011)
LN - 1 0.15 - -
S Annual maxima of the snow load on the ground, meteorological data Gum - 0.25 0.65 1.12 for tref =
15 y. Eq. (4.2-11)
ψ0 = 0.5 EN 1990 (2002)
fc Concrete compressive strength, material tests LN MPa 30 / 40 0.15 γc = 1.13 Figure 4.2-1
γRd1 γRd2 = 1.05 × 1.0 section 4.2.2
fy Yield strength of reinforcement, material tests LN MPa 500 / 560 0.054 γs = 1.05 Figure 4.2-1
γRd1 γRd2 = 1.025 × 1.0 section 4.2.2
h Height of the beam (0.5 m), in-site measurements N m 1 0.02 - -
b Width of the beam (0.3 m), in-site measurements det m 1 - - -
bcol Width and height of the column (study parameter) N m 1 0.01 m /
xnom - -
a Distance of reinforcement from surface, in-site measurements Gamma m 1 0.17 - -
KR Resistance uncertainty for the beam, Holický & Retief (2010) LN - 1.1 0.1 - -
KR,col Resistance uncertainty for the column, expert judgement LN - 1 0.1 - -
fib SAG7 - group A.2 - draft of chapter 4.2 (Holicky & Sykora)
11 Last modified: 26.10.2011
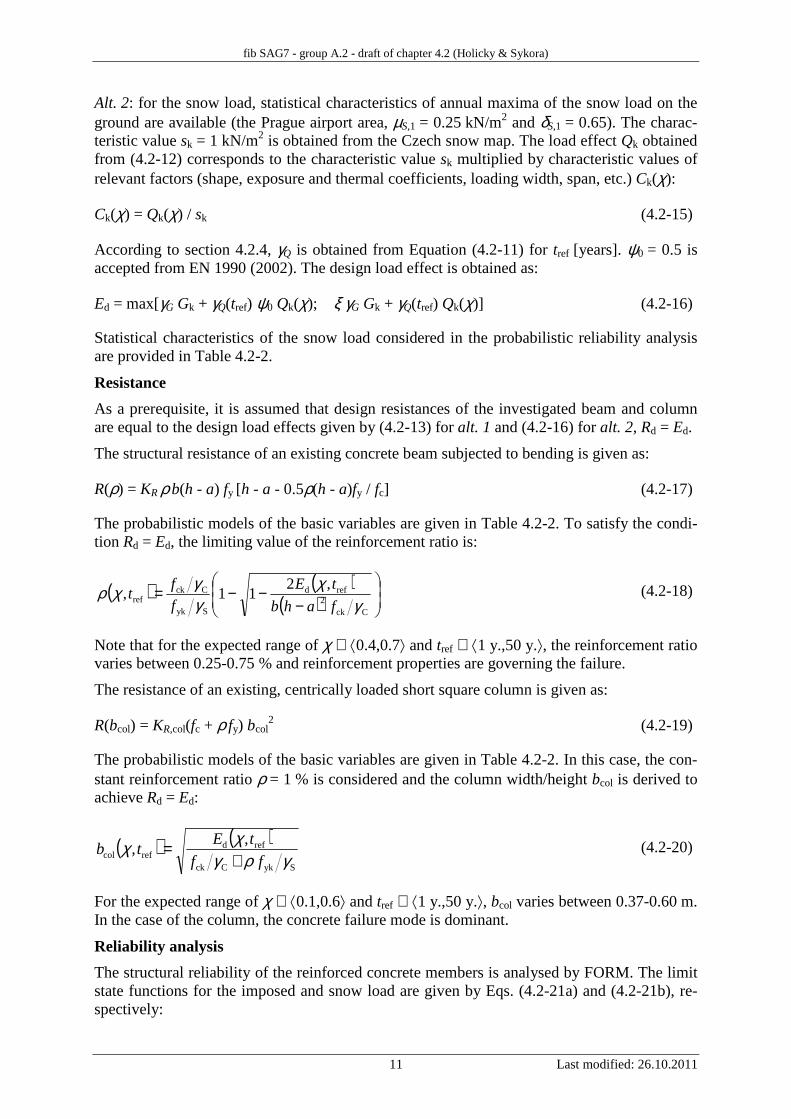
Alt. 2: for the snow load, statistical characteristics of annual maxima of the snow load on the ground are available (the Prague airport area, µS,1 = 0.25 kN/m2 and δS,1 = 0.65). The charac-teristic value sk = 1 kN/m2 is obtained from the Czech snow map. The load effect Qk obtained from (4.2-12) corresponds to the characteristic value sk multiplied by characteristic values of relevant factors (shape, exposure and thermal coefficients, loading width, span, etc.) Ck(χ):
Ck(χ) = Qk(χ) / sk (4.2-15)
According to section 4.2.4, γQ is obtained from Equation (4.2-11) for tref [years]. ψ0 = 0.5 is accepted from EN 1990 (2002). The design load effect is obtained as:
Ed = max[γG Gk + γQ(tref) ψ0 Qk(χ); ξ γG Gk + γQ(tref) Qk(χ)] (4.2-16)
Statistical characteristics of the snow load considered in the probabilistic reliability analysis are provided in Table 4.2-2.
Resistance
As a prerequisite, it is assumed that design resistances of the investigated beam and column are equal to the design load effects given by (4.2-13) for alt. 1 and (4.2-16) for alt. 2, Rd = Ed.
The structural resistance of an existing concrete beam subjected to bending is given as:
R(ρ) = KR ρ b(h - a) fy [h - a - 0.5ρ(h - a)fy / fc] (4.2-17)
The probabilistic models of the basic variables are given in Table 4.2-2. To satisfy the condi-tion Rd = Ed, the limiting value of the reinforcement ratio is:
( ) ( )( )
−−−=
Cck2
refd
Syk
Cckref
,211,
γχ
γγχρ
fahb
tE
f
ft (4.2-18)
Note that for the expected range of χ ∈ ⟨0.4,0.7⟩ and tref ∈ ⟨1 y.,50 y.⟩, the reinforcement ratio varies between 0.25-0.75 % and reinforcement properties are governing the failure.
The resistance of an existing, centrically loaded short square column is given as:
R(bcol) = KR,col(fc + ρ fy) bcol2 (4.2-19)
The probabilistic models of the basic variables are given in Table 4.2-2. In this case, the con-stant reinforcement ratio ρ = 1 % is considered and the column width/height bcol is derived to achieve Rd = Ed:
( ) ( )SykCck
refdrefcol
,,
γργχχ
ff
tEtb
+= (4.2-20)
For the expected range of χ ∈ ⟨0.1,0.6⟩ and tref ∈ ⟨1 y.,50 y.⟩, bcol varies between 0.37-0.60 m. In the case of the column, the concrete failure mode is dominant.
Reliability analysis
The structural reliability of the reinforced concrete members is analysed by FORM. The limit state functions for the imposed and snow load are given by Eqs. (4.2-21a) and (4.2-21b), re-spectively:
fib SAG7 - group A.2 - draft of chapter 4.2 (Holicky & Sykora)
12 Last modified: 26.10.2011
Z(X) = KR(col) R(χ,tref) - G - C0Q Qtr(χ) (4.2-21a) Z(X) = KR(col) R(χ,tref) - G - Ck(χ) C0S S (4.2-21b)
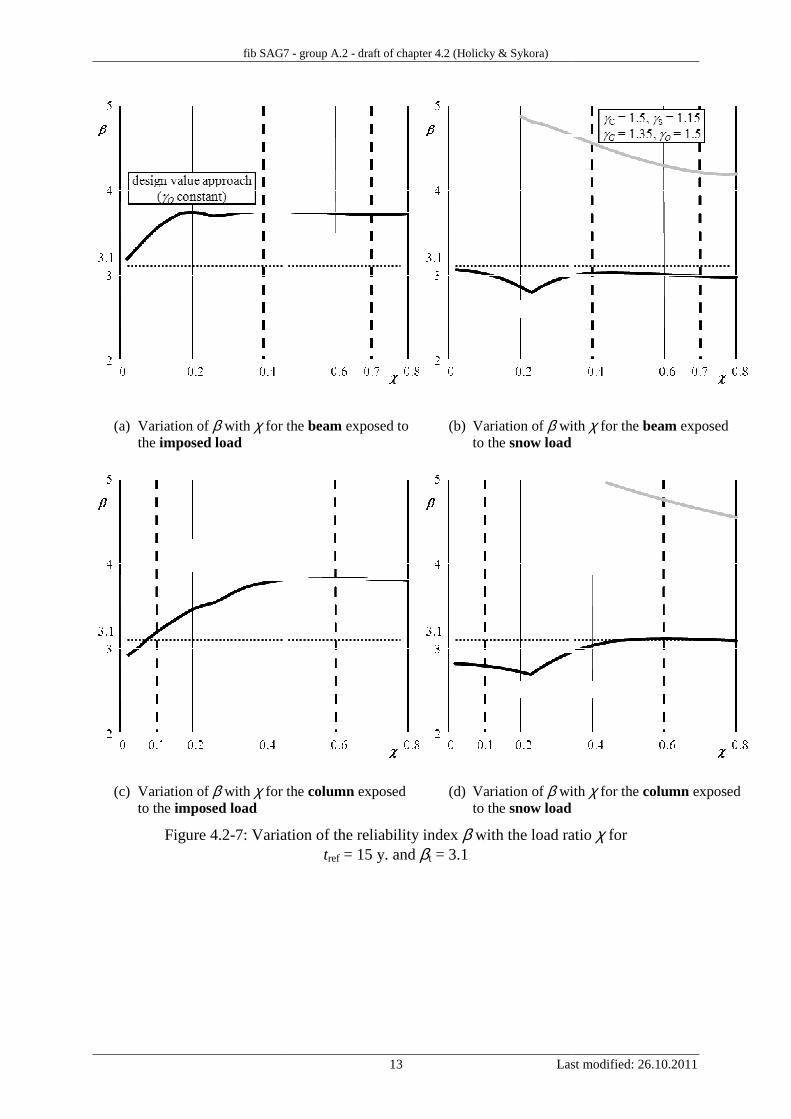
Figure 4.2-7 shows the variation of the reliability index β with the load ratio χ for tref = 15 y. and βt = 3.1. To indicate the benefits of applying the design value method, the reliability in-dex for an alternative set of the “codified” partial factors for new structures (i.e. γC = 1.5, γS = 1.15, γG = 1.35, γQ = 1.5), independent of χ and tref, is plotted for the beam exposed to the snow load.
It follows from Figure 4.2-7 that:
• In the case of snow load the design value method captures well random properties of the basic variables and the obtained β values are reasonably close to the target level. In the case of column rather lower reliability levels for small χ ratios can be attributed to the underestimated factors γRd that should be in this case slightly increased (by about 5 %).
• For the imposed load, higher reliabilities are obtained since acceptance of γQ = 1.5 seems to be rather conservative for tref = 15 y.
• Influences of the target reliability (βt = 3.1 here) and of information obtained from the measurements are not adequately covered when the alternative set of the partial factors is considered (particularly γG can be reduced when measurements indicate low vari-ability of G). Thus, relatively high reliability levels are obtained.
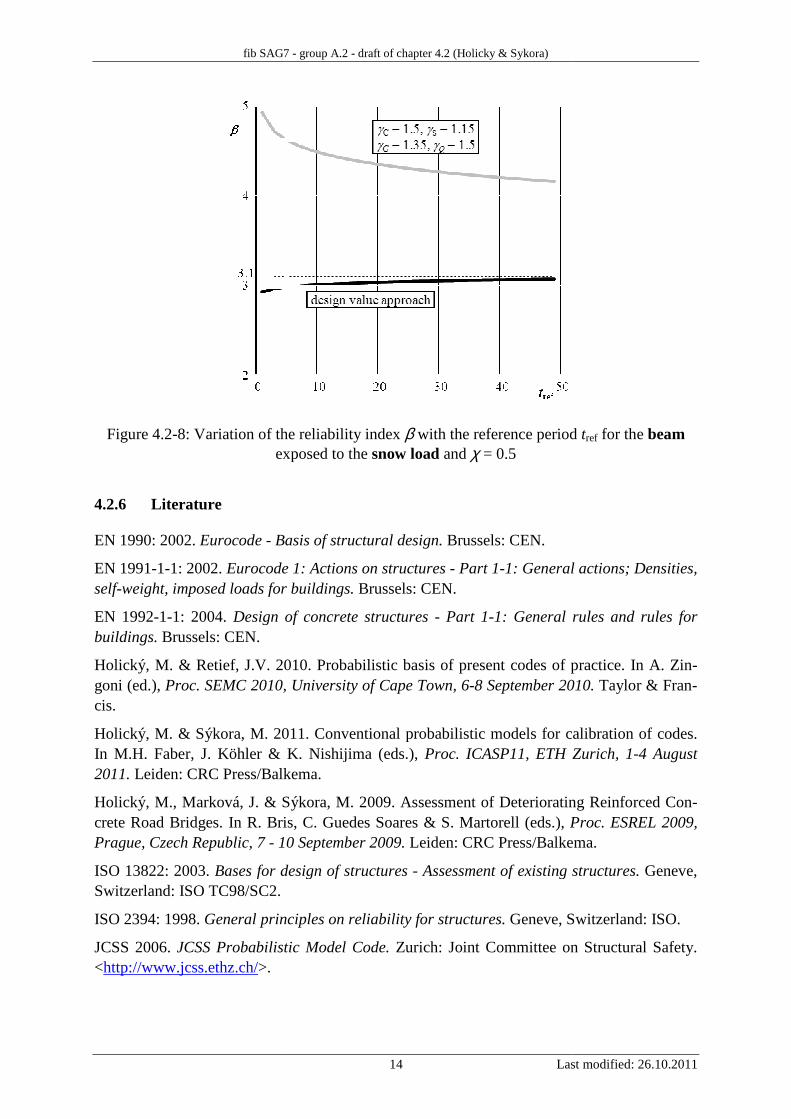
Figure 4.2-8 indicates variation of the reliability index β with the reference period tref for the beam exposed to the snow load and χ = 0.5. The design value method captures well influence of tref while the reliability is considerably decreasing with an increasing tref when the alterna-tive set of partial factors is considered.
Concluding remarks for the examples
The following conclusions may be drawn from the presented numerical examples:
• The structural reliability of reinforced concrete members verified by the design value approach is close to specified target reliability for any tref and χ.
• The effect of a reduced uncertainty due to measurements can be easily included.
fib SAG7
(a) Variation of β with χ for the the imposed load
(c) Variation of β with χ for the to the imposed load
Figure 4.2-7: Varia
fib SAG7 - group A.2 - draft of chapter 4.2 (Holicky & Sykora)
13 Last
for the beam exposed to (b) Variation of β with to the snow load
for the column exposed (d) Variation of β with to the snow load
Variation of the reliability index β with the load ratiotref = 15 y. and βt = 3.1
Last modified: 26.10.2011
with χ for the beam exposed
with χ for the column exposed
with the load ratio χ for
fib SAG7
Figure 4.2-8: Variation of the exposed to the
4.2.6 Literature
EN 1990: 2002. Eurocode - Basis of structural design.
EN 1991-1-1: 2002. Eurocode 1: Actions on structures self-weight, imposed loads for buildings.
EN 1992-1-1: 2004. Design of concrete structures buildings. Brussels: CEN.
Holický, M. & Retief, J.V. 2010. Probabilistic basis of present codes of practice. In A. Zigoni (ed.), Proc. SEMC 2010, University of Cape Town, 6cis.
Holický, M. & Sýkora, M. 2011. Conventional probabilistic models for calibration of codes. In M.H. Faber, J. Köhler & K. Nishijima (eds.), 2011. Leiden: CRC Press/Balkema.
Holický, M., Marková, J. & Sýkora, M. 2009. Assesscrete Road Bridges. In R. Bris, C. Guedes Soares & S. Martorell (eds.), Prague, Czech Republic, 7 - 10 September 2009.
ISO 13822: 2003. Bases for design of structures Switzerland: ISO TC98/SC2.
ISO 2394: 1998. General principles on reliability for structures.
JCSS 2006. JCSS Probabilistic Model Code. <http://www.jcss.ethz.ch/>.
fib SAG7 - group A.2 - draft of chapter 4.2 (Holicky & Sykora)
14 Last
the reliability index β with the reference period exposed to the snow load and χ = 0.5
Basis of structural design. Brussels: CEN.
Eurocode 1: Actions on structures - Part 1-1: General actions; Densities, weight, imposed loads for buildings. Brussels: CEN.
Design of concrete structures - Part 1-1: General rules and rules for
Holický, M. & Retief, J.V. 2010. Probabilistic basis of present codes of practice. In A. ZiProc. SEMC 2010, University of Cape Town, 6-8 September 2010.
ký, M. & Sýkora, M. 2011. Conventional probabilistic models for calibration of codes. In M.H. Faber, J. Köhler & K. Nishijima (eds.), Proc. ICASP11, ETH Zurich, 1
Leiden: CRC Press/Balkema.
Holický, M., Marková, J. & Sýkora, M. 2009. Assessment of Deteriorating Reinforced Cocrete Road Bridges. In R. Bris, C. Guedes Soares & S. Martorell (eds.), Proc. ESREL 2009,
10 September 2009. Leiden: CRC Press/Balkema.
Bases for design of structures - Assessment of existing structures.
General principles on reliability for structures. Geneve, Switzerland: ISO.
JCSS Probabilistic Model Code. Zurich: Joint Committee on Structural Safety.
Last modified: 26.10.2011
ference period tref for the beam
1: General actions; Densities,
1: General rules and rules for
Holický, M. & Retief, J.V. 2010. Probabilistic basis of present codes of practice. In A. Zin-8 September 2010. Taylor & Fran-
ký, M. & Sýkora, M. 2011. Conventional probabilistic models for calibration of codes. Proc. ICASP11, ETH Zurich, 1-4 August
ment of Deteriorating Reinforced Con-Proc. ESREL 2009,
Leiden: CRC Press/Balkema.
sment of existing structures. Geneve,
Geneve, Switzerland: ISO.
Zurich: Joint Committee on Structural Safety.

fib SAG7 - group A.2 - draft of chapter 4.2 (Holicky & Sykora)
15 Last modified: 26.10.2011

fib SAG7 - group A.2 - draft of chapter 4.2 (Holicky & Sykora)
16 Last modified: 26.10.2011
Working notes on further development
It should be clarified somewhere in the bulletin how to address the following:
1) statistical uncertainty related to small samples – influence on CoV (material proper-ties, permanent actions)
2) degradation aspects
3) which measurements should be taken to assess concrete strength
4) … the partial factor γm and the characteristic value shall be derived from the actual distribution of the material property under consideration (based on prior information, or results of tests or the combination of both)…
Other comments:
5) Load combinations (subsection 4.2.1) and splitting of the partial factors (e.g. model uncertainty * geometry * material – Eqs. (4.2-3) and (4.2-5)) could be incorporated in section 4.1 since it is likely to be the same for sections 4.2 and 4.3.
fib SAG7
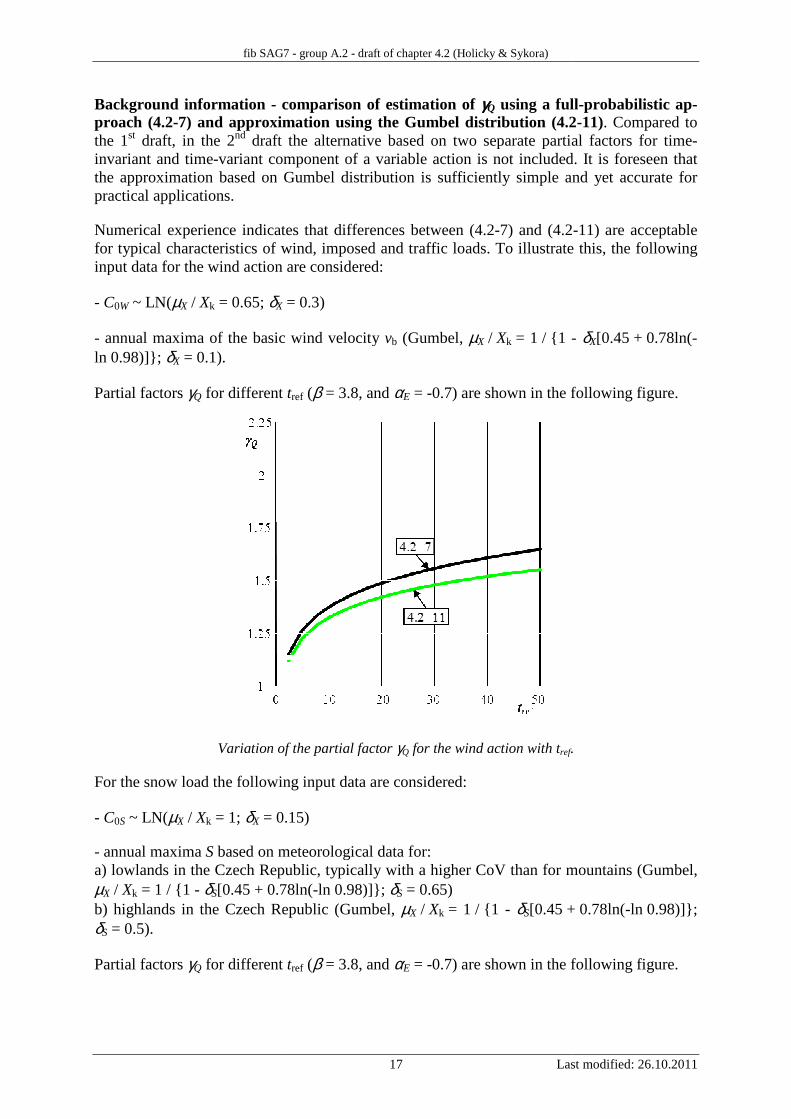
Background information - comparison of estimation of proach (4.2-7) and approximation usingthe 1st draft, in the 2nd draft the alternative based on invariant and time-variant component of a variable action is not includedthe approximation based on Gumbel distribution is sufficiently simple and yet accurate for practical applications.
Numerical experience indicates that differences for typical characteristics of wind, imposed and traffic loadsinput data for the wind action are considered:
- C0W ~ LN(µX / Xk = 0.65; δX
- annual maxima of the basic wind velocity ln 0.98)]}; δX = 0.1).
Partial factors γQ for different
Variation of the partial factor
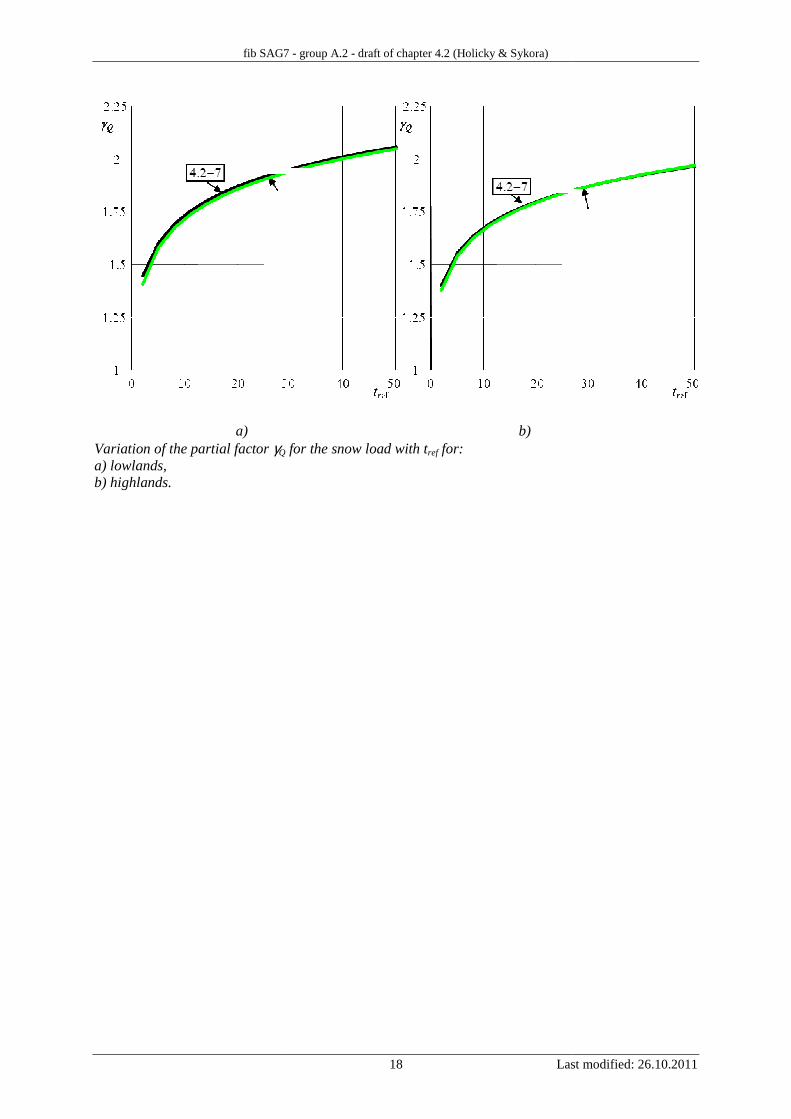
For the snow load the following input data
- C0S ~ LN(µX / Xk = 1; δX = 0.15)
- annual maxima S based on meteorological data for:a) lowlands in the Czech Republic, typically with a highµX / Xk = 1 / {1 - δS[0.45 + 0.78ln(b) highlands in the Czech Republic (δS = 0.5).
Partial factors γQ for different
fib SAG7 - group A.2 - draft of chapter 4.2 (Holicky & Sykora)
17 Last
comparison of estimation of γγγγQ using a fulland approximation using the Gumbel distribution (4.2
draft the alternative based on two separate partial factors variant component of a variable action is not included
pproximation based on Gumbel distribution is sufficiently simple and yet accurate for
Numerical experience indicates that differences between (4.2-7) and (4.2or typical characteristics of wind, imposed and traffic loads. To illustrate this, the following
input data for the wind action are considered:
= 0.3)
annual maxima of the basic wind velocity vb (Gumbel, µX / Xk = 1 / {1 -
for different tref (β = 3.8, and αE = -0.7) are shown in the following figure.
Variation of the partial factor γQ for the wind action with tref.
the following input data are considered:
= 0.15)
based on meteorological data for: a) lowlands in the Czech Republic, typically with a higher CoV than for mountains
0.78ln(-ln 0.98)]}; δS = 0.65) b) highlands in the Czech Republic (Gumbel, µX / Xk = 1 / {1 - δS[0.45 +
for different tref (β = 3.8, and αE = -0.7) are shown in the following figure.
Last modified: 26.10.2011
using a full-probabilistic ap-the Gumbel distribution (4.2-11). Compared to
two separate partial factors for time-variant component of a variable action is not included. It is foreseen that
pproximation based on Gumbel distribution is sufficiently simple and yet accurate for
) and (4.2-11) are acceptable To illustrate this, the following
- δX[0.45 + 0.78ln(-
0.7) are shown in the following figure.
.
er CoV than for mountains (Gumbel,
+ 0.78ln(-ln 0.98)]};
0.7) are shown in the following figure.
fib SAG7
a) Variation of the partial factor γQ a) lowlands, b) highlands.
fib SAG7 - group A.2 - draft of chapter 4.2 (Holicky & Sykora)
18 Last
b) for the snow load with tref for:
Last modified: 26.10.2011