Embed Size (px)
Citation preview
Procedia Environmental Science,
Engineering and Management
http://www.procedia-esem.eu
Procedia Environmental Science, Engineering and Management 2 (2015) (1) 51-62
18th International Trade Fair of Material & Energy Recovery and Sustainable Development, ECOMONDO, 5th-8th November, 2014, Rimini, Italy
MEASURING PERFORMANCE OF MUNICIPAL SOLID WASTE COLLECTION SERVICES
Andrea Guerrini1, Giulia Romano2, Chiara Leardini1
1Verona University, Department of Management, via dell’Artigliere 19, 37129 Verona, Italy
2University of Pisa, Department of Economics and Management, via C. Ridolfi 10, 56124 Pisa, Italy
Abstract Like other public services (water, energy and gas), Municipal Solid Waste (MSW) has been studied to observe the determinants of cost variations among environmental and operational variables. The current paper studies the determinants of efficiency in waste collection, observing 40 municipalities in the north-west of Verona province. Economic efficiency was measured using the ratio of costs to tons of waste collected per year, which was then related to eight operational and environmental variables that according to the literature could affect it. The quality of services was measured with waste separation percentage. The independent variables chosen reflect socio-demographic conditions and organizational choices. A key finding was that efficiency and quality of services increase when high density populated areas are served. Efficiency also increases with household density. Finally, curbside collection is more expensive than street bins, but the waste separation percentage achieved is higher and is positively affected by economies of experience. Keywords: efficiency, Italy, operational environment, partial frontier nonparametric methods, waste collection services
1. Introduction
In the last 20 years, the importance of Municipal Solid Waste (MSW) services has
increased sharply in developed countries. In Italy the annual per capita weight of waste produced increased by 22% in the ten years from 1995 to 2006, rising from 449 to 552 kg (Italian Institute of Statistics – ISTAT). This rapid growth required a series of reforms to improve efficiency and effectiveness of MSW management. Law 22/97 (“Ronchi Law”)
Selection and peer-review under responsibility of the ECOMONDO Corresponding author: [email protected]; Phone: 045/8028690; Fax 045/8028488
Guerrini et al./Procedia Environmental Science, Engineering and Management, 2, 2015, 1, 51-62
52
stipulates that waste handling, collection, recycling, disposal and energy generation in a specific area be provided by only one firm, selected by public tender, in order to exploit economies of scale, scope and vertical integration (D.lgs. 22/97 “Ronchi Law”, http://www.camera.it/parlam/leggi/deleghe/97022dl.htm)
To achieve efficiency, public utilities have various options, including technological innovations, job training, improved procurement policies and development of internal control systems aimed at effective and efficient corporate processes. Other options, such as firm size, investment diversification, vertical integration and population density, usually depend on the context in which the utility operates, so that they cannot be fully controlled by the managers and owners of the firm (Berg and Marques (2011) for water utilities; Kumbhakar and Hjalmarsson (1998) for electric retail services; Hollas et al. (2002) for gas distribution).
Like other public services (water, energy and gas), MSW has been studied to observe the determinants of cost variations among environmental and operational variables (Carvalho and Marques, 2010; De Jaeger et al., 2011; Jacobsen et al., 2013; Simões et al., 2010; 2012). Unlike the water sector, literature on MSW is fragmented (extensive analysis of the literature can be found in Simões and Marques, 2012). Although many authors have studied the effects of different variables on efficiency, the only factor extensively studied has been the ownership structure of waste utilities. The literature on MSW offers abundant evidence on the advantages and disadvantages of privatized waste utilities, however, as in other public sectors, the findings are not unanimous (Simões et al., 2012). Some authors report that private participation in waste management services is beneficial, as utilities are no longer under the control of politicians and use incentive mechanisms, such as performance evaluation, internal auditing and human resource management to improve efficiency (Berenyi and Stevens, 1988; Cubbin et al., 1987; Domberger et al., 1986; Jacobsen et al., 2013; McDavid, 1985; Savas, 1974; Szymanski and Wilkins, 1993; Szymanski, 1996). Other studies are inconclusive (Callan and Thomas, 2001; Collins and Downes, 1977; Garcìa-Sànchez, 2008; Hirsh, 1965; Simões et al., 2012) or support public ownership as a determinant of lower costs (Benito et al., 2010; Ohlsson, 2003; Pier et al., 1974). Studies focusing on other operational and environmental variables provide discordant results. Population density (population per square kilometer of area served), for instance, is a major environmental variable affecting waste utility performance. In a certain range, the higher the density, the greater the saving in costs, since a greater is weight collected at each pick-up point (Callan and Thomas, 2001; Carroll, 1995; Dubin and Navarro, 1988; Koushki et al., 2004). Other authors have demonstrated that this variable actually damages efficiency in certain situations (Benito et al., 2010; Benito et al., 2011; De Jaeger et al., 2011; Vishwakarma et al., 2012; Worthington and Dollery, 2001), since narrow densely populated streets may reduce the possibility of using large specialized equipment and must rely on less productive manual activities; moreover, the effect of traffic congestion may offset any cost saving gained covering shorter distances between pick-up points. According to Passarini et al. (2011) these characteristics also seem to have a negative effect on waste separation percentage, which is higher for example in the rural areas of Emilia Romagna (low population density) than elsewhere in the Region. Finally, Simões et al. (2012) recently demonstrated that cost efficiency was lower in sparsely populated rural areas as well as in densely populated towns.
Economies of scale and economies of scope are other variables that may influence the efficiency of waste utilities. Economies of scale exist when a unit increase in outputs results from a less than proportional increase in inputs (Silvestre, 1987). Dubin and Navarro (1988) found economies of scale in municipalities with populations of less than 20,000 persons. Callan and Thomas (2001) found product-specific scale economies for recycling services, while disposal activities showed constant returns to scale. As regards collection services, high cost savings have been reported for firms operating in large areas (Carvalho and
Measuring performance of municipal solid waste collection services
53
Marques, 2014; Vishwakarma et al., 2012; Worthington and Dollery, 2002). Thus larger municipalities exhibit better efficiencies, possibly implying better management and governance. Similarly, firms that are members of waste collection joint ventures collect and process MSW more efficiently than other firms (De Jaeger et al., 2011; Zamorano et al., 2011). On the other side, Carroll (1995) proved that recycling costs are not affected by the firm’s scale of operations. The same conclusion was reached by Marques et al. (2012). Similarly, Garcìa-Sànchez (2008) found that municipal population does not affect efficiency in Spanish municipalities with populations over 50,000.
Economies of scope occur when the average unit cost of producing two or more goods or services is lower than when they are produced or provided by separate entities (Panzar and Willig, 1981). For MSW these economies could arise when a single firm provides more than one service (e.g. collection, disposal and recycling). To the best of our knowledge, only Callan and Thomas (2001) and Simões et al. (2013) have researched economies of scope in the MSW sector. Callan and Thomas (2001) demonstrated that MSW shows economies of scope when disposal and recycling activities are carried out by the same firm: disposal services lower the marginal cost of recycling services and vice versa. Simões et al. (2013) found strong diseconomies of scope in combined waste, water and wastewater services in Portugal.
Two recent studies broadly explained the determinants of waste collection efficiency, expanding the set of observed variables (Benito et al., 2011; De Jaeger et al., 2011). The first authors showed a relationship between efficiency and per capita income, urban population density, an index of tourism and economic activity and the political orientation of the governing party. Adopting a robust nonparametric technique (Data Envelopment Analysis – DEA – double bootstrapped), this study demonstrated that high per capita income does not promote firm efficiency because greater taxation revenues can cover some inefficiencies. Furthermore, well-developed tourism and economic activities induce politicians and firm managers to maintain the municipal image, keeping the streets clean and avoiding any waste of resources: heaps of waste on the street seriously undermines such activities. However, this result is not consistent with prior studies: Bosch et al. (2000) and Garcìa-Sànchez (2008) backed the hypothesis that tourist flow has a negative effect on the ease of providing collection services. Benito et al. (2011) showed that municipalities governed by left-wing parties save more costs. These findings are confirmed by De Jaeger et al. (2011) who showed that changes in efficiency can also be due to socio-demographic conditions (such as the proportion of elderly and young households served). The study also examined the effect of pick-up frequency: unlike prior studies (Callan and Thomas, 2001; Distexhe, 1993; Hirsh, 1965), it did not confirm an adverse effect of this variable on efficiency.
This state of the art reveals the need to examine whether a wider set of operational and environmental variables might affect the efficiency of MSW collection services, confirming previous findings. The most appropriate methods (in particular nonparametric methods) have not always been used to investigate the influence of exogenous variables on the efficiency of Decision Making Units (DMU). We therefore applied a robust and more suitable nonparametric method to identify the influence of some major environmental variables on the efficiency of the 40 waste collection municipalities in the north-west of Verona province. The method consisted in estimating unconditional and conditional efficiency scores (on the environmental variables) and comparing them by smoothed nonparametric regression (Daraio and Simar, 2005).
Framework of the Italian waste sector. The method used to estimate efficiency and its determinants is illustrated in Section 3, followed by a description of the main characteristics of the municipalities The paper is organized as follows. Section 2 describes the market structure and regulatory in question. Section 4 presents the main results and Section 5 discusses the results and offers concluding remarks.
Guerrini et al./Procedia Environmental Science, Engineering and Management, 2, 2015, 1, 51-62
54
2. Data and method specification 2.1. The case studied
The dataset analyzed includes data on the solid waste collection services for 40 Italian municipalities in the region of Verona (all members of the consortium “Consorzio di Bacino Verona 2”) over a period of five years (2008-2012). The consortium was founded in 1997 by the municipalities of the western part of Verona Province, and its main aims are: organizing the collection, disposal and recycling of MSW; entrusting these activities to a separate legal entity; drafting a plan of the main future investments; controlling the municipalities by periodic analysis of collection and disposal costs, the quantity of waste “produced” and waste separation percentage.
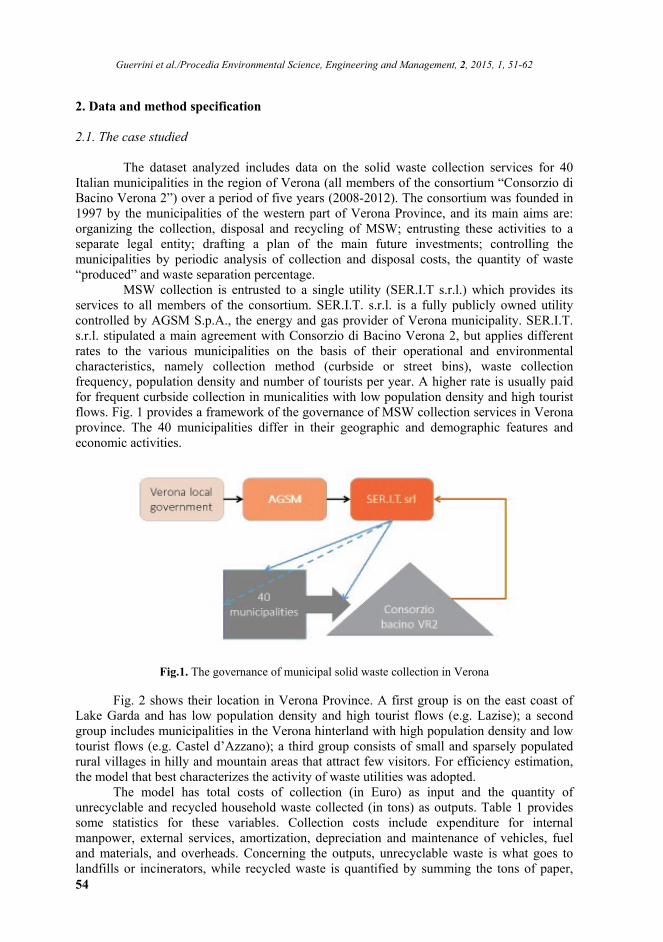
MSW collection is entrusted to a single utility (SER.I.T s.r.l.) which provides its services to all members of the consortium. SER.I.T. s.r.l. is a fully publicly owned utility controlled by AGSM S.p.A., the energy and gas provider of Verona municipality. SER.I.T. s.r.l. stipulated a main agreement with Consorzio di Bacino Verona 2, but applies different rates to the various municipalities on the basis of their operational and environmental characteristics, namely collection method (curbside or street bins), waste collection frequency, population density and number of tourists per year. A higher rate is usually paid for frequent curbside collection in municalities with low population density and high tourist flows. Fig. 1 provides a framework of the governance of MSW collection services in Verona province. The 40 municipalities differ in their geographic and demographic features and economic activities.
Fig.1. The governance of municipal solid waste collection in Verona
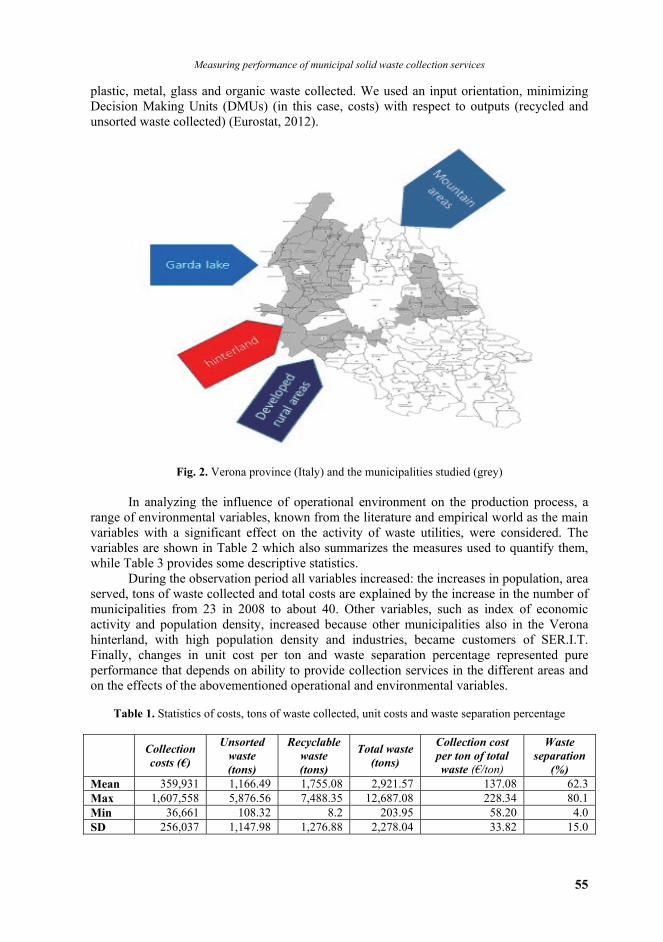
Fig. 2 shows their location in Verona Province. A first group is on the east coast of Lake Garda and has low population density and high tourist flows (e.g. Lazise); a second group includes municipalities in the Verona hinterland with high population density and low tourist flows (e.g. Castel d’Azzano); a third group consists of small and sparsely populated rural villages in hilly and mountain areas that attract few visitors. For efficiency estimation, the model that best characterizes the activity of waste utilities was adopted.
The model has total costs of collection (in Euro) as input and the quantity of unrecyclable and recycled household waste collected (in tons) as outputs. Table 1 provides some statistics for these variables. Collection costs include expenditure for internal manpower, external services, amortization, depreciation and maintenance of vehicles, fuel and materials, and overheads. Concerning the outputs, unrecyclable waste is what goes to landfills or incinerators, while recycled waste is quantified by summing the tons of paper,
Measuring performance of municipal solid waste collection services
55
plastic, metal, glass and organic waste collected. We used an input orientation, minimizing Decision Making Units (DMUs) (in this case, costs) with respect to outputs (recycled and unsorted waste collected) (Eurostat, 2012).
Fig. 2. Verona province (Italy) and the municipalities studied (grey) In analyzing the influence of operational environment on the production process, a
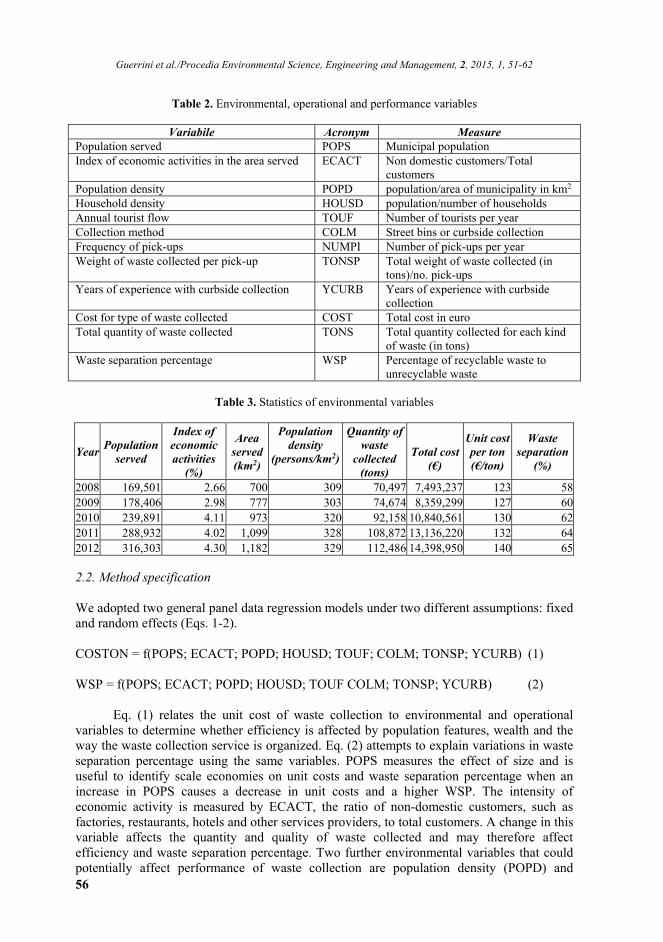
range of environmental variables, known from the literature and empirical world as the main variables with a significant effect on the activity of waste utilities, were considered. The variables are shown in Table 2 which also summarizes the measures used to quantify them, while Table 3 provides some descriptive statistics.
During the observation period all variables increased: the increases in population, area served, tons of waste collected and total costs are explained by the increase in the number of municipalities from 23 in 2008 to about 40. Other variables, such as index of economic activity and population density, increased because other municipalities also in the Verona hinterland, with high population density and industries, became customers of SER.I.T. Finally, changes in unit cost per ton and waste separation percentage represented pure performance that depends on ability to provide collection services in the different areas and on the effects of the abovementioned operational and environmental variables.
Table 1. Statistics of costs, tons of waste collected, unit costs and waste separation percentage
Collection costs (€)
Unsorted waste (tons)
Recyclable waste (tons)
Total waste (tons)
Collection cost per ton of total waste (€/ton)
Waste separation
(%) Mean 359,931 1,166.49 1,755.08 2,921.57 137.08 62.3 Max 1,607,558 5,876.56 7,488.35 12,687.08 228.34 80.1 Min 36,661 108.32 8.2 203.95 58.20 4.0 SD 256,037 1,147.98 1,276.88 2,278.04 33.82 15.0
Guerrini et al./Procedia Environmental Science, Engineering and Management, 2, 2015, 1, 51-62
56
Table 2. Environmental, operational and performance variables
Variabile Acronym Measure
Population served POPS Municipal population Index of economic activities in the area served ECACT Non domestic customers/Total
customers Population density POPD population/area of municipality in km2 Household density HOUSD population/number of households Annual tourist flow TOUF Number of tourists per year Collection method COLM Street bins or curbside collection Frequency of pick-ups NUMPI Number of pick-ups per year Weight of waste collected per pick-up TONSP Total weight of waste collected (in
tons)/no. pick-ups Years of experience with curbside collection YCURB Years of experience with curbside
collection Cost for type of waste collected COST Total cost in euro Total quantity of waste collected TONS Total quantity collected for each kind
of waste (in tons) Waste separation percentage WSP Percentage of recyclable waste to
unrecyclable waste
Table 3. Statistics of environmental variables
Year Population
served
Index of economic activities
(%)
Area served (km2)
Population density
(persons/km2)
Quantity of waste
collected (tons)
Total cost
(€)
Unit cost per ton (€/ton)
Waste separation
(%)
2008 169,501 2.66 700 309 70,497 7,493,237 123 582009 178,406 2.98 777 303 74,674 8,359,299 127 602010 239,891 4.11 973 320 92,158 10,840,561 130 622011 288,932 4.02 1,099 328 108,872 13,136,220 132 642012 316,303 4.30 1,182 329 112,486 14,398,950 140 65 2.2. Method specification We adopted two general panel data regression models under two different assumptions: fixed and random effects (Eqs. 1-2). COSTON = f(POPS; ECACT; POPD; HOUSD; TOUF; COLM; TONSP; YCURB) (1) WSP = f(POPS; ECACT; POPD; HOUSD; TOUF COLM; TONSP; YCURB) (2)
Eq. (1) relates the unit cost of waste collection to environmental and operational variables to determine whether efficiency is affected by population features, wealth and the way the waste collection service is organized. Eq. (2) attempts to explain variations in waste separation percentage using the same variables. POPS measures the effect of size and is useful to identify scale economies on unit costs and waste separation percentage when an increase in POPS causes a decrease in unit costs and a higher WSP. The intensity of economic activity is measured by ECACT, the ratio of non-domestic customers, such as factories, restaurants, hotels and other services providers, to total customers. A change in this variable affects the quantity and quality of waste collected and may therefore affect efficiency and waste separation percentage. Two further environmental variables that could potentially affect performance of waste collection are population density (POPD) and
Measuring performance of municipal solid waste collection services
57
household density (HOUSD) in a given area. Ideally, the higher the density, the greater the quantity of waste collected per km2 and per building: this should improve efficiency, while no clear effects are predictable for waste separation percentage. The last demographic variable is annual tourist flow (TOUF), which can damage the performance of waste utilities if the storage of waste generated by tourism (hotels, restaurants, bars, camping areas, tourist attractions and holiday accommodation) is not properly organized by a municipality. In these cases, the quantity of waste is seasonal and waste is inadequately separated into the different materials. Finally, three operational items were included in both models to represent the way the service is organized: the collection method (COLM), distinguishing between curbside and street bin collection, quantity collected per pick-up (TONSP), a productivity index for each area monitored, and the number of years curbside collection had been operating (YCURB), measuring a municipality’s experience with this method.
General panel data regression models help check for specific effects that are not measured by the explanatory variables and concern specific features of single firms and years. Two common assumptions (random-effects and fixed-effects assumptions) are made about specific effects. The random-effects assumption is that specific effects are unrelated to the independent variables. The fixed-effect assumption is that specific effects are related to the independent variables. If the random-effects assumption holds, the random-effects model is more efficient than the fixed-effects model. However, if this assumption does not hold, the random-effects model is not consistent. The Hausman test was used to determine whether to use the fixed-effects assumption (predicting different coefficients for each firm in the data set) or the random-effects assumption (predicting different coefficients for each firm in the dataset in a random manner) for datasets that included short time periods or had similar properties. The Hausman test assesses the following hypotheses: H0: fixed-effect estimates and random-effect estimates are equal; H1: fixed-effect estimates and random-effect estimates are different from each other.
If H0 is rejected, the random-effect model is inconsistent and a fixed - effect model must be applied; conversely, when H0 is accepted the former is consistent and efficient, while the latter is consistent but inefficient: in this case the random-effect assumption should be applied. A simple function of the panel data with a fixed effect is given by Eq. (3), where i are the individuals observed and t is time. Yit= αi+ βit*Xit+.….+ βkit*Xkit+eit, i=1, 2, 3, …N; t=1, 2, …T (3) The specific effects are fixed and are included among the independent variables as a specific constant (αi). In contrast, in the random-effects model the specific effects are considered a component of the error term (Eq. 4). Yit= βit*Xit+.….+ βkit*Xkit+eit, i=1, 2, 3, …N; t=1, 2, …T (4) 3. Results and discussion
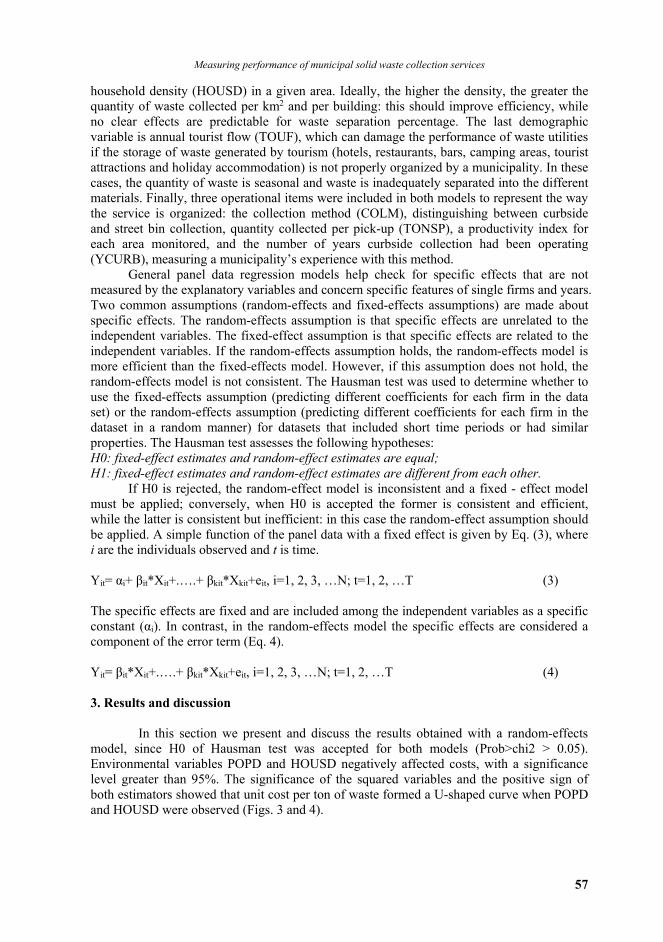
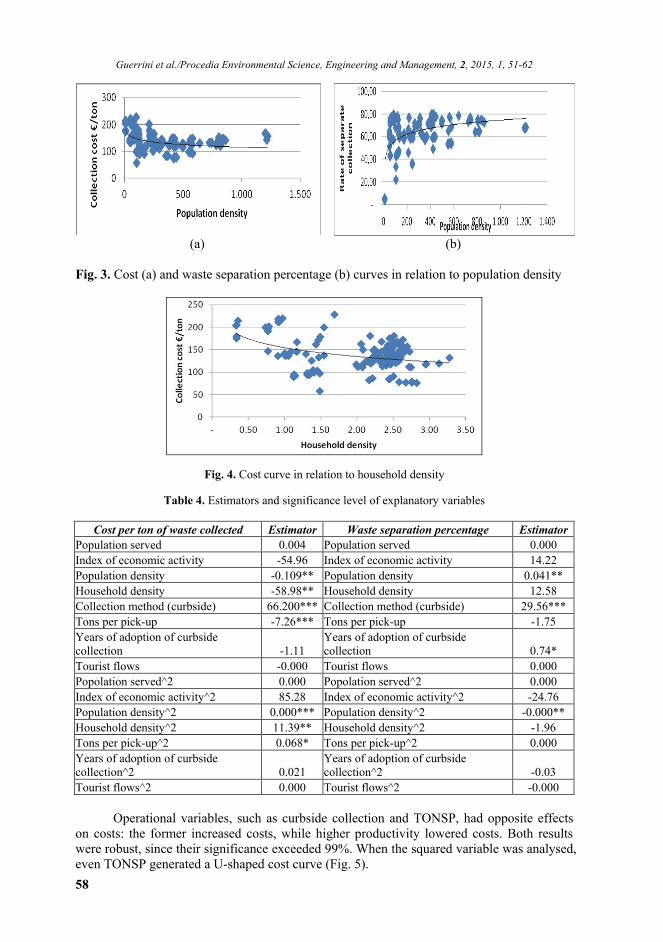
In this section we present and discuss the results obtained with a random-effects model, since H0 of Hausman test was accepted for both models (Prob>chi2 > 0.05). Environmental variables POPD and HOUSD negatively affected costs, with a significance level greater than 95%. The significance of the squared variables and the positive sign of both estimators showed that unit cost per ton of waste formed a U-shaped curve when POPD and HOUSD were observed (Figs. 3 and 4).
Guerrini et al./Procedia Environmental Science, Engineering and Management, 2, 2015, 1, 51-62
58
(a) (b)
Fig. 3. Cost (a) and waste separation percentage (b) curves in relation to population density
Fig. 4. Cost curve in relation to household density
Table 4. Estimators and significance level of explanatory variables
Cost per ton of waste collected Estimator Waste separation percentage Estimator Population served 0.004 Population served 0.000 Index of economic activity -54.96 Index of economic activity 14.22 Population density -0.109** Population density 0.041** Household density -58.98** Household density 12.58 Collection method (curbside) 66.200*** Collection method (curbside) 29.56*** Tons per pick-up -7.26*** Tons per pick-up -1.75 Years of adoption of curbside collection -1.11
Years of adoption of curbside collection 0.74*
Tourist flows -0.000 Tourist flows 0.000 Popolation served^2 0.000 Popolation served^2 0.000 Index of economic activity^2 85.28 Index of economic activity^2 -24.76 Population density^2 0.000*** Population density^2 -0.000** Household density^2 11.39** Household density^2 -1.96 Tons per pick-up^2 0.068* Tons per pick-up^2 0.000 Years of adoption of curbside collection^2 0.021
Years of adoption of curbside collection^2 -0.03
Tourist flows^2 0.000 Tourist flows^2 -0.000
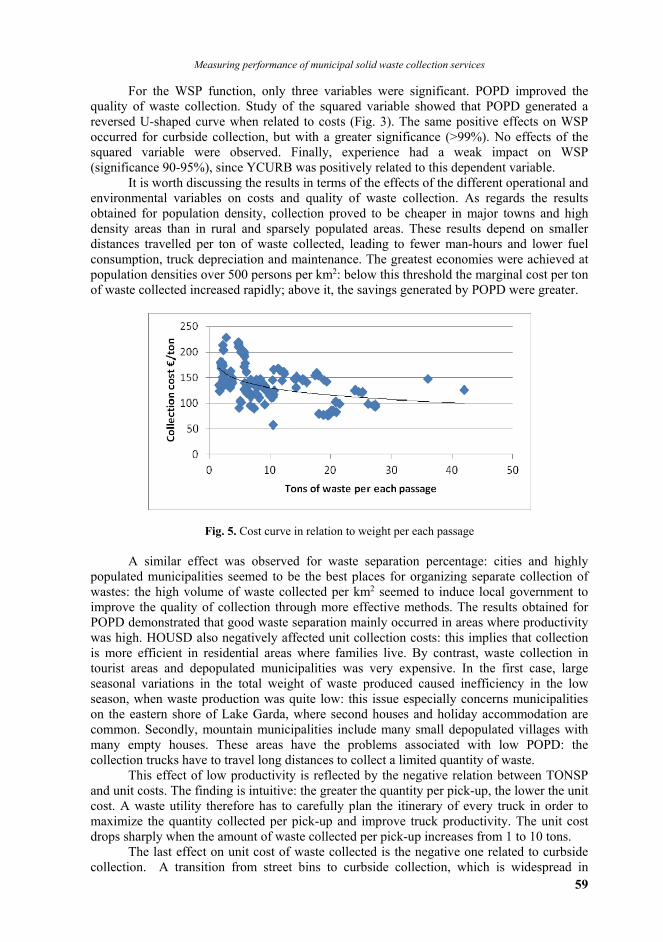
Operational variables, such as curbside collection and TONSP, had opposite effects on costs: the former increased costs, while higher productivity lowered costs. Both results were robust, since their significance exceeded 99%. When the squared variable was analysed, even TONSP generated a U-shaped cost curve (Fig. 5).
Measuring performance of municipal solid waste collection services
59
For the WSP function, only three variables were significant. POPD improved the quality of waste collection. Study of the squared variable showed that POPD generated a reversed U-shaped curve when related to costs (Fig. 3). The same positive effects on WSP occurred for curbside collection, but with a greater significance (>99%). No effects of the squared variable were observed. Finally, experience had a weak impact on WSP (significance 90-95%), since YCURB was positively related to this dependent variable.
It is worth discussing the results in terms of the effects of the different operational and environmental variables on costs and quality of waste collection. As regards the results obtained for population density, collection proved to be cheaper in major towns and high density areas than in rural and sparsely populated areas. These results depend on smaller distances travelled per ton of waste collected, leading to fewer man-hours and lower fuel consumption, truck depreciation and maintenance. The greatest economies were achieved at population densities over 500 persons per km2: below this threshold the marginal cost per ton of waste collected increased rapidly; above it, the savings generated by POPD were greater.
Fig. 5. Cost curve in relation to weight per each passage
A similar effect was observed for waste separation percentage: cities and highly populated municipalities seemed to be the best places for organizing separate collection of wastes: the high volume of waste collected per km2 seemed to induce local government to improve the quality of collection through more effective methods. The results obtained for POPD demonstrated that good waste separation mainly occurred in areas where productivity was high. HOUSD also negatively affected unit collection costs: this implies that collection is more efficient in residential areas where families live. By contrast, waste collection in tourist areas and depopulated municipalities was very expensive. In the first case, large seasonal variations in the total weight of waste produced caused inefficiency in the low season, when waste production was quite low: this issue especially concerns municipalities on the eastern shore of Lake Garda, where second houses and holiday accommodation are common. Secondly, mountain municipalities include many small depopulated villages with many empty houses. These areas have the problems associated with low POPD: the collection trucks have to travel long distances to collect a limited quantity of waste.
This effect of low productivity is reflected by the negative relation between TONSP and unit costs. The finding is intuitive: the greater the quantity per pick-up, the lower the unit cost. A waste utility therefore has to carefully plan the itinerary of every truck in order to maximize the quantity collected per pick-up and improve truck productivity. The unit cost drops sharply when the amount of waste collected per pick-up increases from 1 to 10 tons.
The last effect on unit cost of waste collected is the negative one related to curbside collection. A transition from street bins to curbside collection, which is widespread in
Guerrini et al./Procedia Environmental Science, Engineering and Management, 2, 2015, 1, 51-62
60
Veneto Region, generates a significant increase in unit cost. The average cost for curbside collection was €138 compared to €130 for street bins. The extra-costs incurred with curbside collection are compensated by a higher waste separation percentage. The method actually enabled an increase in collection productivity for both recyclable and unrecyclable waste. To evaluate the total costs and benefits of curbside collection it would be useful to estimate the value of the extra volume of recyclable waste gathered with respect to street bins, and compare it with the €8 difference in collection cost. Finally, another variable affecting waste separation percentage is YCURB: while costs are not affected by the experience gained with curbside collection, the waste separation percentage improves: this demonstrates that citizens and municipalities need to learn by doing and this could be expedited by effective information campaigns on how to correctly separate the different types of waste, with intensive control, especially in the first years of adoption, associated with severe penalties. 4. Conclusions
In studying the determinants of waste collection efficiency for 40 municipalities in the north-west of Verona province we measured economic efficiency in terms of cost per ton of waste collected on a yearly basis and analyzed this cost in relation to eight operational and environmental variables. Efficiency, in terms of the quality of services provided, was measured in terms of waste separation percentage. The independent variables chosen reflect socio-demographic conditions and organizational choices. The method used was a general panel data regression model under the assumptions of fixed and random effects, verified by the Hausman test.
Unit collection costs were affected by population density, household density, weight of waste collected per pick-up and collection method, while the waste separation percentage depended on population density, collection method and period of experience with curbside collection. The results suggest that the logistics of waste collection can be improved, especially in disadvantaged areas, such as rural areas, small villages and tourist destinations. In municipalities on Lake Garda, pick-up frequency could be varied according to season (frequent in summer, less frequent in winter) and in the low season wastes could be collected with skips placed in convenient locations or by creating huts where bins are located. These solutions enable collection itineraries to be planned efficiently, reducing pick-up frequencies in the low season. They could also be adopted in sparsely settled areas, such as mountain municipalities. This optimization of the logistics of waste collection would make it possible to maximize the quantity of waste per pick-up, keeping costs low and achieving high productivity and waste separation percentage.
With reference to collection method, some interesting insights emerge for curbside collection: firstly, further study could estimate the real costs and benefits of this collection method, considering not only the collection step, but also disposal and recycling; secondly, economies of experience associated with separate collection demonstrate the utility of training and information campaigns for citizens and for the staff of municipalities embarking on curbside collection for the first time. References
Benito B., Bastida F., Garcìa J., (2010), Explaining differences in efficiency: an application to Spanish
municipalities, Applied Economics, 42, 515-528. Benito B., del Rocio Moreno M., Solana J., (2011), Determinants of efficiency in the provision of
municipal street-cleaning and refuse collection services, Waste Management, 31, 1099-1108. Berenyi E.B., Stevens B.J., (1988), Does privatization work? A study of the delivery of eight local
services, State Local Government Review, 20, 11-19.
Measuring performance of municipal solid waste collection services
61
Berg S.V., Marques R.C., (2011), Quantitative studies of water and sanitation utilities: a literature survey, Water Policy, 13, 591–606.
Bosch N., Pedraja F., Suaréz-Pandiello J., (2000), Measuring the efficiency in Spanish municipal refuse collection services, Local Government Studies, 26, 71–90.
Callan S.J., Thomas J.M., (2001), Economies of scale and scope: a cost analysis of municipal solid waste services, Landscape Economies, 77, 548–560.
Carroll W., (1995), The organization and efficiency of residential recycling services, Eastern Economic Journal, 21, 215-225.
Carvalho P., Marques R., (2010), The influence of the operational environment on the efficiency of water utilities, Journal of Environmental Management, 92, 2698-2707.
Carvalho P., Marques R., (2014), Economies of size and density in municipal solid waste recycling in Portugal, Waste Management, 34, 12-20.
Collins J.N., Downes B.T., (1977), The effects of size on the provision of public services: The case of solid waste collection in smaller cities, Urban Affairs Quarterly, 12, 333-347.
Cubbin J., Domberger S., Meadowcroft S., (1987), Competitive tendering and efficiency: The case of hospital cleaning, Fiscal Studies, 8, 49–58.
Daraio C., Simar L., (2005), Introducing environmental variables in nonparametric frontier models: a probabilistic approach, Journal Productivity Analysis, 24, 93-121.
De Jaeger S., Eyckmans J., Rogge N., Van Puyenbroeck T., (2011), Wasteful waste-reducing policies? The impact of waste reduction policy instruments on collection and processing costs of municipal solid waste, Waste Management, 31, 1429-1440.
Distexhe V., (1993), Productive efficiency from refuse collection and disposal services in Wallonia (L'Efficacité productive des services d'enlèvement des immondices en Wallonie), Cahiers Economiques de Bruxelles, 137, 119-138.
Domberger S., Meadowcroft S., Thompson D., (1986), Competitive tendering and efficiency: the case of refuse collection, Fiscal Studies, 7, 69-87.
Dubin J.A., Navarro P., (1988), How markets for impure public goods organize: the case of household refuse collection, Journal of Law Economic Organization, 4, 217–241.
Eurostat, (2012), Waste database municipal waste, On line at: http://epp.eurostat.ec.europa.eu/portal/page/portal/waste/data/database.
Garcìa-Sànchez I.M., (2008), The performance of Spanish solid waste collection, Waste Management Resources, 26, 327-336.
Hollas D.R., Macleod K.R., Stansell S.R., (2002), A data envelopment analysis of gas utilities’ efficiency, Journal of Economics and Finance, 26, 123-137.
Jacobsen R., Buysse J., Gellynck X., (2013), Cost comparison between private and public collection of residual household waste: Multiple case studies in the Flemish region of Belgium, Waste Management, 33, 3-11.
Koushki P., Al-Duaij U., Al-Ghimlas W., (2004), Collection and transportation cost of household solid waste in Kuwait, Waste Management, 24, 957-964.
Kumbhakar S., Hjalmarsson L., (1998), Relative performance of public and private ownership under yardstick competition: Swedish electricity retail distribution, 1970-1990, European Economic Review, 42, 97-122.
Marques R.C., da Cruz NF., Carvalho P., (2012), Assessing and exploring (in) efficiency in Portuguese recycling systems using non-parametric methods, Resources, Conservation and Recycling, 67, 34-43.
McDavid J.C., (1985), The Canadian experience with privatizing residential solid waste collection services, Public Administration Review, 45, 602-608.
Ohlsson H., (2003), Ownership and production costs. Choosing between public production and contracting-out in the case of Swedish refuse collection, Fiscal Studies, 24, 451–476.
Panzar J.C., Willig R.D., (1981), Economies of Scope, American Economic Review, 71, 268-272. Passarini F., Vassura I., Monti F., Morselli L., Villani B., (2011), Indicators of waste management
efficiency related to different territorial conditions, Waste Management, 31, 785-792. Pier W.J., Vernon R.B., Wicks J.H., (1974), An empirical comparison of government and private
production efficiency, National Taxation Journal, 27, 653-656. Savas E.S., (1974), Municipal Monopolies vs. Competition in Delivering Urban Services, In: Improving
the Quality of Urban Management, Howley W., Rogers D. (Eds.), Sage Publications, Beverly Hills, 437-500.
Guerrini et al./Procedia Environmental Science, Engineering and Management, 2, 2015, 1, 51-62
62
Silvestre J., (1987), Economies and diseconomies of scale, In: The new Palgrave: A Dictionary of economics, Eatwell J., Milgate M., Newman P., (Eds.), Palgrave Macmillan, London, On line at: http://www.palgraveconnect.com/pc/doifinder/10.1057/9780230279803.0541.
Simões P., De Witte K., Marques R.C., (2010), Regulatory structures and operational environment in the Portuguese waste sector, Waste Management, 30, 1130-1137.
Simões P., Cruz N.F., Marques R.C., (2012), The performance of private partners in the waste sector, Journal of Cleaner Production, 29–30, 214-221.
Simões P., Marques R.C., (2012), On the economic performance of the waste sector. A literature review, Journal of Environmental Management, 106, 40-47.
Simões P., Carvalho P., Marques R.C., (2013), The market structure of urban solid waste services: how different models lead to different results, Local Government Studies, 39, 396–413.
Szymanski S., Wilkins S., (1993), Cheap rubbish? Refuse collection costs and collective tendering 1984-88, Fiscal Studies, 14, 109-31.
Szymanski S., (1996), The impact of compulsory competitive tendering on refuse collection services, Fiscal Studies, 17, 1-19.
Vishwakarma A., Kulshrestha M., Kulshreshtha M., (2012), Efficiency evaluation of municipal solid waste management utilities in the urban cities of the state of Madhya Pradesh, India, using stochastic frontier analysis, Benchmarking: International Journal, 19, 340-357.
Worthington A.C., Dollery B.E., (2001), Measuring efficiency in local government: an analysis of New South Wales Municipalities domestic waste management function, Journal of Policy Studies, 29, 4–24.
Worthington A., Dollery B., (2002), Incorporating contextual information in public sector efficiency analyses: a comparative study of NSW local government, Applied Economics, 34, 453-464.
Zamorano M., Grindlay A., Molero E., Rodrìguez M.I., (2011), Diagnosis and proposals for waste management in industrial areas in the service sector: Case study in the metropolitan area of Granada, (in Spanish), Journal of Cleaner Production, 19, 1946-1955.