Embed Size (px)
Citation preview
1
An Appraisal of Beekeeping Activities among Beneficiaries and Non-Beneficiaries of
Ekiti State Agricultural Credit Agency (ESACA) Scheme in Nigeria
By
1Fakayode, S. B, Babatunde, R.O, Olowogbon, S.T, and Adesuyi W. S
Department of Agricultural Economics and Farm Management, P.M.B 1515, University of Ilorin. Ilorin. Nigeria
1Corresponding Author: mobile gsm no +2348060236283 e-mails:
[email protected],[email protected] Contributed Paper presented at the Joint 3rd African Association of Agricultural Economists (AAAE) and 48th Agricultural Economists Association of South Africa (AEASA) Conference, Cape Town, South Africa, September 19-23, 2010
2
ABSTRACT The study examined beekeeping activities in Ekiti State, Nigeria. Specifically the study appraised the costs and returns structure of beekeeping activities by beneficiaries of the ESACA scheme, examined the constraints to beekeeping under the scheme and outside the scheme and identified factors that affect beekeeping under the scheme and outside the scheme. A total of 150 beekeeper households were selected; 75 households each for ESACA beneficiary and non-beneficiary respondents across communities popularly known for beekeeping in Ekiti state. Descriptive statistics, costs and returns, regression and Kruscal-wallis analyses were employed for data analysis. Beekeeping was found to be more profitable under the ESACA scheme than outside the scheme with returns to beekeeping labour and management of N 128.5 and N 87.0 per hive for beneficiary and non-beneficiary respondents respectively. The pooled regression result showed that the ESACA scheme enabled beneficiary respondents to be more economically viable than the non-beneficiary respondents. The bee-keepers are also faced with numerous constraints including inadequate credit, pests and diseases, bee aggressiveness, bush burning, absconding of bees, theft, inadequate technical assistance and poor market problems. The study therefore calls for that ESACA authority should extend its credit facilities to more beekeepers, need to increase loan sums and other credit facilities disbursed to beekeepers and the discouragement of bush burning by the hunters and other forest users during the dry season.
Key words: Kruscal-wallis, costs and returns structure, regression, technical
assistance
Introduction
In Nigeria agriculture is one of the tile important sectors of notable economic relevance in her
economic development and growth. This sector provides about 80 percent of food for her
increasing population, employs 75 percent of the acute labour force, accounts for over 60
percent of the non-oil foreign earnings as well as providing raw materials for the nation’s
based industries (Ajekigbe 2007). Agriculture also contributes about 40 percent to the
nation’s Gross Domestic Product (GDP) (Central Bank of Nigeria, 2008). However, since the
discovery of petroleum, the agricultural sector has suffered much neglect. Ayorinde (2005)
lamented that ‘With the oil boom came the food doom’. He explained further that Nigeria
gradually became an importer of food of all sorts and this has worsened the standard of living
of Nigerians especially those in urban areas. Agriculture therefore became faced with lots of
3
problems. These include: inadequate credit facilities and subsidy, small scale production due
to land tenure system, poor researches and extension services amongst others.
Over the year, successive Nigerian governments therefore undertook several programmes to
improve agricultural production in the country. These programmes include namely the River
Basin Development Authority Programme (RBDA) in 1970, Operation Feed the Nation
(OFN) in 1976, Structural Adjustment Programme (SAP) in 1985 and the National Economic
Empowerment Development Strategy (NEEDS) in 2003 amongst others. Despite all these
efforts, the problems facing agricultural production still persist. Difficulties with these
programmes are not only with their large numbers and poor management, but they lacked
sharp focus as well as technical personnel. These programmes hardly reached the target
beneficiaries, quickly loose tempo resulting in uncountable number of abandoned projects
(Adekunle, 2007).
In addition, the State and Local Government initiatives at addressing problems of agriculture
were also established. These initiatives were aimed at improving agricultural production at
the State and Local Government Area levels. They include; the State Economic and
Empowerment Development Strategy (SEEDS), Local Government Economic and
Empowerment Development Strategy (LEEDS), State Agricultural Development
Programmes (ADPs), State Agricultural Inputs Supply Agency (AISAs) amongst others.
This study therefore sought to examine bee keeping facilities and activities under the Ekiti
State Agricultural Credit Agency (ESACA) lending scheme. The study sought to provide
ways by which mistakes of government initiatives could be remedied.
4
Over the years, emphases have been more towards the promotion of various types of small-
scale income generating activities such as beekeeping. Not until recently, modern
beekeeping was almost non-existent in Nigeria. The country’s crude honey produced each
year came mostly from bee hunters and a few traditional beekeeper.
In Ekiti State however, most honey bees are reared in local hives, wooden reeds and tree
trunks. Harvesting is carried out with crude technologies. This has limited the quantity and
quality of honey produced in the State (Oluwatusin, 2006). With this state of beekeeping in
Ekiti State, the facilities for beekeeping under the ESACA scheme are aimed at improving
the quality and quantity of honey produced. The beekeeping facilities under the scheme
include: Credit facilities and affordable rate of interest, subsidy on honey extraction machine
and the provision of modern bee hives for commercial beekeeping.
The foregoing therefore raises the following research questions:
What is the nature of beekeeping practices of the ESACA scheme?
What benefits accrue to the beneficiaries of the ESACA scheme?
What are the constraints to beekeeping under the ESACA scheme?
This study sought to provide answers to these pertinent questions
Objectives of the Study
The main objective of the study was to examine beekeeping activities under the ESACA
scheme. The specific objectives were to:
Examine the socio-economic characteristics of beekeeper beneficiaries and non-
beneficiaries of the ESACA scheme.
5
Determine and examine the costs and returns structure of beekeeping under the
ESACA scheme and outside the scheme.
Examine the constraint to beekeeping under the scheme and outside the scheme.
Examine the factors that affect beekeeping under the scheme and outside the scheme.
The Ekiti State Agricultural Credit Agency’s Lending Scheme
The ESACA was established to eradicate poverty and create wealth as means of enhancing
economic welfare of individuals, families, communities and the citizens of Ekiti State at
large. The agency was established in May, 1999 to provide food for the rapidly increasing
population, create employment opportunities, enhance people’s economic status, provide
growing markets for manufactured goods and provide exports and foreign exchange earnings
(ESACA, 1999). Under the scheme, credit facilities are made available for both agricultural
and non-agricultural purposes as follows:
Foods crops (arable crops) farming such as those for maize, rice, yam, cassava and
vegetables.
Tree crops (perennial crops) maintenance, including cocoa, improved oil palm,
cashew and citrus farms.
Livestock production/farming including poultry, cattle, piggery, rabbitary, goat, sheep
and other small-live-stock farming.
Fishery
Bee-keeping
Snail farming
Dry season farming
Agro-based industries.
6
Marketing of non-farm produce like kerosene, clothes, essential commodities and
household utensils.
Artisanship
Skill acquisition activities as well as:
Small-scale entrepreneurship
All indigenes and non-indigenes residing and working in the Ekiti State are qualified to apply
for the ESACA loans. Target groups under the scheme include individual farmers, registered
co-operatives or groups of livestock producers, bee keeper’s associations, farm settlers,
irrigation/fadama farmers, civil servants, companies and education institutions. The
scheme’s beneficiaries are usually granted a period of moratorium; usually three months in
the case of non-agricultural loans, after which loan repayment is expected to be completed
within twelve months. For agricultural loans, the period of moratorium ranges from three to
twelve months depending on the gestation period of the enterprise concerned after which loan
repayment must be completed within three to six months. A nominal interest of 10 percent
per month is payable after the moratorium and the appropriate accounts into which
repayments must be paid are notified.
There are conditions that govern prospective beneficiaries’ eligibility to obtain ESACA loans.
First, a prospective beneficiary must purchase an application form at a prescribed fee of N
500.00 only. He must be able to provide two guarantors and be ready to furnish a proportion
of the total cost of his proposed project for which loan is requested. He must also be ready to
follow improved production practices and advice as furnished to him by ESACA authorities.
In the case of agricultural loans for the purchase of machines chemicals, fertilizers, improved
planting materials and livestock production, the agency makes direct payment to the agreed
7
suppliers. In return, the supplier furnishes the agency copies of delivery note made to the
borrower. For poultry and other livestock endeavours, applicant must have a minimum of
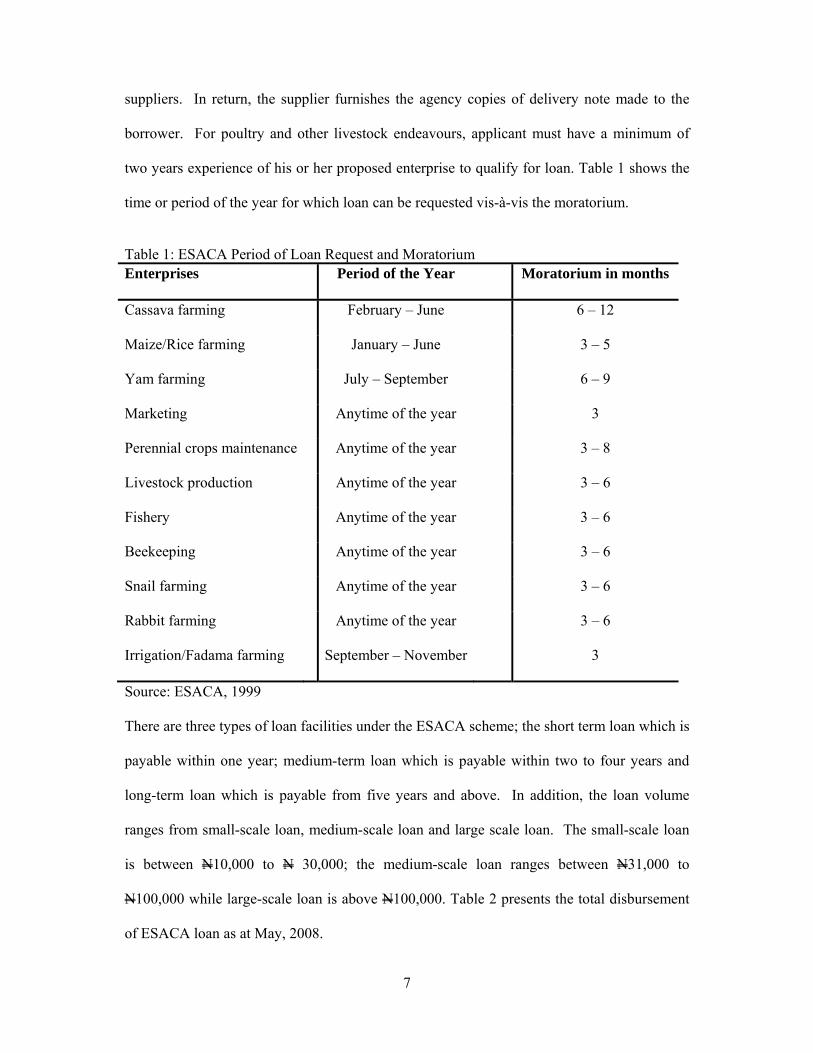
two years experience of his or her proposed enterprise to qualify for loan. Table 1 shows the
time or period of the year for which loan can be requested vis-à-vis the moratorium.
Table 1: ESACA Period of Loan Request and Moratorium Enterprises Period of the Year Moratorium in months
Cassava farming February – June 6 – 12
Maize/Rice farming January – June 3 – 5
Yam farming July – September 6 – 9
Marketing Anytime of the year 3
Perennial crops maintenance Anytime of the year 3 – 8
Livestock production Anytime of the year 3 – 6
Fishery Anytime of the year 3 – 6
Beekeeping Anytime of the year 3 – 6
Snail farming Anytime of the year 3 – 6
Rabbit farming Anytime of the year 3 – 6
Irrigation/Fadama farming September – November 3
Source: ESACA, 1999
There are three types of loan facilities under the ESACA scheme; the short term loan which is
payable within one year; medium-term loan which is payable within two to four years and
long-term loan which is payable from five years and above. In addition, the loan volume
ranges from small-scale loan, medium-scale loan and large scale loan. The small-scale loan
is between N10,000 to N 30,000; the medium-scale loan ranges between N31,000 to
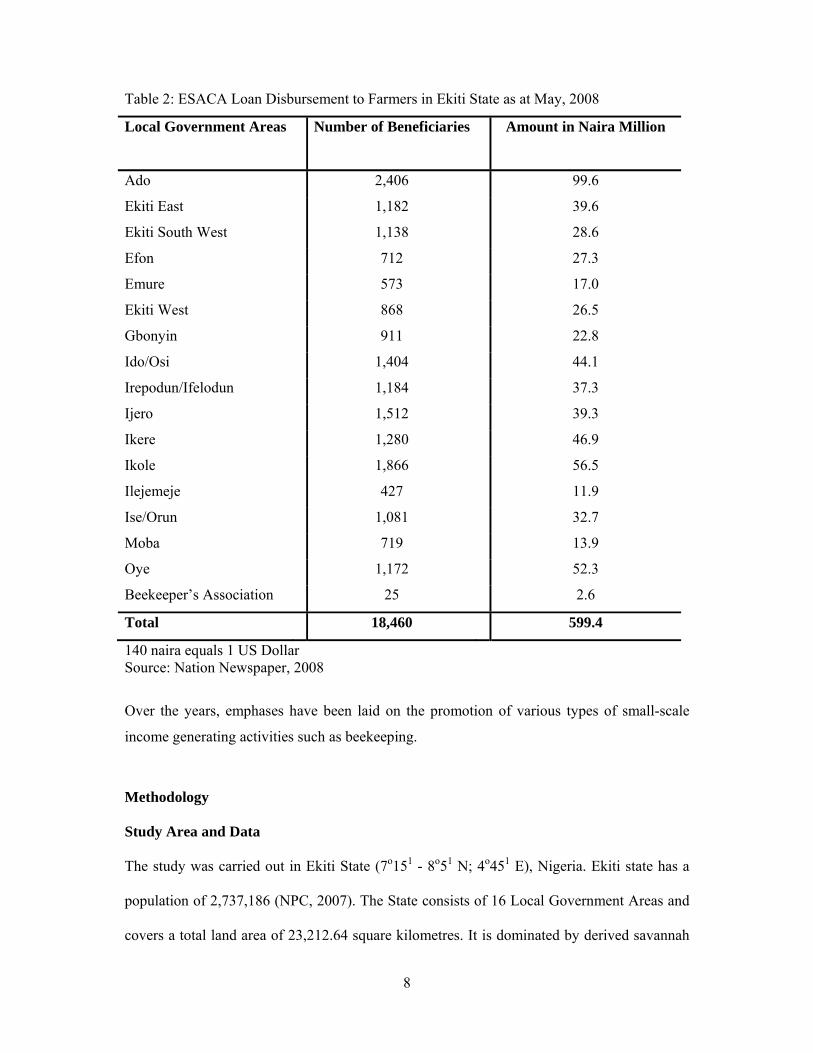
N100,000 while large-scale loan is above N100,000. Table 2 presents the total disbursement
of ESACA loan as at May, 2008.
8
Table 2: ESACA Loan Disbursement to Farmers in Ekiti State as at May, 2008
Local Government Areas Number of Beneficiaries Amount in Naira Million
Ado 2,406 99.6
Ekiti East 1,182 39.6
Ekiti South West 1,138 28.6
Efon 712 27.3
Emure 573 17.0
Ekiti West 868 26.5
Gbonyin 911 22.8
Ido/Osi 1,404 44.1
Irepodun/Ifelodun 1,184 37.3
Ijero 1,512 39.3
Ikere 1,280 46.9
Ikole 1,866 56.5
Ilejemeje 427 11.9
Ise/Orun 1,081 32.7
Moba 719 13.9
Oye 1,172 52.3
Beekeeper’s Association 25 2.6
Total 18,460 599.4
140 naira equals 1 US Dollar Source: Nation Newspaper, 2008
Over the years, emphases have been laid on the promotion of various types of small-scale
income generating activities such as beekeeping.
Methodology
Study Area and Data
The study was carried out in Ekiti State (7o151 - 8o51 N; 4o451 E), Nigeria. Ekiti state has a
population of 2,737,186 (NPC, 2007). The State consists of 16 Local Government Areas and
covers a total land area of 23,212.64 square kilometres. It is dominated by derived savannah
9
vegetation in the north and forest savannah in the south. Agriculture in the state is rain-fed
while mixed cropping is widely practiced. The state is categorised into two Zones, A and B,
based on agronomic and ecological considerations (Fakayode, et al, 2008). Average annual
rainfall in the area ranges between 1,200mm and 1800mm, almost evenly distributed
throughout the wet season while temperatures range between 21 and 28oC. Major crops
grown in the state include oil palm, cocoa, coffee, yam, cassava, maize, vegetables and fruits
(Fakayode et al, 2008).
For the study, a total of 150 beekeeper households were selected; 75 households each for
beneficiary and non-beneficiary respondents. For the non–beneficiary respondents, a two
stage sampling techniques was employed. The first stage involved the selection of 11
communities popularly known for beekeeping in Ekiti state. This was followed by the
selection of 75 beekeeper non-beneficiary households across these communities. For the
beneficiary respondents, the sampling procedure involved the random selection of 75
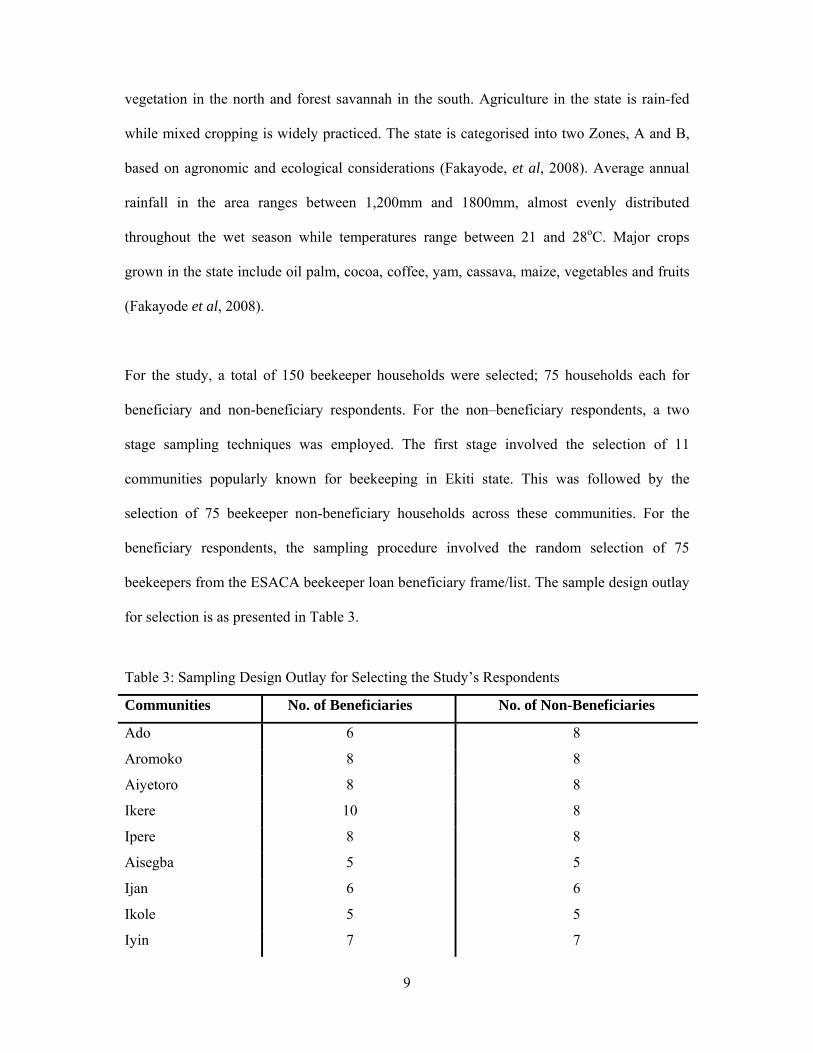
beekeepers from the ESACA beekeeper loan beneficiary frame/list. The sample design outlay
for selection is as presented in Table 3.
Table 3: Sampling Design Outlay for Selecting the Study’s Respondents
Communities No. of Beneficiaries No. of Non-Beneficiaries
Ado 6 8
Aromoko 8 8
Aiyetoro 8 8
Ikere 10 8
Ipere 8 8
Aisegba 5 5
Ijan 6 6
Ikole 5 5
Iyin 7 7
10
Ilawe 6 6
Eporo 6 6
Total 75 75
Source: Field Survey, 2009
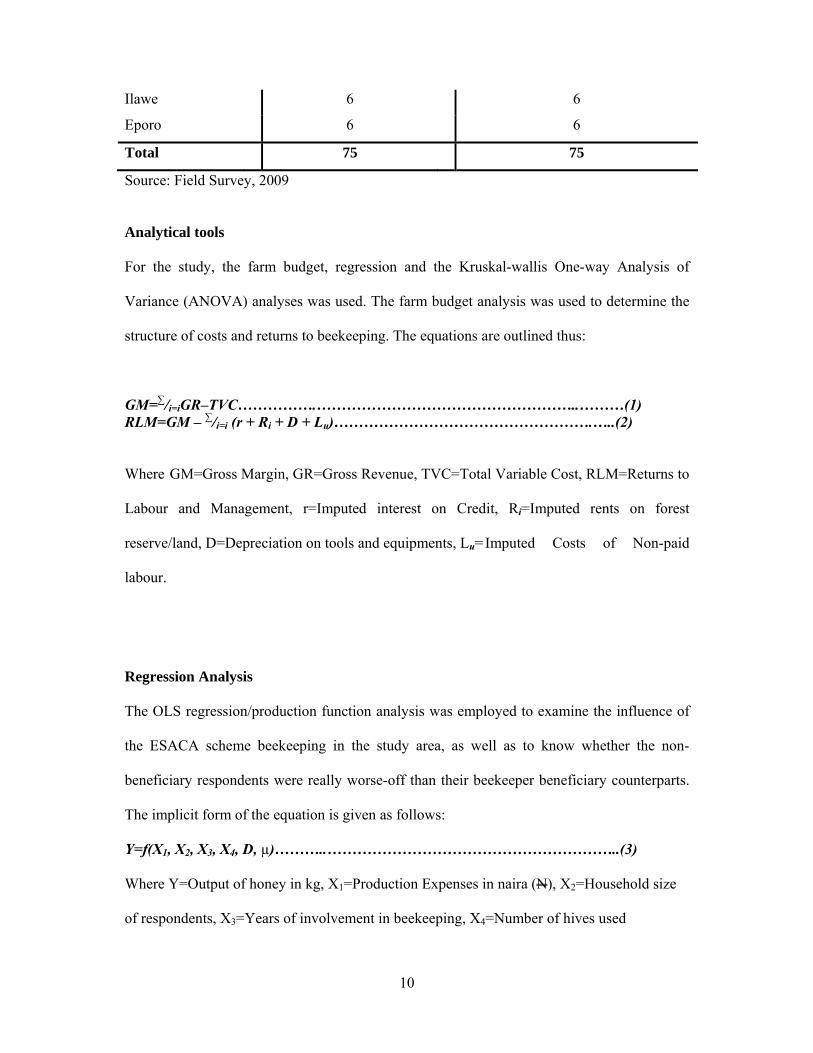
Analytical tools
For the study, the farm budget, regression and the Kruskal-wallis One-way Analysis of
Variance (ANOVA) analyses was used. The farm budget analysis was used to determine the
structure of costs and returns to beekeeping. The equations are outlined thus:
GM=∑/i=iGR–TVC…………….……………………………………………..………(1) RLM=GM – ∑/i=i (r + Ri + D + Lu)…………………………………………….…..(2)
Where GM=Gross Margin, GR=Gross Revenue, TVC=Total Variable Cost, RLM=Returns to
Labour and Management, r=Imputed interest on Credit, Ri=Imputed rents on forest
reserve/land, D=Depreciation on tools and equipments, Lu= Imputed Costs of Non-paid
labour.
Regression Analysis
The OLS regression/production function analysis was employed to examine the influence of
the ESACA scheme beekeeping in the study area, as well as to know whether the non-
beneficiary respondents were really worse-off than their beekeeper beneficiary counterparts.
The implicit form of the equation is given as follows:
Y=f(X1, X2, X3, X4, D, µ)………..…………………………………………………..(3)
Where Y=Output of honey in kg, X1=Production Expenses in naira (N), X2=Household size
of respondents, X3=Years of involvement in beekeeping, X4=Number of hives used
11
D=ESACA membership dummied as 1 for members and 0 for non-members and µ=Error
Term
Kruskal-Wallis One-way Analysis of Variance (ANOVA) by Ranks
To examine constraints to beekeeping under and outside the ESACA scheme, the Kruskal-
Wallis One-way Analysis of Variance (ANOVA) by Ranks was used. This involved
assigning of priorities to identified constraint. The identified constraints are: inadequate
equipment, credit/capital, pests and disease, theft, bee aggressiveness, absconding of bees,
inadequate marketing facilities and bush burning.
The equation for extracting the rank is outlined as 4:
H = 12 ∑1/ni [Ri – ni (N + 1)]2………………………...…………………(4) N + 1 2
Where Ri is the sum of the ranks assigned to observations in the ith sample and
ni (N + 1)) is the expected sum of ranks for the ith treatment (Wayne,1990). 2 . Results and Discussion
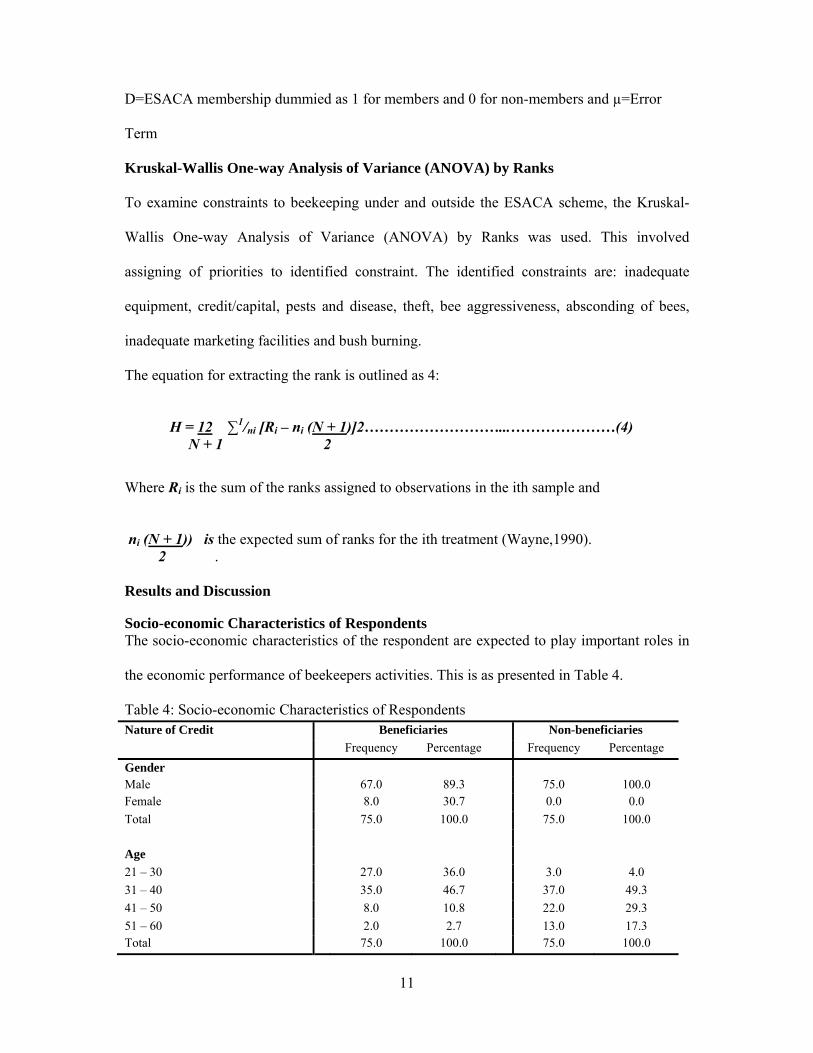
Socio-economic Characteristics of Respondents The socio-economic characteristics of the respondent are expected to play important roles in
the economic performance of beekeepers activities. This is as presented in Table 4.
Table 4: Socio-economic Characteristics of Respondents Nature of Credit Beneficiaries Non-beneficiaries
Frequency Percentage Frequency Percentage
Gender Male 67.0 89.3 75.0 100.0 Female 8.0 30.7 0.0 0.0
Total 75.0 100.0 75.0 100.0
Age
21 – 30 27.0 36.0 3.0 4.0
31 – 40 35.0 46.7 37.0 49.3
41 – 50 8.0 10.8 22.0 29.3
51 – 60 2.0 2.7 13.0 17.3 Total 75.0 100.0 75.0 100.0
12
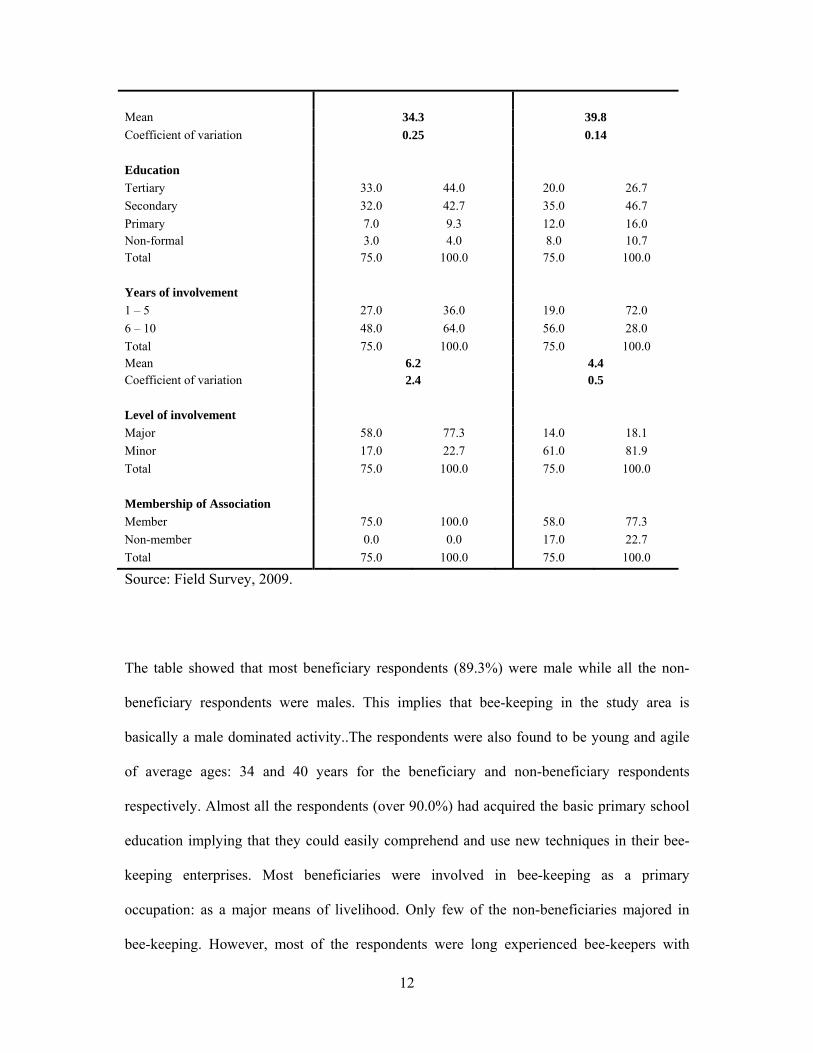
Mean 34.3 39.8
Coefficient of variation 0.25 0.14
Education
Tertiary 33.0 44.0 20.0 26.7
Secondary 32.0 42.7 35.0 46.7
Primary 7.0 9.3 12.0 16.0 Non-formal 3.0 4.0 8.0 10.7 Total 75.0 100.0 75.0 100.0
Years of involvement
1 – 5 27.0 36.0 19.0 72.0
6 – 10 48.0 64.0 56.0 28.0
Total 75.0 100.0 75.0 100.0 Mean 6.2 4.4 Coefficient of variation 2.4 0.5
Level of involvement
Major 58.0 77.3 14.0 18.1
Minor 17.0 22.7 61.0 81.9
Total 75.0 100.0 75.0 100.0
Membership of Association
Member 75.0 100.0 58.0 77.3
Non-member 0.0 0.0 17.0 22.7
Total 75.0 100.0 75.0 100.0
Source: Field Survey, 2009.
The table showed that most beneficiary respondents (89.3%) were male while all the non-
beneficiary respondents were males. This implies that bee-keeping in the study area is
basically a male dominated activity..The respondents were also found to be young and agile
of average ages: 34 and 40 years for the beneficiary and non-beneficiary respondents
respectively. Almost all the respondents (over 90.0%) had acquired the basic primary school
education implying that they could easily comprehend and use new techniques in their bee-
keeping enterprises. Most beneficiaries were involved in bee-keeping as a primary
occupation: as a major means of livelihood. Only few of the non-beneficiaries majored in
bee-keeping. However, most of the respondents were long experienced bee-keepers with
13
about 6 and 4 years of involvement for beneficiary and non-beneficiary respectively. All the
beneficiary bee-keepers belonged to one multi-purpose cooperative or the other while only
About three-quarters of the non-beneficiaries were cooperative members. As cooperative
members beekeepers can pool their resources within their societies to be plough into
beekeeping so that the issue of inadequate funds for investment is reduced to the barest
minimum.
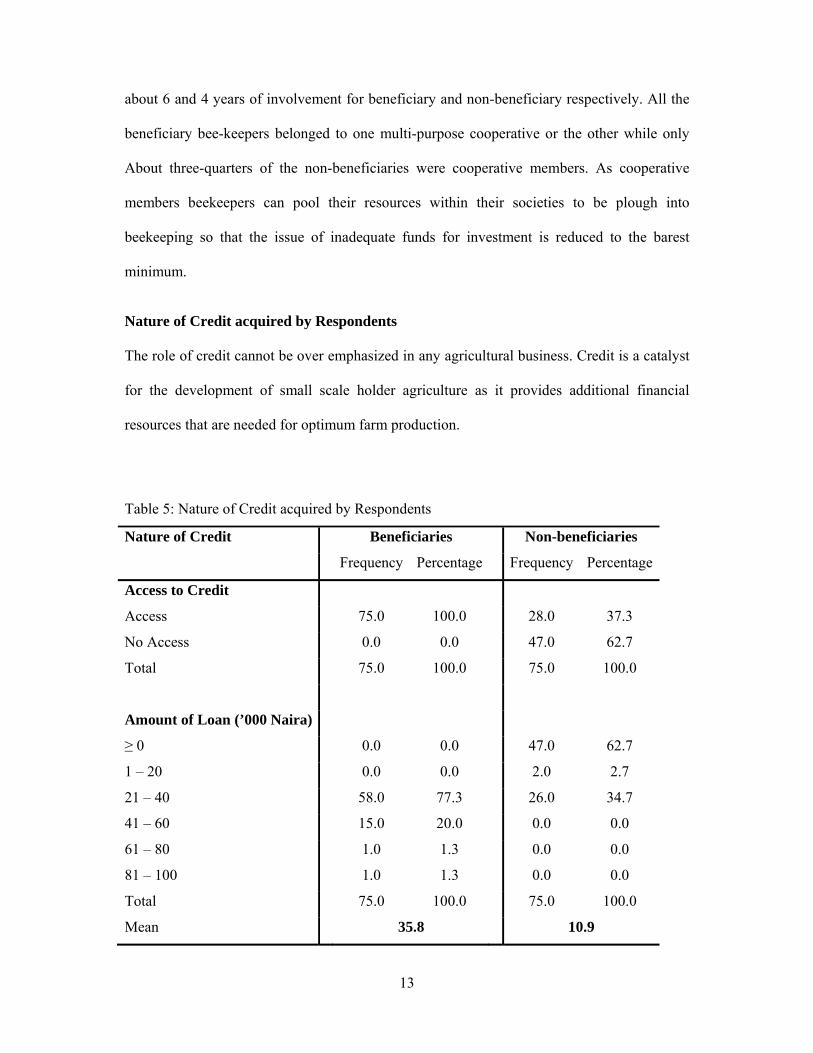
Nature of Credit acquired by Respondents
The role of credit cannot be over emphasized in any agricultural business. Credit is a catalyst
for the development of small scale holder agriculture as it provides additional financial
resources that are needed for optimum farm production.
Table 5: Nature of Credit acquired by Respondents
Nature of Credit Beneficiaries Non-beneficiaries
Frequency Percentage Frequency Percentage
Access to Credit
Access 75.0 100.0 28.0 37.3
No Access 0.0 0.0 47.0 62.7
Total 75.0 100.0 75.0 100.0
Amount of Loan (’000 Naira)
≥ 0 0.0 0.0 47.0 62.7
1 – 20 0.0 0.0 2.0 2.7
21 – 40 58.0 77.3 26.0 34.7
41 – 60 15.0 20.0 0.0 0.0
61 – 80 1.0 1.3 0.0 0.0
81 – 100 1.0 1.3 0.0 0.0
Total 75.0 100.0 75.0 100.0
Mean 35.8 10.9
14
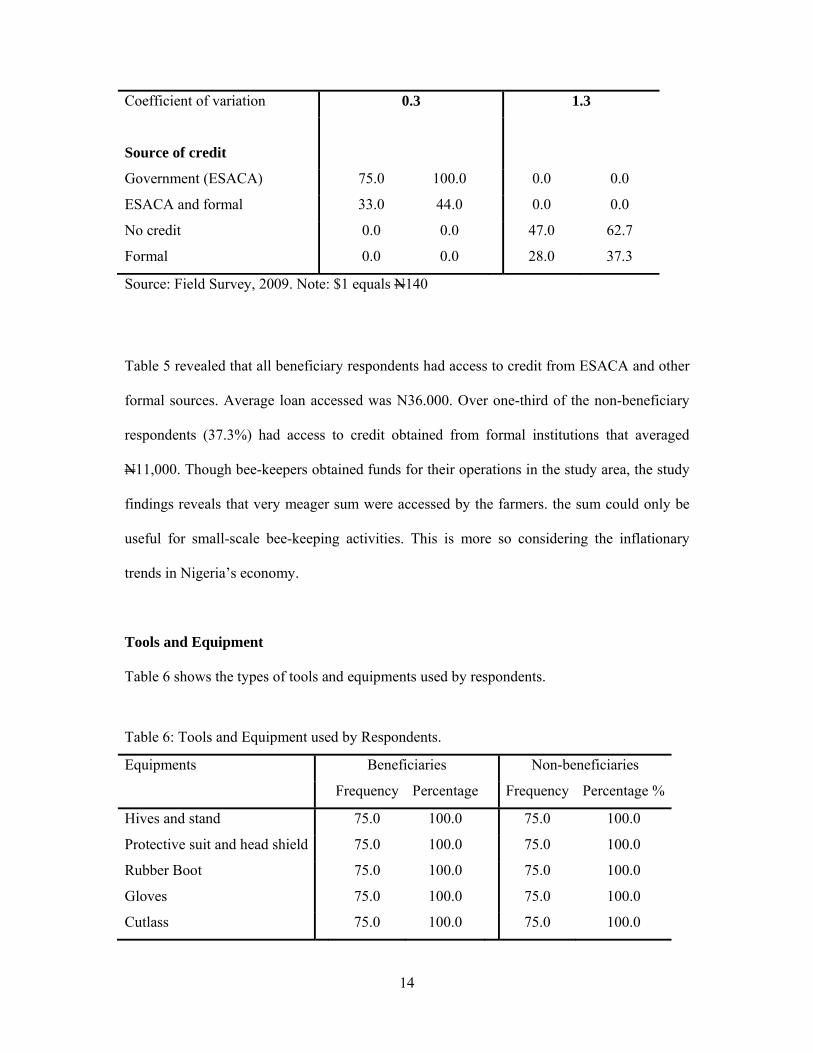
Coefficient of variation 0.3 1.3
Source of credit
Government (ESACA) 75.0 100.0 0.0 0.0
ESACA and formal 33.0 44.0 0.0 0.0
No credit 0.0 0.0 47.0 62.7
Formal 0.0 0.0 28.0 37.3
Source: Field Survey, 2009. Note: $1 equals N140
Table 5 revealed that all beneficiary respondents had access to credit from ESACA and other
formal sources. Average loan accessed was N36.000. Over one-third of the non-beneficiary
respondents (37.3%) had access to credit obtained from formal institutions that averaged
N11,000. Though bee-keepers obtained funds for their operations in the study area, the study
findings reveals that very meager sum were accessed by the farmers. the sum could only be
useful for small-scale bee-keeping activities. This is more so considering the inflationary
trends in Nigeria’s economy.
Tools and Equipment
Table 6 shows the types of tools and equipments used by respondents.
Table 6: Tools and Equipment used by Respondents.
Equipments Beneficiaries Non-beneficiaries
Frequency Percentage Frequency Percentage %
Hives and stand 75.0 100.0 75.0 100.0
Protective suit and head shield 75.0 100.0 75.0 100.0
Rubber Boot 75.0 100.0 75.0 100.0
Gloves 75.0 100.0 75.0 100.0
Cutlass 75.0 100.0 75.0 100.0
15
Beehive Tool 75.0 100.0 75.0 100.0
Smoker 75.0 100.0 75.0 100.0
Extractor 55.0 73.3 15.0 20.0
Presser 20.0 26.7 60.0 80.0
Sieve 20.0 26.7 60.0 80.0
Brush 75.0 100.0 75.0 100.0
Funnel 75.0 100.0 75.0 100.0
Bottle 75.0 100.0 75.0 100.0
Source: Field Survey, 2009.
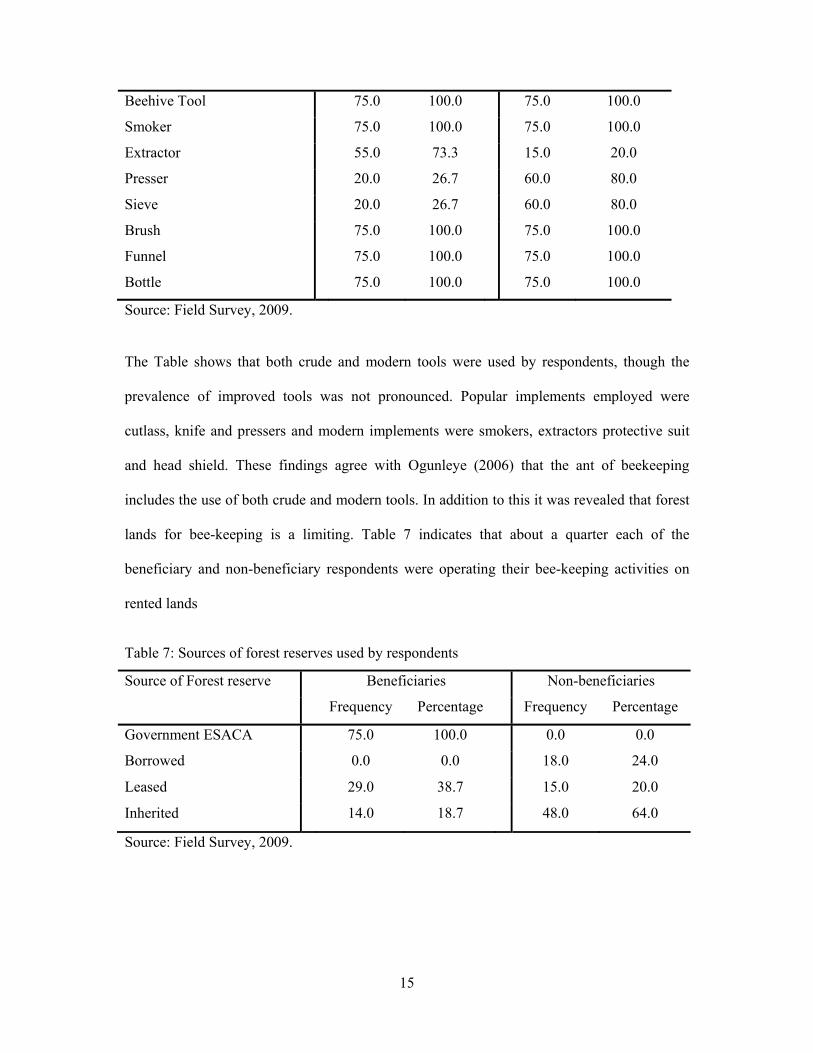
The Table shows that both crude and modern tools were used by respondents, though the
prevalence of improved tools was not pronounced. Popular implements employed were
cutlass, knife and pressers and modern implements were smokers, extractors protective suit
and head shield. These findings agree with Ogunleye (2006) that the ant of beekeeping
includes the use of both crude and modern tools. In addition to this it was revealed that forest
lands for bee-keeping is a limiting. Table 7 indicates that about a quarter each of the
beneficiary and non-beneficiary respondents were operating their bee-keeping activities on
rented lands
Table 7: Sources of forest reserves used by respondents
Source of Forest reserve Beneficiaries Non-beneficiaries
Frequency Percentage Frequency Percentage
Government ESACA 75.0 100.0 0.0 0.0
Borrowed 0.0 0.0 18.0 24.0
Leased 29.0 38.7 15.0 20.0
Inherited 14.0 18.7 48.0 64.0
Source: Field Survey, 2009.
16
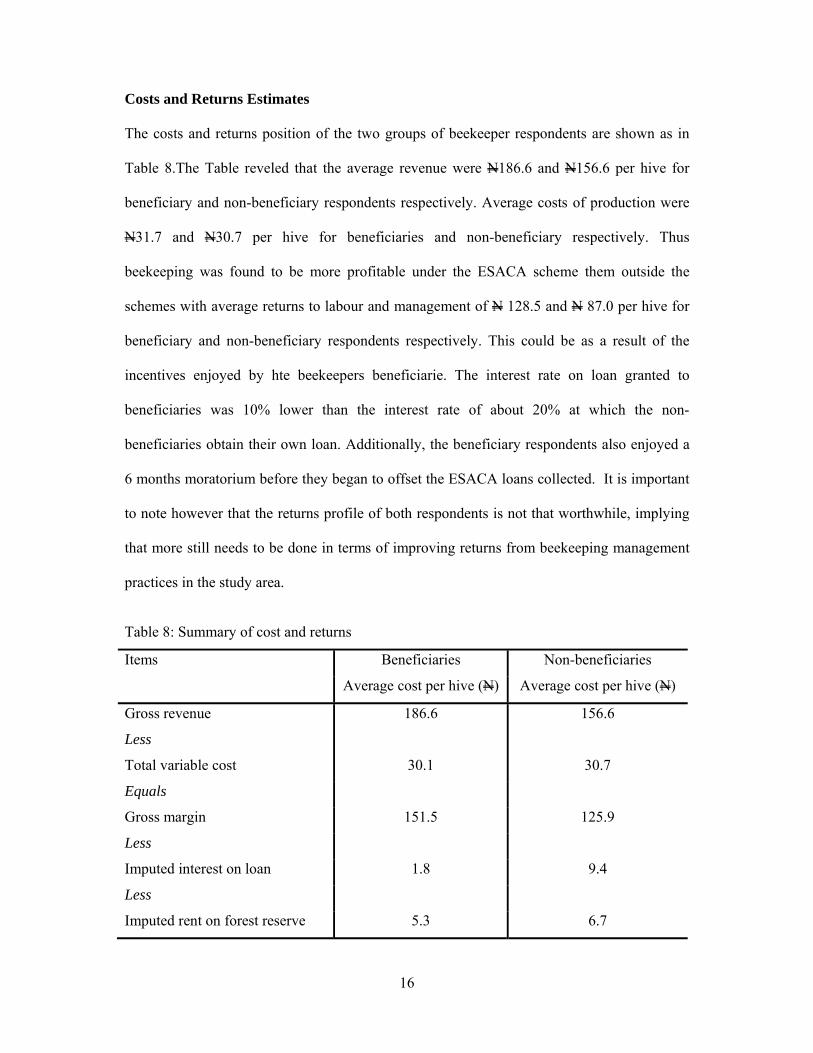
Costs and Returns Estimates
The costs and returns position of the two groups of beekeeper respondents are shown as in
Table 8.The Table reveled that the average revenue were N186.6 and N156.6 per hive for
beneficiary and non-beneficiary respondents respectively. Average costs of production were
N31.7 and N30.7 per hive for beneficiaries and non-beneficiary respectively. Thus
beekeeping was found to be more profitable under the ESACA scheme them outside the
schemes with average returns to labour and management of N 128.5 and N 87.0 per hive for
beneficiary and non-beneficiary respondents respectively. This could be as a result of the
incentives enjoyed by hte beekeepers beneficiarie. The interest rate on loan granted to
beneficiaries was 10% lower than the interest rate of about 20% at which the non-
beneficiaries obtain their own loan. Additionally, the beneficiary respondents also enjoyed a
6 months moratorium before they began to offset the ESACA loans collected. It is important
to note however that the returns profile of both respondents is not that worthwhile, implying
that more still needs to be done in terms of improving returns from beekeeping management
practices in the study area.
Table 8: Summary of cost and returns
Items Beneficiaries Non-beneficiaries
Average cost per hive (N) Average cost per hive (N)
Gross revenue 186.6 156.6
Less
Total variable cost 30.1 30.7
Equals
Gross margin 151.5 125.9
Less
Imputed interest on loan 1.8 9.4
Less
Imputed rent on forest reserve 5.3 6.7
17
Less
Depreciation 12.0 15.0
Less
Imputed cost of non-paid labor 3.9 7.7
Equals
Returns to labor and management 128.5 87.0
Source: Field Survey, 2009.
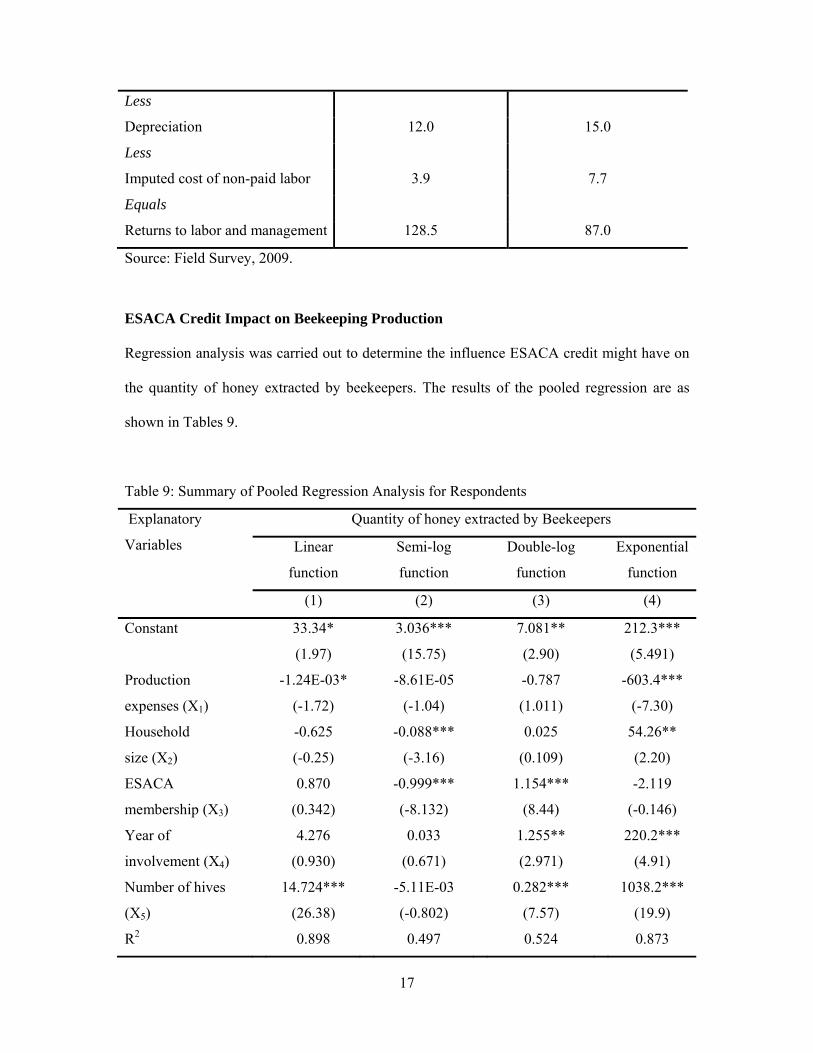
ESACA Credit Impact on Beekeeping Production
Regression analysis was carried out to determine the influence ESACA credit might have on
the quantity of honey extracted by beekeepers. The results of the pooled regression are as
shown in Tables 9.
Table 9: Summary of Pooled Regression Analysis for Respondents
Explanatory
Variables
Quantity of honey extracted by Beekeepers
Linear
function
Semi-log
function
Double-log
function
Exponential
function
(1) (2) (3) (4)
Constant 33.34*
(1.97)
3.036***
(15.75)
7.081**
(2.90)
212.3***
(5.491)
Production
expenses (X1)
-1.24E-03*
(-1.72)
-8.61E-05
(-1.04)
-0.787
(1.011)
-603.4***
(-7.30)
Household
size (X2)
-0.625
(-0.25)
-0.088***
(-3.16)
0.025
(0.109)
54.26**
(2.20)
ESACA
membership (X3)
0.870
(0.342)
-0.999***
(-8.132)
1.154***
(8.44)
-2.119
(-0.146)
Year of
involvement (X4)
4.276
(0.930)
0.033
(0.671)
1.255**
(2.971)
220.2***
(4.91)
Number of hives
(X5)
14.724***
(26.38)
-5.11E-03
(-0.802)
0.282***
(7.57)
1038.2***
(19.9)
R2 0.898 0.497 0.524 0.873
18
F-value 220.6 25.53 25.20 151.7
Source: Field Survey, 2009. ***, **, * indicate t-values significant at 1%, 5% and 10% levels respectively. Figures in bracket are t values.
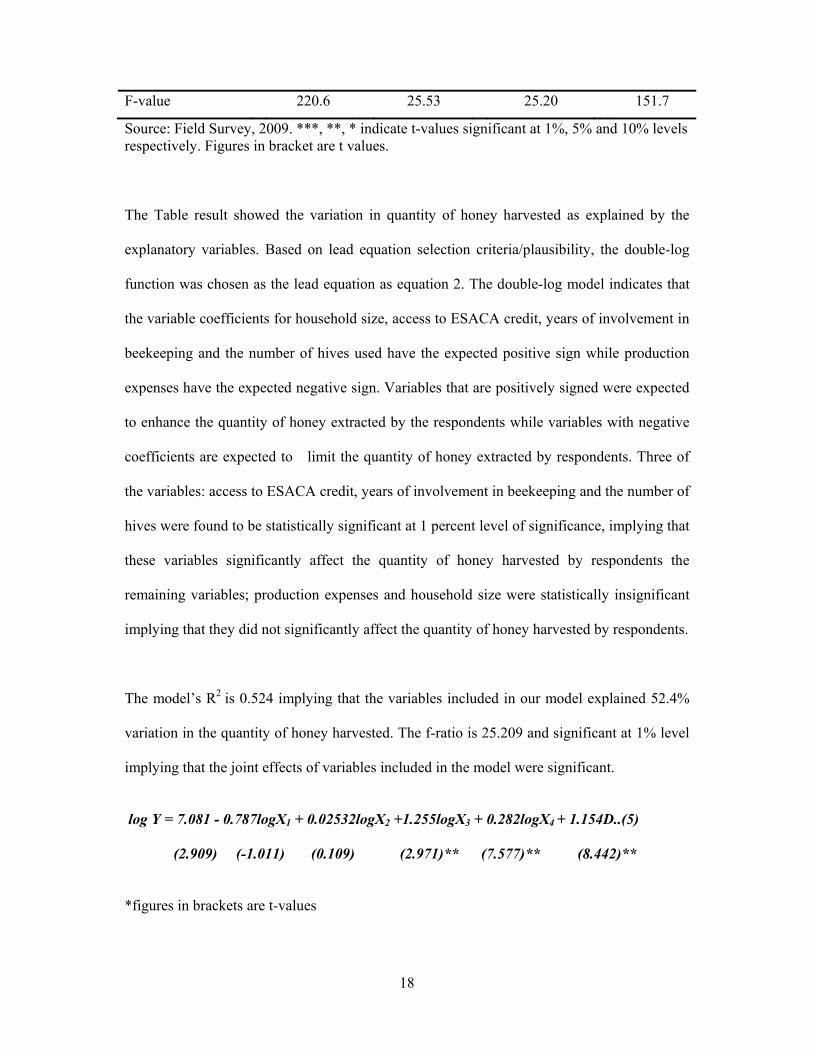
The Table result showed the variation in quantity of honey harvested as explained by the
explanatory variables. Based on lead equation selection criteria/plausibility, the double-log
function was chosen as the lead equation as equation 2. The double-log model indicates that
the variable coefficients for household size, access to ESACA credit, years of involvement in
beekeeping and the number of hives used have the expected positive sign while production
expenses have the expected negative sign. Variables that are positively signed were expected
to enhance the quantity of honey extracted by the respondents while variables with negative
coefficients are expected to limit the quantity of honey extracted by respondents. Three of
the variables: access to ESACA credit, years of involvement in beekeeping and the number of
hives were found to be statistically significant at 1 percent level of significance, implying that
these variables significantly affect the quantity of honey harvested by respondents the
remaining variables; production expenses and household size were statistically insignificant
implying that they did not significantly affect the quantity of honey harvested by respondents.
The model’s R2 is 0.524 implying that the variables included in our model explained 52.4%
variation in the quantity of honey harvested. The f-ratio is 25.209 and significant at 1% level
implying that the joint effects of variables included in the model were significant.
log Y = 7.081 - 0.787logX1 + 0.02532logX2 +1.255logX3 + 0.282logX4 + 1.154D..(5) (2.909) (-1.011) (0.109) (2.971)** (7.577)** (8.442)**
*figures in brackets are t-values
19
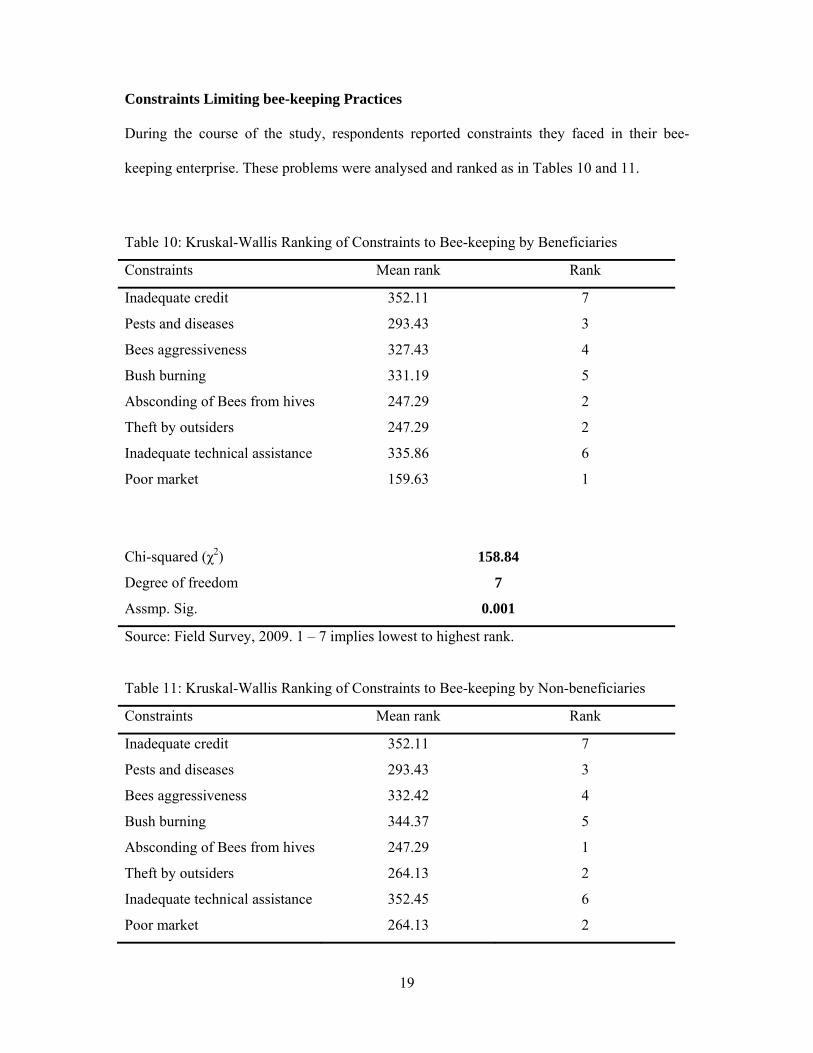
Constraints Limiting bee-keeping Practices
During the course of the study, respondents reported constraints they faced in their bee-
keeping enterprise. These problems were analysed and ranked as in Tables 10 and 11.
Table 10: Kruskal-Wallis Ranking of Constraints to Bee-keeping by Beneficiaries
Constraints Mean rank Rank
Inadequate credit 352.11 7
Pests and diseases 293.43 3
Bees aggressiveness 327.43 4
Bush burning 331.19 5
Absconding of Bees from hives 247.29 2
Theft by outsiders 247.29 2
Inadequate technical assistance 335.86 6
Poor market 159.63 1
Chi-squared (χ2) 158.84
7
0.001
Degree of freedom
Assmp. Sig.
Source: Field Survey, 2009. 1 – 7 implies lowest to highest rank.
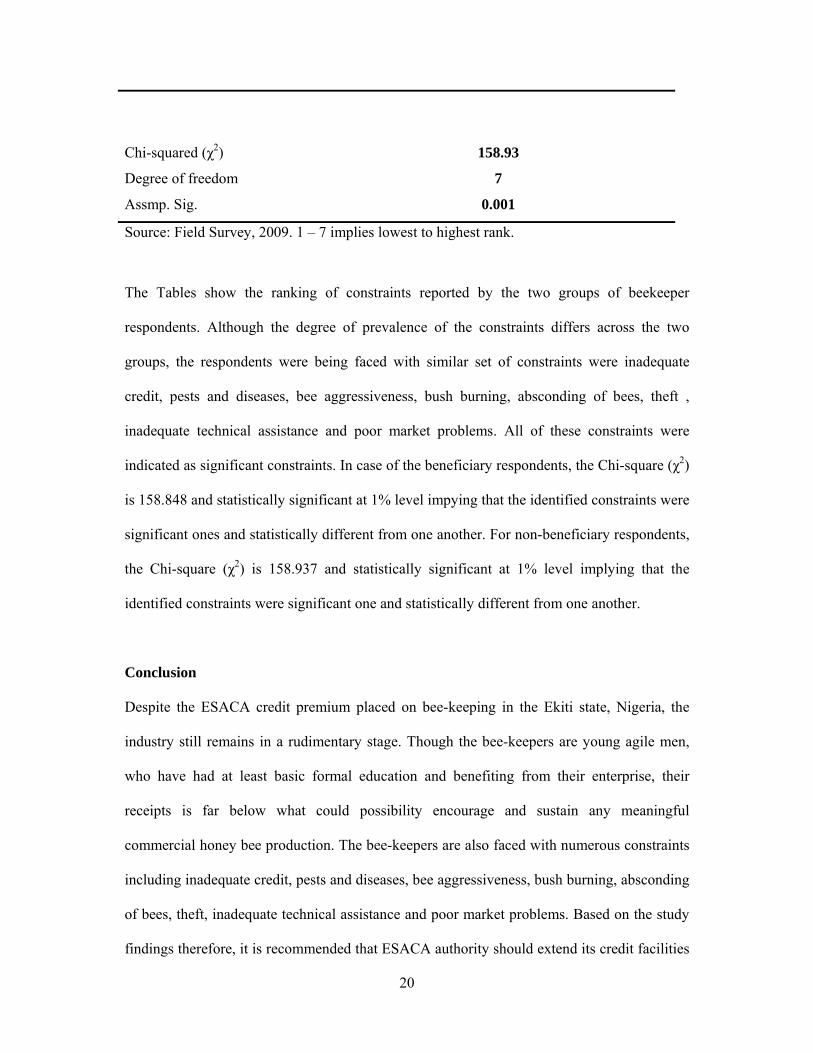
Table 11: Kruskal-Wallis Ranking of Constraints to Bee-keeping by Non-beneficiaries
Constraints Mean rank Rank
Inadequate credit 352.11 7
Pests and diseases 293.43 3
Bees aggressiveness 332.42 4
Bush burning 344.37 5
Absconding of Bees from hives 247.29 1
Theft by outsiders 264.13 2
Inadequate technical assistance 352.45 6
Poor market 264.13 2
20
Chi-squared (χ2) 158.93
7
0.001
Degree of freedom
Assmp. Sig.
Source: Field Survey, 2009. 1 – 7 implies lowest to highest rank.
The Tables show the ranking of constraints reported by the two groups of beekeeper
respondents. Although the degree of prevalence of the constraints differs across the two
groups, the respondents were being faced with similar set of constraints were inadequate
credit, pests and diseases, bee aggressiveness, bush burning, absconding of bees, theft ,
inadequate technical assistance and poor market problems. All of these constraints were
indicated as significant constraints. In case of the beneficiary respondents, the Chi-square (χ2)
is 158.848 and statistically significant at 1% level impying that the identified constraints were
significant ones and statistically different from one another. For non-beneficiary respondents,
the Chi-square (χ2) is 158.937 and statistically significant at 1% level implying that the
identified constraints were significant one and statistically different from one another.
Conclusion
Despite the ESACA credit premium placed on bee-keeping in the Ekiti state, Nigeria, the
industry still remains in a rudimentary stage. Though the bee-keepers are young agile men,
who have had at least basic formal education and benefiting from their enterprise, their
receipts is far below what could possibility encourage and sustain any meaningful
commercial honey bee production. The bee-keepers are also faced with numerous constraints
including inadequate credit, pests and diseases, bee aggressiveness, bush burning, absconding
of bees, theft, inadequate technical assistance and poor market problems. Based on the study
findings therefore, it is recommended that ESACA authority should extend its credit facilities
21
to more beekeepers. The Volume of loan and other credit facilities disbursed to these
beekeepers should be increased to reasonably productive sums. The women folks should also
be encouraged into the business. This can be achieved via incorporating more women into the
ESACA scheme. As regarding the technical constraints, it is advocated that more extension
agents should be recruited and readily available to help these beekeepers with the techniques
required for optimum honey production. Bush burning by the hunters and other forest users
during dry season should be discouraged by ESACA authorities especially in forest reserves
while possibilities and avenues for the export of honey and bye-products should be sought,
stimulated and encouraged, so as to increase the country’s foreign earnings
22
References
Adekunle, A. O. “Unlocking the potential of small-scale farmers in Nigeria: The Extension key” A paper presented at the Faculty of Agriculture Lecture, University of Ilorin held on July 13, 2007. Pg 10-13.
Adeyemi, T. O. “Statistical Techniques for Educational Research” Universal Publisher,
Surulere, Lagos. 191-193 (2003):. Ajekigbe, J. M. “Financial Intermediation for unlocking Agricultural Potential in Nigeria”. A
PowerPoint Presentation held at First Bank Lagos, Nigeria on February 8, 2007. Akande, T. “An overview of the Nigerian Rice Economy”. The Nigerian Institute of Social
and Economic Research (NISER), Ibadan, Nigeria. Pg 1-11 (2003). Ayorinde, K. L.“Agricultural Development Option as Tool to fight hunger and
underdevelopment: The Kwara State Approach”. A Paper presented at the National War College 14th Geostrategic Study Tour to Kwara State. Conference Room, Governor’s Office, Ilorin. 5 December, 2005. 17PP.
Central Bank of Nigeria (CBN), Annual Progress Report 2006. Ekiti State Agricultural Credit Agency Information Manual for Loan Applicants. (ESACA,
1999) Fakayode, B. Segun, Omotesho,O.A, Tsoho, A.Bello and Ajayi, P, Dayo. ‘An Economic Survey of Rural Infrastructures and Agricultural Productivity Profiles in Nigeria. European Journal of Social Sciences 7(2) (2008):Eurojournals inc. Eurojournals, Inc. England Available on-line at http://www.eurojournals.com/ejss_7_2.htm Ogunleye, R. F. “Beekeeping and Aquaculture: the procedure” in Introduction to
Entrepreneurship Development in Nigeria, University of Ado-Ekiti Press. Pg 140-153 (2006)..
Oluwatusin, F. M.“Costs and Returns in Modern Beekeeping and honey production in
Nigeria”. Medwell Pakistan Journal of Social Science; 5(4): 310-315 (2006). National Population Commission, 2006 Census Reports. Nurosis, M. J/Statistical Package for Social Science (SPSS): “SPSS Base System User’s
Guide”. Microsoft Corporation Chicago. Pg. 338-350.(1990). Wayne, D. W.“Applied Non-Parametric Statistics” Second Edition, PNS-Kent Publishing
Company. Pg 226-235(1990)