Embed Size (px)
Citation preview

41. A STUDY OF GEOPHYSICAL DATA ALONG THE DEEP SEA DRILLING PROJECT ACTIVEMARGIN TRANSECT OFF GUATEMALA1
Roland von Huene, U.S. Geological Survey, Menlo Park, California,John Miller and David Taylor, U.S. Geological Survey, Denver, Colorado
andDonna Blackman, U.S. Geological Survey, Menlo Park, California2
INTRODUCTION
Geophysical site survey data along the DSDP MiddleAmerica Trench transect off Guatemala (Ladd et al.,1982; von Huene et al., 1982) were augmented both be-fore and after Leg 84. Topography along the transectwas detailed in two Seabeam surveys, the first by theCharcot (Aubouin, Stephan, Renard, et al., 1982) andthe second by the Washington (T. H. Shipley et al., per-sonal communication, 1983). Glomar Challenger alsoran a grid of conventional bathymetric lines to extendthe site survey data while waiting for permission to drillsites off Guatemala on Leg 84. Seismic records alongthe main transect of the site survey were reprocessed us-ing more advanced programs than those available dur-ing the original processing of the surveys. The originalrecords were commonly obscured by diffractions (Laddet al., 1982); by further processing, many of the diffrac-tions were eliminated and tectonic features were moreclearly imaged. Reported here is a study of these dataand the resulting additions to the tectonic history of theMiddle America Trench, particularly the developmentof the forearc basin, the front of the margin, and the or-igin of topographic steps near the base of the slope.
TOPOGRAPHY IN THE TRANSECT AREAThe topographic map along the transect was greatly
improved by the two Seabeam surveys. The Seabeammaps were prepared at a 10-m contour interval, and wecombined them at a 100-m contour interval to form thecore of a new map (Fig. 1). Because the positioning ofthe Seabeam data was more accurate than the originalsite survey, the Seabeam data were used as a topographicreference to adjust the position of each conventionalbathymetric line that crossed the Seabeam core. The Glo-mar Challenger grid of lines was controlled by satellitenavigation with positions at roughly one-hour intervals,so not much adjustment was required. The original Uni-versity of Texas data were controlled by far fewer posi-tions, perhaps two or three per day. In our map (Fig. 1),
von Huene, R., Aubouin, J., et al., Init. Repts. DSDP, 89: Washington (U.S. Govt.Printing Office).
2 Addresses: (von Huene and Blackman), U.S. Geological Survey, Menlo Park, CA94025; (Miller and Taylor) U.S. Geological Survey, Denver, CO. (This chapter was preparedwhile von Huene was a visiting researcher, Laboratoire de Géologie Structurale, UniversitéPierre et Marie Curie, Académie de Paris.)
the Seabeam data are contoured with solid lines and theconventional sounding data with dashed lines.
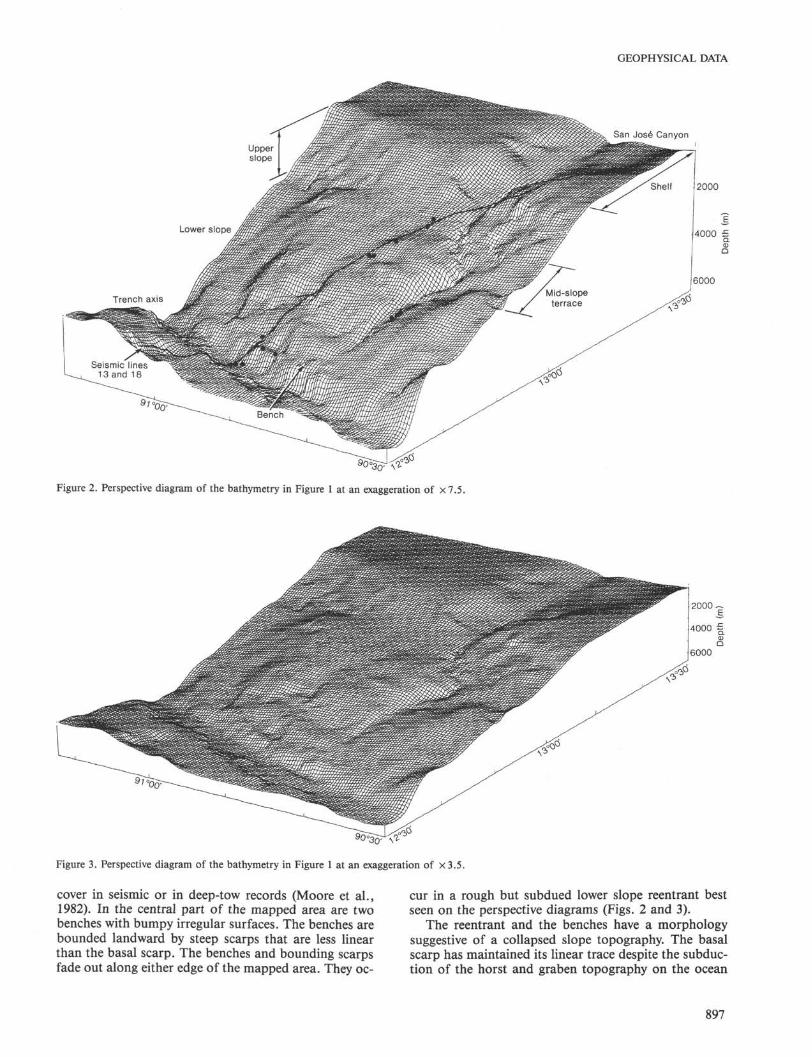
The contours were then digitized and displayed througha computer program as perspective diagrams; examplesare shown at two vertical exaggerations (Figs. 2 and 3).The major topographic elements are (1) the upper slope,which drops 1.5 km at a 12° angle; (2) a midslope ter-race, with a 2° slope: (3) a 5° lower slope: (4) and theTrench floor. Local benches mark the lower slope, andthe Trench axis is adjacent to a relatively straight basalscarp.
The most prominent transverse feature of the shelfand slope is San José Canyon, which is 20 km wide and1 km deep near the edge of the shelf. At the shelf edgethe Canyon reaches a maximum depth of 1.8 km. Thegentle subdued canyon morphology on the shelf givesway to a v-shaped central erosional furrow as the can-yon proceeds down the slope. Seismic records of theshelf show up to 1-km-thick channel fill in the uppersmooth reaches of the Canyon and erosion of the fill bythe v-shaped notch on the slope (von Huene et al., 1982;Ladd, this volume). On the lower slope, the channel ex-poses basement, as shown by drilling (Site 566 report)and seismic records 2, 7, and 10, (Ladd et al., 1982).The sharp v-shaped channel continues almost to theTrench, and is no longer detected as it crosses the low-est bench (Fig. 2) (McMillen et al., 1982). Although SanJosé Canyon is the largest canyon crossing the slope,many other canyons are defined by the Seabeam andSeismic data. One prominent straight canyon runs sub-parallel to seismic line 18 about 2 km away (Fig. 1, aban-doned canyon) and begins at the edge of the midslopeterrace. If projected a short distance to the upper reach-es of San José Canyon, it makes a straight course thatavoids the sharp offset in the present course of San JoséCanyon. These features suggest that the former canyonmay be an abandoned lower part of San José Canyon.Igneous basement rock was cored on the bank of thispossibly abandoned canyon (von Huene, this volume).
The landward slope of the Middle America Trenchoff Guatemala was previously described as an upper andlower slope divided by a midslope terrace (von Huene etal., 1982). The lower slope has a hummocky morpholo-gy and is terminated at the Trench by a straight basalscarp. The basal scarp is generally 0.5 km high, has a15° dip, and a smooth surface but no resolvable slope
895

R. VON HUENE, J. MILLER, D. TAYLOR, D. BLACKMAN
1 3°30' -
1 3°20'
<£***
91 °00' 90°50' 90°40' 90°30'
Figure 1. Topography across the DSDP Middle America Trench transect area. Contours, at 100-m inter-vals, are solid where controlled by Seabeam data (Aubouin, Stephan, Renard, et al., 1982; T. H. Ship-ley et al., personal communication, 1983), and are dashed where controlled by conventional sound-ings. Lines are adjusted ships tracks of conventional data and the regular grid of tracks at the rightmargin are from the Glomαr Challenger, made during a standby period. Conventional data positionswere adjusted by fitting conventional bathymetric profiles to the Seabeam data in areas of overlap. Thetrack through the center of the map is GUA-13 and-18, dots are DSDP drill sites, and lines are dredgetracks from the pre-drilling survey (see von Huene et al., this volume).
896
GEOPHYSICAL DATA
San José Canyon
2000
Figure 2. Perspective diagram of the bathymetry in Figure 1 at an exaggeration of ×7.5.
Figure 3. Perspective diagram of the bathymetry in Figure 1 at an exaggeration of × 3.5.
cover in seismic or in deep-tow records (Moore et al.,1982). In the central part of the mapped area are twobenches with bumpy irregular surfaces. The benches arebounded landward by steep scarps that are less linearthan the basal scarp. The benches and bounding scarpsfade out along either edge of the mapped area. They oc-
cur in a rough but subdued lower slope reentrant bestseen on the perspective diagrams (Figs. 2 and 3).
The reentrant and the benches have a morphologysuggestive of a collapsed slope topography. The basalscarp has maintained its linear trace despite the subduc-tion of the horst and graben topography on the ocean
897

R. VON HUENE, J. MILLER, D. TAYLOR, D. BLACKMAN
floor that trends 30° from the trend of the scarp (Au-bouin, Stephan, Renard, et al., 1982).
REPROCESSING OF SEISMIC RECORDS
The unexpected results of Legs 67 and 84 drillingstimulated a reexamination and reprocessing of the geo-physical data from the University of Texas site survey re-ported previously by Ladd et al. (1982). It was desirableto sharpen the imaging of reflectors in the forearc sec-tion and the diffracted areas along some of the smallfaults. Ladd migrated sections of GUA-13 and -18 with-out much success, so it appeared that an extended care-ful effort would be required to improve the record quali-ty significantly. This opinion was strengthened duringattempts to migrate portions of records required for Leg84 from the previously stacked data. The lower slopeand Trench areas in line GUA-2 showed considerable im-provement of surface detail as a result of migration, butthe deeper section was degraded. Significant improve-ment appeared to require reprocessing from the fieldtapes rather than stacked tapes, and the Digicon DISCOfacility at USGS in Denver provided improved capabili-ty over the older TEMPUS facility at the University ofTexas in Galveston.
Two records were shot along the main traverse offGuatemala by the University of Texas. The first (in 1977)was GUA-13 (Ladd et al., 1982), which was selected forthe main transect of Leg 67 drill holes. The Universityof Texas shot line GUA-18 during the next field season(in 1978) with a stronger Maxi-Pulse system rather thanthe 600-psi high-volume air guns used on GUA-13 (Laddet al., 1982). However, the record of the outgoing signalrequired to deconvolve Maxi-Pulse was improperly re-corded, and after deconvolution with another program,the resulting record was of similar quality to GUA-13.Because of its potentially greater energy and the im-proved system on which it was recorded, GUA-18 wasselected for reprocessing, despite poor deconvolution.
The field tapes were demultiplexed and reedited. Af-ter velocity analysis and a reference NMO (normal moveout) stack, the gathers were migrated. A second velocityanalysis was made on the migrated gathers, using thesemblance and the constant velocity methods. The mi-grated gathers were stacked using the revised velocities.In addition, the stacked but nonmigrated gathers weremigrated for comparison. Record GUA-18A was migratedprior to stacking, NMO-corrected and stacked, and mi-grated a second time at a 1600 m/s constant velocity(Back Pocket Plate I). The original tapes of record GUA-18B were degraded from their condition five years earli-er, because it was not possible to duplicate Ladds' re-sults at the same level of processing even with the im-proved algorithms. Thus our results, particularly withGUA-18B, were less successful than we anticipated (BackPocket Plate II).
The time sections were converted to depth using therefraction data of Ibrahim et al. (1979) and of Shor andFisher (1961). Boundaries between velocity domains weremade to change smoothly so as to avoid distortion (Fig. 4).The Shor and Fisher (1961) station is the landward-most
refraction control, and it was projected into the reflec-tion record as was done by Ibrahim et al. (1979), withthe implication that the base of the sedimentary se-quence corresponds to the boundary between the 4.4-km/s and 5.8-km/s layers. The resulting depth of thesediment in our depth section of GUA-18 is at 7.0 km atthe intersection with Shor and Fisher line 4, whereas thecorresponding refraction data are at 8.1 km. Such anapparent discrepancy is an indication of uncertaintiescontributed by the averaging of the refraction recordacross the structure seen in the reflection record paral-leling Shor and Fisher line 4 (GUA-33, Ladd, this vol-ume). The reflection record shows a large basement highcrossed by the refraction line, and where the refractionline crosses the seismic record of Seely (1979), the sedi-ment sequence is much thinner and of lower velocitythan at GUA-18. Thus the discrepancy between reflec-tion and refraction data is probably not a mistake in cal-culation but the difference between local reflection andregionally averaged refraction measurements.
A sidelight of the comparison of reflection and re-fraction data is the indication of overlap in the velocitiesof the weathered ophiolitic rocks and the deep Creta-ceous sediment. Prior to Leg 84, there was little indica-tion from velocity data that the slope was formed of anophiolitic sequence. In addition, magnetic anomalies gaveno indication of igneous rock beneath the slope exceptnear the shelf edge (Seely, 1979; Ladd et al., 1982). Com-parison of GUA-18 and the refraction intercepts fromthe University of Hawaii OBS network around Site 494(Ambos and Hussong, this volume) indicates velocitiesas low as 3.4 km/s in the top of the ophiolite sequence.In contrast are the indications of velocities as high as4.4 km/s in the deep portion of the sediment sequence,suggesting an overlap of 1 km/s in the velocities of deepsedimentary and serpentinized ophiolitic rock.
DESCRIPTION OF SEISMIC RECORD GUA-18A
GUA-18 follows the upper course of San José Can-yon across the shelf edge and then crosses the slope(Fig. 1). The landward part of the record, GUA-18A(Back Pocket Plate I), reveals more than 9 km of sedi-ment beneath the shelf that thins to only about 5.5 kmat the seaward edge of the shelf, just before the sedimentsequence ends. On the slope, less than 1 km of sedimentcovers the igneous rock of the seaward extremity of theCentral American continent.
The upper part of GUA-18A shows the fill in SanJosé Canyon (Back Pocket Plate I, time section). Twosequences of canyon fill can be distinguished in the re-cord: the lower, a wedge beginning at SP (Shot Point)415 and extending seaward, is covered by the upper, whichcomprises the main body of canyon fill. The lower wedgeappears to be guarded by a 1.8-km-high bank cut by theCanyon. A period of rapid subareal erosion is not alikely explanation for this deep Canyon, because in thebanks of the Canyon the Neogene section has no uncon-formities indicating a period of subaerial erosion. Thuswe speculate that the depth of the Canyon resulted froma long period of submarine erosion, and perhaps repeat-
898

ISO interval velocity plot
LINE iθB DEPTH VELOCITIES
ISO interval velocity plot
LINE 18H C E P ' - VE^
Figure 4. Velocity model used in converting GUA-18 to a depth section by computer.
R. VON HUENE, J. MILLER, D. TAYLOR, D. BLACKMAN
ed erosion and deposition of canyon fill has resultedfrom a history sufficiently long to span more than onemajor change in sea level.
Three of the time horizons traced by Ladd (this vol-ume) through a network of seismic records from theESSO Petrel drill hole (Seely, 1979) are used for tem-poral control here. The sediment sequence beneath theshelf is divided accordingly into a Neogene, an Oligo-cene-Eocene, a Paleocene, and an Upper Cretaceous andolder (?) section.
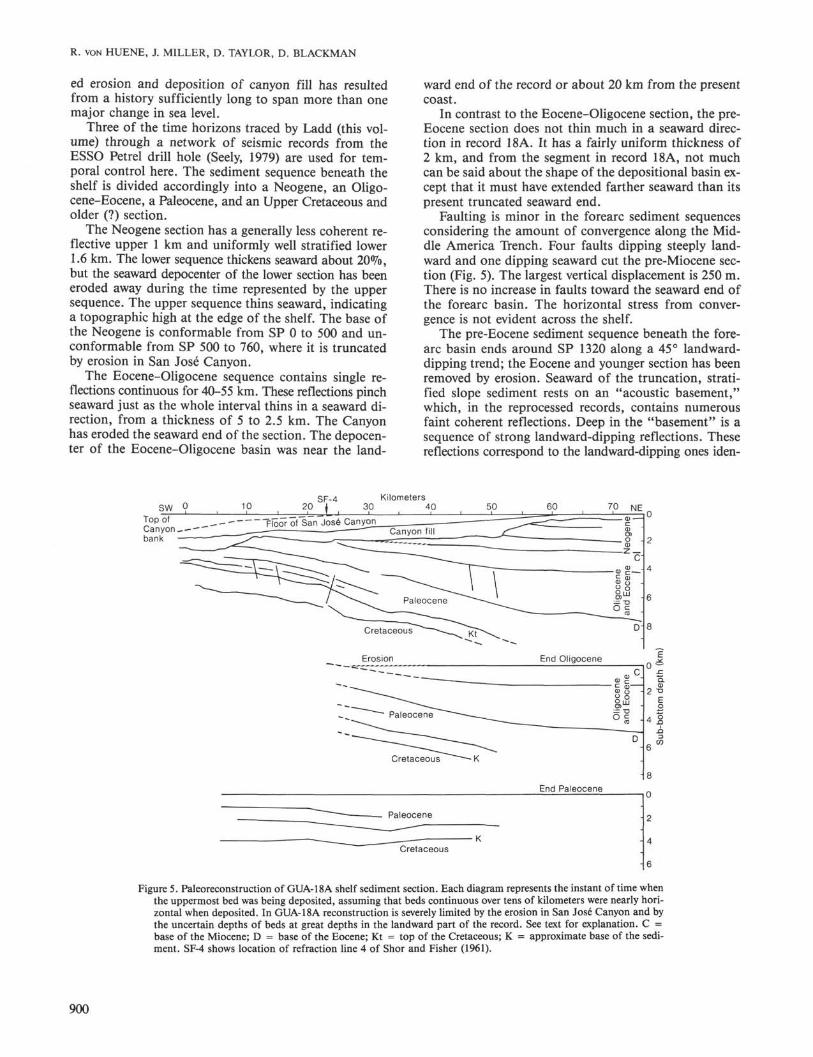
The Neogene section has a generally less coherent re-flective upper 1 km and uniformly well stratified lower1.6 km. The lower sequence thickens seaward about 20%,but the seaward depocenter of the lower section has beeneroded away during the time represented by the uppersequence. The upper sequence thins seaward, indicatinga topographic high at the edge of the shelf. The base ofthe Neogene is conformable from SP 0 to 500 and un-conformable from SP 500 to 760, where it is truncatedby erosion in San José Canyon.
The Eocene-Oligocene sequence contains single re-flections continuous for 40-55 km. These reflections pinchseaward just as the whole interval thins in a seaward di-rection, from a thickness of 5 to 2.5 km. The Canyonhas eroded the seaward end of the section. The depocen-ter of the Eocene-Oligocene basin was near the land-
ward end of the record or about 20 km from the presentcoast.
In contrast to the Eocene-Oligocene section, the pre-Eocene section does not thin much in a seaward direc-tion in record 18A. It has a fairly uniform thickness of2 km, and from the segment in record 18A, not muchcan be said about the shape of the depositional basin ex-cept that it must have extended farther seaward than itspresent truncated seaward end.
Faulting is minor in the forearc sediment sequencesconsidering the amount of convergence along the Mid-dle America Trench. Four faults dipping steeply land-ward and one dipping seaward cut the pre-Miocene sec-tion (Fig. 5). The largest vertical displacement is 250 m.There is no increase in faults toward the seaward end ofthe forearc basin. The horizontal stress from conver-gence is not evident across the shelf.
The pre-Eocene sediment sequence beneath the fore-arc basin ends around SP 1320 along a 45° landward-dipping trend; the Eocene and younger section has beenremoved by erosion. Seaward of the truncation, strati-fied slope sediment rests on an "acoustic basement,"which, in the reprocessed records, contains numerousfaint coherent reflections. Deep in the "basement" is asequence of strong landward-dipping reflections. Thesereflections correspond to the landward-dipping ones iden-
sw 9Top ofCanyon _—•--'bank
Kilometers30 40 60 70 NE
Floor of San José Canyon
Cretaceous ~~~K
0
2
4
6
Figure 5. Paleoreconstruction of GUA-18A shelf sediment section. Each diagram represents the instant of time whenthe uppermost bed was being deposited, assuming that beds continuous over tens of kilometers were nearly hori-zontal when deposited. In GUA-18A reconstruction is severely limited by the erosion in San José Canyon and bythe uncertain depths of beds at great depths in the landward part of the record. See text for explanation. C =base of the Miocene; D = base of the Eocene; Kt = top of the Cretaceous; K = approximate base of the sedi-ment. SF-4 shows location of refraction line 4 of Shor and Fisher (1961).
Paleocene
~ —
Cretaceous— K
End Paleocene
-
-
900

GEOPHYSICAL DATA
tified by Ladd et al. (1982) at this same position in re-cord GUA-13. However, rather than being a single re-flection extending from the surface, the migrated recordindicates a packet of three reflections at depth. Thus de-spite refraction velocities from 4.5 to 4.8 km/s, the up-per slope may contain either deformed and consolidatedsediment or ophiolite.
The relative depth of basement between the end ofthe forearc basin and the beginning of the slope hasmuch significance in regard to the tectonic history ofthis margin. If the forearc basin is underlain by pre-LateCretaceous oceanic crust (Seely, 1979), the lowest reflec-tion of the sediment sequence is the minimum depth tothis old oceanic crust. Beneath the deposits of the adja-cent slope the results of Leg 84 indicate ophiolite frompre-Late Cretaceous ocean crust (Site 570 report; Bour-gois et al. and von Huene et al., this volume). If the areaseaward of the clear reflections is considered to be com-posed of ophiolites because of its high refraction veloci-ties, this limits interpretations. If the questionable areacontains ophiolites, these ophiolites are 1.5 to 2 kmshallower than the lowest reflection from a sedimentarybed in the forearc basin. Thus the vertical displacementof the forearc basin is down relative to the slope, whichcomplicates interpretations of a thrust boundary at theend of the stratified sequence. However, the dip of sucha boundary is unknown.
A paleoreconstruction was made of the sediment se-quence beneath the forearc basin from the depth sectionof Back Pocket Plate I (Fig. 5). It was assumed that thebeds continuous for 10 to 40 km were originally depos-ited in a nearby horizontal attitude. Thus when such abed is rotated to horizontal and the overlying section isstripped off, it provides a picture of the basin at thetime the horizon was deposited. Unfortunately, alongGUA-18A much of the Eocene-Oligocene sequence wasremoved by erosion in San José Canyon. Also, below adepth of 9 km, the reflections from the Cretaceous andPaleocene strata are not clear. However, the interpreta-tion in Figure 5 shows that the Cretaceous and Paleo-cene sediment bodies are of relatively uniform thick-ness, and near the edge of the present shelf they wereuplifted to form the Eocene-Oligocene basin. This samesequence of events was proposed from Paleobathymetricstudies by Seely (1979).
GUA-18B, LOWER SLOPE, TRENCH, ANDSEAWARD SLOPE
The reprocessing of GUA-18B eliminated many ofthe diffractions and thus clarified structural relations inthe record. Three displays were used most in the inter-pretation: (1) the migrated stacked data, (2) the data mi-grated before stacking, and (3) the migrated data con-verted to a depth section. Migration before stacking wasa most successful technique for removing diffractions,as is illustrated along the seaward slope of the Trench(Back Pocket Plate II, time section). Seaward of theTrench the migration before stacking yields the best con-tinuity of reflections and shows (1) small faults not visi-ble in other displays, (2) a buried ridge in the Trench in-tercepted by drilling (Aubouin, von Huene et al., 1982;
Coulbourn, 1982), and (3) buried sediment horizons onthe lower slope. The images of the fault scarps are sur-prisingly sharp considering the angle of roughly 35° be-tween the line of section and the trend of horst and gra-ben on the oceanic plate (Aubouin, Stephan, Renard, etal., 1982).
On the landward slope of the Trench, reflections havebeen clarified considerably below the first bench. Thecover of slope deposits can now be seen cropping outalong the basal scarp (Back Pocket Plate II). Generally,however, the top 0.4 s of the record are not reflective,followed by a sequence of strong irregular reflectionsthat probably mark the top of hard sediment and per-haps rubble from upslope. Below a rather noncoherentreflective section, weak coherent reflections (between 8.1and 8.6 s) are possibly from the sediment being subduct-ed beneath the landward slope of the Trench. Sedimentsubduction is required here because no sediment has beenaccreted despite convergence at about 9 cm/yr., duringthe Neogene (von Huene and Aubouin, 1982; Aubouin,von Huene, et al; 1982).
Scarps of the landward slope have more irregularitythan those of the seaward slope, and their structure isless clearly defined in the seismic record. Behind thefirst bench, the second scarp has some similarity withthe faults of the seaward slope (SP 1350 and 1410). Somereflectors are truncated at the scarp, and others tend tofollow the slope. Toward the back of the bench, reflec-tions appear to be back-rotated.
Across the next bench the original data are degradedand little structure can be seen. The uppermost scarphas a strong reverberant sequence at the seafloor andpossibly some truncation of reflections.
Along the landward part of the record, we had hopedto clarify the basement/slope sediment contact. The topof the ophiolitic basement was previously recognized asthe uppermost highly diffracting, high-amplitide surfacein a band of multiple overlapping diffractions (von Hueneet al., 1982). Migration successfully collapsed the dif-fractions and left a band of short strong reflections. Thebasement surface must be rough. Within the slope de-posits only local coherent areas can be seen. Poor coher-ency indicates poorly bedded sediment at the resolutionof the seismic technique employed (about 50 m vertical).
GUA-13, AIR GUN RECORDAs noted previously, seismic record GUA-13 was shot
using low-pressure, (600 psi) high-volume air guns, whichproduced a different type of seismic signal than the Maxi-Pulse. The processing sequences were similar; however,because of different source characteristics and some dif-ferences in position, the velocities were determined inde-pendently. Migration before stack was performed at aconstant velocity of 1700 m/s. The reprocessing clari-fied details in the upper one second of the record (BackPocket Plate III). The termination of bedding along thesteps of the lower slope are clarified better than in GUA-18B and show that strata in the slope deposits indeedend along the front of each step and are not folded un-der. The steps on the landward slope in GUA-13 havethe same character as those on the seaward slope of the
901

R. VON HUENE, J. MILLER, D. TAYLOR, D. BLACKMAN
Trench in GUA-18B. Thus on the landward slope, seis-mic records and a morphology suggesting large-scaleslope failure indicate a normal fault origin for the steps.
Reprocessing of GUA-13 also revealed faint indica-tors of stratification beneath the upper slope, as wasnoted for GUA-18A. The faint reflections are subparal-lel to the landward-dipping reflections of Ladd et al.,(1982) and are truncated at the base of the slope strata.The basal slope strata appear to be little disrupted byfaults, indicating major tilting of the strata prior to de-position of the slope sediment.
REEXAMINATION OF THE SITE SURVEYGEOPHYSICAL DATA
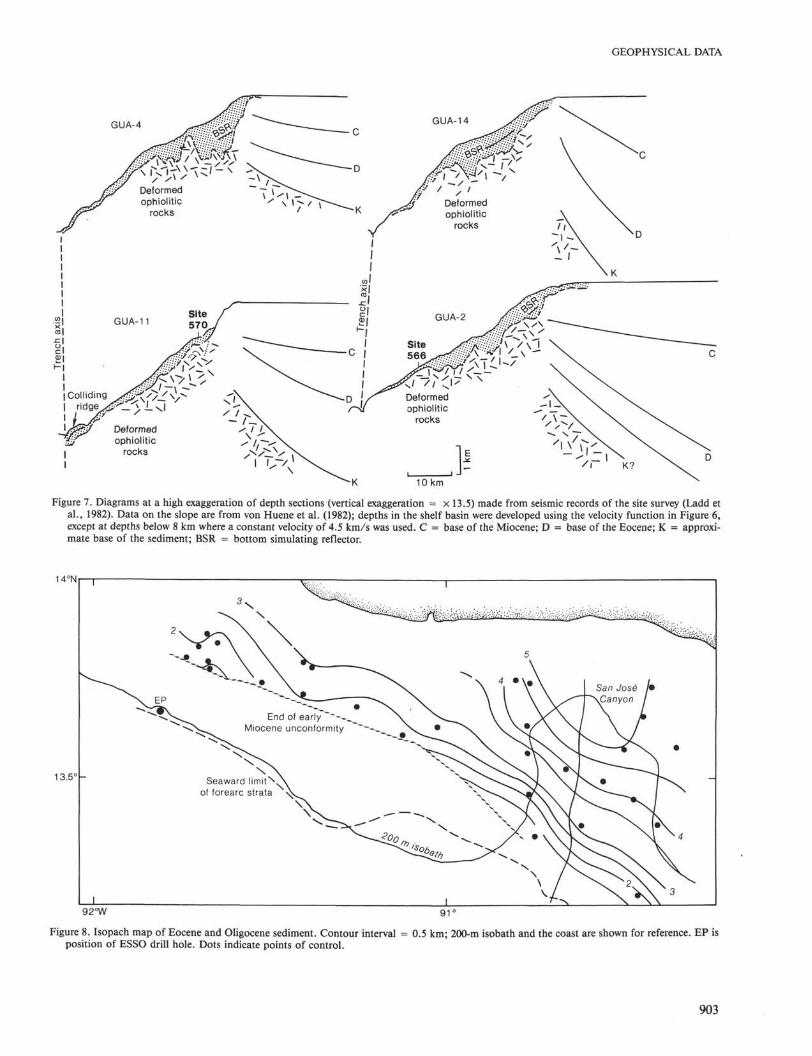
The insights gained from study of GUA-18 and -13and the results of Leg 84 led to reexamination of theoriginal site survey data. The biostratigraphy of the fore-arc basin was known only from the published summaryof a single industry drill hole and was tied to the uncon-formities of a seismic record (Seely, 1979); the sequenceis not exposed along the coast of Guatemala. The baseof the Miocene, the top of the Paleocene, and locallythe top of the Cretaceous were traced both by us and byLadd (this volume) through the network. These and oth-er significant horizons were graphically converted fromtime to depth using a single average velocity model (Fig. 6)for simplicity in hand calculation. This method differsfrom the use of variable velocities in GUA-18, but doesnot greatly distort the general shapes of the sedimentbodies. The general trend of thickness changes is shownat high vertical exaggeration in Figure 7, and the forearcsections are appended to the end of records previouslyconverted to depth in von Huene et al., (1982).
Velocity (km/s) or depth (km)2 3 4 5 6
Figure 6. Time-velocity plots (solid lines) of refraction line 4 (Shorand Fisher, 1961), ESSO sonic log data (Seely, 1979), and intervalvelocities from stacking velocities at SP 430, GUA-18A. The time-depth relation (dashed line) was derived from the time-velocity da-ta, and an average was used to construct the depth diagrams ofFigures 6 through 12.
The indications of uplift at the edge of the shelf seenin GUA-18 are also seen on other lines of the site survey.In depth sections (Fig. 7), it is clear that the main Neo-gene depocenter was near the Guatemalan coast in a po-sition similar to the present one, and that the shelf edgewas locally uplifted. Thus it appears that with the excep-tion of periodic insular emergence at the edge of theshelf, the present environment represents the general Neo-gene environment across the shelf.
The Eocene-Oligocene sequence (C-D, Fig. 7) thinsseaward, and the seaward edge of the basin is truncated.In the western part of the area, the Eocene-Oligocenesequence has been eroded to a depth of 1 km at the edgeof the shelf along an early Miocene unconformity. To-ward shore and in the eastern part of the area, the angu-lar discordance disappears. The extent and depth of theearly Miocene erosion is discussed in more detail furtheron.
The Paleocene commonly thins gently seaward and isdistinguished by a more uniform thickness than the over-lying units.
The base of the Upper Cretaceous (and perhaps old-er) section is best seen in the seaward part of the recordpublished by Seely (1979) and in GUA-4 and -5 wherethe unit is thin. It was assumed that the Cretaceous sec-tion is underlain by oceanic crust (Seely, 1979, Ladd etal., 1982). If acoustic basement is assumed to be ophio-litic beneath the upper slope, the base of the sedimenta-ry section is everywhere lower than the basement be-neath the adjacent landward slope of the Trench (Fig. 7).The basement would thus be deeper beneath the forearcbasin than it is beneath the slope, an important con-straint in the interpretation of the tectonic boundary be-tween the forearc basin and the slope of the Trench.
The basin shape changed between the Paleocene andthe early Miocene during major uplift at the edge of theshelf and the development of the present arc-trench sys-tem, as was proposed by Seely (1979). A further studyof the uplift was made by constructing isopach maps(Figs. 8 and 9) of the Paleocene and of the Eocene-Oli-gocene intervals using all of the seismic data in the area(Ladd, this volume). For convenience of calculation, theaverage velocity function (Fig. 6) was used. The Eo-cene-Oligocene sediment thickness indicates a depocen-ter landward of the site survey, and the contours trendsubparallel to the edge of the present shelf (Fig. 8). Thearea eroded during the early Miocene is near the edge ofthe shelf and is localized west of San José Canyon. Atthe present head of San José Canyon about 5 km of sed-iment accumulated. The Eocene-Oligocene basin wasflanked by a sharp structural high near the edge of theshelf, which is now partially missing.
Within the Eocene-Oligocene reflective sequence andconcentrated on the seaward side of the basin are manycontinuous beds interspersed with a few local uncon-formities and pinching beds. At least some of the un-conformity and irregular bedding seems associated witherosion of the edge of the shelf and deposition from aseaward sediment source. Records trending parallel tothe strike of the basin show good continuous strata bro-ken locally by channels. What remains of the eroded
902
GEOPHYSICAL DATA
GUA-4
Figure 7. Diagrams at a high exaggeration of depth sections (vertical exaggeration = × 13.5) made from seismic records of the site survey (Ladd etal., 1982). Data on the slope are from von Huene et al. (1982); depths in the shelf basin were developed using the velocity function in Figure 6,except at depths below 8 km where a constant velocity of 4.5 km/s was used. C = base of the Miocene; D = base of the Eocene; K = approxi-mate base of the sediment; BSR = bottom simulating reflector.
14°N
13.5° -
1
-
1
EP ^ ^ " ^ ' - C l ^ X^ " ^ X ^ End of early ~--_ S . Vv>-___^
• ^ s ^ ^ Miocene unconformity ~~~-^ S .
Seaward limit^A.of forearc strata • ^ ^
1
. • ; r -' . i i • • ' ü i . =L;
\
5\"\ \
S / V S.v/rs. S.
•v^x
TV
San José / •~t~~\Canyon J
x irx̂
92°W 91 '
Figure 8. Isopach map of Eocene and Oligocene sediment. Contour interval = 0.5 km; 200-m isobath and the coast are shown for reference. EP isposition of ESSO drill hole. Dots indicate points of control.
903

R. VON HUENE, J. MILLER, D. TAYLOR, D. BLACKMAN
14°N
San JoséI Canyon
13.5°
92°W
Figure 9. Isopach map of Paleocene sediment. Contour interval = 0.5 km; 200-m isobath and the coast are shown for reference. EP is position ofESSO drill hole.
area at the seaward edge of the forearc basin is up to35 km wide.
The isopach map of the Paleocene section has shal-lower gradients in contrast to the Eocene-Oligocene sec-tion, and the thickest sediment is in a mid-shelf ratherthan a near-coastal position. The seaward terminationof the Paleocene section is not linear as though faultedand without indication of containment behind a sea-ward structural high. Again, the eastern and westernsediment bodies have somewhat different shapes. In thewestern part, the Paleocene laps onto the Cretaceousfrom a seaward direction, but otherwise there is littleangular discordance between them. Records across strikeshow rare local unconformities and possible lensing. Theisopach map and reflective sequence suggest a series oflow fanlike bodies with occasional channels. The Paleo-cene unit thins gently in a seaward direction, indicatinga landward source area.
The isopach maps show the change in basin configu-ration in response to the regional tectonism that markedinitiation of the present arc-trench system. For furtherpaleoreconstruction, a line from either end of the sitesurvey was chosen to represent the two structural endmembers. Records GUA-2 and GUA-4 were plotted indepth at a vertical exaggeration of about ×3 (Figs. 10and 11). Then a reconstruction was made assuming, asbefore, that a sequence of parallel reflectors 10 km andmore long were probably deposited in a near-horizontalattitude.
The sequence of diagrams for GUA-2 (Fig. 10) wererelatively simple to construct, because the record con-tains no large angular unconformities. Along GUA-2 thebase of the Neogene section is only about 1 km deepernear the depocenter than at the present shelf edge. Thus
the underlying beds are rotated only slightly by the re-construction back to the early Miocene. The Eocene-Oligocene section thickens about 5 km from the shelfedge to the middle of the basin; thus the rotation result-ing from stripping of the Eocene-Oligocene section isconsiderable. The remaining Paleocene sediment bodythins seaward at a far less rapid rate than the Eocene-Oligocene basin, and its possible seaward extension wasestimated by projecting the upper and lower bounda-ries. Perhaps as much as 10 to 20 km of the front of thePaleocene basin is now missing.
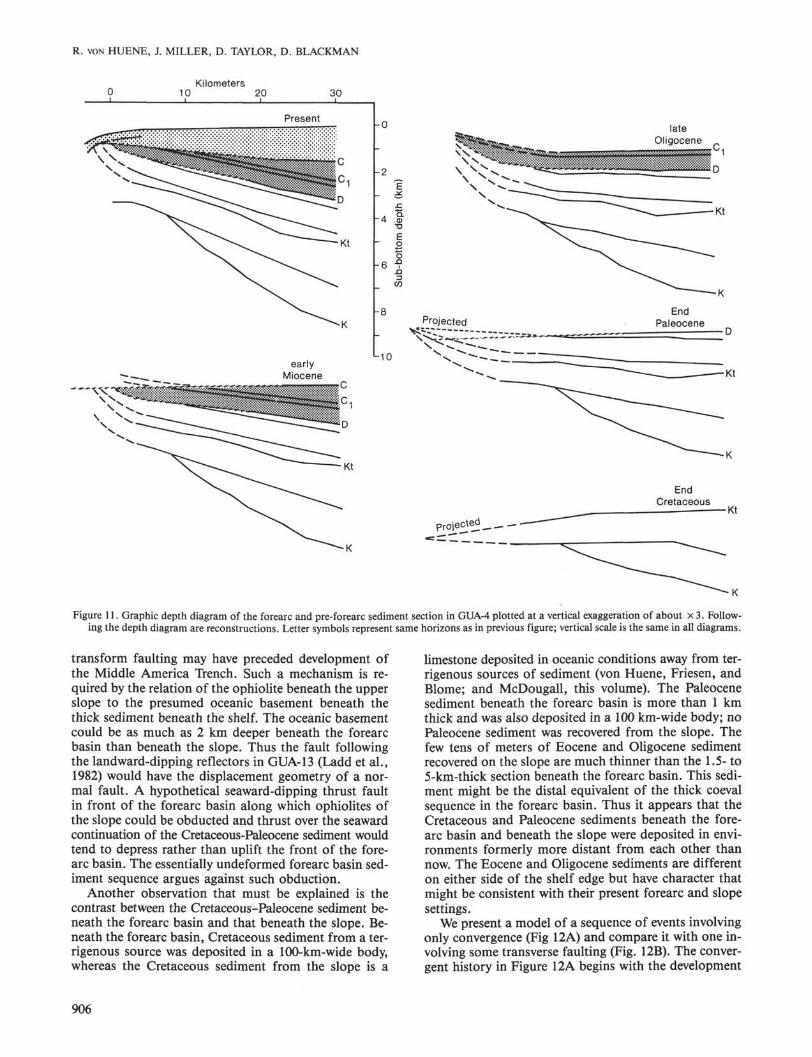
The sequence of diagrams for GUA-4 (Fig. 11) is com-plicated by two profound angular unconformities andby the fact that only the seawardmost 30 km of the fore-arc basin were surveyed. Again, there are few changes inbasin configuration when the Neogene basin is strippedaway, but erosion at the edge of the shelf has removedmuch of the uplifted end of the forearc basin. By rotat-ing a sequence of reflections within the Eocene-Oligo-cene section, the relative uplift at the edge of the shelfbecomes clearer. Uplift appears to have been a gradual latePaleocene to late Oligocene event. The underlying Pa-leocene body is of relatively uniform thickness and mayhave extended farther seaward than the uniformly thickCretaceous sediment body. The present forearc basinwas configured in the late Paleogene and has remainedmuch the same through most of the Neogene.
DISCUSSIONOur diagrams of the progressive development of the
forearc are not tied to absolute water depths except aterosional unconformities. We now use the benthic pale-ontology from the ESSO Petrel drill hole summarizedby Seely (1979) to develop a tectonic history. With only
904

GEOPHYSICAL DATA
SWPresent 0
-10
ProjectedEnd Paleocene
Paleocene D
K Kt
Figure 10. Graphic depth diagram of the forearc and pre-forearc sedi-ment sections in GUA-2 plotted at a vertical exaggeration of about× 3. Below the present-day depth diagram are reconstructions madeas was done with GUA-18A. C = base of the Miocene; D = baseof the Eocene; Kt = top of the Cretaceous; K = approximate baseof sediment.
a single drill hole in the forearc basin and underlying se-quence, we can only project a single benthic paleontolo-gy throughout the network of seismic lines across theshelf.
The tectonic history diagram of Seely (1979) is basedon a study of benthic microfossils that is more than 10years old. In the past decade, the techniques for deter-mining depth from studies of benthic foraminifers haveadvanced. The depths of microfossil zones shown bySeely are shallower than those used by McDougall in herstudy of Leg 84 materials (McDougall, this volume),and the two studies need to be normalized to a commondepth zonation. Faunal lists are not available to adjustthe depths used by Seely in his analysis. His depths canbe redefined, but with less confidence, by applying thedepth limits used by McDougall to the named zones ofSeely (1979). This results in a much slower rate of upliftthan implied by Seely (1979).
The Paleocene-Cretaceous sediment from the ESSOPetrel hole contains microfossils that lived below the ly-socline (greater than 3000 m deep). When we rotatedthis sequence to its original position and stripped offthe overlying units, the Cretaceous-Paleocene intervalshowed a gentle seaward thinning. The 60-km portion of
the sequence shown in GUA-2 (Fig. 10) records only itspartial width, from simple projection, the sequence ap-pears to have extended landward at least to the presentcoastal plain, a distance of more than 20 km. The sea-ward end of the Cretaceous-Paleocene units is missing,and by projection it appears that about 10 to 20 km hasbeen removed. Thus the sediment body must have beenabout 100 km wide. Seely suggests that these sedimentswere deposited on an abyssal plain or in a trench. We fa-vor deposition on an abyssal plain near the base of aslope because of the terrigeneous rates of sediment ac-cumulation (ca. 170 m/m.y., as derived from the tecton-ic history diagram of Seely), the planar shape of thebody, and its approximately 100-km width, which is wellin excess of most undeformed trench-filling sedimentbodies. The configuration of the lowest body in GUA-4(Fig. 11) suggests a turbidite filling of local pockets inan irregular topography of the igneous ocean crust.
The shapes of the Eocene-Oligocene bodies recordthe uplift of the front of the margin. The tectonic histo-ry diagram of Seely (1979) is diagramed to show a veryrapid uplift at the end of the Paleocene, but in his dis-cussion Seely implies a much slower rate. If Seely's dataare adjusted to McDougalPs depth zonation, uplift inthe Paleocene was a minimum of 300 to 700 m. Ourgraphic reconstruction (Figs. 10 and 11) suggests a pro-gressive Eocene-Oligocene uplift, especially in recordsof the southeast part of the area. The wedging out ofbeds seaward throughout most of the Eocene-Oligocenesection indicates uplift over much of that period.
A well-defined forearc basin had developed by thebeginning of the Neogene. The benthic assemblages inthe Neogene were deposited in middle to upper bathyaldepths, and uplift continued at the present shelf edge asthe basin was loaded with sediment (Seely, 1979), Theerosion of Neogene beds at the edge of the shelf wasprobably caused by the combined effects of tectonic up-lift and a drop in sea level, perhaps in the late Oligoceneand early Miocene periods of lowered sea level. Duringthe Oligocene and the Neogene, sites on the slope of theTrench were at abyssal depths (greater than 3500 m), un-til the end of the Neogene when Sites 570 (Leg 84) and496, and 497 (Leg 67) rose to bathyal depths (McDou-gall, this volume).
In summary, we have extended our study over a widerarea than did Seely (1979) and find that our respectiveinterpretations in the forearc area are similar. However,the discovery of Cretaceous ophiolites, cherts, and lime-stone covered by Eocene and younger slope sediment atthe front of the margin (Aubouin, von Huene, et al.,1982) provides different constraints at the front of themargin than were available to Seely. In constructing atectonic history, the two end-member interpretations ofthe upper slope in seismic records provides two limitingcases. If the faint stratification beneath the upper slopeis inferred to be the imbricated missing frontal part ofthe Cretaceous and Paleocene base of slope sedimentaprons, a history dominated by thrusting can be postu-lated. However, if the upper slope is inferred to consistmainly of ophiolitic rock, as might be implied from theophiolite recovered at Site 570, a period dominated by
905
R. VON HUENE, J. MILLER, D. TAYLOR, D. BLACKMAN
Kilometers10 20 30
Presentlate
Oligocene
4 α>T3Eoo
6 "?
CO
- 8Projected
EndPaleocene
earlyMiocene
-10
EndCretaceous
projected _ ^ -
•Kt
Figure 11. Graphic depth diagram of the forearc and pre-forearc sediment section in GUA-4 plotted at a vertical exaggeration of about × 3. Follow-ing the depth diagram are reconstructions. Letter symbols represent same horizons as in previous figure; vertical scale is the same in all diagrams.
transform faulting may have preceded development ofthe Middle America Trench. Such a mechanism is re-quired by the relation of the ophiolite beneath the upperslope to the presumed oceanic basement beneath thethick sediment beneath the shelf. The oceanic basementcould be as much as 2 km deeper beneath the forearcbasin than beneath the slope. Thus the fault followingthe landward-dipping reflectors in GUA-13 (Ladd et al.,1982) would have the displacement geometry of a nor-mal fault. A hypothetical seaward-dipping thrust faultin front of the forearc basin along which ophiolites ofthe slope could be obducted and thrust over the seawardcontinuation of the Cretaceous-Paleocene sediment wouldtend to depress rather than uplift the front of the fore-arc basin. The essentially undeformed forearc basin sed-iment sequence argues against such obduction.
Another observation that must be explained is thecontrast between the Cretaceous-Paleocene sediment be-neath the forearc basin and that beneath the slope. Be-neath the forearc basin, Cretaceous sediment from a ter-rigenous source was deposited in a 100-km-wide body,whereas the Cretaceous sediment from the slope is a
limestone deposited in oceanic conditions away from ter-rigenous sources of sediment (von Huene, Friesen, andBlome; and McDougall, this volume). The Paleocenesediment beneath the forearc basin is more than 1 kmthick and was also deposited in a 100 km-wide body; noPaleocene sediment was recovered from the slope. Thefew tens of meters of Eocene and Oligocene sedimentrecovered on the slope are much thinner than the 1.5- to5-km-thick section beneath the forearc basin. This sedi-ment might be the distal equivalent of the thick coevalsequence in the forearc basin. Thus it appears that theCretaceous and Paleocene sediments beneath the fore-arc basin and beneath the slope were deposited in envi-ronments formerly more distant from each other thannow. The Eocene and Oligocene sediments are differenton either side of the shelf edge but have character thatmight be consistent with their present forearc and slopesettings.
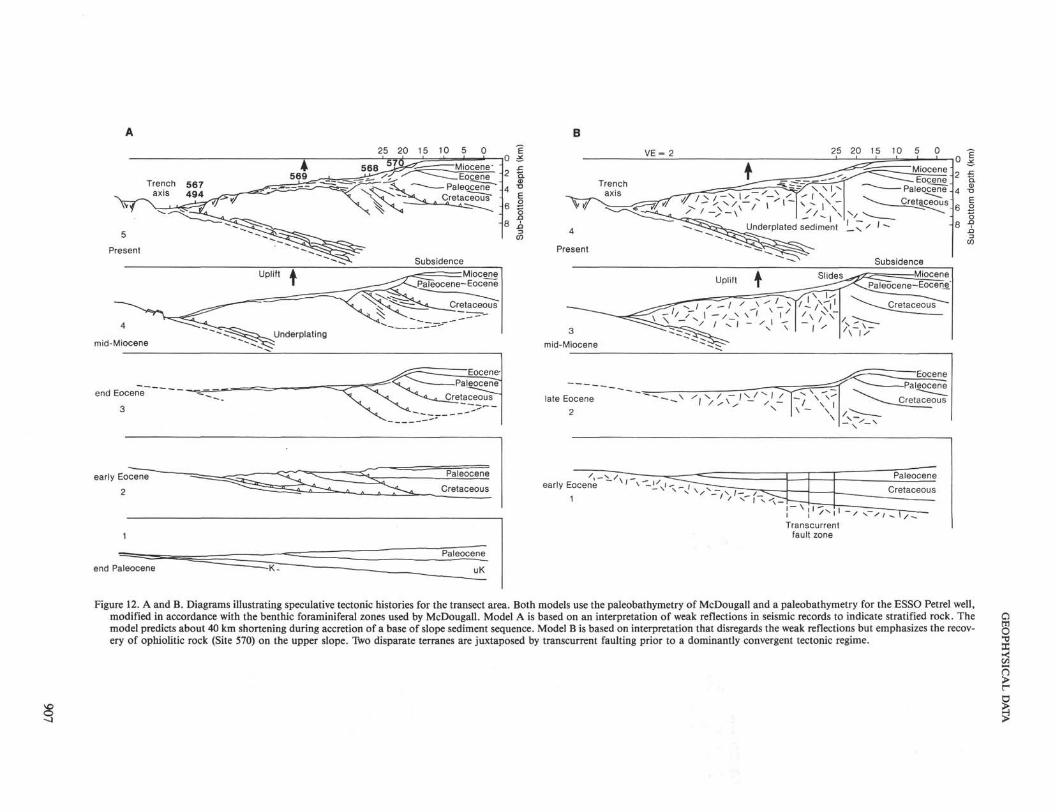
We present a model of a sequence of events involvingonly convergence (Fig 12A) and compare it with one in-volving some transverse faulting (Fig. 12B). The conver-gent history in Figure 12A begins with the development
906
25 20 15 10 5 0 VE= 2 25 20 15 10 5 0
2 16 °
I8 ^
Subsidence
mid-Miocene
Eocene-
end Eocene
3
4
Present
Underplated sediment ._«
Subsidence
Uplift ^ Slides -Miocene
2 £
6 °
mid-Miocene
ate Eocene ~~~~^^^ ×\2
× \
rIZ Eocene
Paleocene
___Cretaceous
Transcurrentfault zone
end Paleocene
Figure 12. A and B. Diagrams illustrating speculative tectonic histories for the transect area. Both models use the paleobathymetry of McDougall and a paleobathymetry for the ESSO Petrel well,modified in accordance with the benthic foraminiferal zones used by McDougall. Model A is based on an interpretation of weak reflections in seismic records to indicate stratified rock. Themodel predicts about 40 km shortening during accretion of a base of slope sediment sequence. Model B is based on interpretation that disregards the weak reflections but emphasizes the recov-ery of ophiolitic rock (Site 570) on the upper slope. Two disparate terranes are juxtaposed by transcurrent faulting prior to a dominantly convergent tectonic regime.
R. VON HUENE, J. MILLER, D. TAYLOR, D. BLACKMAN
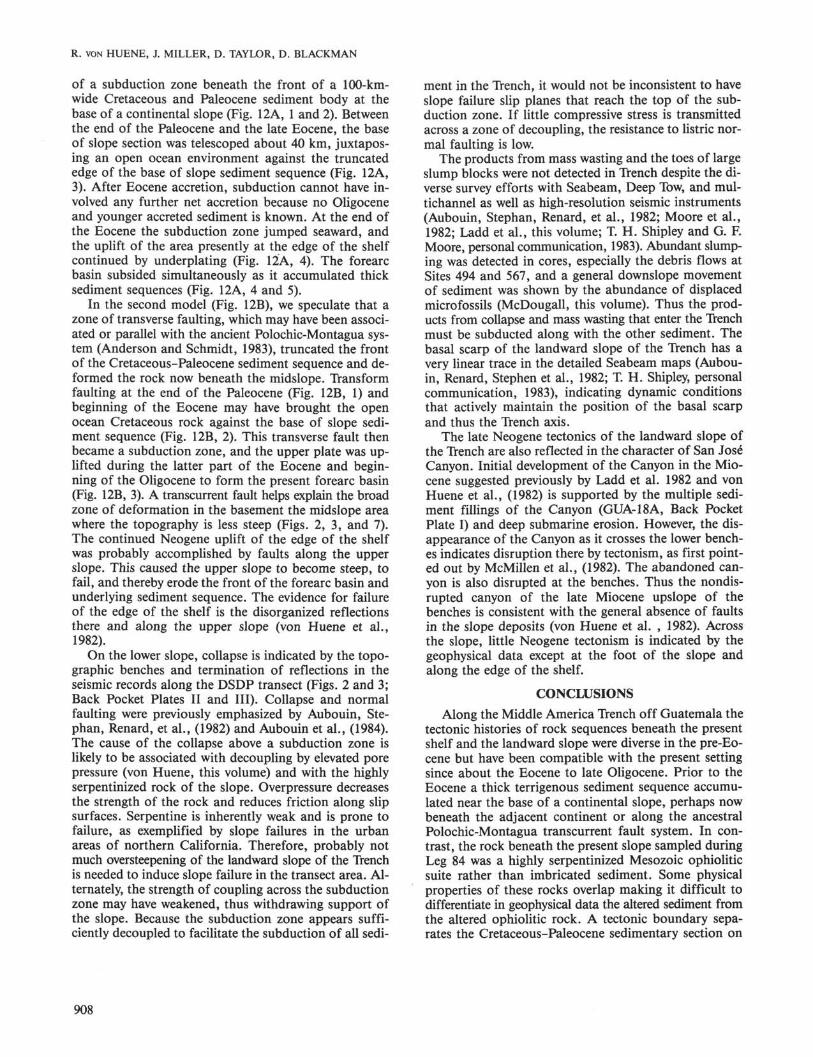
of a subduction zone beneath the front of a 100-km-wide Cretaceous and Paleocene sediment body at thebase of a continental slope (Fig. 12A, 1 and 2). Betweenthe end of the Paleocene and the late Eocene, the baseof slope section was telescoped about 40 km, juxtapos-ing an open ocean environment against the truncatededge of the base of slope sediment sequence (Fig. 12A,3). After Eocene accretion, subduction cannot have in-volved any further net accretion because no Oligoceneand younger accreted sediment is known. At the end ofthe Eocene the subduction zone jumped seaward, andthe uplift of the area presently at the edge of the shelfcontinued by underplating (Fig. 12A, 4). The forearcbasin subsided simultaneously as it accumulated thicksediment sequences (Fig. 12A, 4 and 5).
In the second model (Fig. 12B), we speculate that azone of transverse faulting, which may have been associ-ated or parallel with the ancient Polochic-Montagua sys-tem (Anderson and Schmidt, 1983), truncated the frontof the Cretaceous-Paleocene sediment sequence and de-formed the rock now beneath the midslope. Transformfaulting at the end of the Paleocene (Fig. 12B, 1) andbeginning of the Eocene may have brought the openocean Cretaceous rock against the base of slope sedi-ment sequence (Fig. 12B, 2). This transverse fault thenbecame a subduction zone, and the upper plate was up-lifted during the latter part of the Eocene and begin-ning of the Oligocene to form the present forearc basin(Fig. 12B, 3). A transcurrent fault helps explain the broadzone of deformation in the basement the midslope areawhere the topography is less steep (Figs. 2, 3, and 7).The continued Neogene uplift of the edge of the shelfwas probably accomplished by faults along the upperslope. This caused the upper slope to become steep, tofail, and thereby erode the front of the forearc basin andunderlying sediment sequence. The evidence for failureof the edge of the shelf is the disorganized reflectionsthere and along the upper slope (von Huene et al.,1982).
On the lower slope, collapse is indicated by the topo-graphic benches and termination of reflections in theseismic records along the DSDP transect (Figs. 2 and 3;Back Pocket Plates II and III). Collapse and normalfaulting were previously emphasized by Aubouin, Ste-phan, Renard, et al., (1982) and Aubouin et al., (1984).The cause of the collapse above a subduction zone islikely to be associated with decoupling by elevated porepressure (von Huene, this volume) and with the highlyserpentinized rock of the slope. Overpressure decreasesthe strength of the rock and reduces friction along slipsurfaces. Serpentine is inherently weak and is prone tofailure, as exemplified by slope failures in the urbanareas of northern California. Therefore, probably notmuch oversteepening of the landward slope of the Trenchis needed to induce slope failure in the transect area. Al-ternately, the strength of coupling across the subductionzone may have weakened, thus withdrawing support ofthe slope. Because the subduction zone appears suffi-ciently decoupled to facilitate the subduction of all sedi-
ment in the Trench, it would not be inconsistent to haveslope failure slip planes that reach the top of the sub-duction zone. If little compressive stress is transmittedacross a zone of decoupling, the resistance to listric nor-mal faulting is low.
The products from mass wasting and the toes of largeslump blocks were not detected in Trench despite the di-verse survey efforts with Seabeam, Deep Tow, and mul-tichannel as well as high-resolution seismic instruments(Aubouin, Stephan, Renard, et al., 1982; Moore et al.,1982; Ladd et al., this volume; T. H. Shipley and G. F.Moore, personal communication, 1983). Abundant slump-ing was detected in cores, especially the debris flows atSites 494 and 567, and a general downslope movementof sediment was shown by the abundance of displacedmicrofossils (McDougall, this volume). Thus the prod-ucts from collapse and mass wasting that enter the Trenchmust be subducted along with the other sediment. Thebasal scarp of the landward slope of the Trench has avery linear trace in the detailed Seabeam maps (Aubou-in, Renard, Stephen et al., 1982; T. H. Shipley, personalcommunication, 1983), indicating dynamic conditionsthat actively maintain the position of the basal scarpand thus the Trench axis.
The late Neogene tectonics of the landward slope ofthe Trench are also reflected in the character of San JoséCanyon. Initial development of the Canyon in the Mio-cene suggested previously by Ladd et al. 1982 and vonHuene et al., (1982) is supported by the multiple sedi-ment fillings of the Canyon (GUA-18A, Back PocketPlate I) and deep submarine erosion. However, the dis-appearance of the Canyon as it crosses the lower bench-es indicates disruption there by tectonism, as first point-ed out by McMillen et al., (1982). The abandoned can-yon is also disrupted at the benches. Thus the nondis-rupted canyon of the late Miocene upslope of thebenches is consistent with the general absence of faultsin the slope deposits (von Huene et al. , 1982). Acrossthe slope, little Neogene tectonism is indicated by thegeophysical data except at the foot of the slope andalong the edge of the shelf.
CONCLUSIONS
Along the Middle America Trench off Guatemala thetectonic histories of rock sequences beneath the presentshelf and the landward slope were diverse in the pre-Eo-cene but have been compatible with the present settingsince about the Eocene to late Oligocene. Prior to theEocene a thick terrigenous sediment sequence accumu-lated near the base of a continental slope, perhaps nowbeneath the adjacent continent or along the ancestralPolochic-Montagua transcurrent fault system. In con-trast, the rock beneath the present slope sampled duringLeg 84 was a highly serpentinized Mesozoic ophioliticsuite rather than imbricated sediment. Some physicalproperties of these rocks overlap making it difficult todifferentiate in geophysical data the altered sediment fromthe altered ophiolitic rock. A tectonic boundary sepa-rates the Cretaceous-Paleocene sedimentary section on
908
GEOPHYSICAL DATA
the shelf from rocks on the slope; each section originat-ed in different environments. Displacement on this bound-ary juxtaposed these rocks just before or during the tec-tonic episode that initiated development of the presentarc-trench system. This arc-trench system began to formin the Eocene, and by late Oligocene it was structuredmuch like the present system.
The origin of the landward-dipping reflection in theupper slope used by Ladd et al. (1982) as a basis for Ne-ogene accretionary tectonic history is instead from pre-Neogene tectonism in Mesozoic rock. The reflective se-quence at the base of the slope shown by Seely et al.(1974) should be reevaluated by examining the originaldata or with another survey. The data of Seely et al.(1974) should not be ignored, because they may suggestlocal accretion, perhaps associated with the collision ofa topographic high on the subducting ocean floor, how-ever, only a single seismic line across a nearly 50-km-widearea makes more concise interpretation difficult.
This general picture of the Guatemalan margin is de-fined in greater detail for the Neogene period. The be-ginning of the Miocene record is marked by the end ofthe erosion of at least 1 km of section near the Esso-Pet-rel drill hole. The coeval conformable section in SanJosé Canyon and east of it indicates an along-strike var-iability of more than 1 km in the height of the uplift.The concentration of rapid uplift at the edge of the shelfis suggested by the lack of angular discordance towardthe center of the basin. Tectonic uplift and subsidence atthe edge of the shelf have continued throughout the Ne-ogene with periodic erosion from the combined process-es of uplift and lowered sea level (Seely, 1979). Failure ofthe lower slope, underlain by an altered ophiolitic base-ment, produced three rough benches. Such failure sug-gests weak compressive horizontal stress in the upperplate consistent with the decoupling required for totalnet subduction of the materials in the Trench. The lowstrength of the rocks on the slope is probably in part theresult of overpressure, as was measured during Leg 84(von Huene, this volume). The contrast between the some-what crescent-shaped morphology of the benches andthe straight escarpment at the base of the landwardslope of the Trench emphasizes the more passive originof the benches as recognized by Aubouin, Stephan, Re-nard, et al., (1982), and the dynamic process by whichthe Trench axis maintains its approximate position. Fromprevious examination of slope sediment structure (vonHuene et al., 1982), and from, the stable and well-devel-oped nature of San José Canyon, only the front of themargin and the edge of the shelf were subjected to rapidNeogene tectonism.
The major uncertainty in determining a more com-plete tectonic history involves the tectonic mechanismsby which the present slope and forearc elements wereoriginally assembled. We suggest two end-member mod-els, which may be tested in future studies.
ACKNOWLEDGMENTS
We thank our colleagues Jacques Bourgois and Keith Kvenvolden,whose discussions and comments on earlier manuscripts greatly helpedus to improve this chapter.
REFERENCES
Anderson, T. H., and Schmidt, V. A., 1983. The evolution of MiddleAmerica and the Gulf of Mexico—Caribbean Sea region duringMesozoic time. Geol. Soc. Am. Bull., 94:941-966.
Aubouin, J., Bourgois, J., and Azema, J., 1984. A new type of activemargin: the convergent-extensional margin, as exemplified by Mid-dle America Trench off Guatemala. Earth Planet. Sci. Lett., 67:211-218.
Aubouin, J., Stephan, J.-R, Renard, V., Roump, J. and Lonsdale, P.,1982. A SEABEAM survey of the Leg 67 area (Middle AmericaTrench off Guatemala). In Aubouin, J., von Huene, R., et al., In-it. Repts. DSDP, 67: Washington (U.S. Govt. Printing Office),733-738.
Aubouin, J., Stephan, J.-F., Roump, J., and Renard, V., 1982. TheMiddle America Trench as an example of a subduction zone. Tec-tonophysics, 86:113-132.
Aubouin, J., von Huene, R., Azema, J., Coulbourn, W. T , Cowan,D. S., Curiale, J. A., Dengo, C. A., Faas, R. W , Harrison, W.,Hesse, R., Ladd, J. W., Muzilev, N., Shiki, T., Thompson, P. R.,Westberg, J., 1982. Init. Repts. DSDP, 67: Washington (U.S. Govt.Printing Office).
Coulbourn, W. T , 1982. Stratigraphy and structures of the MiddleAmerica Trench. In Aubouin, J., von Huene, R., et al., Init. Repts.DSDP, 67: Washington (U.S. Govt. Printing Office), 691-706.
Ibrahim, A. K., Latham, G. V., and Ladd, J., 1979. Seismic refractionand reflection measurements in tne Middle America Trench off-shore Guatemala: J. Geophys. Res., 84:5643-5649.
Ladd, J. W., Ibraham, A. K., McMillen, K. J., Latham, G. V., andvon Huene, R. E., 1982. Interpretation of seismic reflection dataof the Middle America Trench offshore Guatemala. In Aubouin,J., von Huene, R., et al., Init. Repts. DSDP, 67: Washington (U.S.Govt. Printing Office), 675-690.
McMillen, K. J., Enkeboll, R. H., Moore, J. C , Shipley, T. H., andLadd, J. W., 1982. Sedimentation in different tectonic environ-ments of the Middle America Trench, southern Mexico and Guate-mala. In Leggett. J. K., (Eds)., Trench-Forearc Geology, Geol.Soc. London Spec. Publ. 10 (Blackwell) pp. 95-107.
Moore, G. F., Lonsdale, P., and von Huene, R., 1982. Nearbottomobservations of the Middle America Trench off Guatemala. InAubouin, J., von Huene, R., et al., Init. Repts. DSDP, 67: Wash-ington (U.S. Govt. Printing Office), 707-718.
Seely, D., 1979. The evolution of structural highs bordering majorfore-arc basins. In Watkins, J. S., Montadert, L., Dickerson, P.W , (Eds.), Geologic and Geophysical Investigations of Continen-tal Margins: Am. Assoc. Pet. Geol. Mem. 29: 245-260.
Seely, D. R., Vail, P. R., and Walton, G. G., 1974. Trench slope model.In Burke, C. A., and Drake, C. L., (Eds.), The Geology of Conti-nental Margins: New York (Springer-Verlag), pp. 249-260.
Shor, G. G., Jr. and Fisher, R. L., 1961. Middle America Trench: Seis-mic reflection studies. Geol. Soc. Am. Bull., 72:721-730.
Thompson, P. R., 1982. Foraminifers of the Middle America Trench,In Aubouin, J., von Huene, R., et al., Initial Reports of the DeepSea Drilling Project, v. LXVII, Washington (U.S. Govt. PrintingOffice).
von Huene, R., Aubouin, J., 1982. Summary—Leg 67, Middle Ameri-ca Trench transect off Guatemala. In Aubouin, J., von Huene, R.,et al., Init. Repts. DSDP, 67: Washington (U.S. Govt. Printing Of-fice), 775-796.
von Huene, R., Ladd, J., Norton, I., 1982. Geophysical observationsof slope deposits, Middle America Trench off Guatemala, In Au-bouin, J., von Huene, R., et al., Init. Repts. DSDP, 67: Washing-ton (U.S. Govt. Printing Office), 719-732.
909