Embed Size (px)
Citation preview

4.05 Uncle Sam's Toolbox—
HonorsSelected government program to
analyze: Social security
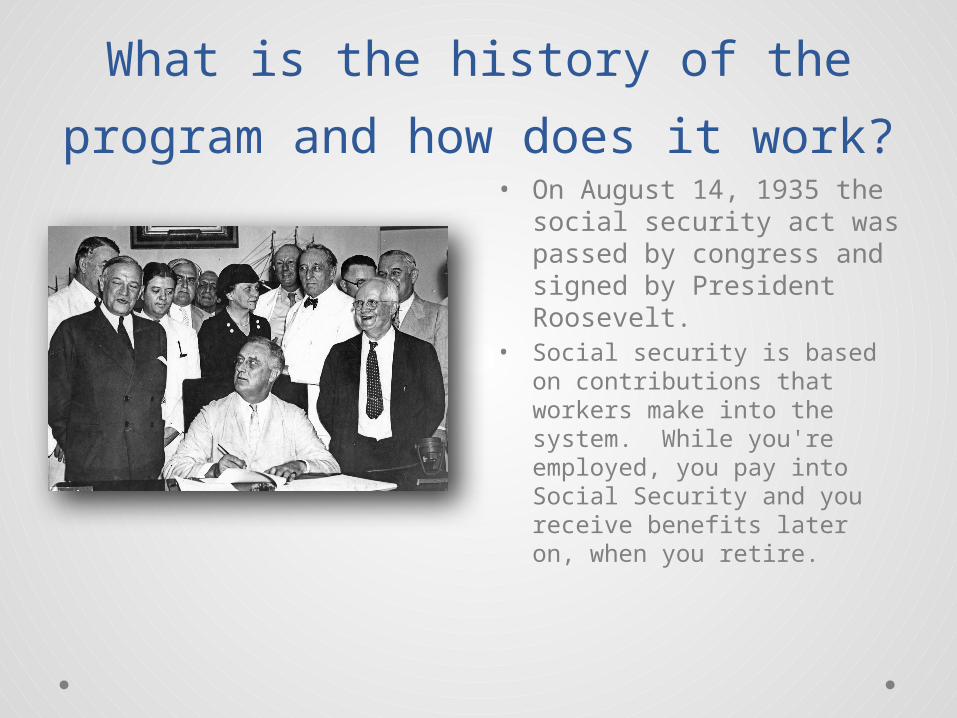
What is the history of the program
and how does it work?• On August 14, 1935 the
social security act was passed by congress and signed by President Roosevelt.
• Social security is based on contributions that workers make into the system. While you're employed, you pay into Social Security and you receive benefits later on, when you retire.
Who benefits from this program
and how?• Types of beneficiaries include (mostly) retired workers, wives,
husbands, and children of retired workers, and also disabled workers.
• For example, a retired worker can benefit from social security if he or she has worked in covered employment long enough to be insured and if he or she is at least 62 years of age.
• A spouse of a retired worker can benefit from social security if either one of the spouses is/has:
• A child under age 16 or a disabled child in his or her care• At least 62 years old
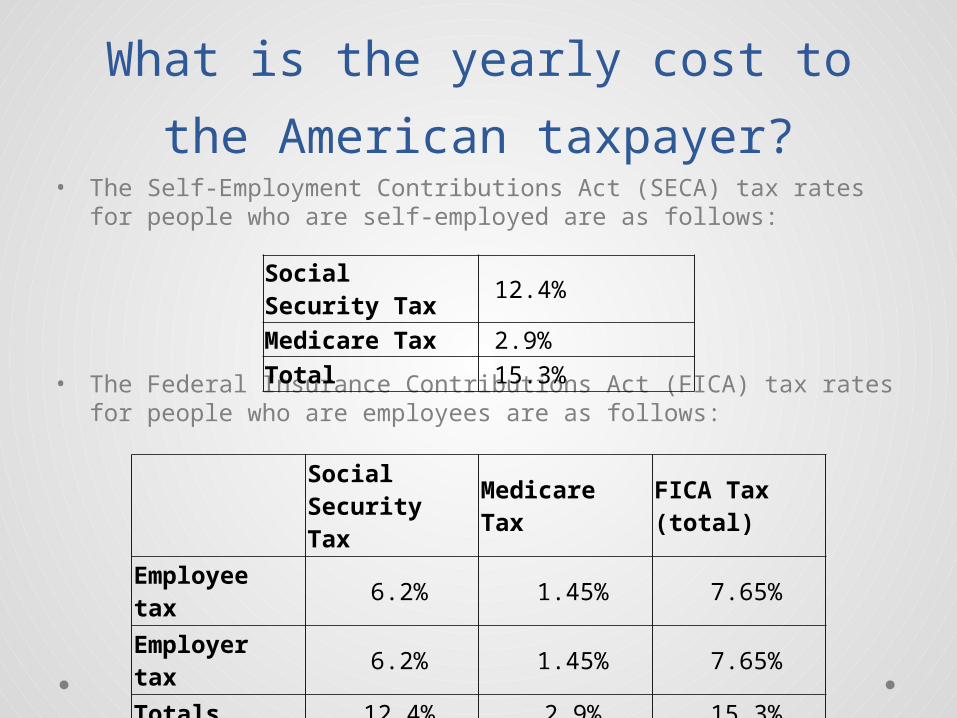
What is the yearly cost to the
American taxpayer?• The Self-Employment Contributions Act (SECA) tax rates for people
who are self-employed are as follows:
• The Federal Insurance Contributions Act (FICA) tax rates for people who are employees are as follows:
Social Security Tax
12.4%
Medicare Tax 2.9%Total 15.3%
Social Security Tax
Medicare Tax
FICA Tax (total)
Employee tax
6.2% 1.45% 7.65%
Employer tax
6.2% 1.45% 7.65%
Totals 12.4% 2.9% 15.3%
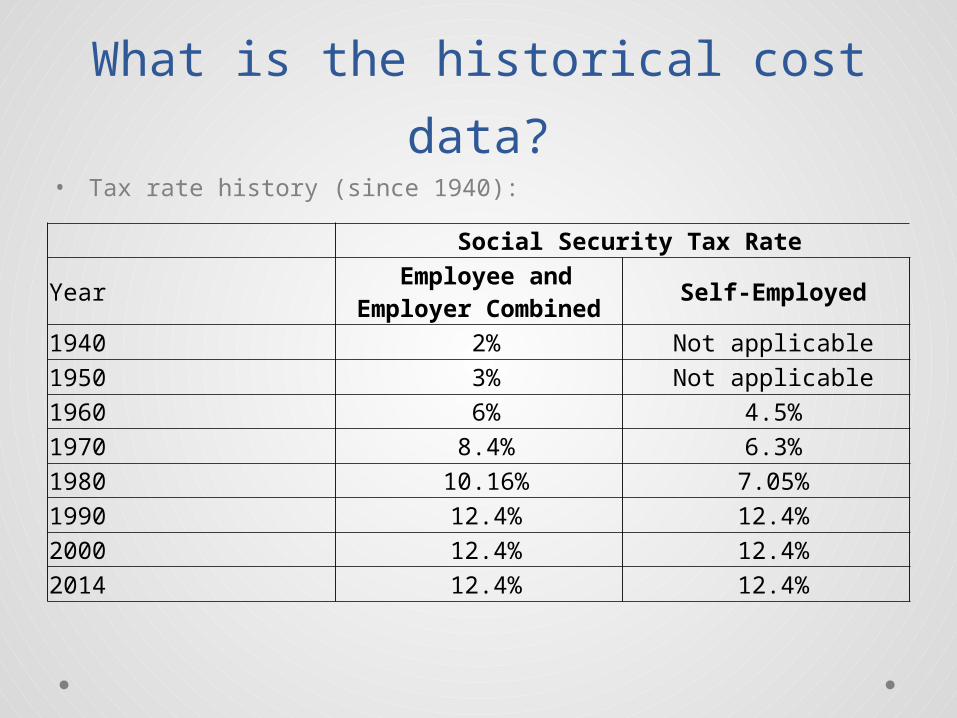
What is the historical cost data?• Tax rate history (since 1940):
Social Security Tax Rate
Year Employee and Employer Combined Self-Employed
1940 2% Not applicable1950 3% Not applicable1960 6% 4.5%1970 8.4% 6.3%1980 10.16% 7.05%1990 12.4% 12.4%2000 12.4% 12.4%2014 12.4% 12.4%
What percent of the total federal budget is
spent on this program relative to other
programs?• The same report found that
the SSA overpaid old-age, survivors, and disability insurance benefits by $934 million in fiscal year 2010.
• In 2010, 117,000 individuals received $850 million in cash benefits by double-dipping into Social Security’s disability insurance program and the federal unemployment insurance program.
• Social Security, Medicare, and Medicaid are 82 percent of mandatory program spending today and have no budget limits.
• The Social Security Administration’s (SSA) fiscal year 2011 Performance and Accountability Report found $2.11 billion in overpaid Social Security benefits.
What is the impact of this program on price
stability, full employment, and economic
growth?• Since social security benefits
the non-working or retired, it would have a negative impact on economic growth and employment. This is also because it transfers resources and income from the working to the non-working.
• Social security does not have any affect on price stability.
What is the potential impact
beyond the direct payment
recipient?• It has a direct impact because
the payment recipient receives the money.
• It also has an indirect impact because the payment recipient would spend the money and this would affect stores and businesses around the recipient.
What are the professional
opinions in support of and against
the program?• Understandably, most people
who are already retired and have social security income are in favor of the program.
• However, others think it is not enough and many believe that, in the future, they won’t even get their money back.
Works Cited“How Does Social Security Work?" CNN Money. Cable News Network, n.d. Web. 25 Nov. 2014.
"Who Gets Social Security?" National Academy of Social Insurance. N.p., n.d. Web. 25 Nov. 2014.
"Types of Benefits." Social Security. Social Security Administration, n.d. Web. 25 Nov. 2014.
Agresti, James D., and Stephen F. Cardone. "Social Security Facts." Just Facts. N.p., 24 Nov. 2014. Web. 25
Nov. 2014.
"Federal Spending by the Numbers, 2013: Government Spending Trends in Graphics, Tables, and Key
Points." The Heritage Foundation. N.p., 20 Aug. 2013. Web. 24 Nov. 2014.