Embed Size (px)
Citation preview

POPULATION AND FOOD SUPPLIES: THE EDGE OF THE KNIFE
BY ROGER REVELLEHARVARD CENTER FOR POPULATION STUDIES
We all know that most of the people in the world are poor and that most of thesepoor people live in countries sometimes called underdeveloped or, more euphemis-tically, "developing" or "emerging." But it is hard for us in the richest of allcountries to realize just how poor, how close to the edge of bare survival, most ofour planet's human beings are, or to appreciate the gap in levels of living whichdivides the world. We tend to think of countries and peoples as forming a continu-ous economic spectrum, with the different stages of economic development beingmore or less equally present. That this is in fact not so is demonstrated dra-matically by Table 1, in which countries are grouped according to their per capitaGross National Product, a quantity closely related to (though about a third higherthan) the average income of individuals.
Fifty-six countries, with a total population of more than 2 billion people, have aper capita national product equivalent in monetary terms to less than $300 peryear. Another 28 countries, with nearly a billion people, have a per capita productof more than $600 and most of these are above $1200. But in the range between $300and $600 there are only 15 countries with a total population of 147 million, lessthan 5 per cent of the human beings on earth. The two peaks in the bimodal distri-bution curve lie in the ranges of from $75 to $149 and from $1200 to $2399. Morethan half of all human beings eke out their existence on an income of less than 400a day; more than 20 per cent have incomes averaging ten times as high.We may define an underdeveloped country economically as having a per capita
Gross National Product of less than about $400, while a developed country usuallyhas more than $480. But Table 2 shows that underdeveloped countries can bedistinguished equally well by their birth rates which are, in almost all cases, morethan 34 per 1000 of population per year. Birth rates in developed countries arealways less than 30, ranging downward to 13.Because of high birth rates, the numbers of children are also high in the under-
developed countries. The proportions of their populations less than 15 years oldrange from 38 to 48 per cent, whereas in the developed countries this proportion israrely more than 34 per cent and may be as small as 21 per cent.Although over-all death rates are low in all developed countries, they are also
low in some underdeveloped ones and moderately low in many others. Hence,TABLE 1
DISTRIBUTION OF GROSS NATIONAL PRODUCT PER CAPITA, 1963GNP per capita No. of No. of people Total
in dollars countries in millions population, %40-74 11 78 2.575-149 20 1695 54.0150-299 25 275 8.8300-599 15 147 4.7600-1199 12 259 8.21200-2399 15 491 15.6>2400 1 195 6.2
99 3140 100.0Computed from Table 3.
328

VOL. 56, 1966 POPULATION AND FOOD SUPPLIES: ROGER REVELLE 329
TABLE 2RANGE OF DEMOGRAPHIC AND RELATED CHARACTERISTICS IN DEVELOPED AND UNDERDEVELOPED
COUNTRIES AROUND 196330 Developed 65 Underdeveloped 7 Transitional*Countries Countries Countries
Low High Low High Low HighFertility Births/1000 of population 13 30 34(1) 62 29 (48)
per annumMortality Deaths/1000 of population 7 12 6 40 5 12
per annumRates of natural Per cent per annum 0.3 1.9(2) 1.5(3) 3.8 2.2 3.5
increaseInfant mortality Infant deaths/1000 live 14 50(4) 50(5) 250 27 111
births per annumProportion of Per cent of population less 21 34(6) 36(7) 48 40 45
children than 15 yr oldUrbanization Per cent of population 43(8) 82 5 44(9) 30 73
classified as "urban"Per cent of population in 25(10) 67 1 24(11) 25 48
towns greater than 20,000Dependence on Per cent of farm workers in 5 41(12) 42(13) 93 7 46
agriculture economically active popu-lation
Educational Per cent illiterate 2 20 20(14) 96 16 (50)level
Economic level GNP per person in dollars 480 3,100 40 400 370 730Principal causes Per cent of all deaths
of death(15)Major cardiovascular diseases 29.8 50.3 3.4 16.0Neoplasms 15.8 22.8 1.3 9.5Influenza, pneumonia, bronchitis 4.1 13.0 11.8(16) 24.3Birth injuries, infections, congenital malfor-
ma., premat., other diseases of early infancy 2.2 5.0 6.7 13.9Gastritis, enteritis, and colitis 0.2 2.3 6.1(17) 38.3Anemias 0.2 0.3 0.2 8.7Infective and parasitic diseases 0.3 1.0 2.9 20.4Tuberculosis 0.4 3.5 0.9 6.3Accidents 3.2 5.9 1.5 6.5
Source.-Table 3; and in Demographic Yearbook, 1964 (New York: United Nations, 1965), Table 25.(1) Exceptions: Yugoslavia (20.8), Portugal (23.7), Cuba (30-34). (2) Exception: Puerto Rico (2.3). (3) Excep-
tions: Yugoslavia (1.1), Portugal (1.4). (4) Exception: Argentina (61). (6) Exceptions: China (Taiwan) (30),Cuba (43). (6) Exception: Puerto Rico (39). a7) Exceptions: Portugal (29), Yugoslavia (31). (8) Exceptions:Rumania (31), Bulgaria (34), Hungary (40). (9) Exceptions: Mexico (50), Peru (47). (15) Exceptions: Rumania(20), Bulgaria (22), Finland (24). (11) Exceptions: Jordan (36), Mexico (29), Brazil (28). (12) Exceptions: Ru-mania (70), Bulgaria (64), Greece (54), Poland (48). (13) Exceptions: Iraq (34), Jordan (35). (14) Exception:Costa Rica (16). (1) Causes of death based on data for 10 developed and 11 underdeveloped countries. (16) Excep-tion: Nicaragua (4.2). (17) Exception: Burma (2.1).
* Transitional countries are: Chile, Hong Kong, Jamaica, Panama, South Africa, Trinidad and Tobago, andVenezuela.
developed and underdeveloped countries cannot be distinguished by their over-alldeath rates. In almost all underdeveloped countries, however, infant mortalitiesare higher than in developing ones; that is, there is a higher proportion of deaths ofchildren under 1 year of age. With very few exceptions, underdeveloped countriescan be defined as those in which for every thousand live births more than 50 chil-dren die before the age of 1; in developed countries infant mortalities are almostalways less than 50 per thousand.
In the developed countries, most deaths of young children occur during thefirst 28 days of life. But in many underdeveloped ones, more children die betweenthe ages of 6 months and 2 years than during the neonatal period.
In the developed countries, most human beings live to middle age, and cardio-vascular diseases and neoplasms are overwhelmingly the most important causes ofdeath. In the underdeveloped countries, the principal killers are the diseases of

330 N. A. S. SYMPOSIUM: PROSPECTS OF WORLD FOOD SUPPLY PROC. N. A. S.
childhood that result from a combination of infection and malnutrition. The per-centage of deaths from measles is 50 times higher in Egypt than in the UnitedStates.
Developed countries are usually from 40 to 80 per cent urban, while underde-veloped countries are from 56 to 95 per cent rural. Farming is the principal occu-pation in the underdeveloped countries; it is much less important in the developedones. Usually, in the former, from 40 to 95 per cent of the labor force are farmworkers; usually, in the latter, 5 to 41 per cent. Four developed countries of Easternand Southern Europe-Bulgaria, Greece, Poland, and Rumania are exceptionsto this rule, as are two underdeveloped countries, Jordan and Iraq, in the arid landsof Southwest Asia.A high proportion of adults, from 20 to 90 per cent, in most underdeveloped coun-
tries can neither read nor write. In the developed countries the proportion of il-literates is small, less than about 20 per cent.In Table 3, some demographic and other characteristics are given for all countries
of more than 1 million population for which there are adequate statistical data.Underdeveloped and developed countries are listed separately, and for each categorythe countries are grouped in a series of geographic regions as defined by the Popula-tion Branch of the United Nations. In turn, some of the characteristics of theseregions are summarized in Table 4.Of the 65 underdeveloped countries considered, three are in Southern Europe and
the rest in Asia, Africa, and Latin America. Israel, Japan, and the USSR are theonly developed countries in Asia; Argentina, Uruguay, and Puerto Rico the onlyones in Latin America and the Caribbean. There are none in Africa. The re-maining 24 developed countries are in Europe, North America, and Oceania. Sevencountries are classed as transitional, in the sense that they have some of the charac-teristics of developed countries, while in other ways they are like the underdevelopedones. These countries are South Africa, Hong Kong, Panama, Venezuela, Ja-maica, Trinidad and Tobago, and Chile.As Table 4 indicates, the underdeveloped countries occupy a somewhat smaller
total land area than the developed countries, but they contain more than twice asmany people. Hence their average population density is over twice that of the de-veloped countries. Even so, population densities in most underdeveloped coun-tries are low. On the average throughout Latin America and Africa, there are5 to 10 hectares per person. Much of the land in these sparsely inhabited poorcountries is desert, barren savanna, or tropical rain forest, and thus uninhabitable,with present technology, by more than a few people.
In Southeast Asia, Middle South Asia, Mainland China, other East Asian coun-tries, and Southern Europe, human populations press harder upon the land. Herethe average number of hectares per person ranges from slightly more than one toless than one third. These are the areas that contain more than half the world'speople and most of its poverty and misery; yet even here the population densitiesare not as high, on the average, as those of Japan and Western Europe.Rapid Population Growth in the Underdeveloped Countries.-The breadth and
depth of the gap between the rich and the poor is a relatively new fact of human life.In the past, the differences between countries were much smaller than today. In1935, just 30 years ago, the per capita national product of the United States (at

VOL. 56, 1966 POPULATION AND FOOD SUPPLIES: ROGER REVELLE 331
constant prices) was about $1300 compared to nearly $3100 in 1963. During thissame period, per capita production in the poorer counties, even though it has showna significant percentage increase, has changed very little in absolute terms.In part, the growing gap is due to the technological revolution which has enabled
rapid and self-generating economic growth to occur in the developed countries.This revolution so far has had only one critically important effect in the poorcountries-a marked reduction in death rates.The reduction in mortality has created something unprecedented in the history
of mankind-very high rates of population growth over areas of ancient settlement.An inordinately rapid increase in human numbers is, perhaps, the most significantcharacteristic of most underdeveloped countries. Such rates of growth serve notonly to distinguish the underdeveloped countries from the developed ones, but theyare commonly believed to be one of the basic causes of the growing economic gapbetween the two parts of the world.
In Table 4, the range of rates of population increase is shown for each of the geo-graphic regions defined by the United Nations. Although there is a little overlap,it is evident that the populations of most underdeveloped countries are growingmuch more rapidly than those of most developed ones. The difference becomesclearer when we consider the average values for some of the major regions of theunderdeveloped and the developed world as given in Table 5. (Mainland China isomitted from this table because of the high degree of uncertainty of its demographicstatistics. The only census of modem times was attempted in 1953. No credibleestimates exist of the degree of under- or overcounting for different age groups, andthe data are inadequate to allow more than a very rough estimate of the rate ofpopulation increase.) Five of the seven most populous regions of the underde-veloped world outside of Mainland China are listed in this table; they show averageannual rates of increase of 2.6 to 3.8 per cent, two to three times higher than thosein even the most rapidly growing and sparsely inhabited developed regions, andthree to nearly five times higher than the European average. The average doublingtimes in the underdeveloped regions are 18 to 27 years; they are 55 to 88 years in thedeveloped ones. Whereas the underdeveloped and the developed regions listed inTable 5 now contain about the same numbers of people, by the year 2000, if presentrates of growth continue, there will be more than twice as many people in theunderdeveloped regions.Can the Underdeveloped World Obtain Sufficient Food?-The question naturally
arises whether the poor nations will be able to obtain sufficient food to feed theirpeoples in future years, either from their own production or from imports. Theanswer to this question is by no means certain, but it should probably be a qualified"yes."In the first place, rates of population growth in the underdeveloped world may
well begin to decline during the next few decades with the introduction of vigorousbirth control programs; increasing urbanization, industrialization, and education;and, above all, if the decline in over-all mortality rates continues and is accom-panied by a marked decrease in infant and child mortalities. The PopulationBranch of the United Nations has estimated that the average rate of increase for all"developing" countries is likely to be less than 2 per cent a year during the decade1990-2000. If such a decline does occur, the presently underdeveloped countries

332 N. A. S. SYMPOSIUM: PROSPECTS OF WORLD FOOD SUPPLY PROC. N. A. S.
TABLE 3D)EMO(.RAPHIC AND OTHER CHARAkcTERISTICS OF 102 COUNTRIES
(1I) (2) (3) (4) (5) (6) (7)Population Per Birth Deathmid-1965 capita rate/1000 rate/1000 Rate of(millions 1963 of of natural
of GNP in popula- popula- increaseRegion Country persons) dollars tion tion (%/yr)
I. Underdeveloped Countries1. Western Africa D)ahomey 2.4 70 54 26 2.8
Ghana 7.9 226 51 - -Guinea 3.5 60 62 40 2.2Ivory Coast 3.8 196 56 33 2.3Mali 4.6 65 62 29 3.3Niger 3.4 75 52 27 2.5Nigeria 57.2 93 53-57 17 3.6-4.0Senegal 3.5 200 43 17 2.6Togo 1.6 75 55 29 2.6Upper Volta 4.8 45 49 30 1.9
2. Eastern Africa Burundi 2.9 40 47 17 3.0Madagascar 6.4 - 42 (16) (2.6)Mozambique 7.0 47Rhodesia 4.3 219 48 14 3.4Rwanda 3.1 40 52 14 3.8Tanzania 10.6 70 47 24 2.3Uganda 7.6 74 42 20 2.2Zambia 3.7 153 51 19 3.2
4. Northern Africa Algeria 12.6 185 45Libya 1.6 359 37-40Morocco 13.3 173 46 19 2.7Sudan 13.5 100 52 18 3.4Tunisia 4.7 185 45 (21) 2.4U. A. R. 29.6 139 42 (15) 2.7
5. Southwest Asia Iran 23.4 216 45-48 (20) 2.5-2.8Iraq 7.8 228 48 - -Jordan 2.0 199 46 (8)Syria 5.6 148 (44)Turkey 31.6 233 43 11 3.2
6. "Other" East China (Taiwan) 12.4 169 34.5 5.7 2.9Asia South Korea 28.4 114 41 12 2.9
7. Middle America Costa Rica 1.4 385 47.1 8.9 3.8El Salvador 2.9 275 46.8 10.4Guatemala 4.4 284 47.7 17.2Honduras 2.2 216 45-50 15-20 2.5-3.5Mexico 40.9 402 45.2 9.8Nicaragua 1.6 282 45-52 12-17 2.8-4.0
8. Tropical South Bolivia 3.7 154 41-45 20-25 1.6-2.5America Brazil 81.3 196 43-47 11-16 2.7-3.6
Colombia 15.8 292 43-46 14-17 2.6-3.2Ecuador 5.1 199 45-50 15-20 2.5-3.5Paraguay 2.0 193 45-50 12-16 2.9-3.8Peru 11.7 262 42-48 13-18 2.4-3.5
9. Southeast Asia Burma 24.7 72 50 35 1.5Cambodia 6.4 127 41 20 2.1Indonesia 104.6 80 43 21 2.2Malaysia 9.4 <295 41 9 3.2Philippines 32.3 142 50(Thailand 30.6 106 42 20 2.2South Vietnam 16.2 114 (35) (18) 1.7
10. Middle South Ceylon 11.2 142 35 (10) 2.5Asia India 482.5 86 42 (17) 2.5
Nepal 10.1 59 45 30 1.5Pakistan 115.0 81 43-46 16-17 2.6-3.0
11. Middle Africa Cameroon 5.2 92 42 (25) (1.7)Central African Rep. 1.4 90 48 30 1.8Chad 3.4 55 48 28 2.0Congo, Leopoldville 15.6 80 43 20 2.3
12. Caribbean Cuba 7.6 305 30-34 9-13 1.7-2.5Dominican Republic 3.6 269 48-54 16-20 2.8-3.8Haiti 4.7 80 44 22 2.2
VOL. 56, 1966 POPULATION AND FOOD SUPPLIES: ROGER REVELLE 333
TABLE 3 (Continued)(8) (9) (10) (11) (12) (13) (14) (15) (16) (17)
Popula- Population Labor Ten-yr Change inInfant tion less Popula- (towns force in "Cultivated" Total FAO, Index of
mortality/ than 15 tion greater than agri- area area Food Production illit-1000 live yr old (urban) 2i),000) culture (millions (millions (1953-54 to 1963-64) eratebirths (%) (%) (%) (%) of ha) of ha) Total Per capita (%)
I. Underdeveloped Countries110 45.4 - 0.6 11.6 -
44.6 23.1 11.6 58 5.3 23.8 -
220 - - - 24.6 - -
42.6 - 32.2 - -250 47.2 - - 120.4200 45.5 3.2 126.7 -
- - -- - 15.8 92.4 - -93 42.5 22.7 21.5 - 1.1 19.7 - 94.4127 47.7 5.1 0.6 5.7 -
174 27.4 -
(120) 1.1 2.8 - -39.1 - - 2.8 59.6 -
75" 2.0 78.3 - - -(120) 46.6 18.1 1.8 38.9 -(140) - 1.0 2.6 -
190 - 3.3 9.5 94.0 - -160 - 4.8 1.2 3.3 24.0 -
(260) 44.8 19.6 1.9 74.6 ---- - 75a 7.1 238.2 2 -12 -
2.5 85.5 -
(150) 44.3 29.3 24.2 57 7.9 44.4 16 -28 86.2(95) 43.1 87 7.1 250.6 - 95.675 46.6 - 20.6 68 4.9 12.5 15 -5 86.6
(150) 42.9 38.2 57 2.5 100.0 53 23 73.742.2 31.4 24.4 55 16.9 164.8 37 -8 87.244.8 39.2 34 8.0 44.9 -8 -23 85.445.4 43.8 36.2 35 1.1 9.7 67.646.3 38.7 - 53 8.9 18.5 26 -12 64.6
(165) 41.2 26.3 21.8 75 26.1 78.1 32 -3 61.9(30) 44.2 - 51 1.0 3.6 40 1 46.158 42.9 28.0 - 62 2.1 9.8 37 7 29.478 47.7 34.2 49 0.3 5.1 15.766 44.8 39.0 60 0.5 2.1 - 51.093 - 68a 1.5 10.9 34 0(50) 47.8 23.2 11.5 67 0.8 11.2 22 - 12 55.068 44.2 50.7 29.7 54 10.8 197.3 80 36 34.654 48.4 40.8 59 1.8 14.8 - 50.4- - - - 63a 0.7 109.9 --
(170) 28.2 60a 19.1 851.2 44 8(90) 54a 5.0 113.8 15 -8104 45.1 35.8 56 2.1 27.1 - 32.7(100) 45.0 52a 0.8 40.7 - 25.795 43.3 47.1 50 1.8 128.5 20 -9 39.4195-300 14. 8b 67.8 24 1(125) - - 2.9 18.1 -
125 42.1 14.9 68 17.7 149.2 14 -9 57.157 43.8 22.7 58 3.4 33.2 78 35 57.073 46.4 29.9 60 11.2 30.0 36 0 28.1- 43.1 18.2 82 10.1 51.4 46 8 32.3- -- - - 3.1 17.1 -
53 -53a 1.5 6.6 40 11 -(140) 41.0 18.0 13.2 70 162.3 326.7 20 -2 72.2- - - - 93a 3.9 14.1 - - -- 46.4 13.6 11.8 75" 28.6 94.6 19 -4 81.2(75) - 2.9 47.5 - - -
(200) 36.8 - 2.9 61.75.0 128.4 -
(105) 39.4 21.9 86 - 234.5 84.643 36.1 42a 2.0 11.5 -15 -3280-100 - 56a 0.7 4.9 -
(175) 42.5 83a 0.4 2.8 -

334 N. A. S. SYMPOSIUM: PROSPECTS OF WORLD FOOD SUPPLY PROC. N. A. S.
TABLE 3 (Continued)(1) (2) (3) (4) (5) (6) (7)
Population Per Birth Deathmid-1965 capita rate/1000 rate/1000 Rate of(millions 1963 of of natural
of GNP in popula- popula- increaseRegion Country persons) dollars tion tion (%/yr)
13. Mainland East China (Mainland) (730)e 117 (35) (15) (2.0)Asia
19. Southern Europe Albania 1.9 340 37.8 18.7 2.9Portugal 9.2 321 23.7 10.2 1.4Yugoslavia 19.5 - 20.8 9.4 1.1II. Developed and Transitional Countries
3. Southern Africa South Africa 17.9 492 465. Southwest Asia Israel 2.6 1111 25.7 (7) (1.9)6. "Other" East Asia Hong Kong 3.8 367 29.4 4.9 2.47. Middle America Panama 1.2 448 40 8 3.28. Tropical Venezuela 8.7 728 45-50 10-15 3.0-4.0
S. America12. Caribbean Jamaica 1.8 429 40.1 7.7 3.2
Trinidad and Tobago 1.0 630 34.5 6.7 2.8Puerto Rico 2.6 952 30.3 7.1 2.3
14. Temperate Argentina 22.4 614 21.7 8.1 1.4S. America Chile 8.7 483 33.7 12.0 2.2
Uruguay 2.7 478 21-25 (8) (1.3-1.7)15. Northern America Canada 19.6 2100 23.8 7.6 1.6
United States 194.6 3083 21.2 9.4 1.216. Australia and Australia 11.4 1733 20.6 9.0 1.2
New Zealand New Zealand 2.7 1747 24.1 8.8 1.517. USSR USSR 234.0 1202 19.6 6.9 1.318. Japan Japan 97.8 626 17.7 6.9 1.119. Southern Europe Greece 8.6 517 17.5 7.9 1.0
Italy 52.6 894 20.0 9.6 1.0Spain 31.6 482 22.2 8.7 1.4
20. Eastern Europe Bulgaria 8.2 594 16.1 7.9 0.8Czechoslovakia 14.2 1276 17.1 9.6 0.8Hungary 10.1 843 13.0 9.9 0.3Poland 31.6 775 18.1 7.6 1.0Rumania 19.1 638 15.2 8.0 0.7
21. Western Europe Austria 7.3 1069 18.6 12.3 0.6Belgium 9.4 1496 17.2 12.1 0.5France 48.8 1658 18.1 10.7 0.7West Germany 56.8 1635 18.2 11.0 0.7Netherlands 12.3 1205 20.7 7.7 1.3Switzerland 6.0 2002 18.8 9.2 1.0
22. Northern Europe Denmark 4.8 1675 17.6 9.9 0.7Finland 4.6 1278 17.6 9.3 0.8Ireland 2.8 797 22.5 11.4 1.1Norway 3.7 1537 17.9 10.0 0.8Sweden 7.7 2046 16.0 10.0 0.6United Kingdom 54.4 1564 18.7 11.3 0.7
Sources.-Columns (1) and (2): Regions are those used in Table 2 of Demographic Year Book, 1964 (New York:United Nations, 1965), except that Iran is included in Southwest Asia, Paraguay in Tropical South America, andHong Kong in "Other" East Asia. Numbers given by J. Bourgeois Pichat, in "Population Growth and Develop-ment," International Conciliation, January 1966, no. 556, p. 44, Carnegie Endowment for International Peace.Columns (3) and (4): From World Population Data Sheet, Population Reference Bureau, Washington, D.C.,
December 1965.Columns (5)-(12), (14), and (17): Except where indicated, compiled or calculated from various tables in the
1963 and 1964 volumes of Demographic Year Book.Column (13): From Table 1 in Production Year Book, 1964 (Rome: Food and Agriculture Organization of the
United Nations, 1965). Our "Cultivated" area is called by FAO "Arable land and land under permanent crops."It includes land under crops, temporary fallow, temporary meadows for mowing or pasture, market and kitchengardens, fruit trees, vines, shrubs, and rubber plantations. Within this definition, there are said to be wide varia-tions among reporting countries.
Columns (15) and (16): From Tables 9 and 11 of Production Year Book, 1964, Food and Agriculture Organizationof the United Nations. The indices give a comparison from year to year of the total monetary value of agricultural

VOL. 56, 1966 POPULATION AND FOOD SUPPLIES: ROGER REVELLE 335
TABLE 3 (Continued)(8) (9) (10) (11) (12) (13) (14) (15) (16) (17)
Popula- Population Labor Ten-Yr Change inInfant tion less Popula- (towns force in "Cultivated" Total FAO, Index of
mortality/ than 15 tion greater than agri- area area Food Production illit-1000 live yr old (urban) 20,000) culture (millions (millions (1953-54 to 1963-64) eratebirths (%) (%) (%) (%) of ha) of ha) Total Per capita (%)
(14)c lod 5075c (145)d 956.1 (_13)es85 38.9 27.5 18.4 0.5 2.9 - 28.575 29.2 22.6 16.4 42 4.1 8.9 2 -4 38.180 31.1 28.3 18.6 57 8.4 25.6 38 21 19.7
II. Developed and Transitional Countries40.2 46.4 35.3 30 12.1 122.3 30 2 (50)
28 34.0 77.9 62.2 10 0.4 2.1 124 59 15.827 40.8 73.3 - 7 0.1 - 28.645 43.1 44.0 33.1 46 0.6 7.6 36 4 26.748 44.8 47.5 32 2.5 91.2 60 15 34.2
40 29.6 25.1 36 0.2 1.1 - 18.140 25a 0.2 0.5 -
45-50 39.2 44.1 28.0 23 0.3 0.9 19.461 28.9 19 30.0 277.7 25 6 8.6111 39.6 66.5 28 5.5 74.2 30 3 16.4(50) 27.8 82.3 18 2.3 18.7 -17 -31 9.726.3 34.0 69.6 39.4 12 41.8 997.6 22 -4 (2)25.2 31.1 69.9 46.8 6 185.3 936.4 23 4 3.219.1 30.0 81.9 11 15.4 769.5 42 14 -19.1 33.1 63.6 59.6 14 0.7 26.9 30 6 -30.9 30.8 47.9 35.6 39 230.0 2240.3 (51) (34) 1.520.4 30.0 63.4 32 6.1 37.0 40 28 2.640 26.7 43.4 37.3 54 3.9 13.2 32 22 19.635.5 22.8 47.7 46.8 28 15.4 30.1 15 9 8.437.9 27.4 - 45.3 41 20.8 50.5 38 27 13.332.9 28.1 33.6 22.5 64 4.5 11.1 14.721.2 27.2 47.6 25.3 38a 5.4 12.8 (1)39.8 25.4 39.8 37.5 38 5.6 9.3 - 3.147.8 32.5 46.3 31.5 48 16.0 31.2 - - 4.748.8 26.0 31.3 19.5 70 10.5 23.8 11.429.2 20.9 50.0 38.2 23 1.7 8.4 32 2727.2 23.9 50.0 34.3 6a 0.9 3.1 27 19 -23.4 24.8 63.0 37.5 20 21.2 54.7 26 1326.9 22.0 47.6 14 8.4 24.7 27 1314.8 30.7 80.0 51.8 11 (1.2) 3.4 20 420.5 23.5 51.3 30.2 11 (0.5) 4.1 7 -1218.7 25.1 74.1 48.5 18 2.8 4.3 17 9 -16.9 30.1 55.9 24.1 36 2.7 33.7 26 1526.8 31.1 46.1 32.1 34 1.3 7.0 25 2816.7 25.8 48.7 34.8 20 0.9 32.4 5 -3 -14.2 22.0 72.8 40.8 14 3.3 45.0 -5 -10 -20.6 23.0 67.0 5a 7.4 24.4 35 27
production relative to wheat prices. Average values during the 1952-1956 period are taken as 100. The indicesthus represent a combined measure of quality and quantity of food production.
Figures in parentheses are rough estimates. Dashes indicate inadequate or no data.Countries and areas with less than 1 million population are omitted. Also, the following 21 countries and areas
with populations of more than 1 million are omitted because of inadequate data: Afghanistan, Angola, East andWest Berlin, East Germany, Ethiopia, Kenya, Laos, Lebanon, Liberia, Malawi, Mongolia, New Guinea, NorthKorea, North Viet Nam, Saudi Arabia, Sierra Leone, Singapore, Somalia, South Arabia, and Yemen. The sum ofthe populations of these countries is believed to be around 130 million, about 4% of the total population of theearth, but they occupy about 10% of the total land area outside of Antarctica. Dashes indicate inadiquate or nodate.
a From Table 6A in Production Yearbook, 1964, Food and Agriculture Organization of the United Nations.b Gross sown area. cOrleans, L. A., Dealing with Population Problems, Bulletin of the Atomic Scientists, pp. 22-26,June 1965. d From Dernberger, R. F., Economic Realities, Bulletin of the Atomic Scientists, pp. 6-10, June 1965.e Estimated from data given by Duncan, J. S., "The Developing Economies," Bulletin of the Atomic Scientists,pp. 84-87, June 1965.

336 N. A. S. SYMPOSIUM: PROSPECTS OF WORLD FOOD SUPPLY PROC. N. A. S.
TABLE 4POPULATION DENSITIES AND RATES OF INCREASE, AND CEREAL PRODUCTION
IN DIFFERENT REGIONS(1) (2) (3) (4) (5)
PopulationNumber of mid-1965 Area Population Rates of
Regions countries (millions of (millions density populationNo. and Location considereda persons) of ha) (persons/ha) increase (%/yr)
I. Underdeveloped Countries1. Western Africa 10 92.7 484.5 0.19 1.9-4.02. Eastern Africa 8 45.6 374.8 0.12 2.2-3.84. Northern Africa 6 75.3 731.2 0.10 2.4-3.45. Southwest Asia 5 70.4 316.0 0.23 2.5-3.26. "Other" East Asia 2 40.8 13.4 3.04 2.97. MiddleAmerica 6 53.4 241.4 0.22 2.5-4.08. Tropical S. America 6 119.6 1,271.2 0.09 1.6-3.89. Southeast Asia 7 224.2 366.8 0.61 1.5-3.2
10. Middle South Asia 4 618.8 442.0 1.40 1.5-3.011. Middle Africa 4 25.6 472.1 0.05 1.7-2.312. Caribbean 3 15.9 19.2 0.83 1.7-3.813. Mainland China 1 730 956.1 0.76 2.019. Southern Europe 3 30.6 37.4 0.82 1.1-2.9
65 2,142.9 5,726.1 0.37II. Transitional and Developed Countries
3. Southern Africa 1 (T)f 17.9 122.3 0.155. Southwest Asia 1 2.6 2.1 1.24 1.96. "Other" East Asia 1 (T) 3.8 0.1 38 2.47. MiddleAmerica 1 (T) 1.2 7.6 0.16 3.28. Tropical S. America 1 (T) 8.7 91.2 0.10 3.0-4.0
12. Caribbean 3 (2T) 5.4 2.5 2.16 2.3-3.214. Temperate S. America 3 (T) 33.8 370.6 0.09 1.3-2.215. Northern America 2 214.2 1,934.0 0.11 1.2-1.616. Australia and New Zealand 2 14.1 796.4 0.02 1.2-1.517. USSR 1 234.0 2,240.3 0.10 1.318. Japan 1 97.8 37.0 2.64 1.119. Southern Europe 3 92.8 93.8 0.99 1.0-1.420. Eastern Europe 5 83.2 88.2 0.94 0.3-1.021. Western Europe 6 140.6 98.4 1.43 0.5-1.522. Northern Europe 6 78.0 146.8 0.53 0.6-1.1
37 1,028.1 6,031.3 0.17World totals 102 3,171.0 11,757.4b 0.27
Source.-Columns (1)-(6): Table 3. Columns (7)-(10): Computed from data given in Table 22A, ProductionYearbook, 1964, (Rome: Food and Agricultural Organization of the United Nations, 1965). In several regions, thenumbers for which cereal production data are available are less than the totals given in column (1).
a Countries with less than 1 million population are omitted; also 21 countries having a total population of about130 million are omitted because of inadequate data. See comment under Table 3.
bTotal land area outside of Antarctica is 13,571 million hectares.
will be repeating the demographic transition experienced by the developed coun-tries during the last hundred years. This optimistic view should be tempered byremembering that the "medium" projections of the United Nations made prior tothe censuses of 1960-1961 erred seriously on the low side, and by the realizationthat demographic projection is a highly uncertain science.
In the second place, agricultural production since World War II in both de-veloped and underdeveloped countries has, in general, increased more rapidly thanpopulation. The most complete data are those for cereal crops compiled by theFood and Agriculture Organization of the United Nations. Because cereals providefrom two thirds to three fourths of the total food energy produced in the world'sagriculture, comparative data o11 cereal production are a fairly good indicator of thestate of food and agriculture. Table 4 summarizes relevant aspects of total cerealproduction in each of the 22 geographic regions defined by the United Nations over

VOL. 56, 1966 POPULATION AND FOOD SUPPLIES: ROGER REVELLE 337
TABLE 4 (Continued)
(6) (7) (8) (9) (10) (11)Density on Yield of Cereals Average annual Average annual Ratio of"cultivated" cereals in per capita increase in increase in "cultivated"
land' 1962-63 (metric tons/ cereal production cereal yields landc to(persons/lha) (metric tons/ha)d person)d 1951-1963 (%/yr) 1951-1963 (%/yr) total area
I. Underdeveloped Countries2.86 0.54 0.20 4.4 2.1 0.071.95 (1.5)e 0.22 3.2 1.8 0.062.35 1.20 0.19 2.7 2.5 0.041.15 1.06 0.33 4.0 (.8 0.20
13.2 2.20 0.17 2.6 1.2 0.233.40 1.04 0.19 5.4 2.1 0.064.05 1.34 0.17 4.5 0.6 0.023.55 1.45 0.21 3.3 0.9 0.173.15 0.97 0.17 3.1 1.8 0.440.9 0.75 0.16 2.4 1.8 0.065.1 0.165.0 - - 0.152.35 1.53 0.39 3.5 3.0 0.35
3.39 1.11 0.196 3.4 1.6 0.11II. Transitional and Developed Countries
1.5 - - 0.106.5 - - 0.19
2.0 - - 0.083.5 1.16 0.07 5 1.5 0.037.7 - 0.280.89 1.44 0.43 1.6 1.8 0.100.94 2.43 0.89 1.4 3.5 0.120.88 1.24 0.82 4.5 1.0 0.021.02 1.11 0.60 5.0 3.0 0.10
16.03 4.46 0.22 2.1 2.5 0.162.31 1.71 0.28 2.3 2.6 0.431.98 1.72 0.48 2.1 2.9 0.484.15 2.90 0.32 4.1 3.4 0.344.24 3.11 0.30 3.4 2.4 0.12
1.54 1.76 0.515 2.8 2.5 0.112.44 1.40 0.299
c For definition of "cultivated" land, see comment under Table 3.d Includes rice as paddy, plus wheat, rye, barley, oats, maize, millets, and sorghum.e Cereal production data available for only one country (Madagascar).f (T) indicates a transitional country; i.e., one that shows some characteristics of developed countries and some
of underdeveloped ones; (ST) indicates two transitional countries in a particular region.
the period 1948-1953 to 1962-1963. The average annual increases of productionin the developed and the underdeveloped countries were 3.4 per cent and 2.8 percent, respectively, considerably higher than the average rates of population growthduring this period.The picture becomes more somber if we examine the record over a longer period,
or in greater detail. Over the 25-year period from 1934-1938 to the crop season of1960-1961, total cereal production in the underdeveloped world increased by 42per cent, but per capita cereal production actually declined between 2 and 3 per cent(see Table 6). Evidently much of the increase during the 1950's represented re-covery from wartime disruptions. In contrast, per capita cereal production in thedeveloped countries increased by 26 per cent over the quarter century, and total pro-duction by 51 per cent.
Relative to cereal production and population in 1934-1938, the deficit in 1960-

338 N. A. S. SYMPOSIUM: PROSPECTS OF WORLD FOOD SUPPLY PROC. N. A. S.
TABLE 5PRESENT AND POSSIBLE FUTURE POPULATIONS IN CERTAIN UNDERDEVELOPED AND DEVELOPED
REGIONS(1) (2) (3) (4)
1965 Population Rate of Doubling 2000 Population(millions of increase time at present ratespersons) (%/yr) (years) (millions of persons)
Underdeveloped Regions1. Western Africa 93 3.3 21 2807. Middle America 53 3.8 18 1958. Tropical S. America 120 3.7 19 4209. Southeast Asia 224 3.0 23 620
10. Middle South Asia 619 2.6 27 15001109 3015
Developed Regions15. Northern America 214 1.3 55 33516. Antarctica and New Zealand 14 1.3 55 2517. USSR 234 1.3 55 37018. Japan 98 1.1 64 14519-22. Europe 395 0.8 88 520
955 1395World 3300 2.1 33 6800Source.-Developed regions and column (1) for underdeveloped regions, Table 3; columns (2) and (3) for
underdeveloped regions, Irene Taueber, "Population, Health, and Food," statement before the Committee onAgriculture, U.S. House of Representatives, February 14, 1966.
TABLE 6QUARTER CENTURY TRENDS IN POPULATION AND FOOD SUPPLY
-- Developed Regions-. -Underdeveloped Regions-1934-1938 1948-1952 1960/61 1934-1938 1948-1952 1960/6 1
Annualrateofpopulationgrowth(%) 0.8 1.3 1.1 1.2 1.6 2.1Index of total cereal productions 100 112b 151b 100 106b 142bIndex of per capita cereal productiona 100 106 126 100 86 97
Source.-Rates of population growth from Provisional Report on World Population Prospects, as assessed in 1963,United Nations Document ST/SOA/SER.R/17; indices of total and per capita grain production from Tables17 and 18 in Man, Land, and Food, by Lester Brown, U.S. Department of Agriculture, 1963.
a Taking values for 1934-1938 as 100.b Rates of increase of cereal production computed from these figures differ somewhat from those in Table 4, partly
because here Japan is included in the group of underdeveloped countries, whereas in Table 4 it is included amongdeveloped ones, and partly because of slightly different assumptions about Mainland China.
1961 for the underdeveloped countries was about 12 million metric tons. Thisnumber should be thought of only as an indicator of order of magnitude. At best,estimates of cereal production are not highly accurate, and the calculated deficitrepresents a small difference between large quantities. That the deficit in produc-tion relative to the increased numbers of people in the poor countries is probablymuch greater is demonstrated by the comparatively accurate statistics on interna-tional grain trade. During the past quarter century, the underdeveloped countrieshavechangedfrom net exporters tonet importers. Inl934-1938, all three majorareasof the underdeveloped world-Asiaoutside the USSR, Africa, and LatinAmerica-ex-ported part of their cereal crop toWestern Europe. Net exports from the three con-tinentswere 12 million tons,largelyfromLatinAmerica. The LatinAmerican exportsof 9 million tons were, in fact, about twice as large as those from either of the othertwo majorexporting regions, NorthernAmerica (United States and Canada), or East-ern Europe and the Soviet Union. (The Latin American exports were chiefly fromtemperate South America, which, in our classification, contains two developedcountries-Argentina and Uruguay-plus Chile, a transitional one.) By the early1960's, Latin America, Africa, and Asia had all become importing regions, with netimports of more than 18 million tons, and only the United States, Canada, Australia,
VOL. 56, 1966 POPULATION AND FOOD SUPPLIES: ROGER REVELLE 339
and New Zealand were net exporters of cereals. During the quarter century,Northern America had become the breadbasket of the world, going from net ex-ports of 5 million tons in 1934-1938 to nearly 40 million tons in 1960-1961.The trends of trade in crops high in oil and protein were similar to those for cere-
als. Before World War II, Asia outside the Soviet Union was the principal ex-porter of soybeans, shipping close to two million tons out of the continent. Netexports from the United States were a few thousand tons. By 1960, the Asiancountries were net importers of over 700,000 tons, and the United States was theonly net exporter, with more than 6 million tons.
In summary, the international trade figures show that the deficit in production ofcereals relative to population in the underdeveloped countries, compared to condi-tions before World War II, is probably 30, million tons, two and a half times as greatas the figure of 12 million tons computed directly from the estimates of produc-tion.The over-all deterioration may be even worse than these figures indicate. Cereal
production has been increased in many instances at the expense of animal and vege-table protein and "protective" foods, such as fruits and vegetables. Table 3shows that between 1953-1954 and 1963-1964, in 16 of the 28 underdeveloped coun-tries for which data are available, per capita values of the FAO Index of Food Pro-duction declined by 2 to 32 per cent. The values of this Index increased in only tencountries, and remained unchanged in two. The FAO Index for a given countrygives a comparison from year to year of the total monetary value of agriculturalproduction, relative to wheat prices within the country during the year. Thus, itrepresents a combined measure of the quantity and quality of food production.
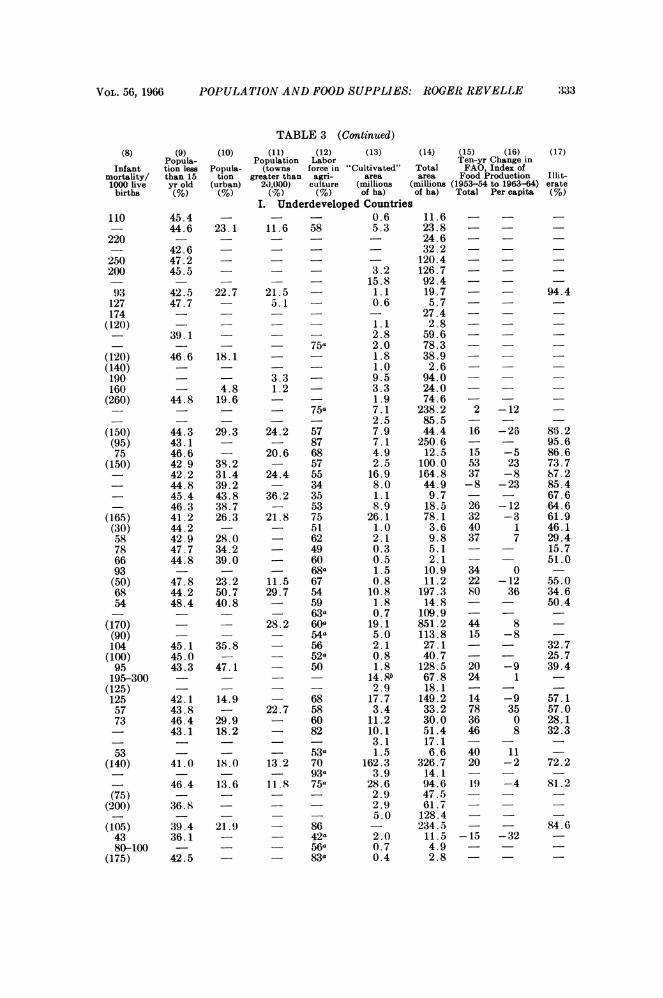
Cereal production tends to be emphasized at the, expense of other crops in theunderdeveloped countries, because it is a relatively efficient way of producing foodenergy for human consumption. As Table 7 shows, 60 per cent of all "cultivated"land (defined by FAO as land under crops, temporary fallow, temporary meadows formowing or pasture, market and kitchen gardens, fruit trees, vines, shrubs, and rub-ber plantations) in the underdeveloped countries is planted to cereal crops, and only45 per cent in the developed countries. In the latter, the total area planted tocereals is 25 per cent smaller, while the total production by weight is 25 per centlarger, than in the underdeveloped countries. The differences reflect the fact that
TABLE 7ESTIMATED CEREAL PRODUCTION AND ALLOCATION OF "CULTIVATED" LAND, 1962-1963
65 Under- 37(leveloped Developed
Unit countries countries TotalTotal land areaa Millions of hectares 5726 6031 11,757Total "cultivated" landb Millions of hectares 632 668 1300Proportion of "cultivated" landb Per cent 11 11 11Land in cereal cropsb Millions of hectares 378 301 679CProportion of "cultivated" land
in cereal crops Per cent 60 45 52Cereal productionb Millions of metric tons 420 530 950cCereal yieldsb Metric tons/hectare 1.11 1.76 1.40a From Table 3.b Estimated from Table 4.c The world total of land in cereal crops in 1962-1963 is estimated in Table 22A of the FAO Production Yearbook,
1964, as 671 million hectares; total world production is estimated as 991 million metric tons. The correspondingyield figure would be 1.47 tons/hectare.

340 N. A. S. SYMPOSIUM: PROSPECTS OF WORLD FOOD SUPPLY Piioc. N. A. S.
average cereal yields, in terms of metric tons per hectare, in the developed countriesare nearly 60 per cent larger than in the underdeveloped ones.
In terms of per capita cereal production (see Table 4), the average citizen'sshare in the underdeveloped countries is less than two tenths of a ton per year, equiv-alent to 1860 large calories per day, whereas in the developed countries each per-son's share is more than half a ton per year, equivalent to about 5000 large caloriesper day. Because of the low per capita production, almost all the cereals har-vested in the underdeveloped countries, beyond the amounts required for seed orlost to pests, must be used directly for human food. In the developed world, lessthan half the cereals produced are eaten by human beings. Most of the remainderis fed to animals and consumed only indirectly by human beings in the form ofmilk, meat, animal fat, and eggs. A small portion, about 7 per cent, is exported tothe underdeveloped countries.Examination of Table 4 shows that less than half of the increase in cereal pro-
duction in the underdeveloped world during the postwar years resulted from raisingyields, i.e., the weight of crops produced per unit of land. Most of the increasecame -from additions to the land area planted to cereal crops. This was accom-plished in three ways: (1) by increasing the proportion- of the net sown areaplanted to cereals at the expense of other crops; (2) by increasing the intensity ofcropping, that is, the proportion of land planted to two or more crops each year;and (3) by bringing new land under cultivation, usually at the level of subsistenceagriculture.In the developed world, the increase in cereal production was brought about al-
most entirely by raising yields (see Table 4). In many of these countries, the areaplanted to cereals has been reduced since World War II.
In Middle and Tropical South America and in most of Africa, the ratio of "cul-tivated" land to total land is very low, and one would expect that in the future itwould be possible to continue to expand the area planted to food crops. This willbe much more difficult, and probably impossible on any large scale, in the crowdedcountries of Asia where most of the easily culturable land has long since been placedunder the plow. If these countries are to feed themselves in the future, they mustfind ways to increase crop yields and cropping intensities. The alternative ofincreasing their food imports from the developed countries, chiefly from NorthernAmerica and Australia, can at best supply only a small part of their needs. Underthe most favorable circumstances, the United States, which is the major food ex-porter, could provide about 10 per cent of the requirements of the underdevelopedcountries during the decade of the 1980's, and less than 20 per cent in the year 2000(see Table 8).
Agriculture in the United States, India, Egypt, and Japan. The dimensions of theproblem can perhaps best be grasped if we consider in some detail the state of agri-culture in earth's second and fourth largest countries, India and the United States.Everyone is aware that one of these is, economically, the most highly developedcountry the world has ever seen, while the other is one of the most deeply impover-ished. But the advanced character of agriculture in the United States and its ex-treme backwardness in India are not so generally realized.In Table 9, the harvested area, production, and yield of all important food crops
are compared for India and the United States. Table 10 shows the total production

VOL. 56, 1966 POPULATION AND FOOD SUPPLIES: ROGER REVELLE 341
TABLE 8PERCENTAGE OF FUTURE FOOD ENERGY REQUIREMENTS OF THE UNDERDEVELOPED COUNTRIES
THAT COULD BE SUJPPIAED BY THE UNITED STATESDate: 1965 1985 2000
United StatesPopulation, millions of persons(') 194 255 300Food energy production,(2) 1012 kilocalories 756 1370 2100Food energy requirements,(3) 1012 kilocalories 630 820 980Food energy exports to Europe and Japan, 1012 kilocalories(4) 100 185 230Production available for underdeveloped countries, 1012 kilocalories(5) 26 365 890
Underdeveloped countriesPopulation, millions of persons(6) 2143 3680 5100Food energy requirements, 1012 kilocalories(7) 1955 3360 4650Requirements from United States, % 1.4 10.8 19.1(1) United States population in 1965 from Table 3; assumed rate of increase: 1.2%/year.(2) Food energy production for 1965 taken as equal to that in 1963-1964 from Table 10; yields per hectare are
assumed to increase by 2% per year from 1965 to 2000; and the gross area harvested for food crops to expand by34 million hectares, or 0.97 million hectares per year; i.e., half the "cultivated" land not harvested in 1963-1964is assumed to be put back in production by the year 2000.
(3) Assumed to be 8900 kilocalories per capita, most of which is used for animal feed.(4) Exports to Europe are assumed to increase by 50% from 1965 to 2000; exports to Japan by 2500 kilocalories
per day per capita increase in the Japanese population, which is estimated to grow by 1.1% per year from 1965 to2000.
(5) Difference between 756 and 730. Actual exports to Europe Japan, and the underdeveloped countries weregreater than the figure of 126 X 1012 kilocalories given in this table. The excess was made up from stored UnitedStates "surplus."
(6) Rate of population increase in the underdeveloped countries is assumed to decrease linearly from 3.0% in1965 to 2.0% in 2000. Population in 1965 from Table 4.
l7) Assumed to be 2500 kilocalories per person per day, including amounts needed for seed and animal feed andlost to pests or by spoilage and wastage.
of food energy and energy "yield"-calories produced per harvested hectare.Some of the relationships between agriculture and population in the two countriesare given in Table 12.
In Tables 9 and 10, food crops are divided into three categories: cereals, pulses,and "other" crops. In all three categories, the harvested area in the United Statesis smaller than in India, ranging from two thirds to less than one half, while the pro-duction in metric tons is much larger, ranging from 160 per cent to 250 per cent.The total weight of all United States food crops is more than twice the weight of theIndian production, and yields by weight are, in all categories, between three andfour times those in India. The position is slightly different in terms of calorie pro-duction. Because of India's pressing need for food energy, her cropping patternsemphasize high-energy crops such as sugar, cassava, and peanuts, while in the UnitedStates a larger proportion of land can be devoted to fruits, vegetables, and multi-purpose crops, such as cotton. In consequence, India produces more calories in"other" food crops than the United States, and the average energy yield of thesecrops, though still very low, is higher in proportion to United States yields thanfor either pulses or cereals.In India, nearly two thirds of the food crop area is in cereals. Surprisingly, this
proportion is even higher in the United States- about 73 per cent. By far thelarger part of the cereals produced in the United States is used for animal feeds,while in India as much as possible of the cereal production is consumed directly byhuman beings.The Indian need for high protein crops is reflected in the relatively high percent-
age of the food crop area devoted to pulses-about 17 per cent. This proportionis significantly greater than that devoted to pulses in the United States, eventhough about half of our total pulse production is exported.
United States yields of food crops are by no means unique. They are equalled

342 N. A. S. SYMPOSIUM: PROSPECTS OF WORLD FOOD SUPPLY PROC. N. A. S.
TABLE 9FOOD CROPS IN UNITED STATES AND INDIA
Harvested Area, Production, and Yield, 1963-1964United States India
Harvested Production Av. yield Harvested Production Av. yieldarea (103 metric (metric area (103 metric (metric
Crop (10' ha) tons) tons/ha) (103 ha) tons) tons/ha)Corn 24,503 103,933 4.24 4,546 4,527 1.00Wheat 18,295 31,080 1.70 13,657 10,829 0.79Oats 8,775 14,216 1.62 - -Barley 4,682 8,831 1.89 3,022 2,423 0.80Rice (milled) 717 2,135(1) 2.98 35,474 36,672(2) 1.03Milletsandsorghum 5,496 14,933 2.72 35,962 16,846 0.47Rye 645 742 1.15 - - -
Total cereals 63,113 175,870 2.79 92,661 71,297 0.77Dry beans 582 939 1.61 6,557(4) 1,769(4) 0.27Dry peas 129 216 1.67 1,324 1,027 0.78Dry broad beans - -Chickpeas 9,177 5,343 0.58Lentils - - - 767 350 0.46Soybeans 11,566 19,034 1.65Other pulses (21)(5) 35 (1.64)(5) (5,970)(5) 2,867 (0.48)(5)
Total pulses 12,298 20,224 1.64 23,795 11,356 0.48Potatoes (white,
sweet, yams) 624 13,050 20.9 534 3,319 6.22Sugar 724 4,965(3) 6.86 2,214 10,200(6) 4.61Cassava - - - 251 1,799 7.17Cottonseed 5,751 5,617 0.98 7,947 1,899 0.24Rapeseed - - - 3,004 909 0.30Sesame seed 0.6 2,343 410 0.17Peanuts (in shell) 570 917 1.61 6,804 5,291 0.78Bananas - 3 - 165(4) 2,258(4) 13.7Other fruits and nuts 1,725(e) 16,454 9.5Tomatoes 164 4,652 28.1
(1,330)(7) (10,000)(7) (7.5)(7Onions 38 1,169 30.8Other vegetables 1,140(0) 10,500(8) 9.2 1.
Total other crops 10,736 57,328 5.34 24,592 36,085 1.47Grand total 86,147 253,422 2.94 141,048 118,738 0.84Source.-Except where indicated in footnotes, harvested area and production from FAO, Production Year Book
18, 1964.(1) Equivalent to 3,187 metric tons rice paddy.(2) Equivalent to 54,734 metric tons rice paddy.(3) Centrifugal sugar (raw value) and noncentrifugal cane sugar; equivalent to 21,207 metric tons sugar cane and
21,163 metric tons sugar beets.(4) 1962/1963.(5) Yield assumed to be equal to average for all pulses; assumed area is tonnage divided by assumed yield.(6) Ten % of 101,606 metric tons sugar cane.(7) Value of "Other Fruits and Vegetables," including chilies, other condiments, and spices, in 1964-65 is given
by Indian Planning Commission as 6,650 million rupees. If we assume an average price of 550 rupees/ton, andsubtract tonnage of bananas, the remainder is about 10,000 tons. The estimated area is based on an annualyield of 7.5 tons per hectare.
(5) From Section 24, Statistical Abstract of the United States (U.S. Department of Commerce, 1965), pp. 650-665.
or exceeded in Japan and several European countries and also in at least one under-developed country-Egypt. The details of agricultural production for Egypt andJapan are shown in Tables 11 and 12.
Yields by weight for all three categories of food crops are somewhat higher ineither Egypt or Japan, or in both countries, than in the United States. In the caseof cereals, part of the reason is the relatively much larger Egyptian and Japanesearea planted to rice, which is a high-yielding crop. But the principal reason is theextremely short supply of culturable land in Egypt and Japan, which forces thesecountries to emphasize yields at the expense of human effort, and the abundance ofland in the United States, which enables us to economize on agricultural labor and

VOL. 56, 1966 POPULATION AND FOOD SUPPLIES: ROGER REVELLE 343
TABLE 10ENERGY CONTENT OF FOOD CROPS-UNITED STATES AND INDIA, 1963-1964
United State - India(1) (2) (3) (4) (5)
Energy content Total Yield Total Yield(106 kcal/metric production (106 production (106
Crop ton) (1012 kcal) kcal/ha) (1012 kcal) kcal/ha)Corn 3.50 363.8 14.84 15.8 3.50Wheat 3.30 102.6 5.61 35.7 2.61Oats 3.60 51.2 5.83Barley 3.50 30.9 6.62 8.5 2.80Rice (milled) 3.60 7.7 10.73 132.0 3.71Millets and sorghum 3.30 49.3 8.98 55.6 1.55Rye 3.30 2.5 3.80 -
Total cereals - 608.0 9.63 247.6 2.67Dry beans 3.40 3.2 5.47 6.0 0.92Dry peas 3.40 0.7 5.70 3.5 2.65Dry broad beans 3.40Chickpeas 3.60 - - 19.2 2.09Lentils 3.40 1.2 1.56Soybeans 4.00 76.1 6.60 - -Other pulses 3.40 0.1 5.61 9.8 1.63
Total pulses - 80.1 6.51 39.7 1.67Potatoes 0.90 11.7 18.81 3.0 5.60Sugar 3.70 18.4 25.38 37.7 17.06Cassava 3.50 - - 6.3 25.10Cottonseed 3.50 19.7 3.43 6.6 0.84Rapeseed 5.60 - 5.1 1.68Sesame seed 5.60 - 2.3 0.95Peanuts in shell 4.00 3.7 6.44 21.2 3.12Bananas 0.85 1.9 11.65Other fruits & nuts 0.50 8.3 4.25Tomatoes 0.22 1.0 6.18Onions 0.38 0.4 11.70Other vegetables 0.40 4.2 3.68
Total other crops - 67.4 6.28 88.6 3.60Grand total - 755.5 8.77 375.9 2.66Source.-Column (1): Composition of Foods, Agriculture Handbook No. 8 (Agricultural Research Service,
U.S. Department of Agriculture, 1963). Columns (2)-(5): compiled from Table 9.
to emphasize productivity per man rather than yields per acre. The labor-inten-sive character of Japanese agriculture is illustrated by the often quoted statementthat "there is no agriculture in Japan, only horticulture."
Japan's need to use every acre to maximum advantage and its generally inferiorclimatic conditions are brought out by the fact that the energy yield for other cropsis actually higher than for cereals. This results from the allocation of nearly 10per cent of the harvested land area to potatoes, a very high-yielding crop in tennsof energy production. In contrast, only about 3 per cent of the harvested land inEgypt, and less than 1 per cent in India and the United States, is planted to po-tatoes.The basic agricultural characteristics of these four countries are illustrated in
Table 13. Seventy per cent of India's labor force work on the land, and in theUnited States only 6 per cent. The proportions in Egypt and Japan are inter-mediate between these extremes. (It is sometimes said that the total proportionof the United States labor force involved in agriculture is much higher than the per-centage of farm workers, because it includes workers in fertilizer and pesticideplants, farm machinery manufacturers, and other suppliers of the factors of pro-

344 N. A. S. SYMPOSIUM: PROSPECTS OF WORLD FOOD SUPPLY PROC. N. A. S.
TABLE 1 1FOOD CROPS IN EGYPT AND JAPAN
Area, Production, and Yield, 1963-1964Egypt (U.A.R.) Japan
Production ProductionHarvested (103 metric Av. yield Harvested (103 metric Av. yield
Crop area (103 ha) tons) (tons/ha) area (103 ha) tons) (tons/ha)Corn 712 1,675 2.35 39 104 2.67Wheat 661 1,714 2.59 584 716 1.23Oats - - - 75 148 1.97Barley 51 134 2.63 566 759 1.34Rice (milled) 349(1) 1,358(1,2) 3.88 3,272 11,42003) 3.50Milletsandsorghum 1910() 659(1) 3.45 33 54 1.66Rye - - 1 2 1.82
Total cereals 1,964 5,540 2.82 4,570 13,203 2.89Dry beans 1(4) 1(4) 1.37 217 274 1.26Dry peas 9 8 0.89Dry broad beans 151 263 1.74 21(1) 230') 1.07Chickpeas 5 8 1.69Lentils 33 47 1.43Soybeans - - 233 318 1.36Other pulses (28)(5) 46 (1.68)(6) (10)(5) 13 (1.30)(5)
Total pulses 218 365 1.68 490 636 1.30Potatoes (white,
sweet, yams) 29 502 17.3 521 10,071 20.6Sugar 56(1) 516(1l6) 9.2 58 255 4.4CassavaCottonseed 684 867 1.27Rapeseed - 141 109 0.77Sesame seed 25 26 1.03 7 5 0.71Peanuts (in shell) 22 45 2.02 61 144 2.36Bananas 3(1) 56(1) 18.0 - -Other fruits (114)(7) 1,027 (9.0)(7) 350(7) 3,095 (9.0)(7)Tomatoes 72 1,056 14.7 18 437 24.3Onions (70)(8) 695 (10.0) 57(1) 1,218(1) 21.3Other vegetables NA NA NA NA
Total other crops 1,075 4,790 4.46 1,213 15,334 12.6Grand total 3,257 10,695 3.28 6,273 29,173 4.65
(1) 1962-1963.(2) Equivalent to 2.039 million tons of paddy rice.(3) Equivalent to 17.157 million tons of paddy rice.(4) 1961-1962.(5) Yield assumed to be equal to average for all pulses; assumed area is tonnage divided by assumed yield.(6) Equivalent to 5.156 million tons of sugar cane.(7) Assumed area corresponds to assumed yield of 9.0 tons per hectare.(8) Assumed area corresponds to assumed yield of 10.0 tons per hectare.
duction. A rough estimate of the total national effort devoted to agriculture canbe obtained by comparing the proportion of the Gross National Product resultingfrom agriculture with the sales value of all farm products. In 1963, the former wasabout 23 billion dollars or 4 per cent of the total GNP, while the sales value of farmproducts was 37 billion dollars or a little over 6 per cent. We may conclude that atleast two thirds of the workers involved in agriculture actually work on farms.
In all four countries the proportion of the Gross National Product arising fromagriculture is less than the ratio of farm workers to the total labor force. Althoughit is the most basic of all industries, agriculture is also among the most poorlypaid.
In India the gross harvested area is 93 per cent of the total "cultivated" area,and in Egypt and Japan this proportion is more than 100 per cent. In all thesecountries there is extensive double cropping. In marked contrast, the United

\OL. 56, 1966 POPULATION AND FOOD SUPPLIES: ROGER REVELLE 345
TABLE 12ENERGY CONTENT OF FOOD CROPS-EGYPT AND JAPAN, 1963-1964
Egypt (U.A.R.) - Japan-(1) (2) (3) (4) (5)
Energy content Total Total(106 keal/metric production Yield production Yield
Crop ton) (1012 kcal) (106 koal/ha) (1012 kcal) (106 kcal/ha)Corn 3.50 5.86 8.22 0.36 9.34Wheat 3.30 5.66 8.55 2.36 4.06Oats 3.60 0.53 7.09Barley 3.50 0.47 9.20 2.66 4.69Rice (milled) 3.60 4.89 13.97 41.11 12.60Millets and sorghum 3.30 2.18 11.38 0.18 5.48Rye 3.30 0.01 6.01
Total cereals 19.06 9.70 47.21 10.33Dry beans 3.40 - 4.66 0.93 4.28Dry peas 3.40 0.03 3.03Dry broad beans 3.40 0.89 5.92 0.08 3.64Chickpeas 3.60 0.03 6.08 -Lentils 3.40 0.16 4.86Soybeans 4.00 - 1.27 5.44Other pulses 3.40 0.16 5.71 0.05 4.42
Total pulses - 1.24 5.69 2.36 4.82Potatoes 0.90 0.45 15.57 9.06 18.54Sugar 3.70 1.91 34.04 0.94 16.28Cassava 3.50Cottonseed 3.50 3.03 4.44 - -Rapeseed 5.60 0.61 4.31Sesame seed 5.60 0.15 5.77 0.03 3.97Peanuts in shell 4.50 0.18 8.08 0.58 9.44Bananas 0.85 0.05 15.30 -Other fruits 0.50 0.51 4.50 1.54 4.50Tomatoes 0.22 0.23 3.23 0.10 5.35Onions 0.38 0.26 3.80 0.46 8.09Other vegetables 0.40 NA NA NA NA
Total other crops 6.77 6.10 13.32 10.98Grand total 27.07 8.31 62.89 10.03
States gross harvested area is only 64 per cent of the "cultivated" area. A largeshare of the latter has been taken out of production during the last three decadesin response to Government agricultural policies, and some has been abandoned asagricultural land because of its comparatively poor quality.Almost all the gross harvested area in India, Egypt, and Japan is allocated to
food crops, while less than three quarters of the harvested area in the United Statesis used in this way. Most of the remainder is used to grow alfalfa and other animalfeedstuffs and in fact, as we have already pointed out, most of the "food crop"production in the United States is also fed to animals. One reason for these differ-ences is the abundance of agricultural land relative to population in the UnitedStates. Our per capita food crop area is 50 per cent higher than India's, nearlyfour times Egypt's, and seven times that of Japan. The ratios of per capita "cul-tivated area" between the United States and the three other countries are, of course,much greater. But the most striking difference is in the productivity of agricul-tural workers. On the average, each farm worker in the United States produces 59times as much weight of food products as the average Indian farm laborer, 26 timesas much as the average Japanese peasant, and 22 times as much as the averageEgyptian fellah. There is a high degree of underemployment of farm labor in In-
346 N. A. S. SYMPOSIUM: PROSPECTS OF WORLD FOOD SUPPLY PROC. N. A. S.
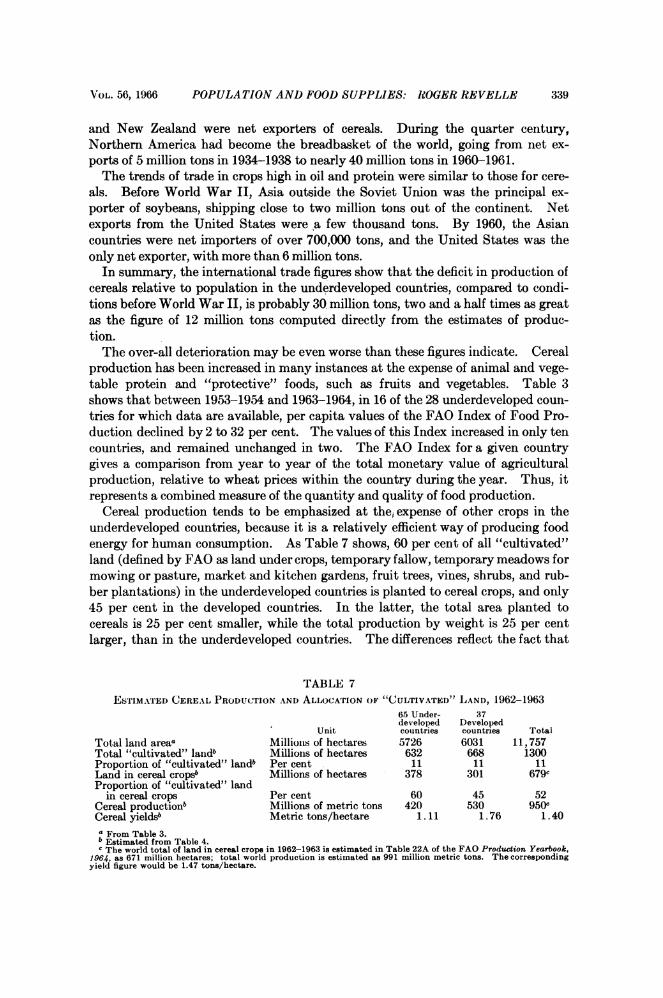
TABLE 13AGRICULTURAL CHARACTERISTICS OF INDIA, EGYPT, JAPAN, AND THE UNITED STATES,
1963-1964India Egypt Japan United States
Population (1) Millions of persons 471.6 28.0 96.9 192.1Economically active Millions of persons 188.7 7.8 44.0 77.0
population(2)Agricultural workers(2) Millions of persons 131.1 4.4 14.3 4.8Proportion of active Per cent 70 57 33 6
population in agricul-ture
Agricultural portion of Per cent 45 31 13 4gross national prod-uct(3)
Total area (4) Hectares X 106 326.7 100.0 37.0 936.4"Cultivated" area(4) Hectares X 106 162.3 2.49 6.06 185.3Gross harvested area(5) Hectares X 106 (151)(6) (3.36)(7) 6.41(l) 118.8(8)Gross area harvested for Hectares X 106 141.05 3.26 6.27 86.15
food crops(9)Per capita "cultivated" Hectares/person 0.34 0.089 0.063 0.96
areaPer capita food crop area Hectares/person 0.30 0.12 0.065 0.45Gross harvested area per Hectares/person 1.15 0.76 0.45 24.7
agricultural workerPer capita food produc- Metric tons/person 0.25 0.38 0.30 1.32
tion(10)Food production per Metric tons/person 0.90 2.43 2.04 52.8
agricultural worker(10)Per capita daily food Kilocalories/person/ 2,185 2,650 1,780 10,770
energy production("1) day(1) Mid-1964, from Table 4, Demographic Yearbook, 1964 (New York: United Nations, 1965).(2) Ibid., Table 9: For India, 1961; Egypt and Japan, 1960; United States, 1964.(3) From Table 1277, Statistical Abstract of the United States, 1965 (U.S. Department of Commerce, 1965).(4) From Table 3.(5) Total of harvested areas for each crop; double cropped land is counted twice.(6) From data given in "Development of Agriculture, India, 1960-61 to 1975-76," Planning Commission, Govern-
ment of India, provisional document for discussion, 1964.(7) Estimated from data given in Production Yearbook, 18, 1964 (Rome: Food and Agriculture Organization of
the United Nations, 1965).(8) From Tables 920 and 935, Statistical Abstract of the United States, 1966 (U.S. Department of Commerce, 1965).(9) From Tables 9 and 11.
(10) Computed from data given in Tables 9 and 11.(11) Computed from data given in Tables 10 and 12.
dia. Similarly, in Japan, many farmers work only part time in agriculture, andaugment their incomes with part-time jobs in industry or trade.
In spite of the high yields they obtain per unit of land, Japan's farmers are unableto provide enough food for the nation. The per capita food energy production isonly 1780 large calories per day. Japan, like much of western Europe, dependsheavily on imports of food from abroad, which it pays for with industrial exports.Egypt, with a per capita food production of 2650 calories per day, is in a much betterpresent position, even though it also depends to a significant extent on food im-ports, much of which are "concessional" under the United States "P.L. 840" pro-gram. However, her situation may worsen in the future. The population isgrowing by nearly 3 per cent per year, while yields are already very high and maybe extremely difficult to increase. When the Aswan High Dam is fully operating,it may be possible to increase the gross harvested area by as much as 40 per cent,but this will be sufficient to balance population growth for only about 12 years.
India's per capita food energy production is less than 2200 calories per day, evenif no allowance is made for seed, animal feed, losses to pests, or inevitable wastage.If food supplies were uniformly distributed, the average human food energy intakewould probably be around 1900 calories per day. Because of inequities in food dis-

VOL. 56, 1966 POPULATION AND FOOD SUPPLIES: ROGER REVELLE 347
tribution, however, probably a third of all Indian citizens receive less than 1600calories. The deficiency of high-quality protein-that is, protein with the balanceof amino acids needed for the proper development of children and the health ofadults-is equally severe.
In contrast to these calorie-short countries, the per capita food energy productionin the United States is nearly 11,000 calories per day. It is this excess of calorieswhich enables us to export about a sixth of our total agricultural productionand, at the same time, to obtain about a third of the calories in our diet from animalproducts. Conversely, the very low per capita food energy production in India(and in many other underdeveloped countries) means that it is impossible to diverta sufficient fraction of the harvest or the cultivated land to producing the neededanimal protein.
The Future Balance between Population and Food Supplies in India.-From 1950-1951 to 1964-1965, the net values of India's agricultural production, including ani-mal husbandry, fisheries, and forest products, increased at an average rate of nearly3 per cent a year. But even before the present disastrous year of crop failure therate of increase of production was steadily declining. From 1960-1961 to 1964-1965, the production of cereals and pulses, which provide about 77 per cent of thecalories in the average Indian's diet, increased by only 2.25 per cent per year.While the rate of growth of food production has been diminishing, the rate of
population growth has been accelerating. During the 1950's, it averaged around2 per cent a year; it is now believed to be above 2.5 per cent. Because of the stag-nation in agriculture and the increasingly rapid population growth, per capita in-comes have been rising at an ever slower rate-probably less than 2 per cent peryear from 1960-1961 to 1964-1965. This is in spite of the fact that agriculture'sshare of the total national product decreased from around 53 per cent in 1950-1951to about 45 per cent in 1964-1965.The problem of bringing about a better future balance between population and
food supplies in India must be attacked on four broad fronts: (1) a vigorous cam-paign of human fertility control to reduce the rate of population growth; (2) ex-pansion of the area of cultivated land and increase of cropping intensity to the maxi-mum extent possible. This will mean primarily the development of surface andunderground water resources for irrigation, improvements in drainage, erosioncontrol, and land reclamation; (3) increases in crop yields per unit area of culti-vated land. In Egypt, which in many ways is at a similar stage of economic de-velopment, crop yields are about four times higher than in India, and this fact arguespowerfully that a well-executed campaign to increase Indian yields might achievevery substantial results; and (4) development of all economically feasible ways ofincreasing the amount of high-quality protein in the average Indian's diet. Thesemight include: genetic manipulation of cereals; protein extraction from cottonseeds, other oil seeds, and soybeans; production of fish protein concentrate, per-haps from a greatly expanded Arabian Sea fishery; microbial protein productionusing hydrocarbons or organic waste materials as a source of energy; supplementa-tion of cereal foods with one or two chemically produced amino acids such as methio-nine or lysine; or a greatly increased efficiency of animal and pond-fish productionand better use of humanly inedible organic materials as animal feedstuffs.The physical factors needed to increase yields are well recognized: sufficient

348 N. A. S. SYMPOSIUM: PROSPECTS OF WORLD FOOD SUPPLY PROC. N. A. S.
water to meet the evapotranspiration requirements of the crops and to maintainsalinity control; chemical fertilizers; high-yielding seeds; pest and disease control;improved agricultural practices, e.g., better seed-bed preparation and soil condi-tioning made possible by improved farm tools and mechanization. All theseinputs must be used in combination. Chemical fertilizers will give little benefitand may actually be harmful unless sufficient water is available at the right time.Only limited amounts of chemical fertilizer can be used on wheat or rice unlessnonlodging high-yielding crop varieties are employed. The high yields obtainedwith chemical fertilizers applied to improved crop varieties are an open invitationto pests of all kinds, and the yield increases cannot be retained for human useunless effective pest control measures are used.
High-yielding crops with greater resistance to disease and pests must be producedby the methods of applied genetics. Genetics is equally needed for improvingstrains of livestock and poultry. Greater knowledge of plant and animal pests mustbe attained.Of perhaps even greater importance than scientific agronomy and applied genetics
are the economic, social, and political problems of agriculture. These involve farmcredit, marketing, storage, transportation, land tenure, crop diversification, invest-ment in processing agricultural products, and, above all, communication with, andmotivation of, the farmers. Development of agriculture cannot be separated fromcommunity development. We must deal with the obsolescence of the traditionalvillage and the need for greater emphasis on small cities and large towns.
In Table 14, different sets of assumptions are made about the future course ofpopulation growth in India and about the possibilities of increasing yields. In themost pessimistic case, it is assumed that the rate of population growth will remainconstant at 2.6 per cent per year for the next 35 years, and that the rate of yieldincrease attained from 1948-1953 to 1963 of 1.8 per cent a year will be continued.In the most optimistic case, we assume that birth rates will be halved and the rateof population growth will decrease linearly over the next 35 years from 2.6 per centin 1965 to 1.2 per cent in the year 2000, so that the average rate over this periodwill be 1.9 per cent. It is assumed that the rate of increase in yields will be 3.65per cent per year, sufficient to give an average cereal yield in the year 2000 equalto that of Egypt today.In all sets of assumptions, we have considered that the net cropped area will be
increased by about 10 million hectares, from 135 million hectares at present to 145million in 2000, the land under irrigation raised from 32 to 71 million hectares (interms of gross cropped area), and the intensities of cultivation (per cent of doublecropping) on irrigated and unirrigated lands increased to 65 per cent and 25 percent, respectively. All these measures together would result in a 28 per centincrease in gross harvested area, from 151 to 194 million hectares. The projectedincreases in net cropped area and in irrigated land are the maximum believed to bepossible by the Planning Commission of India.Though the attainment of present Egyptian yields does not seem an impossible
goal, the projected rate of yield increase is higher than that experienced by anycountry over the past quarter century. From 1937-1938 to 1962-1963, cerealyields in the United States increased by 2.95 per cent per year, in the United King-dom by 2.25 per cent, in Australia by 1.7 per cent, and in Japan by 0.9 per cent.

VOL. 56, 1966 POPULATION AND FOOD SUPPLIES: ROGER REVELLE 349
TABLE 14POSSIBLE PER CAPITA FOOD SUPPLIES IN INDIA IN THE YEAR 2000
Assumption I Assumption IIAverage atinual rate of popu- Per cent per year 1. 9a 2. 6c
lation growthPopulation in 2000 Millions of persons 920b 1170Increase over 1963-1964 in Per cent 28d 28d
gross harvested areaGross harvested area in 200() Millions of hectares 194 194Area harvested for cereals in Millions of hectares 119' 119e2000
Area harvested for all food 181' 1S8ccrops ill 20(0
Assumption AssumptionA B A B
Average annual rate of in- Per cent 1.8f 3.659 1. 8f 3.65gcrease in yields, 1964-2000
Average cereal yield in 2000 Metric tons per hectare 1.46 2.82 1.46 2.82Average food yield in 2000 Metric tons per hectare 1.59 3.07 1.59 3.07Cereal production in 2000 Millions of metric tons 174 336 174 336Total food production in 2000 Millions of metric tons 288 555 288 555Energy in cereal production in 1012 kilocaloriese 604 1165 604 1165
2000Energy in total food produc- 101 kilocaloriese 910 1760 910 1760
tion in 2000Per capita total food energy/ kcal/person/day 2710 5240 2130 4130day in 2000a Medium variant estimate by United Nations in Provisional Report on World Population Projects as Assessed
in 1963, United Nations Document ST/SOA/SER.R/17.b Rate of increase assumed to decrease linearly from 2.6% in 1965 to 1.2% in 2000.c Estimated annual rate of population growth in 1965.d Assuming net harvested (sown) area is increased to the maximum, all surface and underground water resources
are fully developed, and the intensities of cultivation (per cent of double cropping) on irrigated and unirrigatedlands are increased to 65% and 25%, respectively. According to the Planning Commission of India, the net sownarea can be increased by about 10 million hectares and the ultimate potential for land under irrigation is 71 millionhectares. See "Development of Agriculture, India: 1960-61 to 1975-76," Planning Commission provisional docu-ment for discussion, 1964.
e Assuming no change in present proportional cropping patterns.f Rate of annual increase in cereal yields from 1951 to 1963. From 1960 to 1964 the annual rate of increase in
yield of cereals was only about 1.5%.9 Rate of increase required to equal present Egyptian cereal yield by the year 2000. This rate is higher than that
experienced by any country for any 25-year period.
If the over-all rate of yield increase during the next 35 years in India is equal to thatexperienced for cereals by the United States during the past quarter century, totalfood energy production in 2000 would be 1300 X 1012 kilocalories, or from 3050 to3870 kilocalories per person per day, depending on the assumed population size.The most optimistic set of assumptions would result in a very satisfactory food
situation for India, with sufficient food energy production to allow a considerablediversion of crops to feeding livestock and poultry. The most pessimistic set ofassumptions would result in a somewhat smaller per capita food energy productionthan the present one.Above all, Table 14 indicates the urgency of large-scale and effective action.
If present trends are allowed to continue, the possibility of ultimate improvementwill be gravely lessened because of the enormously increased magnitude of theproblems. By the year 2000, the population will have increased to such an extent,even under the best circumstances, that the present area harvested for food cropswould provide only about 0.15 hectares per person, slightly more than that inEgypt today. The most critical situation will occur around 1980, before the de-crease in the rate of population growth has given much effect. As Table 15 shows,the difference between the maximum and minimum population growth in 1980would be only 5 per cent. If the rates of yield increase experienced during the

350 N. A. S. SYMPOSIUM: PROSPECTS OF WORLD FOOD SUPPLY PROC. N. A. S.
TABLE 15INDIAN POPULATION AT FIVE-YEAR INTERVALS FOR Two DIFFERENT AVERAGE GROWTH RATES
FROM 1965 TO 20001965 1970 1975 1980 1985 1990 1995 2000
Average growth rate (%)2.6 482.5 548 625 710 807 919 1043 -;11681.9* 482.5 546 612 676 745 810 871 920
Difference (%) 0 0.4 2.1 5.0 8.3 13.5 19.7 24.7* Assumed to decrease linearly from 2.6% in 1965 to 1.2%70 in 2000.
1950's of 1.8 per cent per year were to continue until 1980, with no increase in thegross harvested area, per capita food energy production would be only about 2000large calories.
It is clear that no feasible reduction in the rate of population growth would besufficient, during the next 15 years, to overcome present food deficits; but it maybe equally true that a reduction in the rate of population growth will be necessaryto increase food production. This is because economic growth and social develop-ment are made much more difficult by rapid population growth.We have already seen that a high birth rate results in a very high proportion of
children in the total population, approximately 45 per cent under 15 years old, andhence a high dependency burden on the producing adults in the society. Educa-tion, health, and other services put an equally great burden on the total nationalincome. A high rate of population growth also means that even a relatively highrate of economic growth gives very little improvement in per capita income andtherefore very little increase in ability to save for capital investment. The neededgrowth in agricultural and industrial production is thus severely inhibited.Both the needed increases in yields and in gross harvested area will require very
heavy capital investment, of the order of $25 billion over the next 15 to 20 years, infertilizer plants, irrigation development, production of improved seeds, pest control,mechanization, agricultural research and training, construction of roads, purchaseof trucks and tractors, effective storage facilities, and food-processing plants. Atthe same time it will be necessary to increase greatly the number of university-trained specialists in all those aspects of technology and social science that arerelated to agriculture. The foreign exchange component of the needed capitalinvestment and the training of these specialists present a first-order challenge to theUnited States and other friendly countries in the developed world.The costs of producing wheat, soybeans, and several other important crops in
the United States are low relative to costs in many other countries, including manyunderdeveloped ones. Because of this comparative advantage in favor of theUnited States, it is sometimes said that the underdeveloped countries shouldconcentrate their efforts on industrial development, rather than on attempts toachieve agricultural self-sufficiency, and should rely for a major part of their foodneeds on shipments from the United States. Because rice is the staple food formost people in the underdeveloped world and the United States produces very littlerice, this would entail profound changes in food habits, not to mention an extensivedevelopment of ocean shipping and of storage and distribution facilities. But asTable 8 shows, a more clear-cut argument is the limited future production capabilityof the United States. By increasing both yields and harvested area to the maxi-mum possible extent, United States food energy production could be raised 80per cent in 1985 and nearly tripled by 2000. However, because of the growth of

VOL. 56, 1966 POPULATION AND FOOD SUPPLIES: ROGER REVELLE 351
our own population and increased requirements for exports to Western Europe andJapan, the fraction of this expanded production available for underdevelopedcountries in 1985 would meet only about 10 per cent of their requirements. Even ifthe rate of population growth in the underdeveloped world markedly diminishes,the United States could provide less than 20 per cent of their requirements in theyear 2000.Some Conclusions.-(1) In the foreseeable future, there should be no serious
difficulty in maintaining the quantity and improving the quality of food suppliesper person in the developed countries.
(2) In the underdeveloped world the quantity of food per person is small andits quality is poor. Both quantity and quality can be increased in the future, butonly if determined and effective efforts are made in cooperation between the de-veloped and underdeveloped countries. The following lines of action are needed:
(a) Present inordinately high rates of population growth must be reducedthrough (i) vigorous birth control programs; (ii) development of elementary andsecondary education; (iii) industrialization and other processes leading to changedsocial patterns; (iv) reduction of infant and child mortality.
(b) The net sown and harvested areas in Latin America and Africa must beincreased. Among the requirements to accomplish this are (i) an extensive pro-gram of research on tropical agriculture in order to improve farming methods onsavanna and rain forest lands; (ii) development of truck and perhaps rail transpor-tation; (iii) heavy capital investment in land and water resources.
(c) In the crowded parts of Asia, both yields per hectare and the extent ofdouble cropping must be increased. Large amounts of money and large numbers ofpeople educated for agriculture are needed. A heavy capital investment is requiredin all the physical and biological factors of production: water for irrigation; soilreclamation and improvement; chemical fertilizers; improved seed and crop varie-ties; control of pests, diseases, and weeds, improved farm tools and farm machinerywhere it can be used. The cultivators need incentives to increase their production,knowledge concerning how to do it, and the confidence that comes from knowledge.Better prices, storage, marketing, and transportation facilities, crop insurance,easily available credit, more equitable systems of land tenure, and availability ofconsumer goods are among the incentives. The knowledge must come in partthrough research and partly through transmission of existing knowledge to thefarmers. This will require many more university-educated persons and more poly-technic graduates than can be produced with present educational facilities in theunderdeveloped countries.
(d) The production of high-quality protein-that is, protein with the rightbalance of amino acids-must be greatly increased without interfering with theproduction of crops for human food energy.
(e) North American food production should be increased not only to fill UnitedStates, Canadian, Japanese, and European requirements, but also to provide up to10 per cent of the needs of the underdeveloped countries during the next two dec-ades.
(3) In increasing and improving per capita food supplies, the major effort mustbe undertaken by the underdeveloped countries, but they will not be able to accom-plish this task by themselves. A large share of responsibility must be assumed bythe developed countries.


![Scene SCE CAT #: LED . Surface DATE: PROJECT: TYPE€¦ · Scene SCE LED . Surface 538.5 [21.2] 602.1 [23.7] 538.5 [21.2] 241.0 [9.5] 602.1 [23.7] 301.0 [11.9] 569 [22.4] 1142.0 [45.0]](https://img.pdfslide.us/doc/110x75/5f033b387e708231d4082fa3/scene-sce-cat-led-surface-date-project-scene-sce-led-surface-5385-212.jpg)