Embed Size (px)
Citation preview
4.0 PARENT SATISFACTION STUDY
4.0 PARENT SATISFACTION STUDY
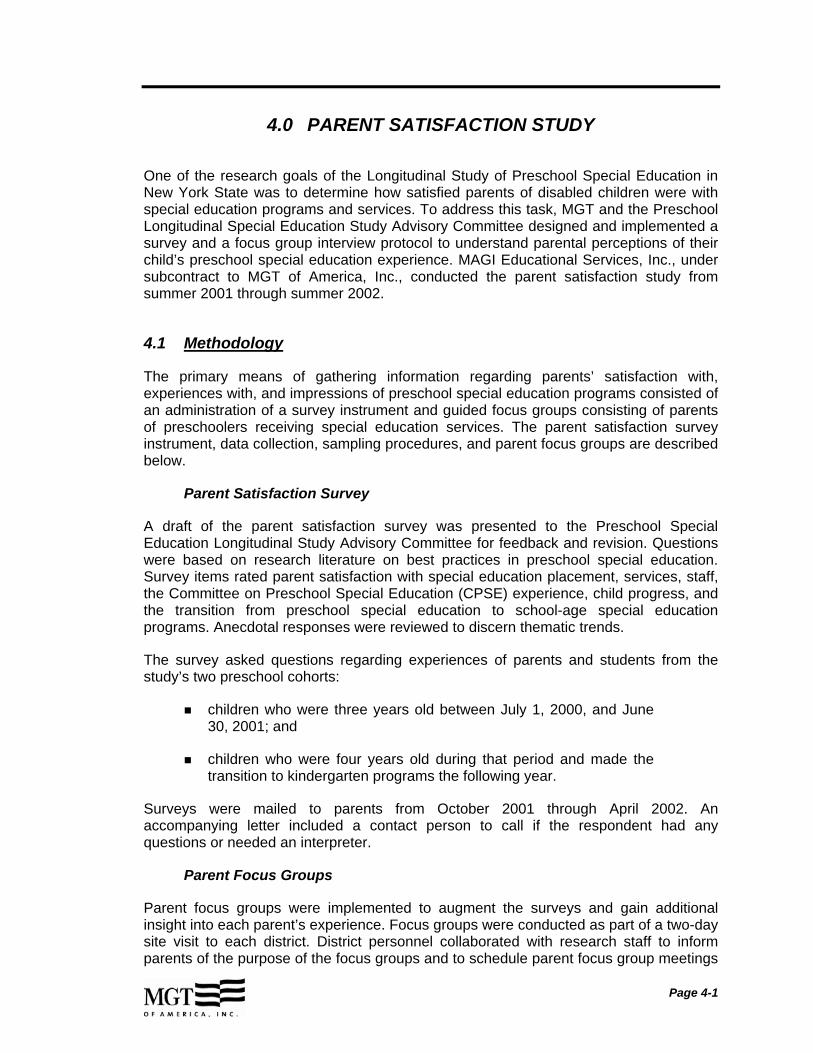
One of the research goals of the Longitudinal Study of Preschool Special Education in New York State was to determine how satisfied parents of disabled children were with special education programs and services. To address this task, MGT and the Preschool Longitudinal Special Education Study Advisory Committee designed and implemented a survey and a focus group interview protocol to understand parental perceptions of their child’s preschool special education experience. MAGI Educational Services, Inc., under subcontract to MGT of America, Inc., conducted the parent satisfaction study from summer 2001 through summer 2002.
4.1 Methodology
The primary means of gathering information regarding parents’ satisfaction with, experiences with, and impressions of preschool special education programs consisted of an administration of a survey instrument and guided focus groups consisting of parents of preschoolers receiving special education services. The parent satisfaction survey instrument, data collection, sampling procedures, and parent focus groups are described below.
Parent Satisfaction Survey
A draft of the parent satisfaction survey was presented to the Preschool Special Education Longitudinal Study Advisory Committee for feedback and revision. Questions were based on research literature on best practices in preschool special education. Survey items rated parent satisfaction with special education placement, services, staff, the Committee on Preschool Special Education (CPSE) experience, child progress, and the transition from preschool special education to school-age special education programs. Anecdotal responses were reviewed to discern thematic trends.
The survey asked questions regarding experiences of parents and students from the study’s two preschool cohorts:
� children who were three years old between July 1, 2000, and June 30, 2001; and
� children who were four years old during that period and made the transition to kindergarten programs the following year.
Surveys were mailed to parents from October 2001 through April 2002. An accompanying letter included a contact person to call if the respondent had any questions or needed an interpreter.
Parent Focus Groups
Parent focus groups were implemented to augment the surveys and gain additional insight into each parent’s experience. Focus groups were conducted as part of a two-day site visit to each district. District personnel collaborated with research staff to inform parents of the purpose of the focus groups and to schedule parent focus group meetings
Page 4-1
Parent Satisfaction Study
with parents. Interpreters were made available when respondents’ primary language was not English. Prior to meetings, trainers received instructions on how to conduct parent focus groups and completion of the parent focus group summaries, participant worksheets, and audiotapes (with parental consent).
Focus group questions probed areas such as overall satisfaction with preschool special education, impact of services on both parent and child, satisfaction with child progress, and satisfaction with the transition to school-age special education programs.
4.2 Sample
Parent Satisfaction Survey
The Parent Satisfaction Survey sample was calculated to include 25 percent of parents of the total sample of preschool special education children enrolled in the study in 2001– 2002. In New York City (NYC), the sample was restricted to preschool children from the five districts selected for the longitudinal study.1
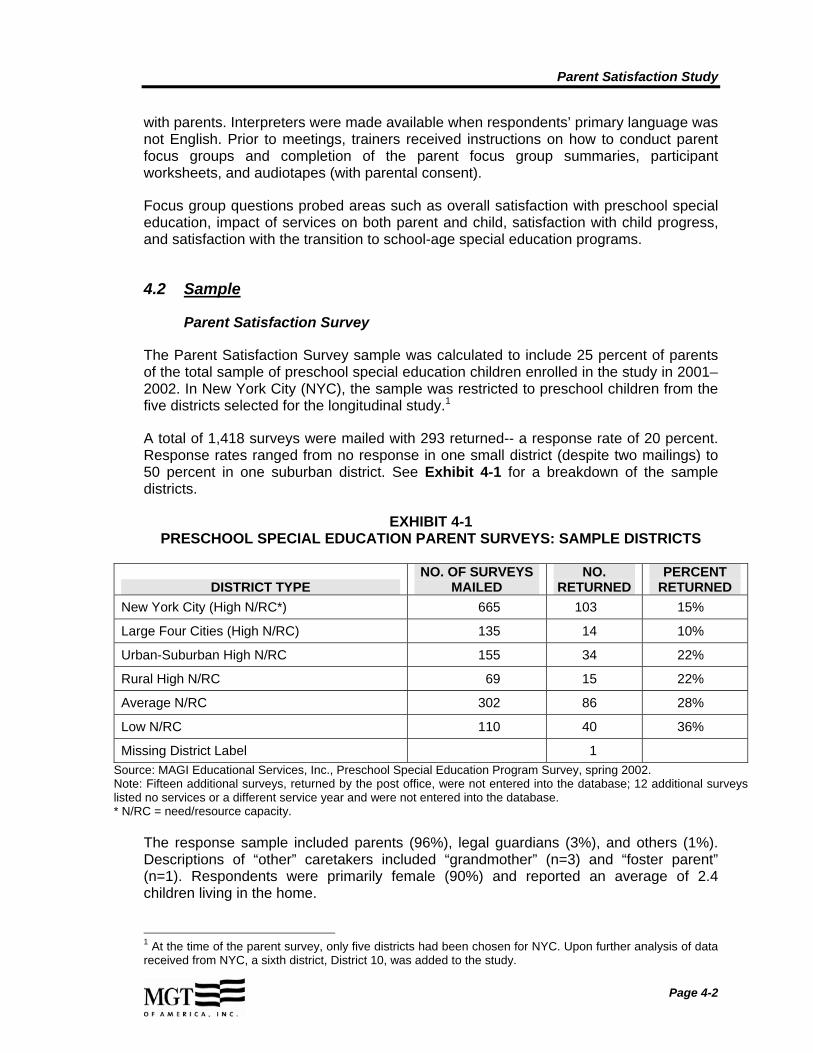
A total of 1,418 surveys were mailed with 293 returned-- a response rate of 20 percent. Response rates ranged from no response in one small district (despite two mailings) to 50 percent in one suburban district. See Exhibit 4-1 for a breakdown of the sample districts.
EXHIBIT 4-1 PRESCHOOL SPECIAL EDUCATION PARENT SURVEYS: SAMPLE DISTRICTS
DISTRICT TYPE NO. OF SURVEYS
MAILED NO.
RETURNED PERCENT
RETURNED New York City (High N/RC*) 665 103 15%
Large Four Cities (High N/RC) 135 14 10%
Urban-Suburban High N/RC 155 34 22%
Rural High N/RC 69 15 22%
Average N/RC 302 86 28%
Low N/RC 110 40 36%
Missing District Label 1 Source: MAGI Educational Services, Inc., Preschool Special Education Program Survey, spring 2002. Note: Fifteen additional surveys, returned by the post office, were not entered into the database; 12 additional surveys listed no services or a different service year and were not entered into the database. * N/RC = need/resource capacity.
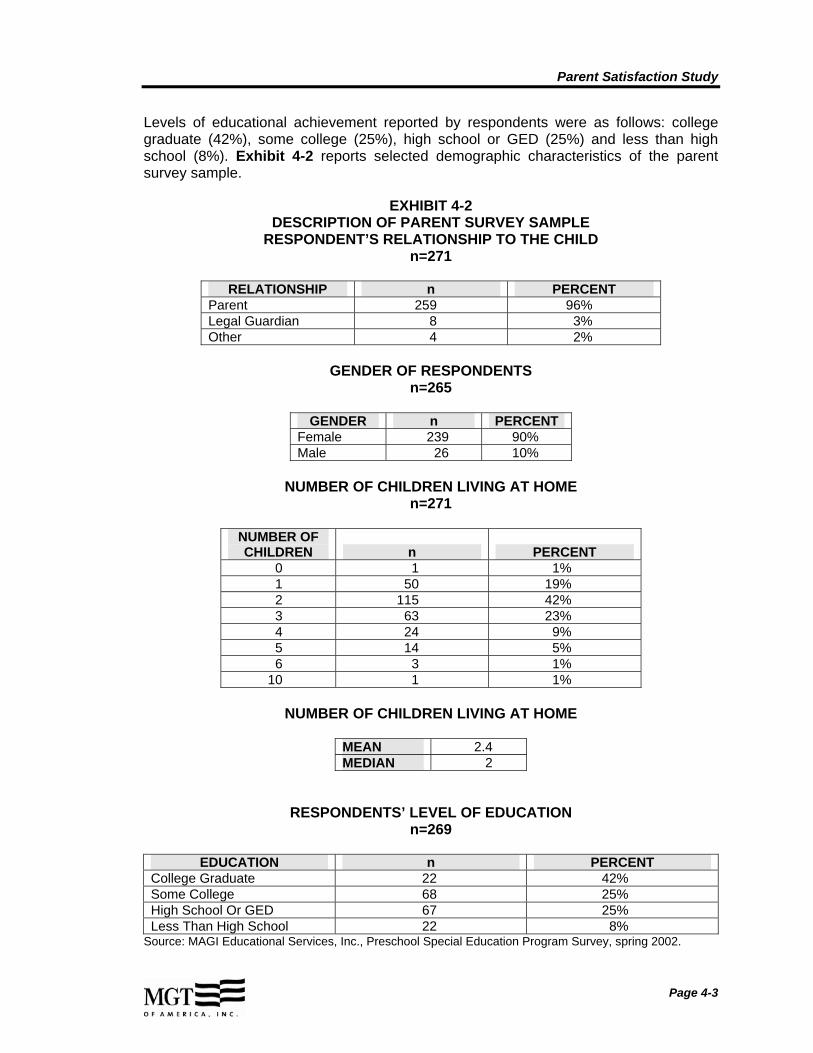
The response sample included parents (96%), legal guardians (3%), and others (1%). Descriptions of “other” caretakers included “grandmother” (n=3) and “foster parent” (n=1). Respondents were primarily female (90%) and reported an average of 2.4 children living in the home.
1 At the time of the parent survey, only five districts had been chosen for NYC. Upon further analysis of data received from NYC, a sixth district, District 10, was added to the study.
Page 4-2
Parent Satisfaction Study
Levels of educational achievement reported by respondents were as follows: college graduate (42%), some college (25%), high school or GED (25%) and less than high school (8%). Exhibit 4-2 reports selected demographic characteristics of the parent survey sample.
EXHIBIT 4-2 DESCRIPTION OF PARENT SURVEY SAMPLE
RESPONDENT’S RELATIONSHIP TO THE CHILD n=271
RELATIONSHIP n PERCENT Parent 259 96% Legal Guardian 8 3% Other 4 2%
GENDER OF RESPONDENTS n=265
GENDER n PERCENT Female 239 90% Male 26 10%
NUMBER OF CHILDREN LIVING AT HOME n=271
NUMBER OF CHILDREN n PERCENT
0 1 1% 1 50 19% 2 115 42% 3 63 23% 4 24 9% 5 14 5% 6 3 1%
10 1 1%
NUMBER OF CHILDREN LIVING AT HOME
MEAN 2.4 MEDIAN 2
RESPONDENTS’ LEVEL OF EDUCATION n=269
EDUCATION n PERCENT College Graduate 22 42% Some College 68 25% High School Or GED 67 25% Less Than High School 22 8%
Source: MAGI Educational Services, Inc., Preschool Special Education Program Survey, spring 2002.
Page 4-3
Parent Satisfaction Study
Parent Focus Groups
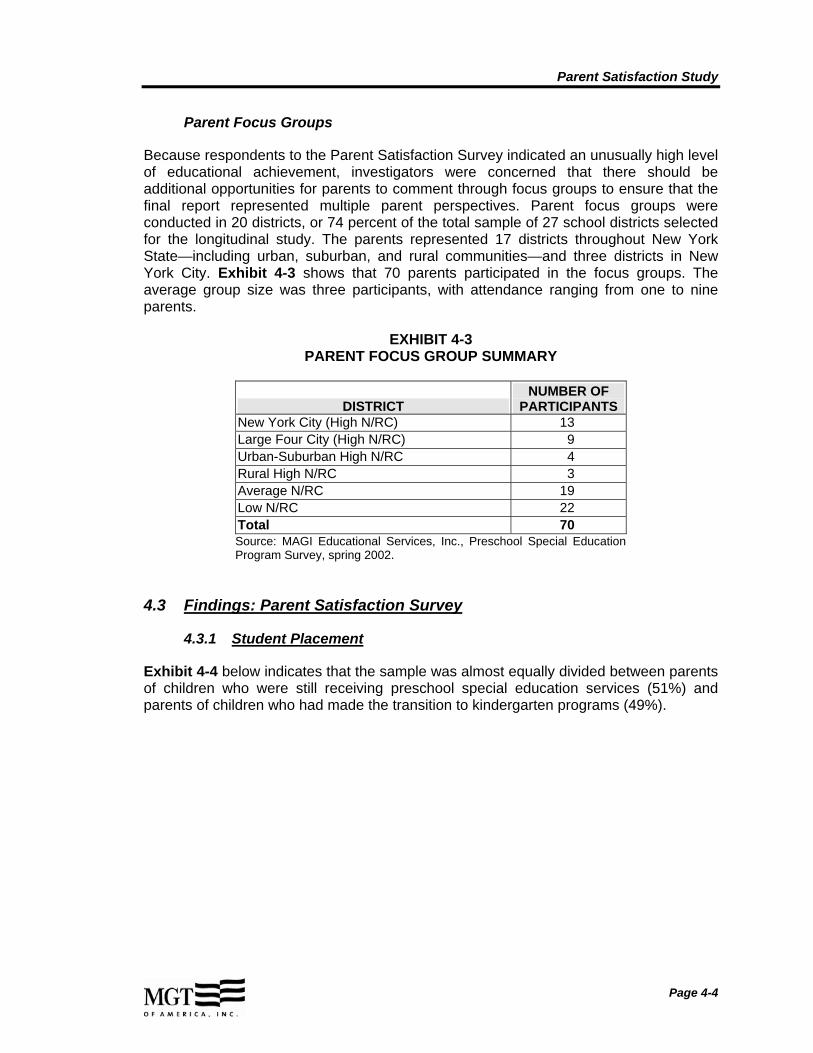
Because respondents to the Parent Satisfaction Survey indicated an unusually high level of educational achievement, investigators were concerned that there should be additional opportunities for parents to comment through focus groups to ensure that the final report represented multiple parent perspectives. Parent focus groups were conducted in 20 districts, or 74 percent of the total sample of 27 school districts selected for the longitudinal study. The parents represented 17 districts throughout New York State—including urban, suburban, and rural communities—and three districts in New York City. Exhibit 4-3 shows that 70 parents participated in the focus groups. The average group size was three participants, with attendance ranging from one to nine parents.
EXHIBIT 4-3 PARENT FOCUS GROUP SUMMARY
DISTRICT NUMBER OF
PARTICIPANTS New York City (High N/RC) 13 Large Four City (High N/RC) 9 Urban-Suburban High N/RC 4 Rural High N/RC 3 Average N/RC 19 Low N/RC 22 Total 70 Source: MAGI Educational Services, Inc., Preschool Special Education Program Survey, spring 2002.
4.3 Findings: Parent Satisfaction Survey
4.3.1 Student Placement
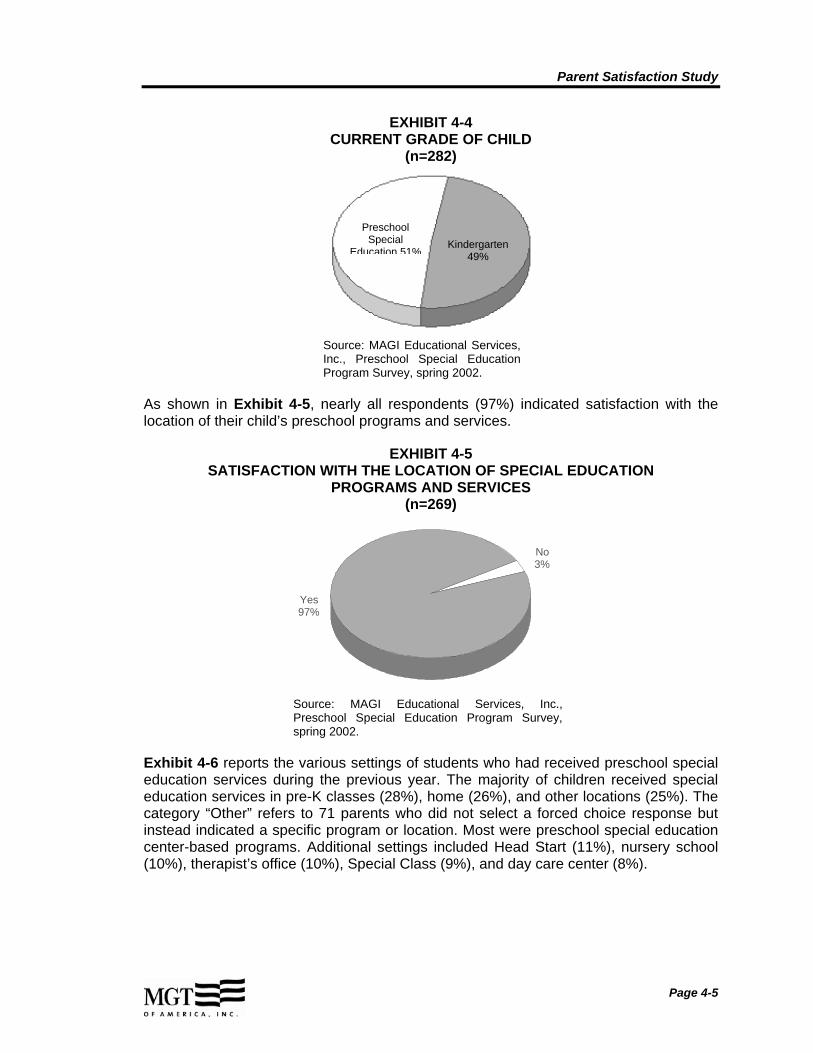
Exhibit 4-4 below indicates that the sample was almost equally divided between parents of children who were still receiving preschool special education services (51%) and parents of children who had made the transition to kindergarten programs (49%).
Page 4-4
Parent Satisfaction Study
EXHIBIT 4-4 CURRENT GRADE OF CHILD
(n=282)
Preschool Special
Education 51% Kindergarten
49%
Source: MAGI Educational Services, Inc., Preschool Special Education Program Survey, spring 2002.
As shown in Exhibit 4-5, nearly all respondents (97%) indicated satisfaction with the location of their child’s preschool programs and services.
EXHIBIT 4-5 SATISFACTION WITH THE LOCATION OF SPECIAL EDUCATION
PROGRAMS AND SERVICES (n=269)
No 3%
Yes 97%
Source: MAGI Educational Services, Inc., Preschool Special Education Program Survey, spring 2002.
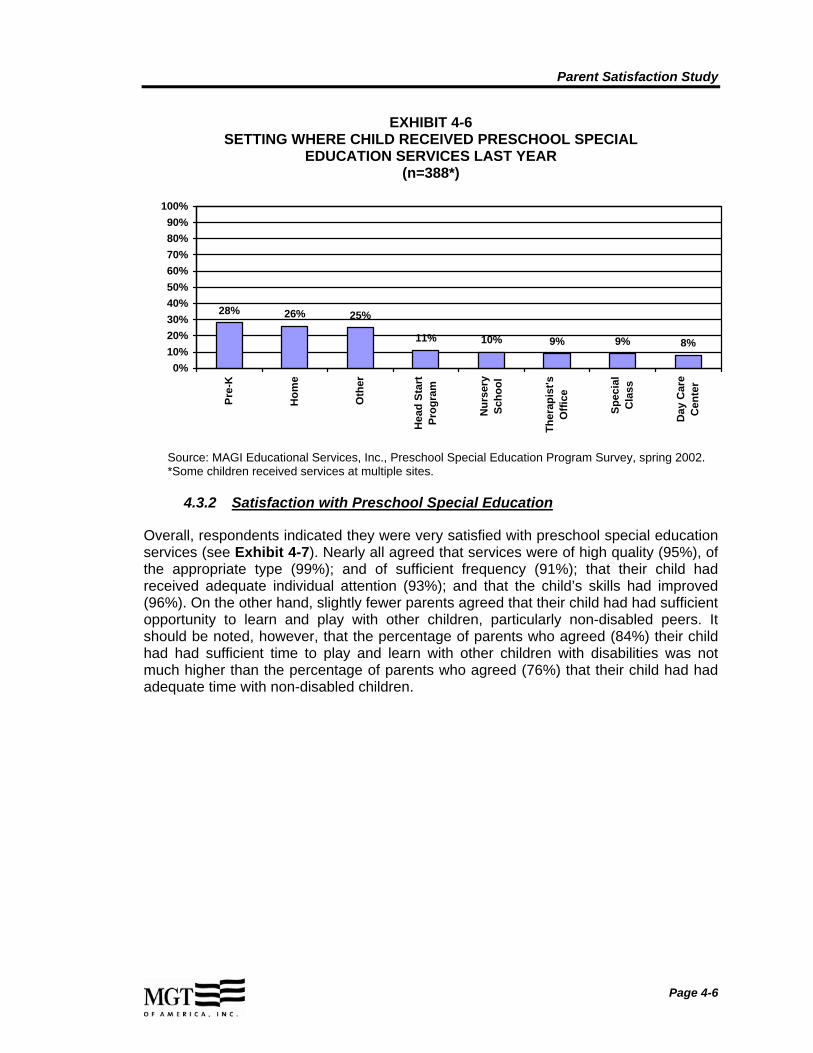
Exhibit 4-6 reports the various settings of students who had received preschool special education services during the previous year. The majority of children received special education services in pre-K classes (28%), home (26%), and other locations (25%). The category “Other” refers to 71 parents who did not select a forced choice response but instead indicated a specific program or location. Most were preschool special education center-based programs. Additional settings included Head Start (11%), nursery school (10%), therapist’s office (10%), Special Class (9%), and day care center (8%).
Page 4-5
Parent Satisfaction Study
EXHIBIT 4-6 SETTING WHERE CHILD RECEIVED PRESCHOOL SPECIAL
EDUCATION SERVICES LAST YEAR (n=388*)
8%9%9%10%11%
26% 28% 25%
0% 10% 20% 30% 40% 50% 60% 70% 80% 90%
100%
Pre-
K
Hom
e
Oth
er
Hea
d St
art
Prog
ram
Nur
sery
Scho
ol
Ther
apis
t'sO
ffice
Spec
ial
Cla
ss
Day
Car
eC
ente
r
Source: MAGI Educational Services, Inc., Preschool Special Education Program Survey, spring 2002. *Some children received services at multiple sites.
4.3.2 Satisfaction with Preschool Special Education
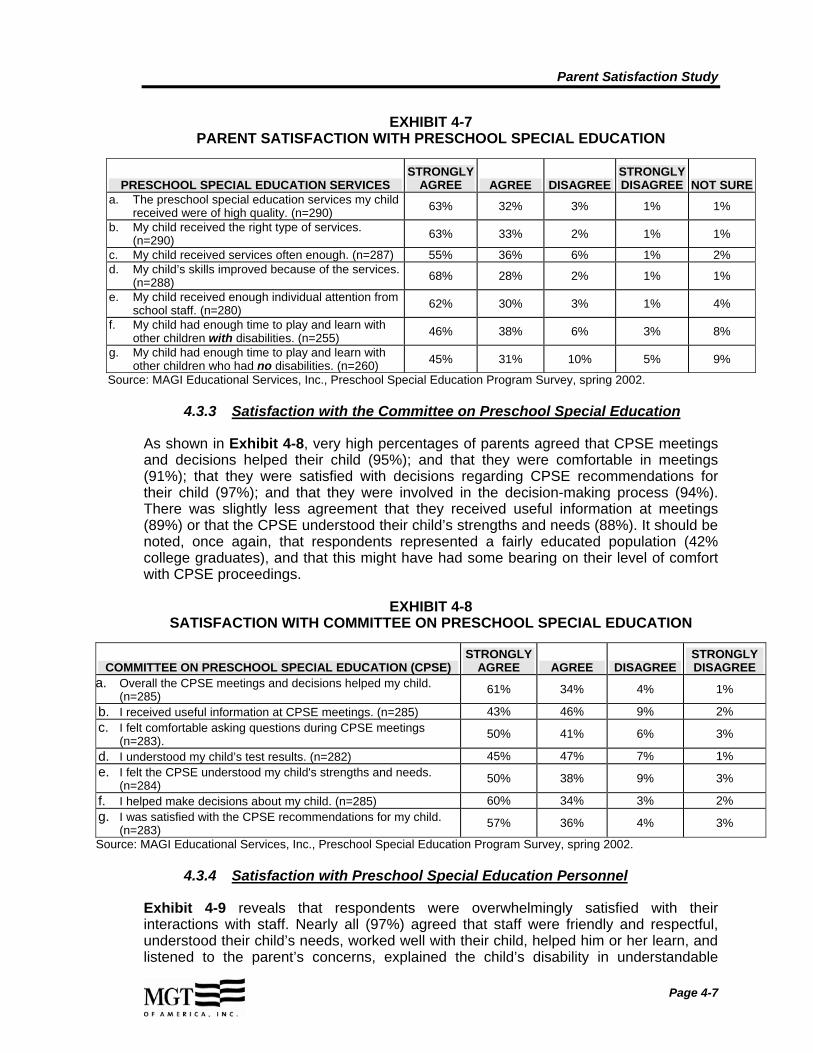
Overall, respondents indicated they were very satisfied with preschool special education services (see Exhibit 4-7). Nearly all agreed that services were of high quality (95%), of the appropriate type (99%); and of sufficient frequency (91%); that their child had received adequate individual attention (93%); and that the child’s skills had improved (96%). On the other hand, slightly fewer parents agreed that their child had had sufficient opportunity to learn and play with other children, particularly non-disabled peers. It should be noted, however, that the percentage of parents who agreed (84%) their child had had sufficient time to play and learn with other children with disabilities was not much higher than the percentage of parents who agreed (76%) that their child had had adequate time with non-disabled children.
Page 4-6
Parent Satisfaction Study
EXHIBIT 4-7 PARENT SATISFACTION WITH PRESCHOOL SPECIAL EDUCATION
PRESCHOOL SPECIAL EDUCATION SERVICES STRONGLY
AGREE AGREE DISAGREE STRONGLY DISAGREE NOT SURE
a. The preschool special education services my child received were of high quality. (n=290) 63% 32% 3% 1% 1%
b. My child received the right type of services. (n=290) 63% 33% 2% 1% 1%
c. My child received services often enough. (n=287) 55% 36% 6% 1% 2% d. My child’s skills improved because of the services.
(n=288) 68% 28% 2% 1% 1%
e. My child received enough individual attention from school staff. (n=280) 62% 30% 3% 1% 4%
f. My child had enough time to play and learn with other children with disabilities. (n=255) 46% 38% 6% 3% 8%
g. My child had enough time to play and learn with other children who had no disabilities. (n=260) 45% 31% 10% 5% 9%
Source: MAGI Educational Services, Inc., Preschool Special Education Program Survey, spring 2002.
4.3.3 Satisfaction with the Committee on Preschool Special Education
As shown in Exhibit 4-8, very high percentages of parents agreed that CPSE meetings and decisions helped their child (95%); and that they were comfortable in meetings (91%); that they were satisfied with decisions regarding CPSE recommendations for their child (97%); and that they were involved in the decision-making process (94%). There was slightly less agreement that they received useful information at meetings (89%) or that the CPSE understood their child’s strengths and needs (88%). It should be noted, once again, that respondents represented a fairly educated population (42% college graduates), and that this might have had some bearing on their level of comfort with CPSE proceedings.
EXHIBIT 4-8 SATISFACTION WITH COMMITTEE ON PRESCHOOL SPECIAL EDUCATION
COMMITTEE ON PRESCHOOL SPECIAL EDUCATION (CPSE) STRONGLY
AGREE AGREE DISAGREE STRONGLY DISAGREE
a. Overall the CPSE meetings and decisions helped my child. (n=285) 61% 34% 4% 1%
b. I received useful information at CPSE meetings. (n=285) 43% 46% 9% 2% c. I felt comfortable asking questions during CPSE meetings
(n=283). 50% 41% 6% 3%
d. I understood my child’s test results. (n=282) 45% 47% 7% 1% e. I felt the CPSE understood my child's strengths and needs.
(n=284) 50% 38% 9% 3%
f. I helped make decisions about my child. (n=285) 60% 34% 3% 2% g. I was satisfied with the CPSE recommendations for my child.
(n=283) 57% 36% 4% 3%
Source: MAGI Educational Services, Inc., Preschool Special Education Program Survey, spring 2002.
4.3.4 Satisfaction with Preschool Special Education Personnel
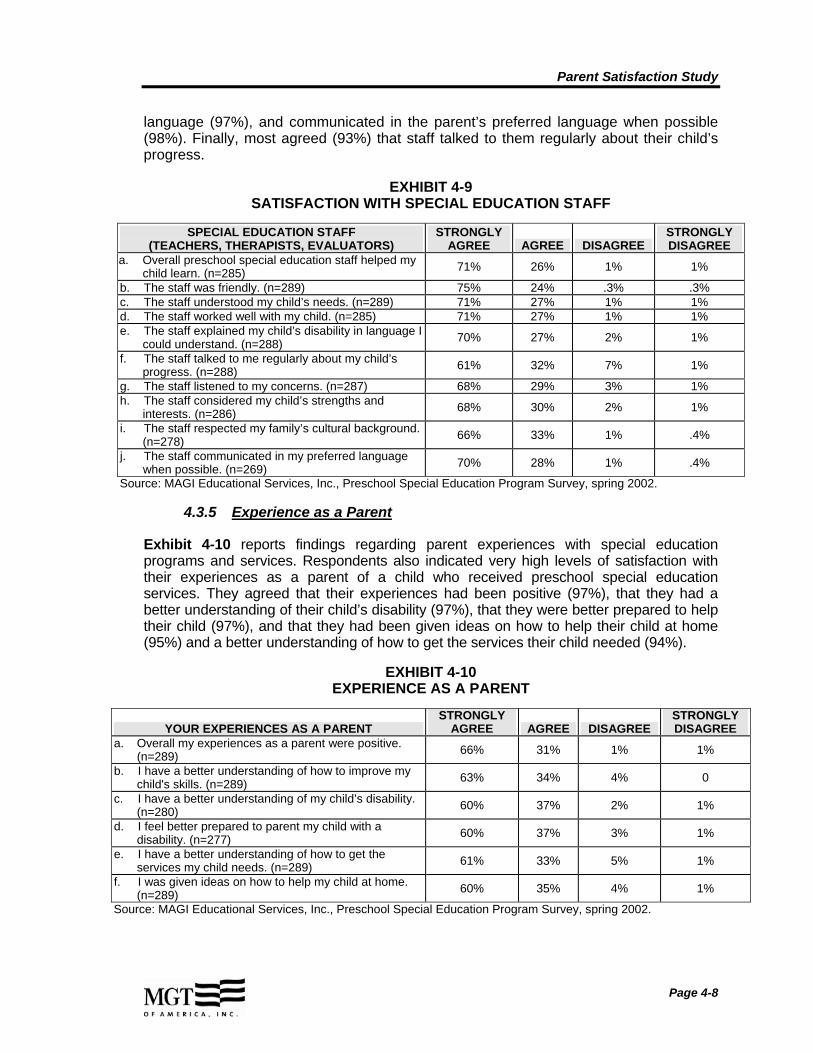
Exhibit 4-9 reveals that respondents were overwhelmingly satisfied with their interactions with staff. Nearly all (97%) agreed that staff were friendly and respectful, understood their child’s needs, worked well with their child, helped him or her learn, and listened to the parent’s concerns, explained the child’s disability in understandable
Page 4-7
Parent Satisfaction Study
language (97%), and communicated in the parent’s preferred language when possible (98%). Finally, most agreed (93%) that staff talked to them regularly about their child’s progress.
EXHIBIT 4-9 SATISFACTION WITH SPECIAL EDUCATION STAFF
SPECIAL EDUCATION STAFF (TEACHERS, THERAPISTS, EVALUATORS)
STRONGLY AGREE AGREE DISAGREE
STRONGLY DISAGREE
a. Overall preschool special education staff helped my child learn. (n=285) 71% 26% 1% 1%
b. The staff was friendly. (n=289) 75% 24% .3% .3% c. The staff understood my child’s needs. (n=289) 71% 27% 1% 1% d. The staff worked well with my child. (n=285) 71% 27% 1% 1% e. The staff explained my child’s disability in language I
could understand. (n=288) 70% 27% 2% 1%
f. The staff talked to me regularly about my child’s progress. (n=288) 61% 32% 7% 1%
g. The staff listened to my concerns. (n=287) 68% 29% 3% 1% h. The staff considered my child’s strengths and
interests. (n=286) 68% 30% 2% 1%
i. The staff respected my family’s cultural background. (n=278) 66% 33% 1% .4%
j. The staff communicated in my preferred language when possible. (n=269) 70% 28% 1% .4%
Source: MAGI Educational Services, Inc., Preschool Special Education Program Survey, spring 2002.
4.3.5 Experience as a Parent
Exhibit 4-10 reports findings regarding parent experiences with special education programs and services. Respondents also indicated very high levels of satisfaction with their experiences as a parent of a child who received preschool special education services. They agreed that their experiences had been positive (97%), that they had a better understanding of their child’s disability (97%), that they were better prepared to help their child (97%), and that they had been given ideas on how to help their child at home (95%) and a better understanding of how to get the services their child needed (94%).
EXHIBIT 4-10 EXPERIENCE AS A PARENT
YOUR EXPERIENCES AS A PARENT STRONGLY
AGREE AGREE DISAGREE STRONGLY DISAGREE
a. Overall my experiences as a parent were positive. (n=289) 66% 31% 1% 1%
b. I have a better understanding of how to improve my child's skills. (n=289) 63% 34% 4% 0
c. I have a better understanding of my child’s disability. (n=280) 60% 37% 2% 1%
d. I feel better prepared to parent my child with a disability. (n=277) 60% 37% 3% 1%
e. I have a better understanding of how to get the services my child needs. (n=289) 61% 33% 5% 1%
f. I was given ideas on how to help my child at home. (n=289) 60% 35% 4% 1%
Source: MAGI Educational Services, Inc., Preschool Special Education Program Survey, spring 2002.
Page 4-8
Parent Satisfaction Study
4.3.6 Impact on Child and Family Life
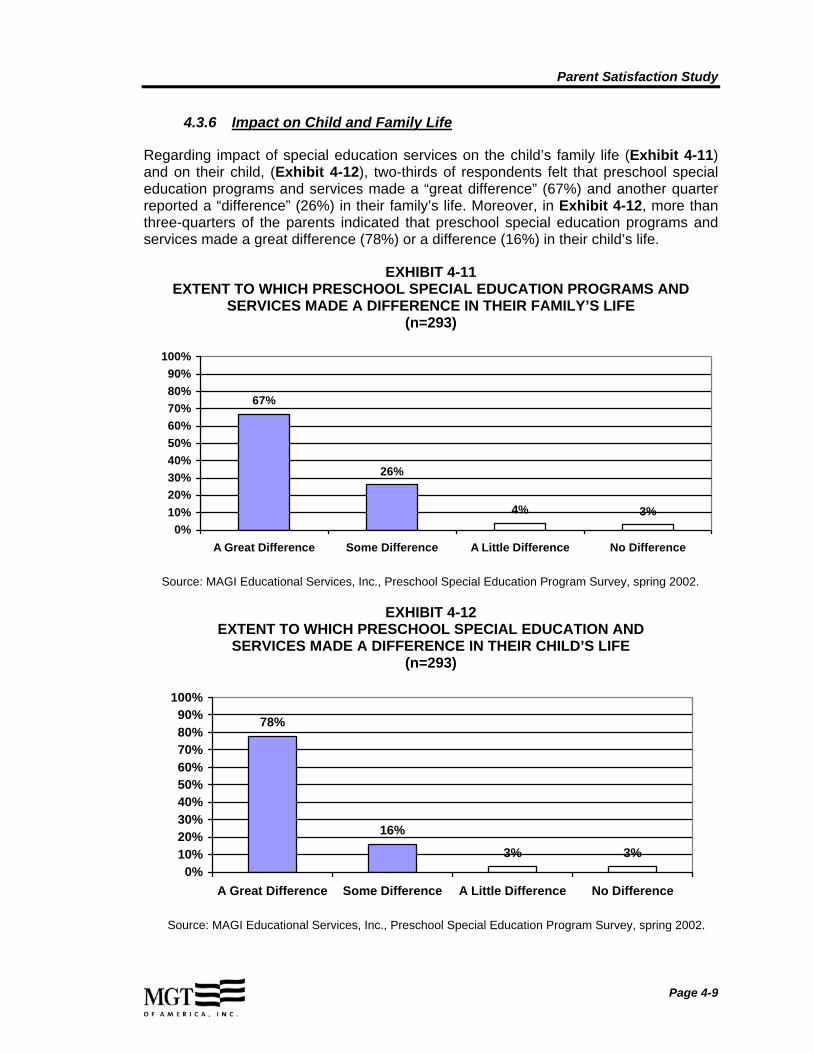
Regarding impact of special education services on the child’s family life (Exhibit 4-11) and on their child, (Exhibit 4-12), two-thirds of respondents felt that preschool special education programs and services made a “great difference” (67%) and another quarter reported a “difference” (26%) in their family’s life. Moreover, in Exhibit 4-12, more than three-quarters of the parents indicated that preschool special education programs and services made a great difference (78%) or a difference (16%) in their child’s life.
EXHIBIT 4-11 EXTENT TO WHICH PRESCHOOL SPECIAL EDUCATION PROGRAMS AND
SERVICES MADE A DIFFERENCE IN THEIR FAMILY’S LIFE (n=293)
100% 90% 80%
67%70%
60%
50%
40% 26%30%
20%
10% 4% 3%
0%
A Great Difference Some Difference A Little Difference No Difference
Source: MAGI Educational Services, Inc., Preschool Special Education Program Survey, spring 2002.
EXHIBIT 4-12 EXTENT TO WHICH PRESCHOOL SPECIAL EDUCATION AND
SERVICES MADE A DIFFERENCE IN THEIR CHILD’S LIFE (n=293)
100% 90% 80% 70% 60% 50% 40% 30% 20% 10%
0%
78%
16%
3% 3%
A Great Difference Some Difference A Little Difference No Difference
Source: MAGI Educational Services, Inc., Preschool Special Education Program Survey, spring 2002.
Page 4-9

Parent Satisfaction Study
Exhibit 4-13 reports findings regarding the extent to which parents felt special education services met their child’s needs. Most felt that a great deal of their child’s needs were met (71%) and nearly a quarter (23%) felt needs were met moderately well. Five percent believed their child’s needs were met only a little and 1 percent, not at all. Nearly two-thirds of parents indicated their child had made a great deal of progress(64%) or some progress (29%) and others indicated either little (6%) or no progress(2%).
EXHIBIT 4-13 EXTENT TO WHICH SPECIAL EDUCATION SERVICES MEET
CHILD’S NEEDS (n=289)
100% 90% 80% 71% 70% 60% 50% 40% 30% 23%
20% 5%10% 1%
0%
A Great Deal A Moderate A Little Not at All Amount
Source: MAGI Educational Services, Inc., Preschool Special Education Program Survey, spring 2002.
4.3.7 Satisfaction with Preschool Special Education and Related Services
Based on parents’ responses, the most frequently recommended services were speech and language therapy (95%), occupational therapy (63%); Special Education Itinerant Teacher (SEIT, 57%); physical therapy (49%); parent counseling, training, and/or education (46%); and counseling (49%). Forty-seven percent of respondents indicated that their child was in a special class.
Satisfaction with these services was gauged by asking parents to assign a grade from A to D (Exhibit 4-14). The average grade was B+. More than 75 percent of the parents assigned an A grade to SEIT, speech and language, occupational therapy, and physical therapy. There were slightly fewer A grades for counseling (60%), assistive technology (63%), and parent counseling (68%). Special Class was given an A grade by 70 percent of respondents. Poor grades (C or D) were assigned by fewer than 10 percent of respondents. The lowest grades were for parent counseling, training, and/or education (11%) and counseling (10%).
Page 4-10

Parent Satisfaction Study
EXHIBIT 4-14 GRADES FOR PRESCHOOL SPECIAL EDUCATION AND RELATED SERVICES
PLEASE GRADE THE FOLLOWING PRESCHOOL SPECIAL EDUCATION SERVICES A B C D
MY CHILD DID NOT HAVE THIS SERVICE
a. Special Education Itinerant Teacher (SEIT) (n=148) 80% 16% 3% 2% 43%
b. Speech and Language Therapy (n=270) 77% 17% 4% 1% 5% c. Occupational Therapy (n=166) 75% 17% 6% 2% 37% d. Physical Therapy (n=126) 76% 18% 4% 2% 51% e. Assistive Technology Services (n=60) 63% 32% 5% 0 76% f. Parent Counseling, Training, and/or Education
(n=120) 68% 23% 8% 3% 54%
g. Counseling (n=100) 60% 30% 6% 4% 61% h. Special Class (n=117) 79% 23% 3% 3% 53%
Source: MAGI Educational Services, Inc., Preschool Special Education Program Survey, spring 2002.
4.3.8 Payment for Additional Special Education Services
Exhibit 4-15 reports findings for parents who had made payments for additional special education services during the previous year. Twenty-seven parents (10%) indicated they had paid for additional special education or related services during the period in which their child was a preschool special education student. This may indicate a level of dissatisfaction with the intensity of services their child was receiving—that is, the number, frequency, or duration of services. Open-ended comments also identified the delay in service implementation as one of the reasons for private payment.
EXHIBIT 4-15 PARENTS WHO PAID FOR ANY SPECIAL EDUCATION OR
RELATED SERVICES FOR THEIR CHILD IN THE PREVIOUS YEAR (n=264)
Yes 10%
No 90%
Source: MAGI Educational Services, Inc., Preschool Special Education Program Survey, spring 2002.
4.3.9 Transition to School-Age Programs
As shown in Exhibit 4-16, a majority of parents indicated they were satisfied with the transition from preschool special education to school-age special education programs (87%), that their ideas were considered (84%), that the school-age special education
Page 4-11
Parent Satisfaction Study
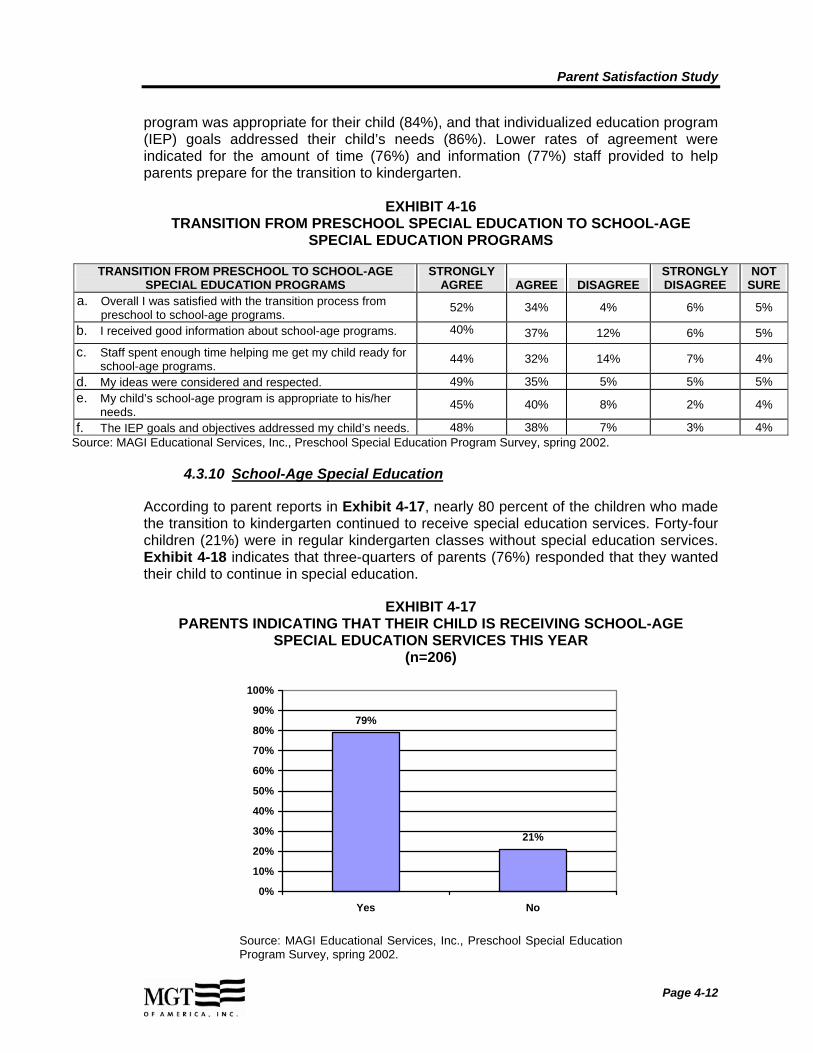
program was appropriate for their child (84%), and that individualized education program (IEP) goals addressed their child’s needs (86%). Lower rates of agreement were indicated for the amount of time (76%) and information (77%) staff provided to help parents prepare for the transition to kindergarten.
EXHIBIT 4-16 TRANSITION FROM PRESCHOOL SPECIAL EDUCATION TO SCHOOL-AGE
SPECIAL EDUCATION PROGRAMS
TRANSITION FROM PRESCHOOL TO SCHOOL-AGE SPECIAL EDUCATION PROGRAMS
STRONGLY AGREE AGREE DISAGREE
STRONGLY DISAGREE
NOT SURE
a. Overall I was satisfied with the transition process from preschool to school-age programs. 52% 34% 4% 6% 5%
b. I received good information about school-age programs. 40% 37% 12% 6% 5% c. Staff spent enough time helping me get my child ready for
school-age programs. 44% 32% 14% 7% 4%
d. My ideas were considered and respected. 49% 35% 5% 5% 5% e. My child’s school-age program is appropriate to his/her
needs. 45% 40% 8% 2% 4%
f. The IEP goals and objectives addressed my child’s needs. 48% 38% 7% 3% 4% Source: MAGI Educational Services, Inc., Preschool Special Education Program Survey, spring 2002.
4.3.10 School-Age Special Education
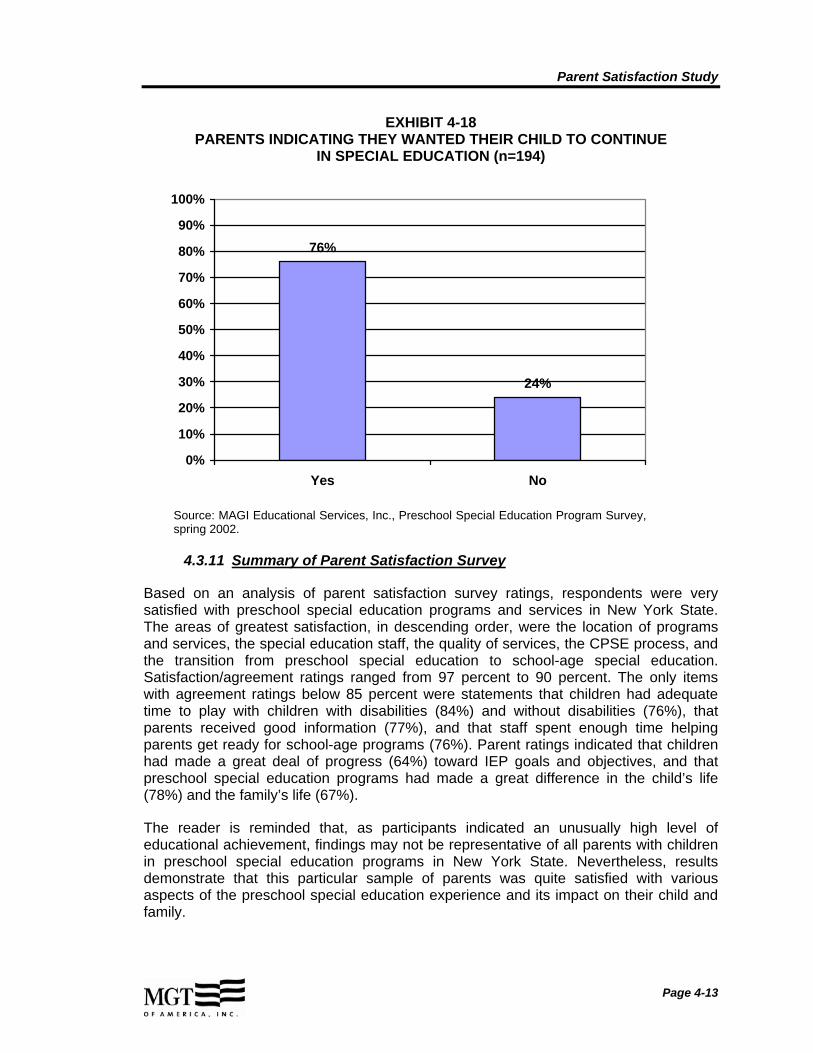
According to parent reports in Exhibit 4-17, nearly 80 percent of the children who made the transition to kindergarten continued to receive special education services. Forty-four children (21%) were in regular kindergarten classes without special education services. Exhibit 4-18 indicates that three-quarters of parents (76%) responded that they wanted their child to continue in special education.
EXHIBIT 4-17 PARENTS INDICATING THAT THEIR CHILD IS RECEIVING SCHOOL-AGE
SPECIAL EDUCATION SERVICES THIS YEAR (n=206)
100%
90%
80%
70%
60%
50%
40%
30%
20%
10%
0%
79%
21%
Yes No
Source: MAGI Educational Services, Inc., Preschool Special Education Program Survey, spring 2002.
Page 4-12
Parent Satisfaction Study
EXHIBIT 4-18 PARENTS INDICATING THEY WANTED THEIR CHILD TO CONTINUE
IN SPECIAL EDUCATION (n=194)
100%
90%
80%
70%
60%
50%
40%
30%
20%
10%
0%
24%
76%
Yes No
Source: MAGI Educational Services, Inc., Preschool Special Education Program Survey, spring 2002.
4.3.11 Summary of Parent Satisfaction Survey
Based on an analysis of parent satisfaction survey ratings, respondents were very satisfied with preschool special education programs and services in New York State. The areas of greatest satisfaction, in descending order, were the location of programs and services, the special education staff, the quality of services, the CPSE process, and the transition from preschool special education to school-age special education. Satisfaction/agreement ratings ranged from 97 percent to 90 percent. The only items with agreement ratings below 85 percent were statements that children had adequate time to play with children with disabilities (84%) and without disabilities (76%), that parents received good information (77%), and that staff spent enough time helping parents get ready for school-age programs (76%). Parent ratings indicated that children had made a great deal of progress (64%) toward IEP goals and objectives, and that preschool special education programs had made a great difference in the child’s life (78%) and the family’s life (67%).
The reader is reminded that, as participants indicated an unusually high level of educational achievement, findings may not be representative of all parents with children in preschool special education programs in New York State. Nevertheless, results demonstrate that this particular sample of parents was quite satisfied with various aspects of the preschool special education experience and its impact on their child and family.
Page 4-13
Parent Satisfaction Study
4.4 Findings: Parent Satisfaction Survey Qualitative Comments
Forty percent of parents who responded to the Parent Satisfaction Survey offered additional comments when asked for further impressions of their child’s preschool special education program and service experience. Through comparative analysis, MGT organized 119 open-ended comments into the particular themes and categories discussed below. Overall, two-thirds of the comments were positive and the other third described specific areas of disappointment or disapproval. Positive comments related generally to two categories: special education staff and child progress. Categories of concern had to do with special education bureaucracy and dissatisfaction with the CPSEs. Two additional themes were also expressed: the need for advocacy on behalf of special education students requiring services and their parents, and the need for increased opportunities for special education students to interact with typically developing peers.
Findings were analyzed by district type and for the total sample of survey respondents. New York City parents provided 25 percent of the open-ended comments, and their responses were equally distributed between categories of satisfaction and dissatisfaction. There was also an equal number of negative comments from New York City parents and from parents from districts categorized as Average or Low Need districts.
I was completely satisfied with every aspect of the 4.4.1 Areas of Satisfaction system! A great experience, no problems at all.
The following are examples of satisfaction:
� The teachers, therapists, and staff were excellent. By far the most frequent comment was, “Thanks for the wonderful work.” There were many personal references to teachers and therapists who “did a wonderful job” and “made a difference in my child’s and our family’s life.”
− M. M. provided both my son and my daughter with such love and support (myself as well) and knowledge that my child made tremendous progress and words could never express my deep thanks to Ms. M. for giving my child the gift of speech.
− V.C L.C. is a wonderful school. My son made significant progress. Everyone is helpful, warm, and courteous and they teach in a loving caring manner.
− All I can say is the teachers and staff are wonderful, caring, and show the professionalism in the utmost manner. The school has been a blessing to my child and our family.
− The programs offered are fantastic and the teachers were patient and knowledgeable. They did a great job with my child.
� Services were excellent and my child has made significant progress. There were many comments that the services were
Page 4-14
Parent Satisfaction Study
excellent and they helped the child make progress and prepared him or her for school.
− My child completed services and objectives and was declassified before starting kindergarten. We were very pleased with our experience and services received and we are appreciative of all staff we worked with.
− JKLC… has been a wonderful experience in every way for my child. Her social skills, speech, and overall performance have flourished since she has been attending this school! The teachers and staff are wonderful, patient, and work miracles. Thank you so much for allowing this special education program to continue.
− I finally believe special education played a very important part in [my child’s] development and school readiness. I am grateful for all these services, and her teacher was wonderful.
− The nursery school can see a big difference in my child as far as progress in speaking and socializing with other children.
4.4.2 Areas of Dissatisfaction
The following are examples of parent’s dissatisfaction:
� The special education bureaucracy is stressful. Most of the concerns associated with bureaucracy were related to a delay in services and lack of providers. There were comments about waiting lists for therapists and service delays due to poor communication.
− I am not able to get the services that I need at this time even though I have a right to services.
− The only frustration has been getting OT and PT therapists, at times – they’re in short supply.
− It did take me over 60 phone calls to receive any therapist who had an opening.
� CPSE is not helpful or responsive to parents. This concern referred to bureaucratic constraints and the parents’ frustration, and sometimes anger, at the lack of responsiveness of special education administrators. A few parents wrote about disagreements regarding services, placement, or 12-month programming. Others were disappointed that the CPSE did not provide guidance, and that parents had to learn about services from other sources. Again, lack of communication was a source of complaint.
Page 4-15
Parent Satisfaction Study
− Although the therapist has been wonderful, I find dealing with the special education office stressful. They are often not friendly or informative and actually do nothing to put your mind at ease.
− I had begged for 12-month services and was told no… A few days before the summer began I was told that she could receive summer services. It was too late to find appropriate providers.
− Overall, therapists and therapy sessions were very good. There was, however, miscommunication between district and provider agency that resulted in a delay of services. I felt the committee did a poor job of resolving the problem and were resistant to providing services initially.
4.4.3 Additional Themes
There were other comments that offered additional insight into parent satisfaction with preschool special education. One theme that emerged was the need for parental advocacy. Another was parents’ desire for their children to have more interaction with typically developing peers.
� Parents need to advocate for services and “work the system.” A number of parents commented on their need to advocate for their child in response to special education bureaucracy. They described their persistence in working with the CPSE to obtain services or arrange for therapists to begin treatment. Parents also wish to be better informed. A few parents commented on the desire to understand their child’s test results and have the committee “use everyday words to help parents understand what they [CPSE] are talking about.”
− Most of the information I received came from sources other than CPSE. We received virtually no help or guidance from the CPSE and had to fight for what we learned was best for our child…. This had been bureaucracy at its worst. It is hard enough to have a child with special needs; our problem has become the system more than our child.
− If I were uneducated and not proficient in English, it would have been impossible to “work the system.”
− After the initial evaluation on my daughter was completed and services were recommended, therapy was provided only after months of daily phone calls I had to make to the CPSE to ensure that all the necessary paperwork was completed. If I had not done this daily follow-up with the CPSE, my child would not have received services.
− Overall, I found the service very helpful; however, dealing with the “committee” and “test scores” was an overwhelming battle. I am confident that my son received his services only because of
Page 4-16
Parent Satisfaction Study
the preparation I sought out before going into each CPSE meeting.
� There should be more opportunity for interaction with typical children. Although parents were generally pleased with their child’s placement, a few commented on the benefits of integrated settings and expressed concern that their child’s progress had been compromised by placement in a setting with only children with disabilities. “I would love to see an opportunity for interaction with typical children” was a common statement that underscored this belief.
− I feel that if my child had been exposed to regular education for a part of his learning experience he would have been further.
− These programs should incorporate typically developing children for disabled children to model.
The services my son received were priceless…they made all the4.4.4 Summary: Qualitative Comments difference in the world. Early intervention is the key to success in a young child.
The above quote is fairly representative of the open-ended comments provided at the end of the Parent Satisfaction Survey. Overall, parents seemed eager to share their appreciation for the wonderful work that teachers and therapists did with their children. Over two-thirds of the parents were very satisfied with services and most parents felt that their child had made significant progress.
There were also areas of dissatisfaction that were quite consistent across districts. Parents expressed frustration, and sometimes anger, at the CPSE bureaucracy. The most frequent complaint was the delay in services due to lack of providers or lack of communication. One reaction to the perceived inefficiency was for parents to act as advocates for their child. It should be noted that there was much variability across districts in terms of parent satisfaction and areas of concern.
Some parental complaints, such as lack of information about the CPSE process and test results, can easily be translated into strategies for change. Other concerns, such as the perceived bureaucracy and lack of CPSE responsiveness, demand more complex solutions.
In conclusion, at least two out of three respondents who provided open-ended comments on the Parent Satisfaction Survey were very pleased with preschool special education services, staff, and child progress in New York State. Their comments were very positive and supported the quantitative findings that preschool special education programs and services have had a significant impact on the lives of children and families.
Page 4-17

Parent Satisfaction Study
4.5 Findings: Parent Focus Groups
4.5.1 Areas of Satisfaction
Child Placement
All parents were satisfied with placement, whether their child was in a regular early childhood program or pre-K class with typical peers or in a classroom with disabled students only. Based on available information from parent comments, almost two out of three children were placed in integrated settings (n=37) compared to segregated settings (n=21). In New York City, placement varied a great deal by district; some districts provided more integrated pre-K classes and others relied primarily on private preschool special education programs. Throughout the state, a common theme was the benefit of preschool special education programs that gave children the opportunity to interact with typical peers. According to parents, such programs lessened the tendency to label and offered their children more role models from whom to learn appropriate behaviors for school. One parent was pleased with the integrated setting and upset when her child moved to a more restrictive setting (special class) after preschool.
Special Education Staff
Parents were very satisfied with teachers and related service providers. They were impressed by these individuals’ knowledge, caring attitudes and behavior, and ability to work well with their child. Parents were very satisfied with the frequency and quality of staff communication regarding their child’s progress. Their comments included specific references to the value of daily notebooks, journals, phone calls, and periodic meetings. The only negative comments came from parents in one district who were concerned about high staff turnover and lack of consistency.
Special Education Services
Parents were very satisfied with the type and frequency of special education services as well as the location of service delivery, whether it was the home, a classroom, or an alternative space. Nonetheless, a few parents commented on delays in the initiation of services and waiting lists for preschool special education programs. Parents also discussed their difficulty in choosing a therapist for their child from a list of recommended providers.
Child Progress
One area of universal agreement and high satisfaction was with regard to child progress. Parents specifically commented on improvements in language and behavior. A number of parents stated that the improvement in their child’s behavior had had a profound impact on their family life. One focus group participant who was a former teacher was quite confident that preschool special education services increased school readiness by allowing children to improve their ability to follow directions and express themselves, and to build their gross motor and socialization skills and self-confidence.
Page 4-18
Parent Satisfaction Study
4.5.2 Areas of Dissatisfaction
CPSE Involvement
There were mixed reports about CPSE involvement; in half of the focus groups (10 of 20), some participants expressed moderate to strong dissatisfaction with preschool special education administration. For example, CPSE communication was described as “adequate at best.” Parents shared the desire to be better prepared for meetings and more informed about special education rules, regulations, and options for children. When the group was asked about their experiences during CPSE meetings, some parents described feeling “overwhelmed,” “intimidated,” and “lost in the system.”
Although New York City parents were pleased overall, a few commented that special education administrators did not listen to their concerns, which typically involved requests for additional evaluations or change of placement.
The use of advocates was a recurring theme mentioned during nine focus groups. Some parents felt that they had been given “the runaround” and had had to be persistent and fight for services. Two parents mentioned that they had had to initiate the request for services and/or pay out of pocket until services were approved. In one district where parents described an adversarial relationship with the special education administrator, some of the parents had felt powerless without an advocate.
Several parents mentioned the value of an advocate to manage the eligibility and placement process, including one parent who was very pleased with the system but still felt that a third-party advocate should be available to help parents understand policies and procedures. Three parents who were generally satisfied added that they were able to advocate for their child because of their background (special education teacher, social worker, grandparent who worked in the district), and each wondered what happened to parents who lacked such a background.
Spanish-speaking parents from one district were adamant about the value of having an advocate to help negotiate the system. They expressed frustration with the lack of bilingual staff, translators, and special education documents in Spanish. They also recommended more effective work in the Hispanic community, as parents were not aware of services and often did not seek help on their own.
Transition Services
Seventy-nine percent of the focus group participants had children who made the transition to school-age special education programs and services, often in a less restrictive environment. Almost all of these parents wanted their child to continue to receive special education services, although some raised concerns about the reduction in related services. One parent commented that children were “expected to do more with less.”
Parents who were adequately prepared felt more positive about the transition process; this was particularly true when children stayed in the same building. In one district where parents were very satisfied with the entire preschool special education experience, they remarked that the system provided a social worker who acted as a school/county liaison,
Page 4-19
Parent Satisfaction Study
much like the Early Intervention Service Coordinator, to help parents understand regulations and program options and obtain suitable services.
Parents from ten districts shared their dissatisfaction with the transition process. The most typical complaints were that they did not have sufficient information or feel adequately prepared. Other parents were more concerned about their child’s gains and ability to handle a kindergarten curriculum, or the fear of labeling in school-age programs. Yet another area of frustration was the lack of opportunity and need to initiate requests to visit program options. Only two children had moved from an integrated setting to a more restrictive setting; one parent had requested the placement and the other was concerned about the lack of typical peer role models. In New York City, two parents commented that the delay in paperwork and lack of communication led to unsatisfactory placements and frustration over the lack of alternative classes.
A general theme, identified through comparative analysis of parent comments, was the view that transition points were stressful for families; such as the transition from the Early Intervention Program (EIP) to preschool (CPSE) to school age (CSE) special education. Parents reacted to learning new rules and getting acquainted with different systems. Again, parents who “did their homework” and were well informed were more satisfied with the transition process.
Summary: Parent Focus Groups
Overall, parents were satisfied with preschool special education programs, services, and staff. They were particularly pleased with their child’s progress in language skills, behavior, and preparation for kindergarten programs. In addition to the praise and support for preschool special education, there were recurring themes across some districts regarding areas of dissatisfaction. Parents described conflict and frustration with CPSE procedures and meetings. Some parents felt intimidated; others used advocates to negotiate the system or worked hard to advocate for their child’s best interests. The lack of preparation for transition services was another area of dissatisfaction. In general, parents expressed concerns about the demands of kindergarten programs and emphasizing their desire to continue services to maintain their child’s progress in academic and social skills.
Even within districts, parents described significantly different experiences and feelings of satisfaction. Some parents came to share their anger at special education administrators; others came to praise the staff and speak positively about the value of early identification. Nonetheless, if the focus is on outcome, it appears that from the parents’ perspective preschool special education programs and services in New York State were effective. Parents were satisfied that their children were benefiting from quality programs and services and caring professional staff. The findings were less positive with regard to the parents as they interacted with the special education system to obtain appropriate placements and services for their child. Finally, it should be noted that parents who volunteered to attend the district focus groups may not necessarily have been representative of the sample of parents with children in preschool special education, since voluntarism introduces a bias element.
Page 4-20

Parent Satisfaction Study
4.6 Conclusion: Parent Satisfaction Study
In general, the qualitative comments and focus group discussions corroborated the findings from the parent satisfaction survey. The evidence demonstrated that parents were very pleased with preschool special education programs, services, and staff in New York State. Parents were particularly impressed with the quality and responsiveness of staff and the progress their child had made towards the goals and objectives outlined in his or her individualized education program (IEP). Although there were some complaints about delays and administrative procedures, special education programs and services were rated positively.
The CPSE process and transition services were two areas with slightly lower parent ratings; they were also identified as areas of dissatisfaction in one-third of the survey comments and in 10 of 20 focus group discussions. It is important to note that the qualitative findings may not be representative of the parent sample since fewer than half of the parents entered comments, and focus group participation was limited. Even so, there was enough consistency in the personal stories and written comments shared by parents to suggest themes that warrant consideration.
Some parents were intimidated and overwhelmed by the CPSE bureaucracy. Others mentioned the value of having an advocate to negotiate the system and obtain appropriate services. Parents also commented that the district did not provide adequate preparation for the transition to school-age programs. Although the process presented some challenges for parents, by far the strongest finding was that children did benefit from preschool special education programs and services and parents were thankful for the competent and caring professional staff.
Page 4-21