Embed Size (px)
Citation preview

116
4 / The BRICs: What does Economic History say about their Growth Prospects?
Stephen Broadberry
1. Introduction
The BRIC countries (Brazil, Russia, India and China) have received a great deal of attention ever since the acronym was coined by O’Neill (2001) of Goldman Sachs more than a decade ago. Whereas O’Neill focused on the large and growing share of BRIC countries in world GDP notably because they represent a significant proportion of the world population – rather than high levels of per capita GDP – other commentators have been less careful in maintaining this important distinction. As a result, a rather confusing picture of world economic trends has often emerged. Whereas O’Neill was concerned about population-driven GDP growth in the BRIC countries reducing the ability of rich Western countries to have a significant impact on global GDP through their monetary and fiscal policies, fears in the West have usually been concerned about being overtaken in terms of levels of per capita income.
Indeed, this will be the main focus of this chapter. Section 2 considers the key factors that have been identified in the recent policy literature based on post-war experience responsible for growth accelerations and growth declines, not only propelling economies on to the path of catching up, but also ushering in growth declines before catching up has been fully achieved (Abramovitz, 1986). Section 3 then looks at some of the main reversals of fortune of countries over a much longer span of history. However, since this may appear to lend an air of inevitability to the successful rise of the BRICs to global economic leadership, Section 4 considers instances when countries that began to catch up initially looked very promising, before falling by the wayside. Finally, Section 5 assesses projections for individual BRIC countries to 2030, while Section 6 highlights the key policy conclusions.
2. Understanding growth accelerations and growth declines
Growth accelerations and growth declines have been examined systematically for a large sample of countries, with analysis focusing on two key questions. First, is it possible to identify key factors that lead to sustained growth accelerations? And second, what happens when growth slows down?
Hausman et al. (2005) use the Penn World Tables for the 1950s to the 1990s to identify growth accelerations, which they define as episodes where the per capita income growth rate increases by at least 2 percentage points per year and remains above 3.5% for at least eight years. In addition, they add the requirement that the post-acceleration output level must exceed the pre-episode

117
The BRICs: What does Economic History say about their Growth Prospects?
peak, so as to rule out cases of pure recovery. Having identified more than 80 such episodes, they then note that growth accelerations are correlated with, but not necessarily causally related to, increases in investment and trade and real exchange-rate depreciation.
Hausman et al. (2005) find that political regime changes (as measured by the Polity IV dataset www.systemicpeace.org/polity/polity4.htm) are statistically significant predictors of growth accelerations, although perhaps surprisingly, transitions to autocracy produce a larger positive effect than transitions to democracy. However, these results seem to depend on growth accelerations that fizzle out after eight years and disappear if the growth acceleration has to last at least 17 years. External shocks (as measured by large terms-of-trade changes) tend to produce only temporary growth accelerations that peter out, whereas domestic economic reforms (as measured by the Sachs-Warner index, http://www.bris.ac.uk/Depts/Economics/Growth/sachs.htm) tend to produce sustained accelerations. However, despite the statistical significance of these results, Hausman et al. (2005) emphasise the low explanatory power of the model and conclude that growth accelerations are driven largely by idiosyncratic causes. As they put it: “To paraphrase Tolstoy, not even happy families are alike.” This seems to leave the door open for a historical approach.
One element which needs to be borne in mind when considering the future growth prospects of the BRICs is that, once started, the growth process does not automatically continue. Indeed, history is replete with examples of countries which start on the catching-up process but then stall long before they achieve this goal. It is therefore equally important to consider growth slowdowns. Eichengreen et al. (2011) build on Hausman et al. (2005) to look at growth decelerations, which are defined as a decline in the growth rate of GDP (rather than per capita GDP) by at least 2 percentage points from a level of at least 3.5% per year for the previous seven years, with an additional requirement that the level of per capita income should be at least $10,000 in 2005 constant prices to rule out crises in not yet successfully developing countries. The most clear-cut result that Eichengreen et al. (2011) uncover is the identification of a threshold level of per capita GDP, after which catching-up countries have typically slowed down in the post-1950 period. The figure they come up with is $17,000, although it is not clear why this should be a fixed figure over the entire 1950-2005 period, when the per capita income frontier was growing by around 2% per annum.
A second result, obtained from growth accounting, is that GDP growth slowdowns are associated with decelerations in the growth of total factor productivity (TFP), rather than factor inputs. Eichengreen et al. (2011) interpret this as supporting the idea that growth slows down when the easy gains from reallocating resources away from agriculture to industry and importing technology from abroad have been exhausted. They find that growth slowdowns typically have occurred when per capita GDP reaches 58% of that in the lead country, which is perhaps a more intuitive, if less user-friendly way of presenting the results than a fixed $17,000. They also find that the peak probability of a slowdown came when manufacturing employment reached 23% of total employment. In contrast to Hausman et al. (2005), Eichengreeen et al. (2011) do not find any role for political regime changes, but external terms of trade shocks matter when interacted with openness. Unusually low shares of consumption in GDP also seem to have been associated with slowdowns. Turning to the effects of economic policy, Eichengreen et al. (2011) find that growth slowdowns are

118
Reversals of Fortune? A Long-term Perspective on Global Economic Prospects
more likely where inflation is high and the exchange rate is undervalued. They speculate that this could be because reliance on an undervalued exchange rate leads to a cumulation of imbalances, leaving a country more vulnerable to external shocks or becoming less suitable once the gains of shifting labour from agriculture to industry have been realised.
These results have only been based on a consideration of data since the 1950s, a period when there has been no fundamental change of economic leadership, although there have been plenty of growth accelerations and slowdowns. Discounting small countries made rich by natural resource booms, the United States has remained the global per capita GDP leader throughout the post-war period. To analyse significant reversals of fortune, it is therefore necessary to consider a longer time span. Furthermore, although the literature has identified statistically significant factors related to growth accelerations and declines, their explanatory power is weak, leaving a large role for idiosyncratic factors which can only be studied within a historical framework.
3. Reversals of fortune in history
This section now turns to some of the most important reversals of fortune in history to see what light they shed on the process of overtaking other countries. Here, we are able to draw on research undertaken at CAGE utilising recent developments in historical national accounting. Indeed, a clearer quantitative picture has now emerged of some of the most important reversals of fortune in history, including (1) within Europe between the North Sea Area and the Mediterranean; (2) within the North Sea Area between Holland and Great Britain; (3) the great divergence between Europe and Asia; and (4) the United States overtaking Great Britain.
3.1 The North Sea Area and Mediterranean EuropeTable 1 provides data on GDP per capita levels in a number of European countries between 1270 and 1850. All figures have been converted to 1990 international dollars, the usual standard for such comparisons (Maddison, 2001). At 1990 prices, the World Bank’s definition of poverty was for an individual living on a dollar a day or less, so that a society with an annual average per capita income of $400 involved most people living at a bare-bones subsistence level and a small elite enjoying higher incomes. Table 1 suggests that West European countries had already achieved well above subsistence levels by the late Middle Ages, with average per capita incomes in England and Holland around $800 on the eve of the Black Death in 1348, and substantially higher levels than this in Italy and Spain.
The reversals of fortune between the North Sea Area and Mediterranean Europe are underscored in Table 1 by the fact that Italy and Spain had significantly higher per capita incomes than England and Holland prior to the Black Death, while the opposite was the case by 1800. In coming to grips with this reversal of fortune, it is worth noting that Italy, along with England and Holland, experienced a substantial increase of per capita incomes as populations declined precipitously with the onset of the Black Death, followed by further outbreaks of the plague in the next century, thereby reducing by half the population of many European countries. This is broadly consistent with the Malthusian idea of a negative relationship between the population level and per capita incomes owing to diminishing returns to labour in agriculture, holding land fixed. Those who were lucky enough to survive the recurrent plague outbreaks had more land and experienced higher living standards.

119
The BRICs: What does Economic History say about their Growth Prospects?
Spain, however, did not share in this post-Black Death rise in living standards. Álvarez-Nogal and Prados de la Escosura (2013) note that 14th-century Spain was a frontier economy with a high land-to-labour ratio, so that far from reducing demographic pressure on scarce land resources, the population decline following the Black Death destroyed commercial networks and isolated an already scarce population, thus reducing specialisation and the division of labour and ultimately leading to lower levels of per capita income. While Spanish per capita incomes failed to benefit from the post-Black Death increase experienced in much of the rest of Western Europe, Italian incomes fell back to pre-plague levels as population growth recovered after 1450. Meanwhile, there was a surge in per capita incomes in the North Sea Area, led initially by Holland during its Golden Age of prosperity between 1500 and 1650, and by Britain after that period.
This reversal of fortune between the North Sea Area and Mediterranean Europe thus seems to pivot around 1500 and is often associated with the dramatic changes in long-distance trade which occurred around that time, first with the opening up of new trade routes between Europe and Asia by sailing around the southern tip of Africa rather than moving goods overland across Asia along the Silk Road and by ship from the Middle East to Southern Europe, and subsequently the European encounter with the Americas. With these changes the Mediterranean became a backwater, and the focus of trade shifted to the Atlantic. Contrary to the findings of Hausman et al. (2005) based on the post-1950 period, the effects of these external shocks did not fizzle out after eight years.
Table 1: GDP per capita levels in Europe (1990 international dollars)
England/ Great Britain Holland/ The Netherlands Italy Spain
1270 759 957
1300 755 1482 957
1348 777 876 1376 1030
1400 1090 1245 1601 885
1450 1055 1432 1668 889
1500 1114 1483 1403 889
1570 1143 1783 1337 990
1600 1123 2372 1244 944
1650 1100 2171 1271 820
1700 1630 2403 1350 880
1563
1750 1710 2440 1403 910
1800 2080 2617 1244 962
1752
1820 2133 1953 1376 1087
1850 2887 2397 1350 1144
Notes: Figures are for 10-year averages starting in the stated year (i.e. 1270–79, 1300–09, etc) apart from 1348, which refers to the pre-Black Death years 1339–48. The data are for England 1270–1700 and for Great Britain 1700–1850, with the figure above the line in 1700 referring to England and the figure below the line to Great Britain. Similarly, the data are for Holland 1348 to 1800 and for the Netherlands 1800–50.Sources: England/Great Britain: Broadberry, Campbell, Klein, Overton and van Leeuwen (2011); Holland/Netherlands: van Zanden and van Leeuwen (2012); Italy: Malanima (2011); Spain: Álvarez-Nogal and Prados de la Escosura (2013).

120
Reversals of Fortune? A Long-term Perspective on Global Economic Prospects
Nonetheless, not all Atlantic economies benefited from these changes. Indeed, the prime movers in the voyages of discovery, Portugal and Spain, which both had Atlantic as well as Mediterranean coasts, lost out to Britain and Holland. Institutional differences probably play a role in explaining the ability of different economies to take advantage of the new opportunities opened up by the voyages of discovery. Acemoglu et al. (2005) emphasise the interaction between access to the Atlantic and constraints on executive power. In the countries which gained most (Britain and Holland), there were sufficient constraints on the rulers to ensure that they were unable to appropriate the bulk of the gains from trade. By contrast, in Atlantic economies such as Spain and Portugal, which failed most obviously to gain from the new opportunities – despite their early role in the discovery of the new trade routes – rulers were sufficiently strong to exploit the opportunities themselves and prevent a strong merchant class from constraining their powers to appropriate.
It is noteworthy that the fundamental underlying change behind this reversal of fortunes, the opening up of new trade routes, was instigated by the Spanish and Portuguese, who lost out to the Dutch and British. In current times, one could expect the information and communications technology (ICT) revolution to play a similarly influential role in altering economic opportunities, which could lead to comparable reversals of fortune. Again, the incumbent leader, the United States, has played a pioneering role, but will need to continue to innovate and remain institutionally flexible if it is to avoid the relative decline experienced by Spain and Portugal in the early modern period.
Box 1: The AIDS crisis and the Black Death
The Black Death first struck Europe in 1348–49 and quickly wiped out around one-third of the continent’s population. As outbreaks of the plague continued to strike, the population continued to fall, so that by the mid-15th century it was less than half of its medieval peak in parts of Europe. In England, for example, recent estimates by Broadberry et al. (2011) suggest a peak population of 4.81 million in 1348, falling to 2.6 million by 1351 and just 1.9 million by 1450. In most parts of Europe, real wages increased sharply across the Black Death areas (Pamuk, 2007). Furthermore, recent research summarised in Table 1 suggests there was also a positive effect on GDP per capita, with the notable exception of Spain, which remained a frontier economy until the Reconquest was completed in 1492 (Álvarez-Nogal and Prados de la Escosura, 2013). In most of Europe, those who were fortunate to survive were left with more land and capital, while the labour shortage bid up the price of labour.
Although the HIV/AIDS crisis which emerged in the late 20th century, affecting Africa most of all, has had a much smaller impact on population levels, its effects can be analysed in much the same way. In contrast to medieval Europe, where the population level fell catastrophically, the population has continued to grow in Africa since the 1980s, but at a slower rate. Whiteside (2001) reviews the literature on the economic impact of HIV/AIDS, noting a number of potentially negative economic impacts from the epidemic, from lower levels of growth to changing consumption patterns and the diversion of government spending to anti-retroviral therapy. Nevertheless, in a study of South Africa, Young (2005) points out that infection rates among pregnant women in Africa rose quickly from approximately zero in 1990 to over 20% by the late 1990s, before stabilising at around 25%. Young argues that despite the tragic consequences for the infected, the net effect on future per capita consumption is positive, as in 14th- and 15th-century Europe. He emphasises two positive effects which act to lower fertility, both directly, through deterring unprotected sexual activity, and indirectly, through increasing the scarcity and value of female time. Even taking into account the negative effect of orphaned children through reduced human capital formation, Young argues that the net impact remains positive. However, Haacker (2011) argues that the majority of empirical studies on the impact of HIV/AIDS have found the adverse effects to outweigh the positives, leaving a small negative impact on GDP per capita.

121
The BRICs: What does Economic History say about their Growth Prospects?
However, it is worth pointing out the dangers of embracing very simple explanations of complex phenomena such as the changing relative prosperity of nations, particularly when they rely more heavily on theoretical argument than detailed observation of the historical record. There are good reasons to argue that the emphasis on government and political turning points such as the Glorious Revolution is overdrawn in the approach of Acemoglu et al. (2005). An alternative approach focuses on the effects of factor endowments and factor prices on technology, the composition of economic activity and links to demography and human capital (Allen, 2009; Broadberry and Gupta, 2009; Broadberry et al., 2011). Indeed, the reversals of fortune between Britain and Holland are excellent examples to illustrate this very theme.
3.2 Great Britain and HollandBroadberry et al. (2012) probe more deeply into the reversals of fortune between Britain and Holland. In establishing the chronology of the Dutch forging ahead and the British catching up and then overtaking, care is needed in specifying the territorial areas under consideration. In Figure 1, results are presented for England covering the period 1270-1700, Great Britain for 1700-1850, Holland for 1348-1807, and the Netherlands for 1807-1870. Drawing upon new historical national accounts for these territories, it is clear that Holland forged ahead of Britain between 1500 and 1650, enjoying a Golden Age of prosperity and developing a comparative advantage in services as the share of the labour force in agriculture shrank to precociously low levels. Britain then grew faster than Holland during the second half of the 17th century and continued to catch up during the 18th century, although per capita incomes remained higher in Holland until the early 19th century. By this time Britain also had an unusually small share of the labour force in agriculture and a large services sector, but it developed a comparative advantage in industry as it became the “workshop
Figure 1: British and Dutch real GDP per capita in 1990 international dollars
400
800
1,600
3,200
1270 1370 1470
Years
1570 1670 1770 1870
GB England HollandNL
Sources: Broadberry et al. (2011); van Zanden and van Leeuwen (2012).

122
Reversals of Fortune? A Long-term Perspective on Global Economic Prospects
of the world”. These developments took place against the backdrop of the reversal of fortunes between the North Sea Area and Mediterranean Europe examined above.
Allen (2009) emphasises the importance of Britain’s unique factor price combination of high wages and cheap coal, which he sees as both creating incentives for inventing labour-saving technology and explaining why such technology was not adopted immediately in other countries. Britain emerged as a high-wage economy in two stages, charted in Table 2. In the first phase, real wages increased with the population decline arising from the Black Death. In the second phase after 1500, success in international trade offset tendencies to diminishing returns in agriculture through gains from specialisation. Also worth noting is that a relatively high age at marriage, which can be shown to have existed already in Britain during the 16th century (Wrigley and Schofield, 1989), limited fertility and encouraged human capital formation.
England also had an agricultural sector which was heavily oriented towards pastoral farming, and this had a number of important implications for future growth. First, this was a high value-added agriculture, even if it did not produce many more kilocalories per head than arable agriculture. Second, this was a highly capital-intensive agriculture, with animals making up a large share of the capital stock. Third, this was an agriculture which was highly intensive in the use of non-human energy. Fourth, pastoral agriculture provided enhanced employment opportunities for females, particularly in the parts associated with dairying, thus underpinning a relatively high age of marriage for women, which reduced fertility rates and encouraged human capital formation (de Moor and van Zanden, 2010; Voigtländer and Voth, 2010).
Like Britain, Holland was a high-wage economy and potentially had access to cheap coal from the Ruhr. So why did Holland not have the first Industrial
Table 2: Daily real consumption wages of European unskilled building labourers (London 1500-49 = 100)
1300-49 1350-99 1400-49 1450-99 1500-49 1550-99 1600-49 1650-99 1700-49 1750-99 1800-49
Northwestern Europe
London 57 75 107 113 100 85 80 96 110 99 98
Amsterdam 97 74 92 98 107 98 79
Antwerp 101 109 98 88 93 88 92 88 82
Paris 62 60 59 60 56 51 65
Southern Europe
Valencia 108 103 79 63 62 53 51 41 –
Madrid – 56 51 – 58 42 –
Florence/Milan 44 87 107 77 62 53 57 51 47 35 26
Naples 73 54 69 – 88 50 33
Central & Eastern Europe
Gdansk 78 50 69 72 73 61 40
Warsaw – 75 66 72 45 64 82
Krakow 92 73 67 74 65 67 58 63 40
Vienna 115 101 88 60 61 63 61 50 27
Leipzig – 34 35 57 53 44 53
Augsburg 62 50 39 63 55 50 –
Source: Broadberry and Gupta (2006: 7), derived from the database underlying Allen (2001: 429).

123
The BRICs: What does Economic History say about their Growth Prospects?
Revolution? Allen (2009: 104) argues that Holland also had cheap peat, which delayed the development of the Ruhr coalfield, but Broadberry and Gupta (2009) emphasise the role of the British patent system in creating incentives to invent. The point being that a patent is more valuable in a large economy such as Britain than in a small economy such as Holland.
This comparison of Britain and Holland illustrates two important points. First, the two economies had much in common. They were both North Sea Area economies, which benefited from the opening of the new trade routes after 1500. The Acemoglu et al. (2005) analysis emphasises institutions in the form of constraints on the executive, but the argument of this section places more emphasis on the nature of agriculture in this region and the implications for demography and human capital. At this stage, more research would be required to arrive at a weighting of the various factors in the North Sea Area’s success in forging ahead. Second, within the North Sea Area, a reversal of fortunes occurred between Britain and Holland. Dutch economic leadership during its Golden Age gave way to British supremacy during the Industrial Revolution. It would be difficult to construct an argument for this merely on the basis of constraints on the executive. Indeed, a full explanation must involve delving deeper into the structures of the two economies and the incentives to innovate in particular sectors.
3.3 Europe and AsiaProbably the most important reversal of fortunes in history, affecting the largest number of people, concerns that between Europe and Asia. However, it must be emphasised that there is still great uncertainty over the extent to which the world economy before 1500 was dominated by Asia simply because of the size of its population, or whether Asia also had higher per capita incomes. Maddison (2001) has provided some rough estimates of population levels in the major regions of the world in a number of benchmark years between 1 AD and 1998, from which the regional shares in Table 3 are derived. He was interested in the disparity of performance between what he called Group A (largely Western countries, but also including Japan) and Group B (the rest of the world). Asia clearly had a much larger population than Western Europe and the Western
Table 3: Percentages of world population by major regions, from 1 AD to 1998
1 1000 1820 1998
Western Europe 10.7 9.5 12.7 6.6
Western Offshoots 0.5 0.7 1.1 5.5
Japan 1.3 2.8 3.0 2.1
Total Group A 12.5 13.0 16.8 14.2
Latin America 2.4 4.2 2.0 8.6
Eastern Europe & USSR 3.8 5.1 8.8 7.0
Asia (excl. Japan) 74.2 65.4 65.3 57.4
Africa 7.1 12.3 7.1 12.8
Total Group B 87.5 87.0 83.2 85.8
World 100.0 100.0 100.0 100.0
Source: Derived from Maddison (2001: 28).

124
Reversals of Fortune? A Long-term Perspective on Global Economic Prospects
Offshoots (the United States, Canada, Australia and New Zealand) throughout that period, although the scale of the dominance declined marginally over time.
In Table 4, Maddison’s (2001) “guesstimates” of per capita GDP in 1000 put Asia slightly ahead of Western Europe, but by 1820 per capita income in Western Europe and the Western Offshoots was approximately twice the level of Asia, and by 1998 the ratio had increased to seven-to-one. Recent research (discussed below) suggests that the figures for the years 1 AD and 1000, which were based largely on assumptions rather than measurement, are too low for many countries, but combining them with the population estimates underpinning Table 3 provides the regional GDP shares set out in Table 5. Whereas in 1000 Asia still produced over two-thirds of world GDP and Western Europe less than 9%, by 1820 Western Europe’s share had risen to nearly 24%, and Asia’s share had fallen to just over 56%. Things changed even more rapidly after 1820, so that by 1998 Asia’s share had fallen to about 27%, while the combined shares of Western Europe and the Western Offshoots had risen to nearly 46%.
Table 4: GDP per capita levels: World and major regions, from 1 AD to 1998 (1990 international dollars)
1 1000 1820 1998
Western Europe 450 400 1,232 17,921
Western Offshoots 400 400 1,201 26,146
Japan 400 425 669 20,413
Average Group A 443 405 1,130 21,470
Latin America 400 400 665 5,795
E. Europe & USSR 400 400 667 4,354
Asia (excl. Japan) 450 450 575 2,936
Africa 425 416 418 1,386
Average Group B 444 440 573 3,102
World 444 435 667 5,709
Source: Maddison (2001: 28).
Table 5: Percentages of world GDP by major regions, 1 AD to 1998
1 1000 1820 1998
Western Europe 10.8 8.7 23.6 20.6
Western Offshoots 0.5 0.7 1.9 25.1
Japan 1.2 2.7 3.0 7.7
Total Group A 12.5 12.1 28.5 53.4
Latin America 2.2 4.0 2.0 8.7
E. Europe & USSR 3.4 4.6 8.8 5.3
Asia (excl Japan) 75.1 67.6 56.2 26.9
Africa 6.8 11.7 4.5 5.7
Total Group B 87.5 87.9 71.5 46.6
World 100.0 100.0 100.0 100.0
Source: Derived from Maddison (2001: 28).

125
The BRICs: What does Economic History say about their Growth Prospects?
Maddison’s (2001) figures suggest that although higher per capita incomes did contribute slightly to Asia’s dominance of world GDP in 1000, the most important factor was Asia’s much larger population. By contrast, the growing shares of Western Europe and the Western Offshoots in world GDP arose largely from their emerging lead in per capita income. To the extent that Asia will regain its dominance of world GDP in the 21st century, much of it will clearly be thanks to its large share of the world population. However, even with continued very rapid growth of per capita incomes, overtaking Western Europe and the Western Offshoots in terms of per capita GDP levels clearly is not for tomorrow.
The above calculations are based on the conjectures of Maddison (2001), but recent research has cast doubt on his assumption of very low levels of per capita income in Western Europe before 1820, which imply rather more rapid growth rates than is consistent with the abundant evidence on output in this region. Comparing Maddison’s (2010) last estimates for 1500 in Table 6 with those in Table 1, we see that his numbers are between one-half and two-thirds of the levels estimated by later researchers.
If the new estimates of per capita incomes in medieval Europe in Table 1 are correct, they call into question the perception that average per capita incomes were higher in Asia than in Europe in the first half of the second millennium, unless there are also upward revisions of Asian per capita GDP before 1820. The current picture suggested by recent research for Asian per capita incomes is set out in Table 7. Although there is some upward revision for the pre-1820 period compared with Maddison’s estimates in Table 6, it is generally on a more modest scale. Japan had very low levels of per capita GDP at the beginning of the second millennium, but then experienced very modest but steady growth at 0.06% per year through to the mid-19th century. Japan’s more dynamic economic expansion following the Meiji Restoration of 1868, which will be examined in greater detail below, was thus built on this earlier period of progress. By contrast, Indian per capita GDP declined from the Mughal peak under Akbar, circa 1600. Note, however, that even in 1600 GDP per capita in India was still lower than in either England or Italy.
Perhaps the most interesting Asian case is China, which has featured so heavily in the Great Divergence debate following the revisionist views of Pomeranz (2000). The figures of Broadberry, Guan and Li (2012) suggest that China was richer than England in 1086. However, they also imply that China was poorer than Italy by 1300. During the Ming (1368-1644) and Qing (1622-1911) dynasties, Chinese GDP per capita declined, so that by the 17th century, despite still being the richest Asian country, China had already fallen substantially behind
Table 6: Maddison’s estimates of GDP per capita in key West European and Asian countries, 1000-1870 (1990 international dollars)
UK NL Italy Spain Japan India China
1000 400 425 450 450 425 450 466
1500 714 761 1,100 661 500 550 600
1600 974 1,381 1,100 853 520 550 600
1700 1,250 2,130 1,100 853 570 550 600
1820 1,706 1,838 1,117 1,008 669 533 600
1870 3,190 2,757 1,499 1,207 737 533 530
Source: Maddison (2010).

126
Reversals of Fortune? A Long-term Perspective on Global Economic Prospects
the leading West European economies in the North Sea Area. A number of factors played a role in China’s stagnation and relative decline at this time. First, Ma (2012) emphasises China’s centralised absolutism, which he sees as creating a paradox of a strong state and weak governance. China was unified earlier and over a larger territory than any other civilisation, but was characterised by decentralised governance with local predation. There was no public borrowing as a result of absolutism and the absence of credible commitment, and with absolutism plus a single monopoly of power, bankers had nowhere to run or hide. These factors help to explain the missing financial and fiscal revolutions. In international comparative terms, per capita tax revenue remained extremely low. Second, China’s 15th-century turn inwards cannot have helped, coming at just the time when West European states were encouraging the voyages of discovery that would transform the global economy. Third, the small pastoral sector and the relatively early age of marriage in China provided an underlying economic structure that contrasted sharply with that of the North Sea Area.
It therefore seems likely that Western Europe was already achieving substantially higher levels of per capita income than Asia long before the Great Divergence of the 19th century. This may initially seem surprising, given the relatively high rates of urbanisation and the sophistication of urban culture in Asian economies such as China, India and Japan. However, it must be remembered that GDP per capita in these periods was dominated by agriculture and that Asian agricultural systems were much less animal-oriented than in Europe, thus creating less value
Table 7: GDP per capita levels in Europe and Asia (1990 international dollars)
England/Great Britain Italy Japan India China
730 480
900 520
980 1,328
1086 754 1,244
1120 962
1150 600
1280 679 646
1300 755 1,376
1400 1,090 1,601 948
1450 1,055 1,668 688 946
1500 1,114 1,403 909
1570 1,143 1,337 898
1600 1,123 1,244 787 682 852
1650 1,110 1,271 834 638
1700 1,563 1,350 897 622 843
1750 1,710 1,403 814 573 737
1800 2,080 1,244 874 569 639
1850 2,997 1,350 933 556 600
Notes: Where possible, figures are for 10-year averages starting in the stated year (i.e. 1280-89, 1300-09 etc), but data for Japan and India are only available for benchmark years.Sources: England/Great Britain: Broadberry et al. (2011) and Broadberry and van Leeuwen (2011); Italy: Malanima (2011); Japan: Bassino et al. (2012); India: Broadberry and Gupta (2012); China: Broadberry, Guan and Li (2012).

127
The BRICs: What does Economic History say about their Growth Prospects?
added. Nonetheless, it is worth noting that Europe’s mixed agriculture with a large pastoral sector did not create a lot of kilocalories, so that Europeans at this time would not have been thought of by visitors from abroad to be enjoying a particularly high standard of living.
However, the North Sea Area pulled ahead of Mediterranean Europe in the Little Divergence and forged further ahead of Asia in the Great Divergence as high-value-added, capital-intensive, non-human, energy-intensive techniques spread from agriculture to industry and services, and as the European marriage pattern encouraged human capital formation as well as restricted fertility.
An important implication of this assessment of the long-run historical record is that although shifts in the relative rankings of countries have been common, changes in economic leadership have been rare. Asia remains a long way behind Europe, so there is no prospect of yet another reversal of fortunes in the near future. Furthermore, as we shall see in Section 5, many instances of catching up have stalled long before they have reached anywhere near the frontier, and it is likely that similar disappointing outcomes will be experienced by at least some Asian Tigers that are currently growing rapidly, a theme to which will we return in Section 4.
3.4 The United States and Great BritainThe point at which Britain was overtaken by the United States in the late 19th century has often been thought to be the phase of the second industrial revolution, or the emergence of science-based industry and mass-production technology in the United States and entrepreneurial failure in British industry. However, the sectoral patterns of comparative labour productivity set out in Table 8 suggest a more complex story. At the national economy level, it becomes clear that by 1870 aggregate labour productivity in the United States was about 90% of the UK level, and that it not only overtook Great Britain as the aggregate labour productivity leader around the turn of the century, but continued to forge ahead through to the 1950s. Since then, there has been a slow process of catching up by the United Kingdom, but by 2007 there was still a substantial aggregate Anglo-American labour productivity gap of more than 25%.
Table 8: Comparative US and UK labour productivity levels by sector, 1869-71 to 2007 (UK=100)
Agriculture Industry Services Aggregate economy
1869-71 86.9 153.6 85.9 89.8
1889-91 102.1 164.1 84.2 94.1
1909-11 103.2 193.2 107.4 117.7
1919-20 128.0 198.0 118.9 133.3
1929 109.7 222.7 121.2 139.4
1937 103.3 190.6 120.0 132.6
1950 126.0 243.5 140.8 166.9
1973 131.2 214.8 137.4 152.3
1990 151.1 163.0 129.6 133.0
2007 196.4 166.2 125.1 127.7
Notes: Benchmark estimates of comparative productivity levels for 1937 are projected to other years using time series for output and employment from historical national accounting sources. Sources: Derived from Broadberry (1998; 2006), updated using the EUKLEMS database (O’Mahony and Timmer, 2009).

128
Reversals of Fortune? A Long-term Perspective on Global Economic Prospects
The sectoral patterns of comparative productivity performance are quite varied. In Table 8 the nine-sector analysis provided in an earlier study by Broadberry (1998) has been simplified to a three-sector basis, distinguishing between agriculture, industry and services. Industry includes mineral extraction, manufacturing, construction and the utilities, while services includes transport and communications, distribution, finance, professional and personal services and government. The first key finding to note is that labour productivity in industry was already substantially higher in the United States than in Britain by the late 19th century. Second, although the United States’ productivity lead in industry increased before World War I, this was due largely to what was happening in non-manufacturing industries, particularly in mining and the utilities. Third, the United States caught up with and then overtook Britain in terms of aggregate labour productivity largely by shifting resources out of agriculture and improving its comparative productivity performance in services.
In an earlier study, Broadberry (1993) established that comparative labour productivity in manufacturing in Britain and the United States has remained stationary since the late 19th century, and Table 8 shows that this extends to industry as a whole. By contrast, the aggregate labour productivity ratio moves broadly in line with the labour productivity ratio for services. Although the United States has continued to improve its labour productivity performance relative to Britain in agriculture, there has also been a dramatic decline in the importance of agriculture, as highlighted in Table 9. Whereas in 1870 agriculture accounted for about half of all US employment, by 2007 this had fallen to less than 2%. The shift out of agriculture nevertheless has had an important impact on the comparative productivity performance of these countries at the aggregate level. This is because by the late 19th century Britain already had a much smaller share of its labour force in agriculture, which had a substantially lower value added per employee than in industry or services. Hence the large share of resources tied up in agriculture in the United States exercised a significant negative influence on its aggregate productivity performance relative to Britain in the late 19th and early 20th centuries, and as the importance of agriculture declined, this adverse effect waned.
One other aspect of the United States’ rise to economic leadership that deserves attention is the role of human capital. The United States already had high levels of primary education during the 19th century, as noted by Easterlin (1981). However, it was its move to universal secondary education with the high school movement of the first half of the 20th century and the shift towards universal tertiary education in the aftermath of World War II that really marks out the distinctive role in human capital accumulation (Goldin 1998; 2001). Although this undoubtedly contributed to the country’s industrial success, it was in the services sector that the general skills taught in schools and colleges were most valuable (Broadberry and Ghosal, 2002). The United States’ success in services, which underpinned its rise to per capita income leadership, was in turn bolstered by heavy investment in human capital.
Many experts expect China’s economy to overtake the United States in the near future, but it is important to keep clear the distinction between overtaking in terms of GDP and per capita GDP. The central message of this section is that instances when a country has overtaken the frontrunner in terms of per capita GDP actually has historically been quite rare. Although China’s GDP is large because of an enormous population, its per capita GDP is still a long way behind that of the United States. Furthermore, as the following section cautions, there are many more cases in history of countries embarking on the catching-up path

129
The BRICs: What does Economic History say about their Growth Prospects?
whose economic expansion stalls well before reaching the frontier. Indeed, there are good reasons to think that China and the other BRIC countries are more likely to meet this fate than to succeed in overtaking the United States.
4. Failed attempts to catch up
Well-known cases of overtaking the leading country may serve to lend an air of inevitability to the successful rise of the BRICs to global economic leadership. However, these examples are the subject of selection bias, and it is instructive also to consider the numerous instances of countries whose future looked promising when they began to catch up, but then their performance underwhelmed. A number of such examples from the 20th century provide a reminder that the success of the BRICs is far from guaranteed: (1) Argentina and a few other Latin American countries seemed to be on a very positive economic path between the 1870s and the 1920s; (2) Russia appeared to be on a promising economic trajectory from the Bolshevik Revolution through to the Khrushchev era, but then imploded; (3) Western Europe was widely expected to overtake the United States at the height of the post-World War II Golden Age, but the process first stalled and then reversed in the 1990s; (4) Japan’s rapid post-World War II growth, together with technological leadership in several key industries, led many to speculate that Japan would overtake the United States, but that promise was never fulfilled
Table 9: Sectoral share of employment in the United States and the United Kingdom, 1870-2007 (%)
A. United States
Agriculture Industry Services
1870 50.0 24.8 25.2
1910 32.0 31.8 36.2
1920 26.2 33.2 40.6
1930 20.9 30.2 48.9
1940 17.9 31.6 50.5
1950 11.0 32.9 56.1
1973 3.7 28.9 67.4
1990 2.5 21.8 75.7
2007 1.5 16.6 81.9
B. United Kingdom
Agriculture Industry Services
1871 22.2 42.4 35.4
1911 11.8 44.1 44.1
1924 8.6 46.5 44.9
1930 7.6 43.7 48.7
1937 6.2 44.5 49.3
1950 5.1 46.5 48.4
1973 2.9 41.8 55.3
1990 2.0 28.5 69.5
2007 1.4 18.3 80.3
Sources: Derived from Broadberry (1998; 2006), updated using the EUKLEMS database (O’Mahony and Timmer, 2009).

130
Reversals of Fortune? A Long-term Perspective on Global Economic Prospects
4.1 The rise and decline of ArgentinaArgentina was a spectacular success story in the late 19th century through to the late 1920s and was rapidly catching up with the developed countries of Europe and the United States. The data in Table 10 suggest that on the eve of World War I Argentina enjoyed a per capita income that had risen to more than 70% of that in the United States. This put pre-World War I Argentina on a par with European countries such as France and Germany and made it nearly three times richer than Japan.
Argentina’s success rested on exporting primary products to Europe and the United States during the period of global economic integration between 1870 and 1914. Falling transport costs and refrigeration allowed Argentina to export meat and other primary products in return for manufactured imports. The process was facilitated by relatively free factor flows, with Argentina attracting both immigrants to bolster the labour force and capital inflows to finance the necessary investments (della Paolera and Taylor, 2003). Argentina enjoyed the confidence of international investors as a result of orthodox fiscal and monetary polices, with limited budget deficits and an adherence to the gold standard (Ford, 1962).
The outbreak of World War I undermined the global integration that had underpinned Argentina’s period of prosperity. But more damaging still was the collapse in commodity prices after the crash of 1929, which created a serious balance-of-payments problem for a country that was so dependent on commodity exports. This was a classic external shock of the type identified by Eichengreen et al. (2011) in the post-1950 period. Along with other large Latin American countries, Argentina pursued aggressive devaluation policies, with multiple exchange-rate systems to discourage imports by distorting relative prices. In these circumstances, exchange controls were needed to maintain external equilibrium, and there were also deviations from orthodox fiscal policy as public works programmes were adopted, although these were limited in scope because of the restricted tax base.
The recovery policies of the 1930s in Argentina and other large Latin American countries were based on import-substituting industrialisation (ISI), aided by price distortions induced by devaluations, tariffs and quantitative restrictions – in strong contrast to the primary-product exporting strategy of the pre-1929 period. During the 1940s and 1950s the policies that had emerged in response to the economic crisis persisted and, initially, they appeared to enjoy some success in a world economy that was still characterised by general de-globalisation.
However, after World War II, while Latin America’s share of world exports declined sharply, East Asia’s share increased. Latin America lost out particularly
Table 10: GDP per capita, 1870-2005 (1990 international dollars)
US Argentina Brazil Japan Russia China India
1870 2,445 1,311 713 737 530 533
1913 5,301 3,797 811 1,387 552 673
1929 6,899 4,367 1,137 2,026 1,386 562 728
1950 9,561 4,987 1,672 1,921 2,841 448 619
1973 16,689 7,962 3,880 11,434 6,582 838 853
1990 23,201 6,433 4,920 18,789 7,779 1,871 1,309
2008 31,178 10,995 6,429 22,816 9,111 6,725 2,975
Source: Maddison (2010).

131
The BRICs: What does Economic History say about their Growth Prospects?
to the four Newly Industrialising Countries (NIC4) of South Korea, Taiwan, Hong Kong and Singapore. Taylor (1998) attributes this failure to the distortionary impact of ISI policies in a re-globalising world, but Table 11 shows that the scale of distortions in Latin America was not massively greater than that in the NIC4 during the 1960s. For example, the black market premium on exchange rates was 12% compared with 10%, and capital goods prices were raised by 25% in both regions.
By the 1970s and 1980s, however, the scale of the distortions was much greater in Latin America than in the NIC4. For example, the price of capital goods was now 27% higher in Latin America, compared with 14% in the NIC4. Taylor uses structural econometric modelling to demonstrate the link from distortions to investment and hence to growth, and concludes that the inferior Latin American performance was largely attributable to policy failure. Persistence with ISI as the world economy re-globalised was therefore very costly in the long run, even if it had enjoyed some short-run success in the de-globalised world of the 1930s and 1940s.
Taylor (1998) argues that the early stages of reform were only really visible from the mid-1980s onwards. This raises the question of why ISI policies were pursued for so long despite the region’s poor performance and the growing success of the export-oriented Asian economies. Here, Taylor adopts the framework of North (1990), based on the persistence of institutions. Latin American politics enfranchised interest groups lobbying for protection in a way that did not occur in the NIC4, and it was only with the debt and hyperinflation of the 1980s that governments were no longer able to ignore the costs of inward-looking policies and were forced to introduce appropriate institutional changes.
4.2 Russia and the Soviet experimentRussia is generally considered to have begun a process of catching up with the West in the late 19th century following a series of economic reforms, including the emancipation of the serfs in 1861 and government encouragement to industrialise behind tariff barriers (Gerschenkron, 1962; Falkus, 1972; Gregory, 1982). To some extent, the Russian agricultural growth of the pre-World War I period was part of the same phenomenon as the Argentine development noted earlier, with Russia playing an equally important role as the New World producers in the “grain invasion” of West European markets (Federico, 2005). However, Russian performance at this time was not exceptional, and it was only following the Bolshevik revolution of 1917 and the establishment of the Soviet regime that the country really began to catch up. Table 10 shows that in 1929, just after the implementation of the first Five-Year Plan in 1928, per capita income in Russia was at a similar level to Argentina’s in 1870.
Table 11: Distortions in Latin America and Asia-Pacific (annual averages)
Black market Tariff Price of capital Depreciation
1960-70:
Latin America 0.12 n.a. 0.25 0.07
NIC4 0.10 n.a. 0.25 0.04
1970-90:
Latin America 0.26 0.22 0.27 0.37
NIC4 0.03 0.06 0.14 0.00
Source: Taylor (1998: 7-8).

132
Reversals of Fortune? A Long-term Perspective on Global Economic Prospects
Allen (2003) argues for a more favourable assessment of the period from 1928 to 1940 than is usual in the literature on Soviet economic performance, which tends to focus on the human costs of collectivisation and political repression (Davies et al., 1994). In the framework of Hausman et al. (2005), this was a period of growth acceleration ushered in by a combination of political regime change and economic reform. However, Allen argues that the increase in consumption was as remarkable as anything achieved in other celebrated late modernising countries, including Japan, South Korea and Taiwan. Although urban real wages stagnated, he argues that many Russians experienced rising consumption as they moved from the countryside to the city, while some urban residents benefited from shifting to higher-wage occupations. Furthermore, as well as a rapid transfer of resources from agriculture to industry, Russian industrialisation was accompanied by a demographic transition as education was extended to women.
However, as Allen (2003) acknowledges, the period of rapid Soviet growth was followed by an economic slowdown after World War II, and after several decades the system eventually collapsed. Some economists in the West were slow to grasp this. For example, the Nobel Prize winner Paul Samuelson wrote in the 1967 edition of his textbook Economics that the Soviet Union would overtake the US in terms of real GNP between 1977 and 1995. Each subsequent edition moved the date further into the future, and the comparison was dropped altogether in 1985.
The primary reasons for the economic failure of the Soviet system continue to be widely debated, with Weitzman (1970) disputing the mainstream view of Bergson (1973; 1983) that there was a slowdown in TFP growth as technology stagnated. However, one must look beyond growth accounting to arrive at a full explanation. The relationship between institutional regime and productivity performance appears to have been historically contingent. Central planning allowed Soviet industry to improve temporarily its comparative productivity position during the era of mass production. However, central planning was unable to cope with the requirements of flexible production technology during the 1980s, and the ensuing crisis contributed to the end of Soviet rule across Eastern Europe (Broadberry and Klein, 2011).
This ties into a wider theme in the literature on socialist economies, concerning the difficulties of introducing economic reforms in a centralised system. As failings in the centralised system of socialist economic planning became apparent, officially sanctioned reforms were introduced in the Soviet Union and other East European economies. Authority was decentralised to managers and workers, and “sideline” activities were tolerated. This had an intended positive effect in making it easier to obtain vital supplies and fulfil plans, but it also had the unintended negative consequence of undermining discipline and facilitating corruption, which eventually allowed insider interests to “steal the state” (Solnick, 1998; Harrison, 2012). A return to this theme will be required when considering the prospects for China, the one socialist economy that has managed to sustain a series of reforms over a long period of time.
4.3 Western Europe and the United StatesWestern Europe enjoyed a period of rapid growth between 1950 and 1973 that brought GDP per capita in the largest economies to nearly three-quarters of the US level, as can be seen in Table 12. Catching up by West European countries after World War II was by no means guaranteed, as the experience in the aftermath of World War I demonstrates. Eichengreen (1996) argues for a combination of more cooperative domestic as well as international economic

133
The BRICs: What does Economic History say about their Growth Prospects?
institutions, highlighting in particular a post-war settlement between unions, employers and governments which fostered wage restraint, high investment and full employment. Following the oil crisis of 1973, the catching-up process stalled in terms of GDP per capita, and in some West European economies it even went into reverse. Table 12, however, highlights the fact that the catching-up process continued in terms of GDP per hour worked between 1973 and 1995, until the productivity gap was completely eliminated. This period can therefore be interpreted as an era when Europeans opted for more leisure than Americans. In the subsequent decade, however, the US grew faster than the major West European economies in terms of both GDP per hour worked and GDP per capita.
Crafts and Toniolo (2010) identify regulation as the primary reason why European countries fell behind from the mid-1990s onwards. Table 13 compares labour productivity growth in the EU and the United States before and after
Table 12: GDP per capita and per hour worked in Western Europe, 1950-2005
A. GDP per capita as % of the US level
France Germany Italy UK
1950 55.1 44.8 36.6 72.6
1973 78.6 78.8 63.7 72.1
2005 72.9 67.4 63.1 73.5
B. GDP per hour worked as % of the US level
France Germany Italy UK
1973 73.9 75.4 75.9 66.0
1995 104.9 108.3 99.4 86.6
2005 100.1 82.0 82.2 84.1
Source: Derived from Crafts and Toniolo (2010).
Table 13: Contributions to labour productivity growth in the market economy (% p.a.)
1980-95 1995-2000 2000-05
EU
Labour productivity 2.6 1.8 1.2
ICT capital deepening 0.4 0.7 0.4
TFP in ICT production 0.2 0.4 0.2
Other capital deepening 0.8 0.4 0.3
Other TFP 0.9 0.1 0.0
Human capital deepening 0.3 0.2 0.3
US
Labour productivity 1.9 3.0 2.9
ICT capital deepening 0.7 1.4 0.6
TFP in ICT production 0.3 0.6 0.6
Other capital deepening 0.3 0.3 0.2
Other TFP 0.4 0.5 1.0
Human capital deepening 0.2 0.3 0.4
Source: Crafts and Toniolo (2010: 325).
134
Reversals of Fortune? A Long-term Perspective on Global Economic Prospects
1995. Before then, the EU grew faster than the United States, but after 1995 this trend was reversed. Also, as of the mid-1990s the Solow paradox (“you see the computers everywhere except in the productivity statistics”) disappeared. The arrival of ICT made a much stronger contribution to productivity growth in the United States than in the EU, both through capital deepening (the use of ICT across the whole economy) and through production (Silicon Valley). Crafts and Toniolo argue that the diffusion of ICT has been held back in Europe by regulation. Furthermore, they emphasise that although Europe has always been more heavily regulated than the United States, the adverse effects of regulation on productivity performance have only become apparent in the changed context of the new technological opportunities generated by ICT. This illustrates the general point that institutions which are well suited to a particular era can sometimes serve to hinder development in a subsequent period, a theme which is developed later in more detail.
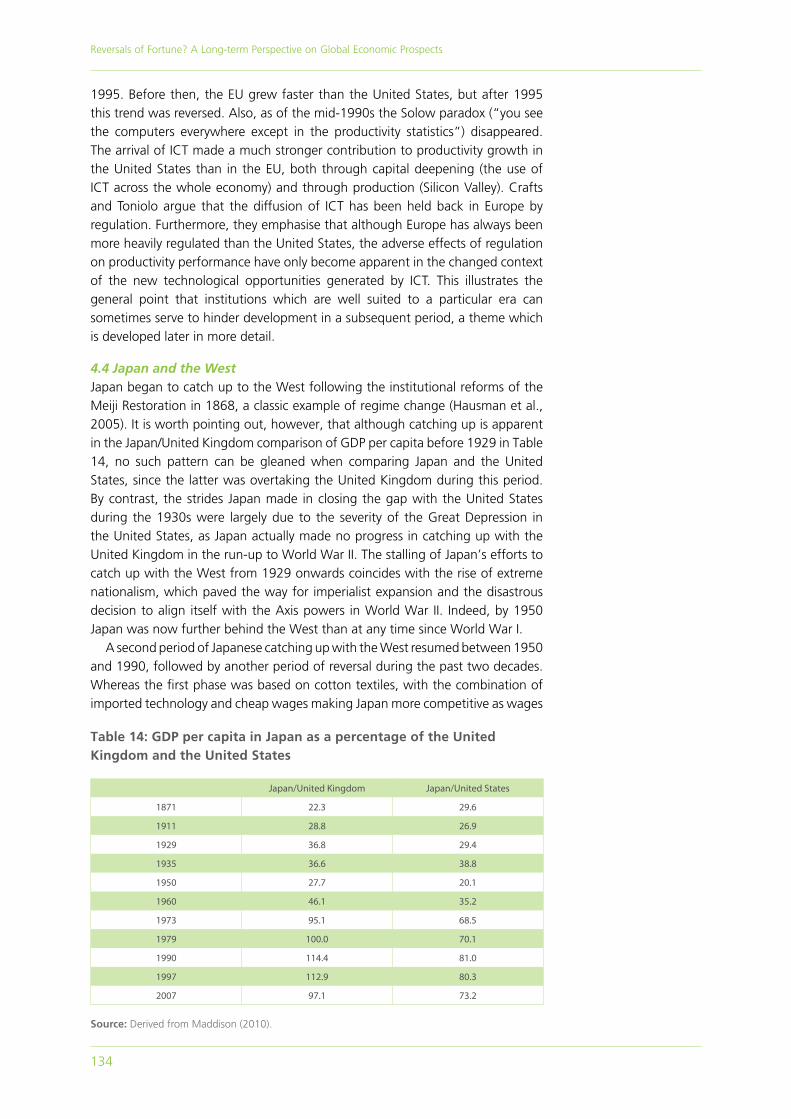
4.4 Japan and the WestJapan began to catch up to the West following the institutional reforms of the Meiji Restoration in 1868, a classic example of regime change (Hausman et al., 2005). It is worth pointing out, however, that although catching up is apparent in the Japan/United Kingdom comparison of GDP per capita before 1929 in Table 14, no such pattern can be gleaned when comparing Japan and the United States, since the latter was overtaking the United Kingdom during this period. By contrast, the strides Japan made in closing the gap with the United States during the 1930s were largely due to the severity of the Great Depression in the United States, as Japan actually made no progress in catching up with the United Kingdom in the run-up to World War II. The stalling of Japan’s efforts to catch up with the West from 1929 onwards coincides with the rise of extreme nationalism, which paved the way for imperialist expansion and the disastrous decision to align itself with the Axis powers in World War II. Indeed, by 1950 Japan was now further behind the West than at any time since World War I.
A second period of Japanese catching up with the West resumed between 1950 and 1990, followed by another period of reversal during the past two decades. Whereas the first phase was based on cotton textiles, with the combination of imported technology and cheap wages making Japan more competitive as wages
Table 14: GDP per capita in Japan as a percentage of the United Kingdom and the United States
Japan/United Kingdom Japan/United States
1871 22.3 29.6
1911 28.8 26.9
1929 36.8 29.4
1935 36.6 38.8
1950 27.7 20.1
1960 46.1 35.2
1973 95.1 68.5
1979 100.0 70.1
1990 114.4 81.0
1997 112.9 80.3
2007 97.1 73.2
Source: Derived from Maddison (2010).

135
The BRICs: What does Economic History say about their Growth Prospects?
rose during the second phase, the country shifted to higher-skill sectors and cotton textiles moved to lower-wage economies such as Brazil and Bangladesh. Japan’s post-World War II success was based initially on shipbuilding, but then on motor vehicles and consumer electronics as the economy evolved from imitation to innovation. By the 1980s Japanese manufacturing had attained a position of technological leadership in some sectors, with modern flexible production methods undermining mass production methods in the United States. During the 1980s this sparked concerns that Japan would overtake the United States, reflected in the writings of Baily and Chakrabarti (1988) and Dertouzos et al. (1989). However, as with the case of Western Europe, the institutional framework that was well suited to catch-up by relying on industry was less effective to forging ahead on the basis of services.
An effective way to shed light on Japan’s – and Western Europe’s – failure to overtake the United States is provided by the “varieties of capitalism” literature (Hall and Soskice, 2001), which points to differences between economies in institutional complementarities. Each national economy is seen as having a different set of institutions, which have evolved historically and interact together to provide a set of incentives for economic agents that underpin prosperity during successful phases. A fault line is usually drawn in this literature between “coordinated market economies” (CMEs) such as Japan and Germany, on the one hand, and “liberal market economies” (LMEs) such as the United States and the United Kingdom, on the other. Key elements of Japan’s coordinated market economy include lifetime employment, seniority wages, keiretsu business networks and a bank credit-based financial system (Witt, 2006). At a time when radical economic change ushered in by the ICT revolution is needed, coordinated market economies are seen as facing particular difficulties of adjustment, involving intensive bargaining and consensus-building among employer organisations, labour unions, interest groups and government.
However, as Chen (2008) points out, periods of radical technological change are often followed by a maturation phase, a central idea of the Schumpeterian General Purpose Technology (GPT) literature (Helpman, 1998). During these more settled periods, the advantages of the institutional complementarities of the CME can be expected to offset the disadvantages that are more clearly visible during the phase of radical technological change. That is not to deny that continuous reform is needed for economic success, but rather to stress that negotiation and consensus-building may be expected to work better in a more settled environment. Nonetheless, the removal of economic turbulence is no guarantee of success. Institutional reform will still be needed if Japan is to avoid the continued stagnation and relative decline experienced by countries such as Argentina in the second half of the 20th century. This illustrates the fact that it is difficult to predict a country’s reversal of fortune, or at least changes in its position versus other nations engaged in the catching-up process, so that naive rules for prediction, such as the approach adopted by O’Neill (2005) and Goldman Sachs, are unlikely to succeed.
136
Reversals of Fortune? A Long-term Perspective on Global Economic Prospects
5. Projections to 2030
Beyond having relatively large populations and therefore significant shares of world GDP, the BRIC countries actually have little in common. Certainly, if the purpose is to focus on GDP per capita levels, as is the case in the catching-up framework that dominates international growth comparisons, it is essential to treat these countries separately.
Major reversals of fortune for leading economies have been rare in the last millennium, and there are few signs to suggest that the United States will be overtaken in terms of GDP per capita in the foreseeable future. In fact, there are good reasons why these changes of leadership rarely occur. First, when a leading economy forges ahead on the basis of new technology, it is likely to be adapted to the conditions in the innovating country and may not be appropriate for use in a country in the process of catching up with different endowments and factor prices. This means that periods of technological and per-capita-income leadership can be quite resilient. There is a large historical literature with respect to the United States’ technological leadership in the 20th century, which has recently been adapted to the case of British technological pre-eminence in the 19th century (Habbakuk, 1962; David, 1970; Broadberry, 1997; Allen, 2009; Broadberry and Gupta, 2009). Second, as mentioned in the case of Japan, there is a body of literature on the “varieties of capitalism” that stresses the interlocking nature of the institutional framework, making it difficult for countries to challenge the new leading economy (Hall and Soskice, 2001). Within this framework, the fact that it is a combination of institutions and the way they interact which underpins a country’s advantage frustrates attempts to identify individual sources of success and helps to explain the inability of authors such as Hausman et al. (2005) to find robust results when it comes to the causes of growth accelerations.
However, there is a caveat. It is important to note that it is extremely difficult to identify these major changes in advance. There are no signs, for example, that Adam Smith [1776] understood the significance of the Industrial Revolution that was taking place around him while he was writing The Wealth of Nations. Existing projections tend to work either on the basis of naive extrapolation of recent growth rates or the Goldman Sachs BRICs methodology, which is based on automatic catch-up growth and real exchange-rate appreciation with economic development.
Working within an incomplete catching-up framework, the case studies considered in this chapter suggest that it is important to draw a distinction between examples such as Western Europe and Japan, where catching up stalled close to the frontier, and countries such as Argentina and Russia, which fell well short of closing the gap.
In 2008 the richest BRIC country, Russia, had a per capita income of $9,111 in 1990 international dollars, or just 29.2% of the US level (see Table 10). Russia’s previous experience of rapid catch-up growth during the Soviet era was followed by decline and eventual collapse as institutional reforms failed. Although the revival of growth since 1998 has taken place within the context of a market economy, Russia’s authoritarian government provides very selective enforcement of property rights. It is also strongly dependent on natural resources and continues to be highly vulnerable to a terms-of-trade shock. The prospect of Russia providing a serious challenge to the economic leadership of the United States therefore seems extremely remote.

137
The BRICs: What does Economic History say about their Growth Prospects?
Box 2: Alternative price comparisons and the implications for the level of real per capita income in developing countries
The GDP per capita data in Table 10 are presented in 1990 international dollars. Adopting this approach, per capita incomes in individual countries, expressed in their own currencies, are converted to 1990 dollars based on a comparison of prices in that year. This yields a set of purchasing power parities (PPPs) between countries, which can differ substantially from market exchange rates. This is because market exchange rates are determined in asset markets and do not necessarily reflect differences in the price of goods and services sold in different countries, although most economists believe that, in the long run, exchange-rate movements do reflect fundamental economic forces and move so as to reflect PPPs. The use of 1990 international dollars as the standard of comparison was established by Maddison (1995), and he retained this approach until his death in 2010, despite the fact that a new set of PPPs had become available based on 2005 international dollars.
The 1990 PPPs used by Maddison (1995) were taken from the International Comparison Program (ICP), which conducted price surveys in a number of countries at roughly five-year intervals (Kravis and Lipsey, 1991). In total, the ICP estimates covered 43 countries accounting for around 80% of world GDP, but the 1990 round covered only 22 countries, so that Maddison was forced to establish linkages to other ICP rounds and find proxy estimates for countries not covered in any survey. The 2005 PPPs have one important advantage over the 1990 PPPs in that the price surveys conducted by the World Bank (2008) cover many more countries than were directly available for the 1990 PPPs. However, they have also proved controversial, largely because they led to a dramatic downgrading of the level of GDP per capita in developing countries relative to the United States and other developed economies. One reason for this is their reliance on price levels in urban areas, where prices are higher than in neighbouring rural areas. As a result, it is likely that the 2005 PPPs overstate the price level in developing countries, and thus understate the level of real GDP per capita.
Table B.1: Comparison of GDP per capita in 2005 using estimates from Maddison and the World Bank (US=100)
Maddison, based on 1990 PPPs World Bank, based on 2005 PPPs
United States 100.0 100.0
United Kingdom 73.9 75.8
Japan 72.1 72.7
France 70.7 71.1
Italy 63.7 66.6
Russia 24.0 28.5
Brazil 19.3 20.6
China 18.3 9.8
India 8.0 5.1
Sources: Derived from Maddison (2010) and World Bank (2008).
Using the 1990 PPPs for his benchmark comparison, Maddison (2010) obtained the levels of GDP per capita relative to the United States in 2005 shown in the first column of Table B.1, but the 2005 PPPs from the World Bank (2008) yield quite different results (in the second column) for some countries. In developed countries, the 2005 PPP estimates of GDP per capita relative to the United States are reasonably close to the 1990 PPP results. The results are also quite similar for Brazil, but the proportional difference is more substantial in the case of Russia. However, for China and India the differences are dramatic. Indeed, using the 2005 PPPs downgrades the level of GDP per capita relative to the United States from 18.3% to just 9.8% in the case of China, and from 8% to 5.1% with respect to India. For China, that is almost halving living standards relative to Western countries, and it amounts to a proportional reduction of about 40% for India (de Jong and van Ark, 2012).
Some attempts have been made to adjust the 2005 PPPs in the case of China, most notably by Penn World Tables (2012), but the scale of the adjustment for rural-urban price differences is relatively small and merely raises Chinese GDP per capita to 11.3% of the US level in 2005. Perhaps the 2011 ICP round will mitigate some of these problems, but the results are not yet available.

138
Reversals of Fortune? A Long-term Perspective on Global Economic Prospects
China had a per capita income of $6,725 in 2008, or 21.6% of the United States level, but slightly above Brazil’s $6,429 (see Table 10). Fogel (2010) recently caused a stir by predicting Chinese GDP of $123trn in 2040 by simply projecting an annual growth rate of 10.8% for 30 years. This is based on a naive extrapolation of recent trends in growth and is probably too optimistic. Indeed, even the Goldman Sachs BRICs methodology, with its allowance for slowing down as the frontier is approached and for real exchange-rate appreciation with economic development, may produce overoptimistic results if institutions are not allowed to be flexible in a country that remains governed by the Communist Party.
India is the poorest of the BRIC countries, with a per capita GDP in 2008 of $2,975, or 9.5% of the US level (see Table 10). Although growth has been less impressive than in China, it nevertheless does have an interesting economic structure, which becomes clear from the comparison with China in Table 15 (Bosworth and Collins, 2008). First, however, it is worth noting that TFP growth in both countries was much less impressive than output growth or even labour productivity growth during the period 1978-2004. In India, total TFP growth was just 1.6% per annum, and while China’s 3.6% per annum growth was more impressive, it was not out of line with previous experiences of catching up in Japan and Europe.
The sectoral differences in TFP growth are instructive, confirming the general impression that Chinese growth was led by manufactured exports and Indian expansion by tradable services. Chinese TFP growth was most pronounced in industry at 4.3% per annum, but much slower in services and agriculture. The sectoral pattern was very different in India, where TFP growth was very slow, at just 1.6%. By contrast, Indian TFP growth in services was more significant at 2.4% and higher than in China. Indian sectoral TFP growth thus looks more modern, oriented towards services rather than industry. This is a positive aspect of Indian growth that can help offset the problems associated with institutional quality that seem to be endangering India’s tiger economy status.
Much of China’s growth, based on exporting low-wage manufactures, faces a challenge as wages rise. The product cycle model suggests the need to become more innovative rather than imitative, to move up the value-added chain in
Table 15: Sources of growth in China and India, 1978-2004 (% p.a.)
Contribution to output per worker
Output per worker Physical capital Education TFP
Total GDP
China 7.3 3.2 0.3 3.6
India 3.3 1.3 0.4 1.6
Agriculture
China 4.3 2.3 0.3 1.7
India 1.4 0.3 0.3 1.7
Industry
China 7.0 2.2 0.3 4.3
India 2.5 1.5 0.3 0.6
Services
China 4.9 2.7 0.3 1.8
India 3.5 0.6 0.4 2.4
Source: Bosworth and Collins (2008).

139
The BRICs: What does Economic History say about their Growth Prospects?
industry. China also needs to become more competitive in services if it wants to develop a more balanced economy. Such transformations will require a very different institutional framework. However, as noted in section 4.2 on Russia and the Soviet experiment, and in contrast to all other socialist economies where attempts at economic reform failed rapidly, China has succeeded in introducing a series of reforms which have raised the growth rate substantially for a period of three decades (Harrison, 2012).
How has China succeeded where others failed? Xu (2011) characterises the institutional framework as “regionally decentralised authoritarianism” (RDA), which he sees as mimicking the multidivisional form (M-form) firms in Western economies, with provincial leaders acting much as divisional managers, competing for advancement within an internal labour market. As in other reforming socialist systems, decentralisation has created new stakeholders, but the state has retained the senior stake by maintaining a large public sector and by withholding secure property rights. However, in contrast, the Chinese system has worked well, with competition among entrepreneurs harnessing the private sector to the objectives of national economic modernisation and rivalry among
Box 3: The size of China and implications for its growth prospects
One striking feature of the Chinese economy is its sheer size. In terms of population it is almost five times the size of the United States, three times the size of the European Union, and ten times the size of Japan. Indeed, some of the larger provinces in China are nearly as large as Japan or Germany. China is a continent all by itself. But more than that, China is also the world’s largest common market, unified by a single (written) language and marked by an unusually high degree of ethnic homogeneity given its size. China can perhaps also claim to be the sole surviving civilization with a continuous national history.
China’s size is not a historical accident but an endogenous outcome of history interacting with geography, leading to a unitary and centralised political governance system. Historically, both size and political structure have posed challenges and opportunities for economic growth. Confronted by aggressive Western imperialism in the mid-19th century, China’s large territory and its political rigidities help to explain the lagged response to Western challenges compared with Japan’s concurrent rapid modernisation.
From the late 1970s, however, key features of political and institutional legacies – aptly encapsulated under the term regionally decentralised authoritarianism (RDA) – enabled remarkable economic growth under a largely statist institution. By simulating market-supporting institutions, RDA provided a selective but effective property rights protection and contract enforcement mechanism within a political and administrative hierarchy tempered with a partial introduction of modern judiciary. RDA is relatively effective in the catching-up phase, as the goals, actors and agents for supporting growth are relatively easy to identify and pick. However, with China now entering its third decade of sustained high-speed growth, it may become increasingly difficult to realise genuine welfare improvements that are measured by hard data.
The Chinese experience bears some resemblance to the economic miracles of Japan, Korea and Taiwan during their catching-up phase. However, by the 1980s both Taiwan and Korea had achieved a peaceful transition to political representation and democratisation, which partly helped to realign the objective of national economic growth with local welfare improvements, as demanded by their citizens. But as a result of its size, mainland China’s path may be far more unpredictable and hazardous, marred by much more complicated problems of regional diversity, imbalances within and a dogmatic nationalist ideology on national sovereignty. As a result, China’s sheer size brings with it risks as well as opportunities for the future of the Chinese economy in the decades to come.
Debin Ma (London School of Economics)

140
Reversals of Fortune? A Long-term Perspective on Global Economic Prospects
provincial leaders breaking the resistance to policy reform that led to failure in other socialist economies. Xu (2011) argues that the system has worked well in China because the sub-national governments are sufficiently large to be relatively self-contained, so that the provincial leaders can have overall responsibility for introducing and coordinating reforms, providing public services and enforcing the law within their own jurisdictions.
But can this success be expected to continue as China approaches the frontier? The M-form firm proved very successful at achieving a limited set of objectives during the Fordist era of mass production, but was unable to cope with the fragmentation of objectives as mass production gave way to flexible specialisation. RDA has been a success while China has been a long distance from the frontier, but there is no guarantee this will continue as the frontier gets closer, let alone when China is seeking to overtake the United States. Basing himself on 19th-century experience, Gerschenkron (1962) argued that countries starting to catch up from a position of backwardness could substitute for the prerequisites of growth, citing for example Imperial Russia’s substitution of state action for scarce private entrepreneurship. In the Chinese system of RDA, the
Box 4: African growth prospects
In April 2011 the South African president, Jacob Zuma, attended a meeting of the BRIC countries, signalling his country’s long-sought admission to the political bloc. South Africa’s invitation to the meeting was controversial, given the relatively small size of its economy. Proponents of the move suggested it reflected increasing optimism about Africa’s growth prospects, with South Africa acting as a gateway to the rest of the continent. The inclusion of Nigeria in the Next 11 (N-11) group of emerging economies was another such indicator. Opponents of South Africa’s admission to the BRIC countries, however, pointed to a number of obstacles to sustained growth faced by other African countries, including a continuing reliance on primary exports and problems of governance.
Relatively rapid growth in African GDP since the late 1990s has led to suggestions by both the media and international organisations that Africa is poised to catch up with wealthier parts of the world in the 21st century. Indeed, from 2002 to 2008 GDP grew by an average of 5.6% per annum, which placed Africa second only to East Asia in its rate of economic growth, and at the onset of the global crisis, ten of the 15 fastest-growing countries were in Africa (United Nations, 2012).
This is not the first period of rapid growth in Africa. African economic history has increasingly emphasised a long-run trajectory of rapid growth periods followed by phases of low growth or even contraction (Ndulu and O’Connell, 2007). Following independence in the 1960s, Africa’s prospects looked more hopeful than those of South Asia. GDP grew at an average of 4% per annum, although high population growth rates reduced annual GDP per capita increases to less than 2% (United Nations, 2012). Driven by primary commodity exports, this period of growth fizzled out in the late 1970s and was followed by two decades of stagnation, and in some cases economic decline, along with rising poverty rates.
Similarly, the current boom in Africa is largely the result of demand for primary commodities from emerging economies, notably China and other BRIC countries. Limited structural transformation continues to constrain Africa’s growth prospects (Ndulu and O’Connell, 2007), leaving many countries vulnerable to external shocks. The failure of import-substituting industrialisation in the 1960s and 1970s resembles Argentina’s experience and suggests that Africa may also struggle to catch up. Manufacturing as a share of GDP is growing in some countries, but most remain dependent on imports. Moreover, political instability and corruption are also likely to limit the sustainability of current growth rates across much of the African continent (United Nations, 2012).
Leigh Gardner (London School of Economics)

141
The BRICs: What does Economic History say about their Growth Prospects?
incentive structures provided to the provincial governors to compete to achieve economic modernisation arguably made up for the lack of secure property rights. But as the private sector grows, as objectives multiply and pressures for democracy increase, it is unlikely that this system can continue to deliver the rapid growth of the past two decades.
There is thus some interest in looking beyond the BRICs to other emerging markets which could be expected to grow rapidly in the future. Goldman Sachs, for example, have drawn attention to the “Next 11” (N-11) group of countries (O’Neill, 2005), and since the “discovery” of the BRICs a number of African countries have seen a dramatic improvement in their growth performance. In this context, Box 4 considers Africa’s growth outlook and assesses the continent’s prospects of catching up in the decades ahead.
6. Policy conclusions
• Taking a long-term perspective is important. Indeed, history matters. Although much policy analysis in this field is based only on very recent trends, issues of shifting competitive advantage between nations are usually played out over very long periods of time, for which economic history is an indispensable guide.
• Changes of leadership in per capita income have been rare in history. Once a country gets ahead, it tends to remain number one for a long time. This is partly due to “appropriate technology”: different endowments and factor prices mean that technology cannot be transferred to other countries without adaptation to local circumstances. This effect is reinforced to the extent that institutional frameworks contain interlocking elements, so that it is not possible to “pick and mix” from the institutional framework in different countries.
• The process of catching up does not necessarily continue once it has started, so that the future success of any of the BRIC countries is by no means a foregone conclusion.
• It is important to distinguish between policies that can help to get growth accelerations started and policies that are needed to sustain them or prevent growth slowdowns.
• There is often a tension between historical context and general conclusions. Policy conclusions are usually context-specific and defy generalisation. Institutions that foster growth in the early stages of catching up can hinder growth later on, so that, for example, a country that adjusts its institutions to catching up thanks to industry may struggle to compete in services at later stages of development.
• Institutions need to be stable enough to foster long-term growth while also being flexible enough to cope with changing circumstances.
• One common factor which unites the more successful cases of catching up and forging ahead is the accumulation of human capital. This is necessary not just for the creation of high technology in industry, but increasingly for the diffusion of more basic technology in services.
• As the richest BRIC country, Russia has a per capita GDP of about 30% of the level in the United States. Russia’s previous experience of catch-up growth during the Soviet era was followed by a growth slowdown and collapse. Although the current era of rapid growth has taken place within the context of a market economy, Russia’s authoritarian government provides only selective enforcement of property rights. If catching up is to continue in Russia, reforms will be needed to ensure a more transparent rule of law.

142
Reversals of Fortune? A Long-term Perspective on Global Economic Prospects
• Although China’s per capita GDP is about 20% of the US level, the country’s rapid growth has now been sustained over three decades, a remarkable achievement when compared with the rapid collapse of other reforming socialist economies. The system of regionally decentralised authoritarianism has worked relatively well, despite the state withholding secure property rights. This is because of competition between provincial leaders with responsibility for initiating and coordinating reforms, providing public services and enforcing the law within their own jurisdictions. However, as China approaches the frontier, further reforms will be needed. Although the system of RDA has in effect been substituted for the lack of secure property rights in the early stages of catching up, when the objectives of modernisation are put under the spotlight, this is unlikely to be sustainable as the private sector grows, objectives multiply and pressures for democracy grow.
• India is the poorest BRIC country, with a per capita GDP of around 10% of the US level. Although there are real concerns about the level of corruption in India, it is worth noting that India is the only BRIC country where success has been driven more by services than by industry. This bodes well for the future, as a key characteristic of many rich countries is their strong performance in the services sector.
• Although South Africa has only recently succeeded in attaching itself to the masthead of the BRIC countries, this has brought further attention to the recent phase of high growth in Africa. However, an earlier period of strong economic expansion in Africa was not sustained, and there is good reason to be sceptical about the sustainability of this current growth phase, not least because of continued political instability and corruption in many countries across the continent.

143
The BRICs: What does Economic History say about their Growth Prospects?
ReferencesAbramovitz, M. (1986), “Catching Up, Forging Ahead and Falling Behind”,
Journal of Economic History, 46, 385-406.Acemoglu, D., Johnson, S. and Robinson, J. (2005), “The Rise of Europe:
Atlantic Trade, Institutional Change, and Economic Growth”, American Economic Review, 95, 546-579.
Allen, R.C. (2001), “The Great Divergence in European Wages and Prices from the Middle Ages to the First World War”, Explorations in Economic History, 38, 411-447.
Allen, R.C. (2003), Farm to Factory: A Reinterpretation of the Soviet Industrial Revolution, Princeton: Princeton University Press.
Allen, R.C. (2009), The British Industrial Revolution in Global Perspective, Cambridge: Cambridge University Press.
Álvarez-Nogal, C. and Prados de la Escosura, L. (2013), “The Rise and Fall of Spain, 1270-1850”, Economic History Review (forthcoming).
Baily, M.N. and Chakrabarti. A.K. (1988), Innovation and the Productivity Crisis, Washington, DC: The Brookings Institution.
Bassino, J.-P., Broadberry, S., Fukao, K., Gupta, B. and Takashima, M. (2012), “Japan and the Great Divergence, 730-1870”, http://www2.lse.ac.uk/economicHistory/whosWho/profiles/sbroadberry.aspx.
Bergson, A. (1973), “Towards a New Growth Model”, Problems of Communism, 22, 1-9.
Bergson, A. (1983), “Technological Progress”, in Bergson, A. and Levine, H.S. (eds.), The Soviet Economy: Towards the Year 2000, London: Allen and Unwin.
Bosworth, B. and Collins, S. (2008), “Accounting for Growth: Comparing China and India”, Journal of Economic Perspectives, 22(1), 45-66.
Broadberry, S. (1993), “Manufacturing and the Convergence Hypothesis: What the Long Run Data Show”, Journal of Economic History, 53, 772-795.
Broadberry, S. (1997c), The Productivity Race: British Manufacturing in International Perspective, 1850-1990, Cambridge: Cambridge University Press.
Broadberry, S. (1998), “How did the United States and Germany Overtake Britain? A Sectoral Analysis of Comparative Productivity Levels, 1870-1990”, Journal of Economic History, 58, 375-407.
Broadberry, S. (2006), Market Services and the Productivity Race, 1850-2000: British Performance in International Perspective, Cambridge: Cambridge University Press.
Broadberry, S., Campbell, B., Klein, A., Overton, M. and van Leeuwen, B. (2011), “British Economic Growth, 1270-1870: An Output-Based Approach”, London School of Economics, http://www2.lse.ac.uk/economicHistory/whosWho/profiles/sbroadberry.aspx.
Broadberry, S. and Ghosal, S. (2002), “From the Counting House to the Modern Office: Explaining Anglo-American Productivity Differences in Services, 1870-1990”, Journal of Economic History, 62, 967-998.
Broadberry, S., Guan, H. and Li, D. (2012), “China, Europe and the Great Divergence: A Study in Historical National Accounting”, London School of Economics.
Broadberry, S. and Gupta, B. (2006), “The Early Modern Great Divergence: Wages, Prices and Economic Development in Europe and Asia, 1500-1800”, Economic History Review, 59, 2-31.
Broadberry, S. and Gupta, B. (2009), “Lancashire, India and Shifting Competitive Advantage in Cotton Textiles, 1700-1850: The Neglected Role of Factor Prices”, Economic History Review, 62, 279-305.

144
Reversals of Fortune? A Long-term Perspective on Global Economic Prospects
Broadberry, S. and Gupta, B. (2012), “India and the Great Divergence: An Anglo-Indian Comparison of GDP per capita, 1600-1871”, London School of Economics, http://www2.lse.ac.uk/economicHistory/whosWho/profiles/sbroadberry.aspx.
Broadberry, S. and Klein, A. (2011), “When and Why did Eastern European Economies begin to Fail?: Lessons from a Czechoslovak/UK Productivity Comparison, 1921-1991”, Explorations in Economic History, 48, 37-52.
Broadberry, S. and van Leeuwen, B. (2011), “The Growth of the English Economy, 1086-1270”, London School of Economics.
Broadberry, S., van Leeuwen, B. and van Zanden (2012), “Reversals of Fortune: Holland, Britain and the Rise of the North Sea Area, 1270-1870”, London School of Economics and Utrecht University.
Chen, L. (2008), “Institutional Inertia, Adjustment, and Change: Japan as a Case of a Coordinated Market Economy”, Review of International Political Economy, 15, 460-479.
Crafts, N. and Toniolo, G. (2010), “Aggregate Growth, 1950-2005”, in Broadberry, S. and O’Rourke, K.H. (eds.), The Cambridge Economic History of Modern Europe, Volume 2: 1870 to the Present. Cambridge: Cambridge University Press, 296-332.
David, P.A. (1970), Technical Choice, Innovation and Economic Growth, Cambridge: Cambridge University Press.
Davies, R.W., Harrison, M. and Wheatcroft, S.G. (eds.) (1994), The Economic Transformation of the Soviet Union, 1913-1945, Cambridge: Cambridge University Press
della Paolera, G., and A. M. Taylor (eds.) (2003), A New Economic History of Argentina, Cambridge: Cambridge University Press, 2003.
Dertouzos, M.L., Lester, R.K., Solow, R.M. and the MIT Commission on Industrial Productivity (1989), Made in America: Regaining the Productive Edge. Cambridge, MA: MIT Press.
Easterlin, R.A. (1981), “Why isn’t the Whole World Developed?”, Journal of Economic History, 41, 1-19.
Eichengreen, B. (1996), “Institutions and Economic Growth: Europe after World War II”, in Crafts, N.F.R. and Toniolo, G. (eds.), Economic Growth in Europe since 1945. Cambridge: Cambridge University Press, 38-72.
Eichengreen, B., Park, D. and Shin, K. (2011), “When Fast Growing Economies Slow Down: International Evidence and Implications for China”, NBER Working Paper No. 16919, http://www.nber.org/papers/w16919.pdf
Falkus, M.E. (1972), The Industrialisation of Russia, 1700-1914. London: Macmillan.
Federico, G. (2005), Feeding the World: An Economic History of World Agriculture, 1800-2000. Princeton: Princeton University Press.
Fogel, R. (2010), “$123,000,000,000,000: China’s Estimated Economy by the Year 2040. Be Warned”, Foreign Policy, January/February, http://www.foreignpolicy.com/articles/2010/01/04/123000000000000
Ford, A.G. (1962), The Gold Standard, 1880-1914: Britain and Argentina. Oxford: Clarendon.
Gerschenkron, A. (1962), Economic Backwardness in Historical Perspective. Cambridge, MA: Harvard University Press.
Goldin, C. (1998), “America’s Graduation from High School: The Evolution and Spread of Secondary Schooling in the Twentieth Century”, Journal of Economic

145
The BRICs: What does Economic History say about their Growth Prospects?
History, 58, 345-374.Goldin, C. (2001), “The Human-Capital Century and American Leadership:
Virtues of the Past”, Journal of Economic History, 61, 263-292.Gregory, P.R. (1982), Russian National Income, 1885-1913. Cambridge:
Cambridge University Press.Habakkuk, H.J. (1962), American and British Technology in the Nineteenth
Century. Cambridge: Cambridge University Press.Haacker, M. (2011), “Framing AIDS as an Economic Development Challenge”,
Journal of World Affairs, 17, 65-76.Hall, P.H. and Soskice, D. (eds.) (2001), Varieties of Capitalism: The Institutional
Foundations of Comparative Advantage. Oxford: Oxford University Press.Harrison, M. (2012), “Communism and Economic Modernization”, CAGE
Working Paper No.92, University of Warwick, http://www2.warwick.ac.uk/fac/soc/economics/research/centres/cage/research/wpfeed/archive/92.2012_harrison.pdf
Hausman, R., Pritchett, L. and Rodrik, D. (2005), “Growth Accelerations”, Journal of Economic Growth, 10(4), 303-329.
Helpman, E. (ed.) (1998), General Purpose Technologies and Economic Growth. Cambridge, MA: MIT Press.
de Jong, H. and van Ark, B. (2012), “The Comparison of GDP Levels and the Use of PPPs in the Maddison Database”, Groningen Growth and Development Centre and the Conference Board.
Kravis, I.B. and Lipsey, R.E. (1991), “The International Comparison Program: Current Status and Problems”, in Hooper, P. and Richardson, J.D. (eds.), International Economic Transactions: Issues in Measurement and Empirical Research. Chicago: NBER and University of Chicago Press, 437-468.
Ma, D. (2012), “Political Institutions and Long Run Economic Trajectory: Some Lessons from Two Millennia of Chinese Civilization”, London School of Economics, http://personal.lse.ac.uk/mad1/wp.htm
Maddison, A. (1995), Monitoring the World Economy, 1820-1992. Paris: OECD.
Maddison, A. (2001), The World Economy: A Millennial Perspective. Paris: OECD.
Maddison, A. (2010), “Statistics on World Population, GDP and Per Capita GDP, 1-2008 AD”, Groningen Growth and Development Centre, http://www.ggdc.net/MADDISON/oriindex.htm
Malanima, P. (2011), “The Long Decline of a Leading Economy: GDP in Central and Northern Italy, 1300-1913”, European Review of Economic History, 15, 169-219.
de Moor, T. and van Zanden, J.L. (2010), “Girl Power: The European Marriage Pattern and Labour Markets in the North Sea Region in the Late Medieval and Early Modern Period”, Economic History Review, 63, 1-33.
Ndulu, B. J. and O’Connell, S. A. (2007), “Policy Plus: African Growth Performance, 1960-2000”, in Ndulu, B. J., O’Connell, S.A., Azam, J.-P., Bates, R.H., Fosu, A.K., Gunning, J.W. and Njinkeu, D. (eds.), The Political Economy of Economic Growth in Africa, 1960-2000. Cambridge: Cambridge University Press, 3-75.
North, D.C. (1990), Institutions, Institutional Change and Economic Performance. Cambridge: Cambridge University Press.
North, D.C., Wallis, J.J. and Weingast, B.R. (2009), Violence and Social Orders: A Conceptual Framework for Interpreting Recorded Human History, Cambridge: Cambridge University Press.

146
Reversals of Fortune? A Long-term Perspective on Global Economic Prospects
O’Mahony, M. and Timmer, M. (2009), “Output, Input and Productivity Measures at the Industry Level: The EU KLEMS Database”, Economic Journal, 119, F374-F403.
O’Neill, J. (2001), “Building Better Global Economic BRICs”, Goldman Sachs, http://www.goldmansachs.com/our-thinking/brics/building-better.html
O’Neill, J. (2005), “The Next 11: It’s Time to redefine Emerging Markets”, Goldman Sachs, http://www.goldmansachs.com/gsam/individuals/education/investment-themes/growth-markets/growth-markets-rollup/index.html
Pamuk, S. (2007), “The Black Death and the Origins of the ‘Great Divergence’ across Europe, 1300-1600”, European Review of Economic History, 11, 289-318.
Penn World Tables (2012), “Description of PWT 7.0 and 7.1”, http://pwt.econ.upenn.edu/php_site/pwt_index.php
Pomeranz, K. (2000), The Great Divergence: China, Europe, and the Making of the Modern World Economy. Princeton: Princeton University Press.
Samuelson, P.A. (1967), Economics: An Introductory Analysis. New York: McGraw-Hill.
Smith, A. [1776] (1880), The Wealth of Nations. Oxford: Clarendon Press.Solnick, S. (1998), Stealing the State: Control and Collapse in Soviet Institutions.
Cambridge, MA: Harvard University Press.Taylor, A.M. (1998), “On the Costs of Inward-Looking Development: Price
Distortions, Growth, and Divergence in Latin America”, Journal of Economic History, 58, 1-28.
United Nations (2012), Unleashing Africa’s Potential as a Pole of Global Growth, Addis Ababa: Economic Commission for Africa.
Voigtländer, N. and Voth, H.-J. (2010), “How the West ‘Invented’ Fertility Restriction”, UPF Barcelona.
Weitzman, M.L. (1970), “Soviet Postwar Growth and Capital-Labor Substitution”, American Economic Review, 60, 676-692.
Whiteside, A. (2001), ‘Demography and Economics of HIV/AIDS’, British Medical Bulletin, 58, 73-88.
Witt, M. (2006), Changing Japanese Capitalism: Societal Coordination and Institutional Adjustment. Cambridge: Cambridge University Press.
World Bank (2008), Global Purchasing Power Parities and Real Expenditures: 2005 International Comparison Program. Washington, DC: World Bank.
Wrigley, E.A. and Schofield, R.S. (1989), The Population History of England, 1541-1871: A Reconstruction. Cambridge: Cambridge University Press.
Xu, C. (2011), “The Fundamental Institutions of China’s Reforms and Development”, Journal of Economic Literature, 49, 1076-1151.
Young, A. (2005), “The Gift of the Dying: The Tragedy of AIDS and the Welfare of Future African Generations”, Quarterly Journal of Economics, 120, 423-466.
van Zanden, J.L. and van Leeuwen, B. (2012), “Persistent but not Consistent: The Growth of National Income in Holland, 1347-1807”, Explorations in Economic History, 49, 119-130.