Embed Size (px)
Citation preview

Guam’s Real Estate Guam’s Real Estate Market OverviewMarket Overview
Si k S H t MAI MRESi k S H t MAI MRESiska S. Hutapea, MAI, MRESiska S. Hutapea, MAI, MREVP VP –– Chief AppraiserChief AppraiserC e pp a seC e pp a seCaptain, Hutapea & Captain, Hutapea &
AssociatesAssociatesCaptain, Hutapea & AssociatesCaptain, Hutapea & Associates
AssociatesAssociates

IntroductionIntroductionIntroductionIntroduction
Cyclical OverviewCyclical OverviewCyclical OverviewCyclical OverviewThe DownturnThe DownturnR & G thR & G thRecovery & GrowthRecovery & GrowthPrimary ActivityPrimary ActivityNotable TransactionsNotable TransactionsPrice Decline: Mixed SignalsPrice Decline: Mixed SignalsPrice Decline: Mixed SignalsPrice Decline: Mixed SignalsFuture ProjectionsFuture Projections
Captain, Hutapea & AssociatesCaptain, Hutapea & Associates
Cyclical OverviewCyclical OverviewCyclical OverviewCyclical Overview
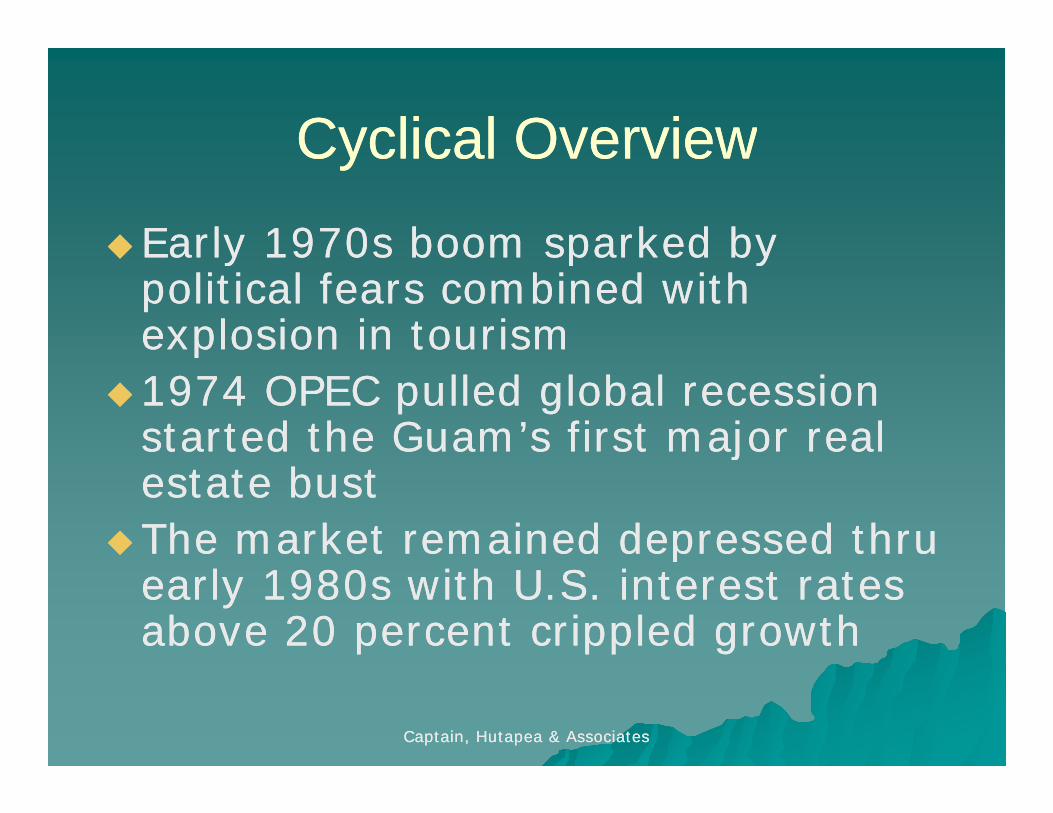
Early 1970s boom sparked by Early 1970s boom sparked by Early 1970s boom sparked by Early 1970s boom sparked by political fears combined with political fears combined with explosion in tourismexplosion in tourismpp1974 OPEC pulled global recession 1974 OPEC pulled global recession started the Guam’s first major real started the Guam’s first major real jjestate bustestate bustThe market remained depressed thru The market remained depressed thru ppearly 1980s with U.S. interest rates early 1980s with U.S. interest rates above 20 percent crippled growthabove 20 percent crippled growth
Captain, Hutapea & AssociatesCaptain, Hutapea & Associates
Cyclical Overview (Cont )Cyclical Overview (Cont )Cyclical Overview (Cont.)Cyclical Overview (Cont.)
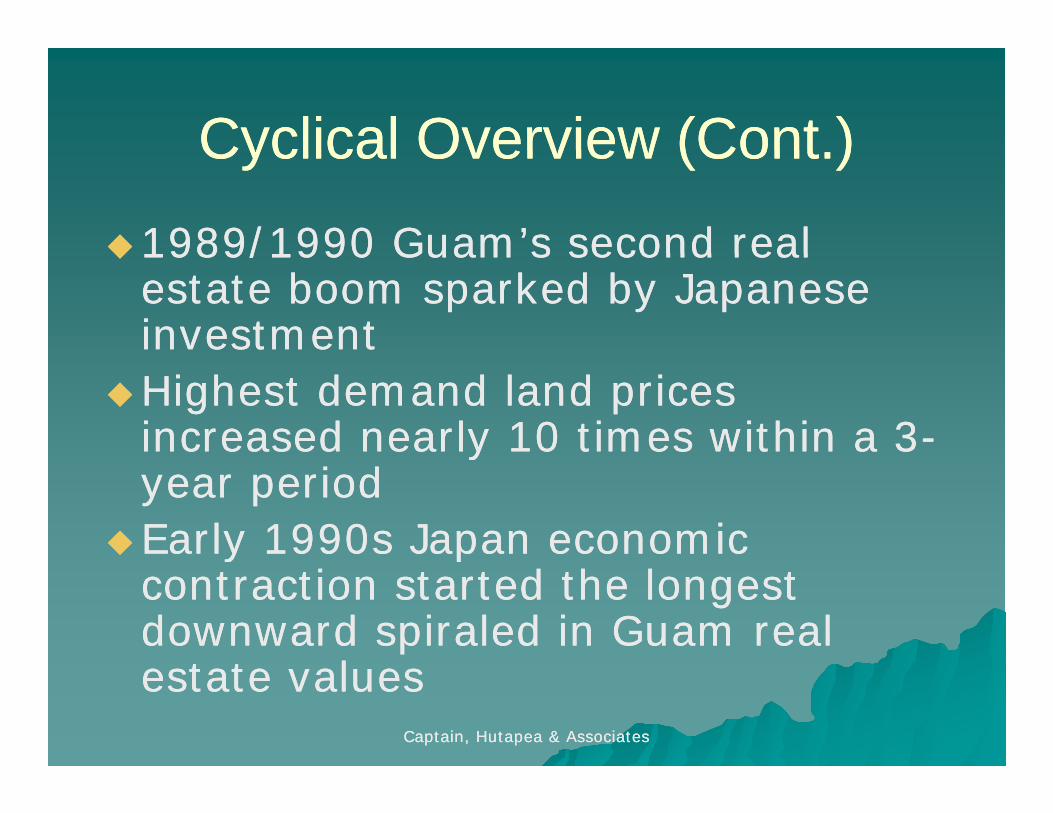
1989/1990 Guam’s second real 1989/1990 Guam’s second real 1989/1990 Guam s second real 1989/1990 Guam s second real estate boom sparked by Japanese estate boom sparked by Japanese investmentinvestmentHighest demand land prices Highest demand land prices increased nearly 10 times within a 3increased nearly 10 times within a 3--yyyear periodyear periodEarly 1990s Japan economic Early 1990s Japan economic y py pcontraction started the longest contraction started the longest downward spiraled in Guam real downward spiraled in Guam real
t t lt t lCaptain, Hutapea & AssociatesCaptain, Hutapea & Associates
estate valuesestate values

Cyclical Overview (Cont )Cyclical Overview (Cont )Cyclical Overview (Cont.)Cyclical Overview (Cont.)
2006/2007 Guam’s third real estate 2006/2007 Guam’s third real estate 2006/2007 Guam s third real estate 2006/2007 Guam s third real estate boom sparked by 3Msboom sparked by 3Ms2008/2009 Guam’s “calm before the 2008/2009 Guam’s “calm before the 2008/2009 Guam s calm before the 2008/2009 Guam s calm before the storm?” phase fueled by external storm?” phase fueled by external forces (global financial crisis H1N1 forces (global financial crisis H1N1 forces (global financial crisis, H1N1, forces (global financial crisis, H1N1, the money’s not here yet)the money’s not here yet)
Captain, Hutapea & AssociatesCaptain, Hutapea & Associates
The DownturnThe DownturnThe DownturnThe Downturn
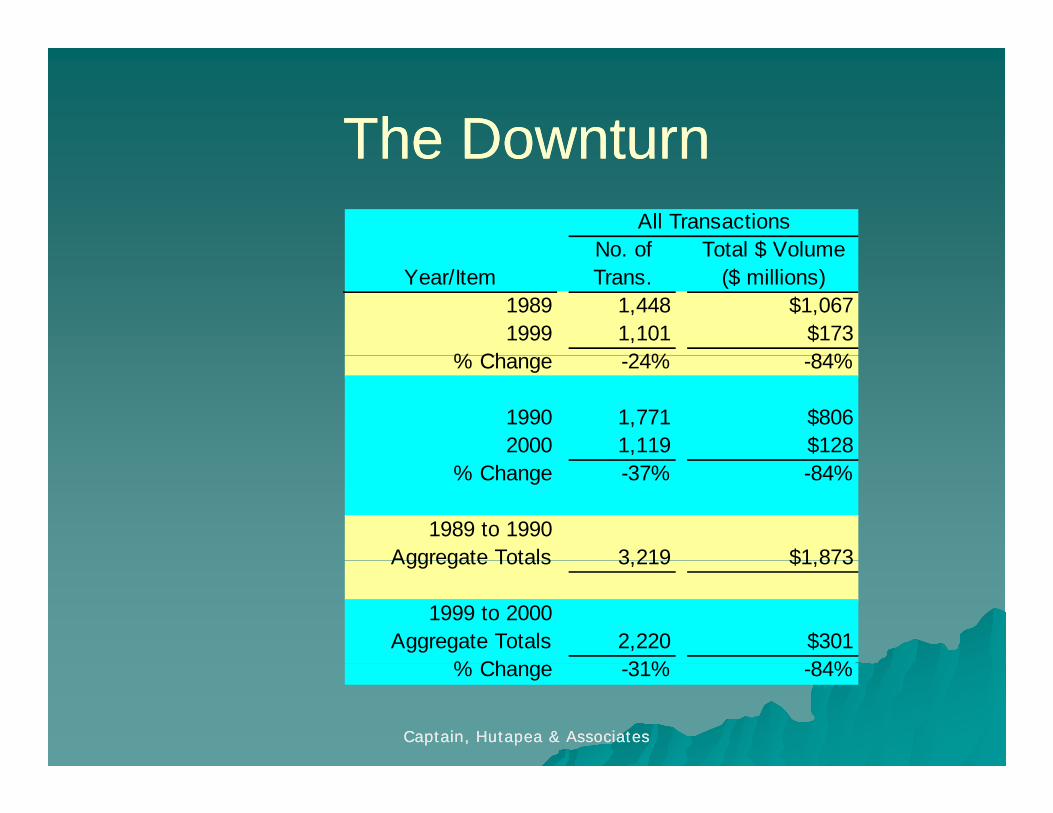
No of Total $ VolumeAll Transactions
No. of Total $ VolumeYear/Item Trans. ($ millions)
1989 1,448 $1,0671999 1,101 $173
% Ch 24% 84%% Change -24% -84%
1990 1,771 $8062000 1,119 $128
% Change -37% -84%
1989 to 1990Aggregate Totals 3 219 $1 873Aggregate Totals 3,219 $1,873
1999 to 2000Aggregate Totals 2,220 $301
% Ch 31% 84%
Captain, Hutapea & AssociatesCaptain, Hutapea & Associates
% Change -31% -84%
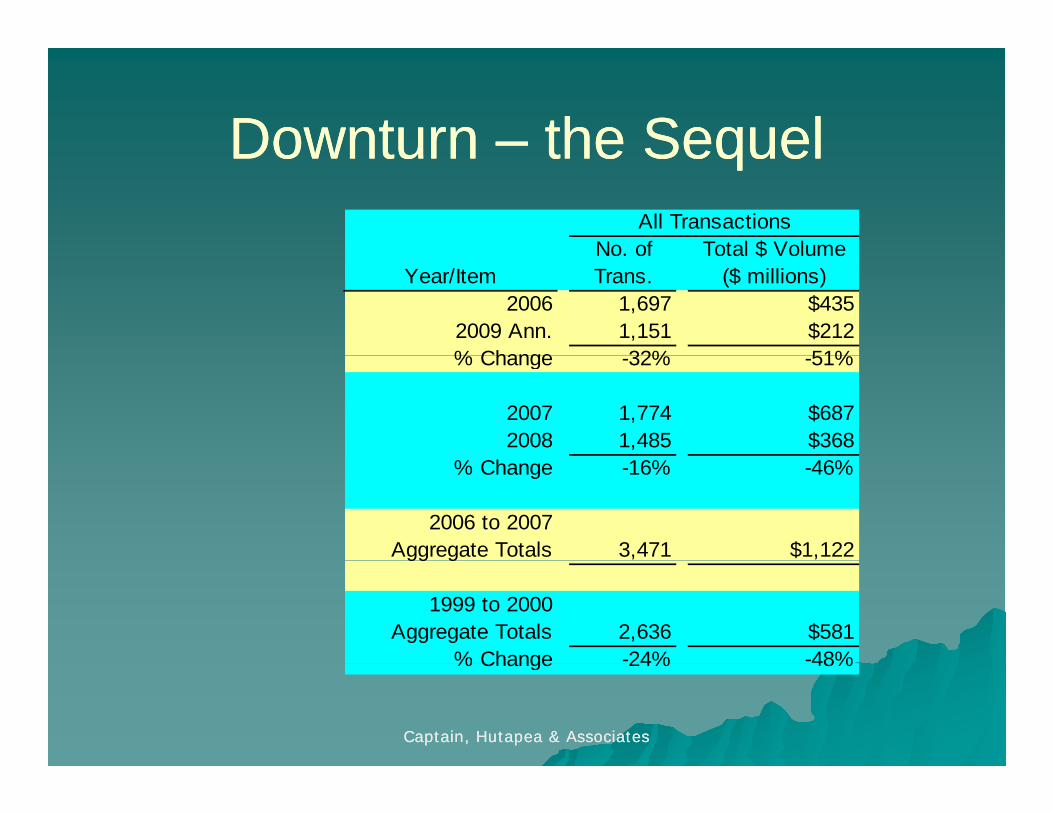
DownturnDownturn –– the Sequelthe SequelDownturn Downturn the Sequelthe Sequel
No of Total $ VolumeAll Transactions
No. of Total $ VolumeYear/Item Trans. ($ millions)
2006 1,697 $4352009 Ann. 1,151 $212% Change 32% 51%% Change -32% -51%
2007 1,774 $6872008 1,485 $368
% Change -16% -46%
2006 to 2007Aggregate Totals 3,471 $1,122gg g
1999 to 2000Aggregate Totals 2,636 $581
% Change -24% -48%
Captain, Hutapea & AssociatesCaptain, Hutapea & Associates
% Change 24% 48%

Recovery & GrowthRecovery & GrowthRecovery & GrowthRecovery & Growth
No of Total $ VolumeAll Transactions
No. of Total $ VolumeYear/Item Trans. ($ millions)
1999 1,101 $1732006 1,697 $435
% Change 54% 151%
2000 1,119 $1282007 Ann 1 821 $7472007 Ann. 1,821 $747% Change 63% 484%
1999 to 2000$Aggregate Totals 2,220 $301
2006 to 2007 Ann.Aggregate Totals 3,518 $1,182
Captain, Hutapea & AssociatesCaptain, Hutapea & Associates
Aggregate Totals 3,518 $1,182% Change 58% 293%

Recovery & GrowthRecovery & Growth –– Next?Next?Recovery & Growth Recovery & Growth Next?Next?
Military DrivenMilitary DrivenMilitary DrivenMilitary DrivenSlow and spread out, or sudden Slow and spread out, or sudden growth spur?growth spur?growth spur?growth spur?Guam is susceptible to external Guam is susceptible to external f l t’ t f tf l t’ t f tforces, let’s not forgetforces, let’s not forgetWhen?When?
Captain, Hutapea & AssociatesCaptain, Hutapea & Associates

Boom to Gloom to Boom to Gloom Boom to Gloom to Boom to Gloom ddand so on…and so on…
Year Total Sales (Mil.) No. of Trans1989 $1,067 1,448 2002 $124 1,016 2007 $687 1,774
2009 Ann. $212 1,151
Captain, Hutapea & AssociatesCaptain, Hutapea & Associates
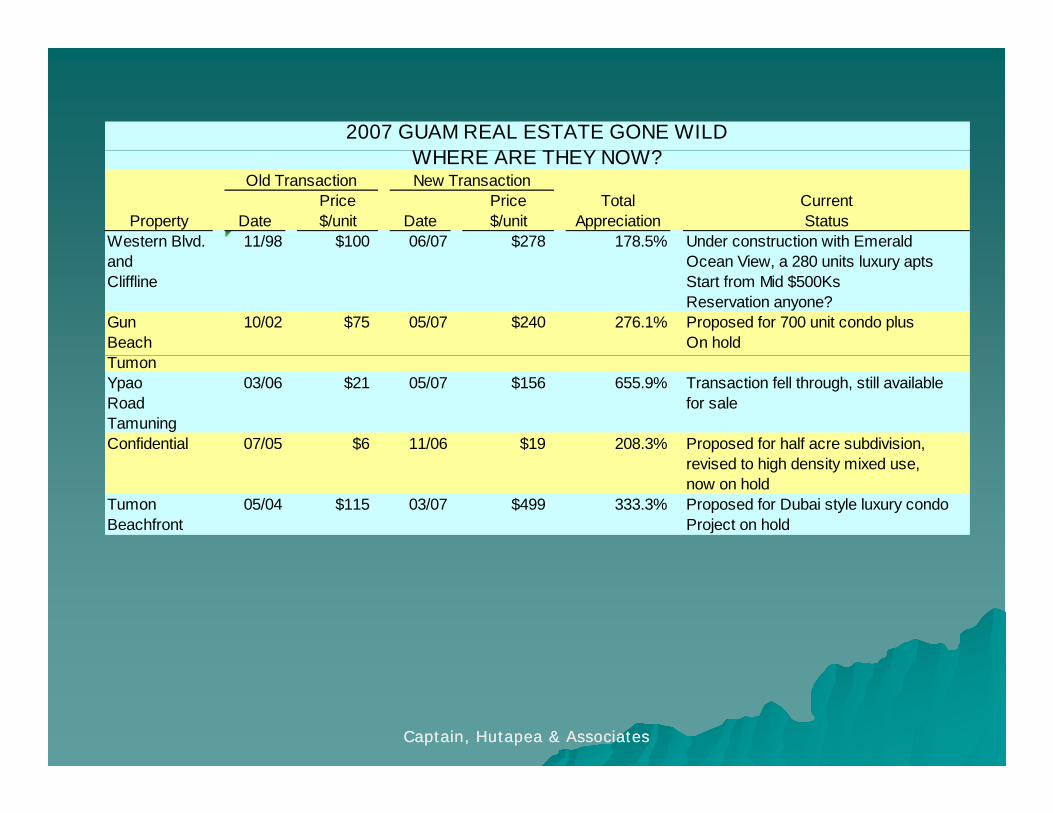
2007 GUAM REAL ESTATE GONE WILDWHERE ARE THEY NOW?
Price Price CurrentProperty Date $/unit Date $/unit Appreciation Status
Western Blvd. 11/98 $100 06/07 $278 178.5% Under construction with Emerald
WHERE ARE THEY NOW?
TotalNew TransactionOld Transaction
and Ocean View, a 280 units luxury aptsCliffline Start from Mid $500Ks
Reservation anyone?Gun 10/02 $75 05/07 $240 276.1% Proposed for 700 unit condo plusBeach On holdTumonYpao 03/06 $21 05/07 $156 655.9% Transaction fell through, still availableRoad for saleTamuningConfidential 07/05 $6 11/06 $19 208.3% Proposed for half acre subdivision,
i d t hi h d it i drevised to high density mixed use,now on hold
Tumon 05/04 $115 03/07 $499 333.3% Proposed for Dubai style luxury condoBeachfront Project on hold
Captain, Hutapea & AssociatesCaptain, Hutapea & Associates

Primary Activity: 2008Primary Activity: 2008Primary Activity: 2008Primary Activity: 2008
Captain, Hutapea & AssociatesCaptain, Hutapea & Associates
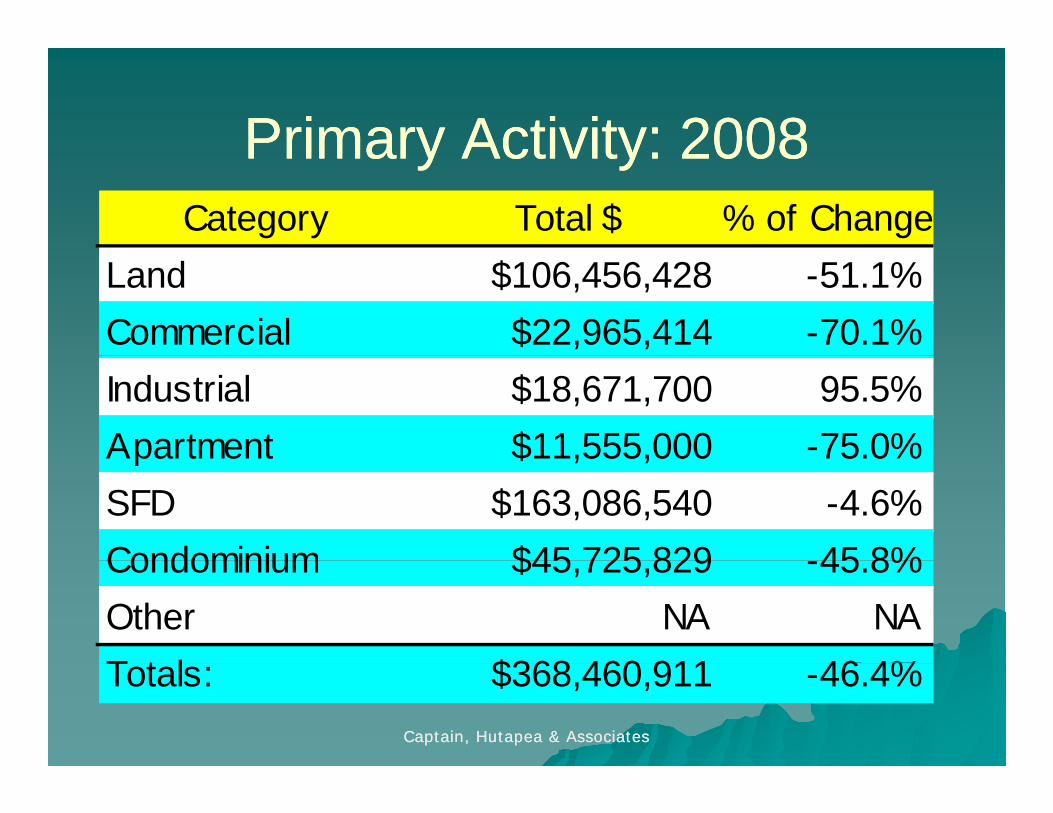
Primary Activity: 2008Primary Activity: 2008Primary Activity: 2008Primary Activity: 2008Category Total $ % of Change
Land $106,456,428 -51.1%Commercial $22,965,414 -70.1%Industrial $18,671,700 95.5%Apartment $11,555,000 -75.0%Apartment $11,555,000 75.0%SFD $163,086,540 -4.6%Condominium $45 725 829 45 8%Condominium $45,725,829 -45.8%Other NA NAT t l $368 460 911 46 4%
Captain, Hutapea & AssociatesCaptain, Hutapea & Associates
Totals: $368,460,911 -46.4%
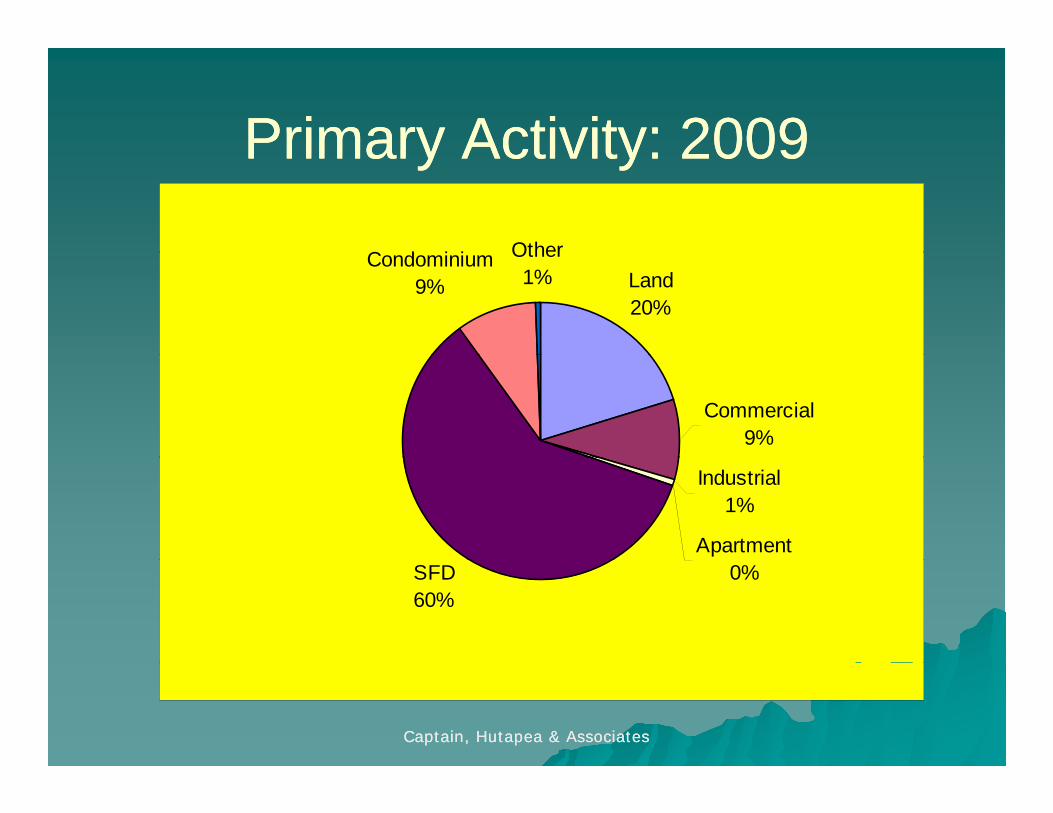
Primary Activity: 2009Primary Activity: 2009Primary Activity: 2009Primary Activity: 2009
C d i i OtherLand20%
Condominium9%
Other1%
Commercial9%
Industrial1%
Apartment0%SFD
60%
Captain, Hutapea & AssociatesCaptain, Hutapea & Associates
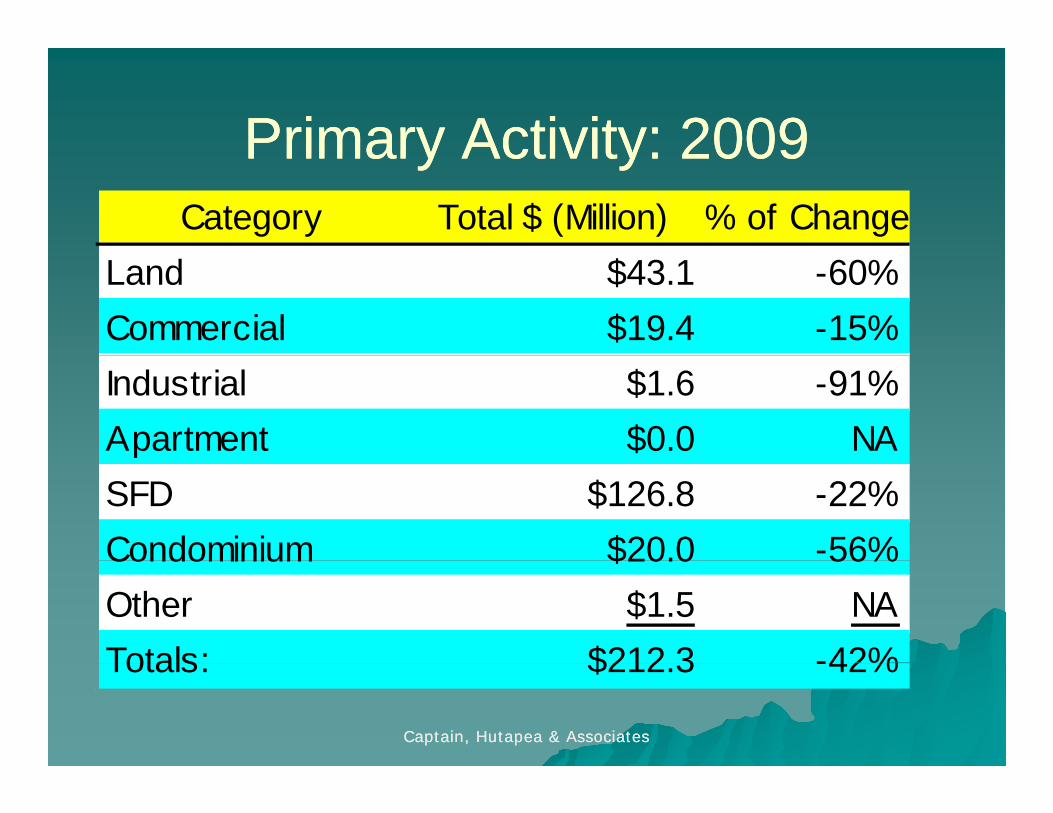
Primary Activity: 2009Primary Activity: 2009Primary Activity: 2009Primary Activity: 2009Category Total $ (Million) % of Change
Land $43.1 -60%Commercial $19.4 -15%Industrial $1.6 -91%Apartment $0.0 NASFD $126.8 -22%Condominium $20.0 -56%Condominium $20.0 56%Other $1.5 NATotals: $212 3 -42%
Captain, Hutapea & AssociatesCaptain, Hutapea & Associates
Totals: $212.3 -42%
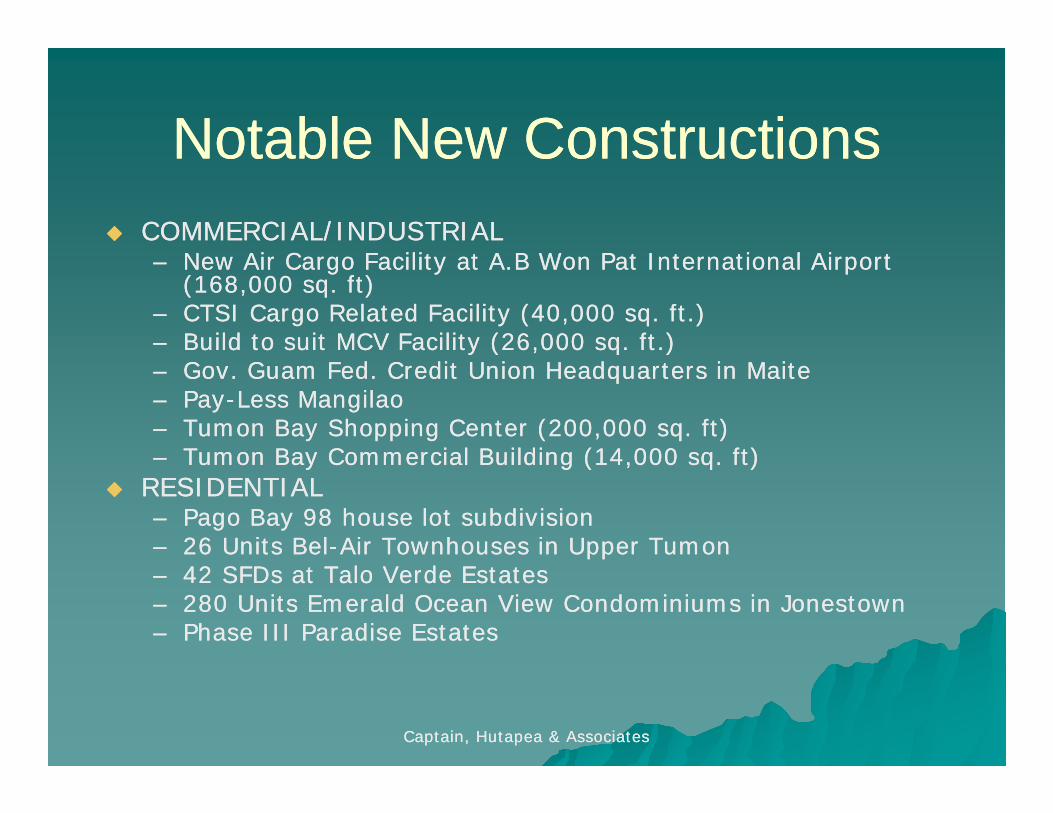
Notable New ConstructionsNotable New ConstructionsNotable New ConstructionsNotable New ConstructionsCOMMERCIAL/INDUSTRIALCOMMERCIAL/INDUSTRIAL
N Ai C F ilit t A B W P t I t ti l Ai t N Ai C F ilit t A B W P t I t ti l Ai t –– New Air Cargo Facility at A.B Won Pat International Airport New Air Cargo Facility at A.B Won Pat International Airport (168,000 sq. ft)(168,000 sq. ft)
–– CTSI Cargo Related Facility (40,000 sq. ft.)CTSI Cargo Related Facility (40,000 sq. ft.)–– Build to suit MCV Facility (26,000 sq. ft.)Build to suit MCV Facility (26,000 sq. ft.)–– Gov. Guam Fed. Credit Union Headquarters in MaiteGov. Guam Fed. Credit Union Headquarters in Maite–– PayPay--Less Mangilao Less Mangilao –– Tumon Bay Shopping Center (200,000 sq. ft)Tumon Bay Shopping Center (200,000 sq. ft)–– Tumon Bay Commercial Building (14 000 sq ft)Tumon Bay Commercial Building (14 000 sq ft)–– Tumon Bay Commercial Building (14,000 sq. ft)Tumon Bay Commercial Building (14,000 sq. ft)
RESIDENTIALRESIDENTIAL–– Pago Bay 98 house lot subdivisionPago Bay 98 house lot subdivision–– 26 Units Bel26 Units Bel--Air Townhouses in Upper TumonAir Townhouses in Upper Tumon–– 42 SFDs at Talo Verde Estates42 SFDs at Talo Verde Estates–– 280 Units Emerald Ocean View Condominiums in Jonestown280 Units Emerald Ocean View Condominiums in Jonestown–– Phase III Paradise EstatesPhase III Paradise Estates
Captain, Hutapea & AssociatesCaptain, Hutapea & Associates
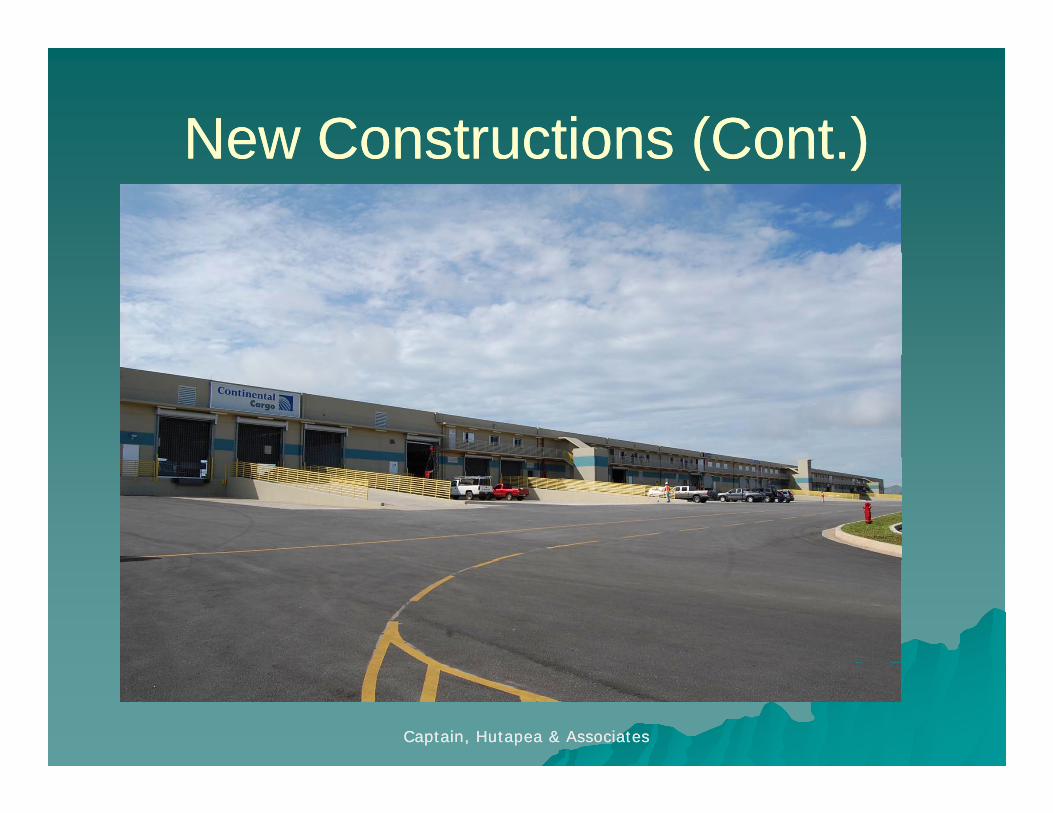
New Constructions (Cont )New Constructions (Cont )New Constructions (Cont.)New Constructions (Cont.)
Captain, Hutapea & AssociatesCaptain, Hutapea & Associates
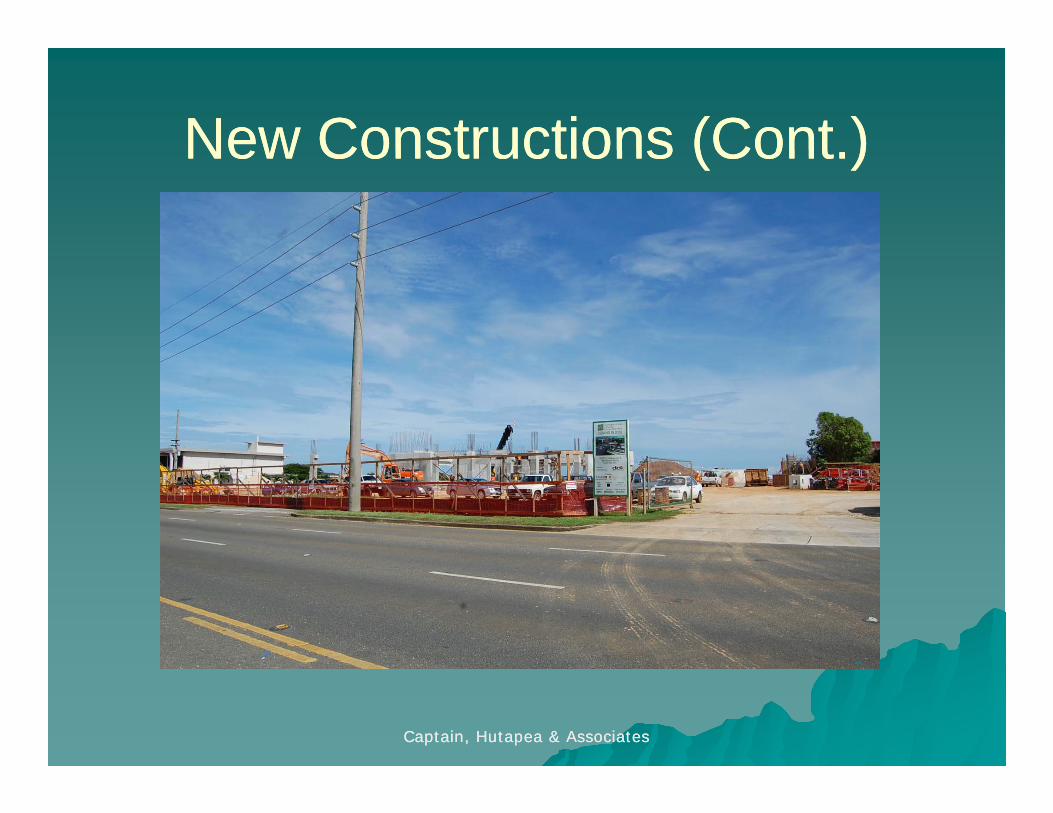
New Constructions (Cont )New Constructions (Cont )New Constructions (Cont.)New Constructions (Cont.)
Captain, Hutapea & AssociatesCaptain, Hutapea & Associates
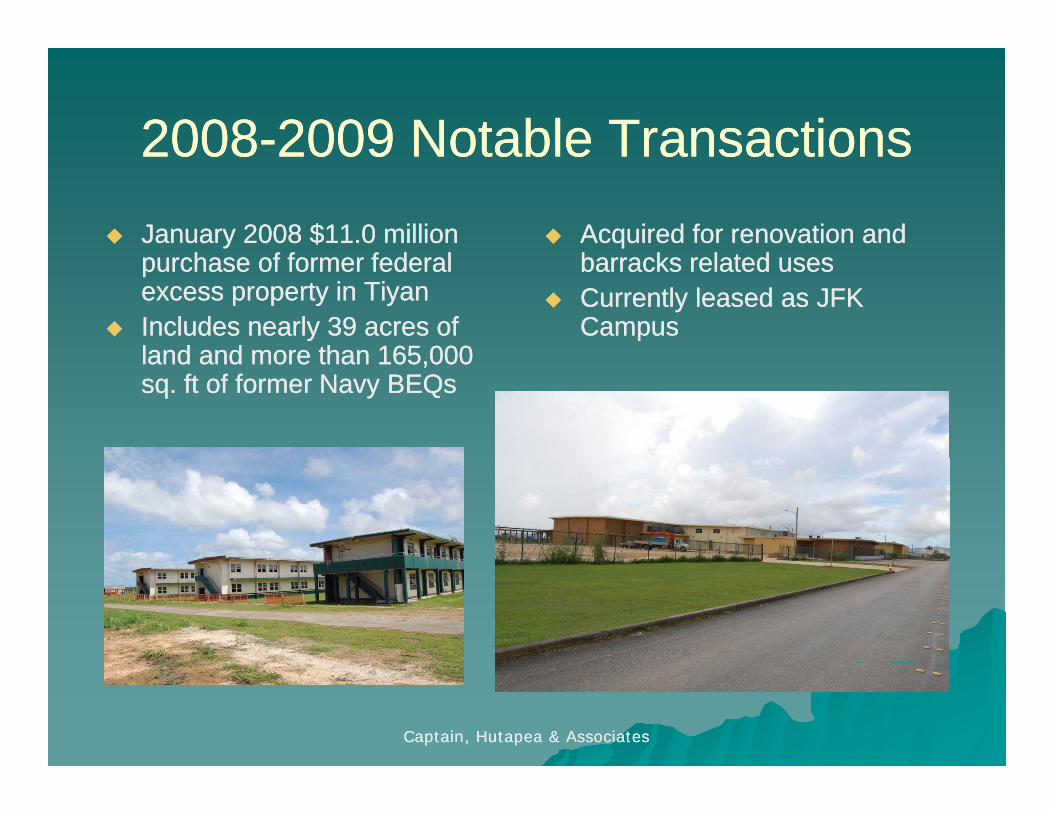
20082008--2009 Notable Transactions2009 Notable Transactions20082008 2009 Notable Transactions2009 Notable TransactionsJanuary 2008 $11.0 million January 2008 $11.0 million
h f f f d lh f f f d lAcquired for renovation and Acquired for renovation and b k l db k l dpurchase of former federal purchase of former federal
excess property in Tiyanexcess property in TiyanIncludes nearly 39 acres of Includes nearly 39 acres of land and more than 165 000land and more than 165 000
barracks related usesbarracks related usesCurrently leased as JFK Currently leased as JFK CampusCampus
land and more than 165,000 land and more than 165,000 sq. ft of former Navy BEQssq. ft of former Navy BEQs
Captain, Hutapea & AssociatesCaptain, Hutapea & Associates
20082008--2009 Notable Transactions (Cont.)2009 Notable Transactions (Cont.)20082008 2009 Notable Transactions (Cont.)2009 Notable Transactions (Cont.)
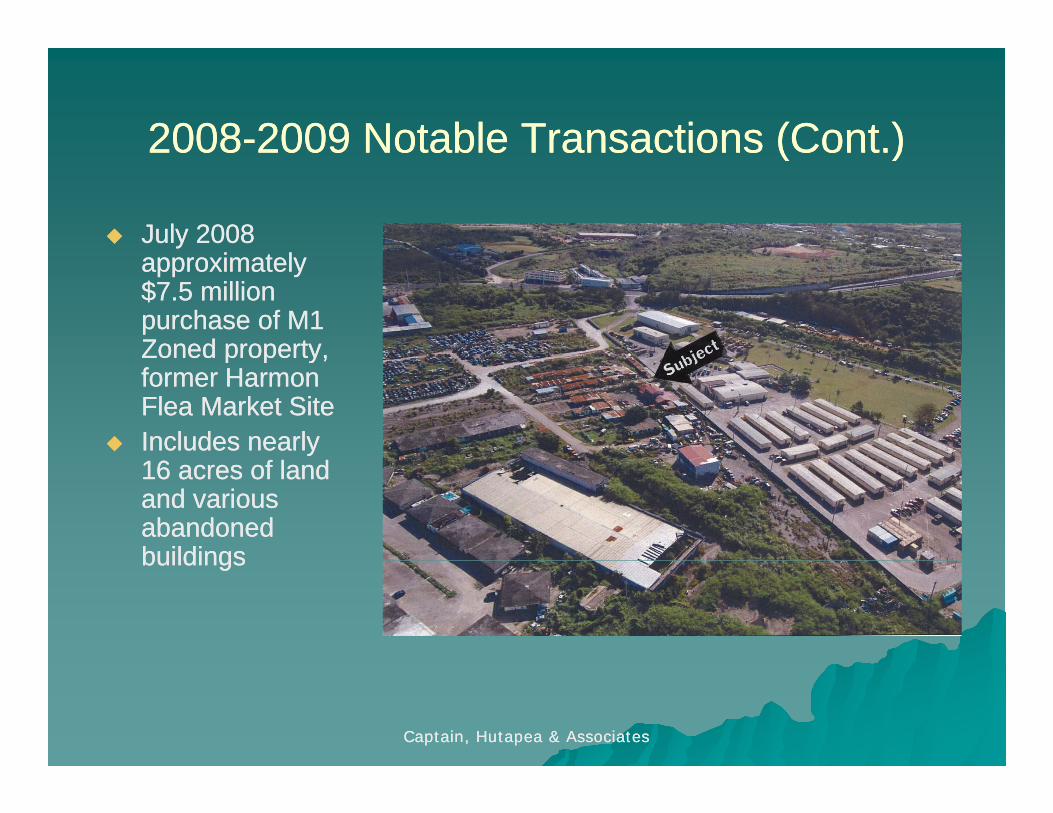
July 2008 July 2008 i li lapproximately approximately
$7.5 million $7.5 million purchase of M1 purchase of M1 Zoned property,Zoned property,Zoned property, Zoned property, former Harmon former Harmon Flea Market SiteFlea Market SiteIncludes nearly Includes nearly 16 acres of land 16 acres of land and various and various abandoned abandoned buildingsbuildingsbuildingsbuildings
Captain, Hutapea & AssociatesCaptain, Hutapea & Associates
20082008--2009 Notable Transactions (Cont.)2009 Notable Transactions (Cont.)
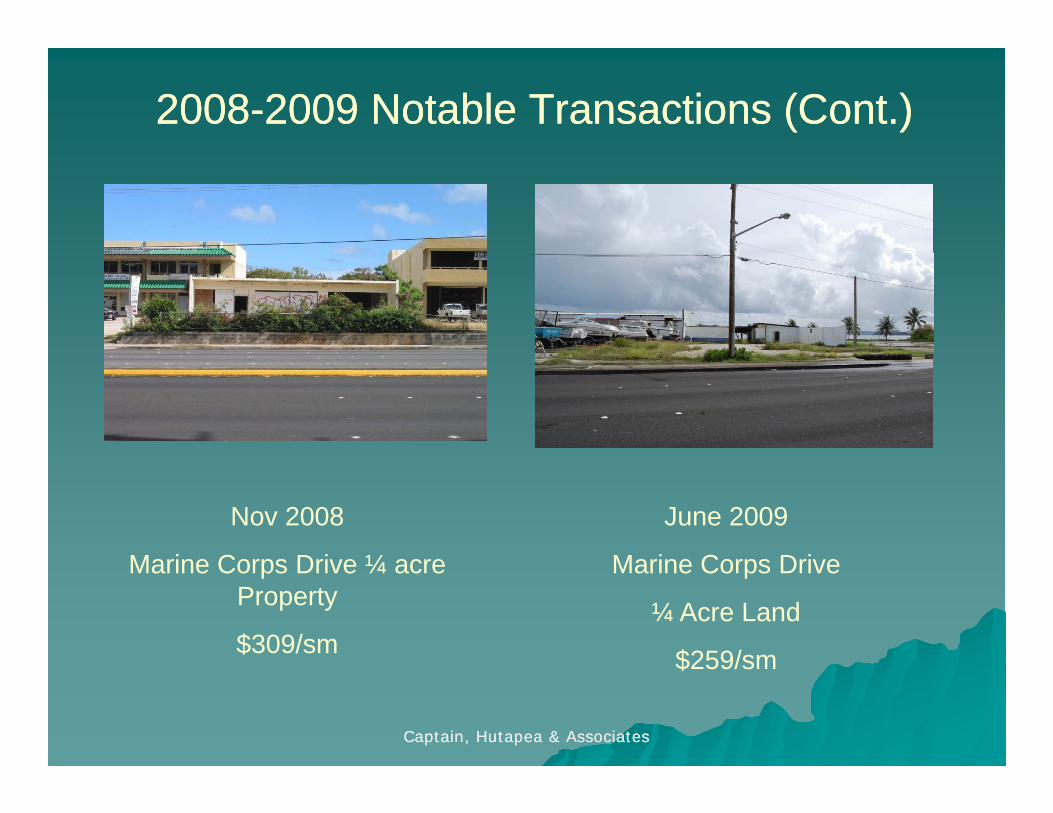
Nov 2008
Marine Corps Drive ¼ acre
June 2009
Marine Corps DriveMarine Corps Drive ¼ acre Property
$309/sm
Marine Corps Drive
¼ Acre Land
$259/sm
Captain, Hutapea & AssociatesCaptain, Hutapea & Associates
$259/sm
20082008--2009 Notable Transactions (Cont.)2009 Notable Transactions (Cont.)
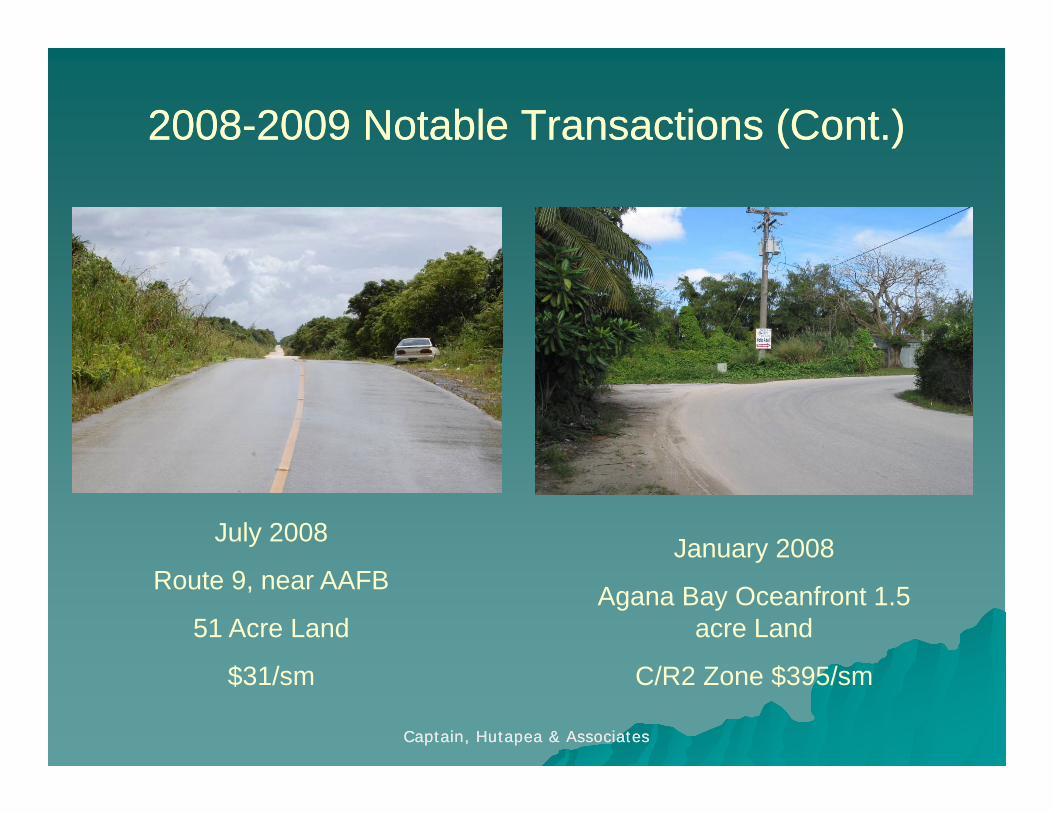
January 2008July 2008 y
Agana Bay Oceanfront 1.5 acre Land
Route 9, near AAFB
51 Acre Land
Captain, Hutapea & AssociatesCaptain, Hutapea & Associates
C/R2 Zone $395/sm$31/sm

20082008--2009 Notable Transactions (Cont.)2009 Notable Transactions (Cont.)
November 2008
10 000 sf Hornet BuildingAugust 2008
10,000 sf Hornet Building
$228/sfFormer Sunleader Building
$350/sf
Captain, Hutapea & AssociatesCaptain, Hutapea & Associates
20082008--2009 Notable Transactions (Cont.)2009 Notable Transactions (Cont.)
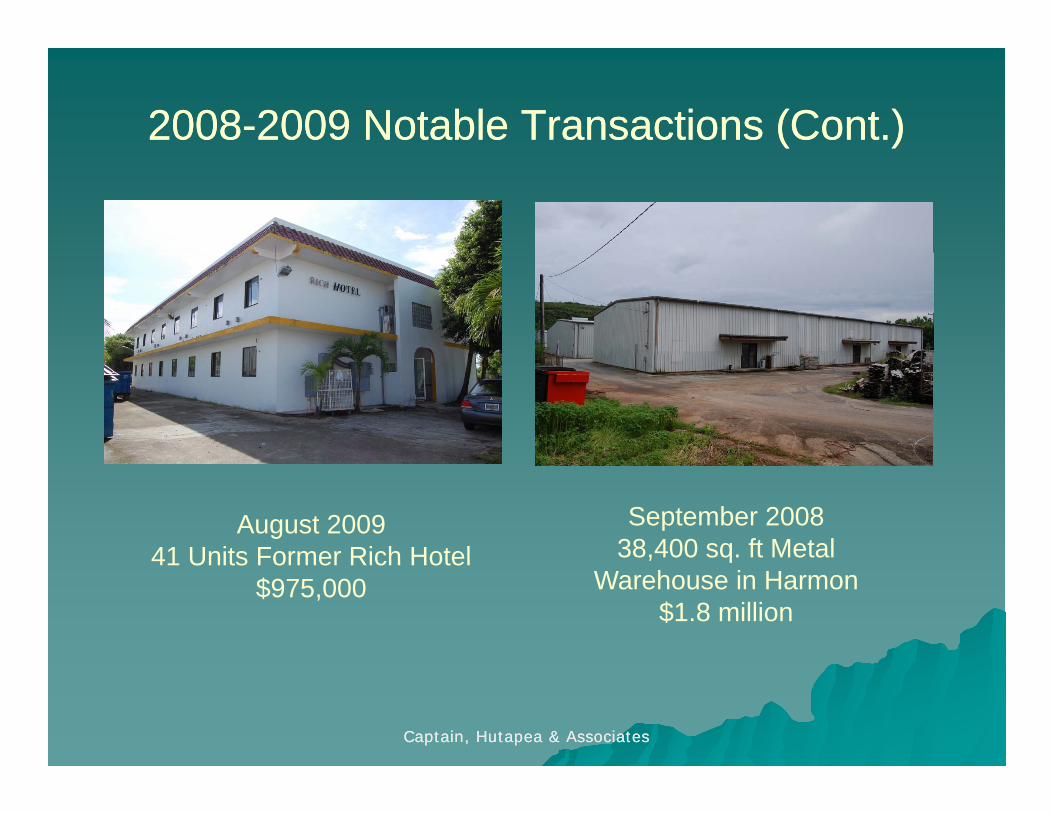
August 200941 Units Former Rich Hotel
September 200838,400 sq. ft Metal 41 Units Former Rich Hotel
$975,000, q
Warehouse in Harmon$1.8 million
Captain, Hutapea & AssociatesCaptain, Hutapea & Associates
20082008--2009 Notable Transactions (Cont.)2009 Notable Transactions (Cont.)
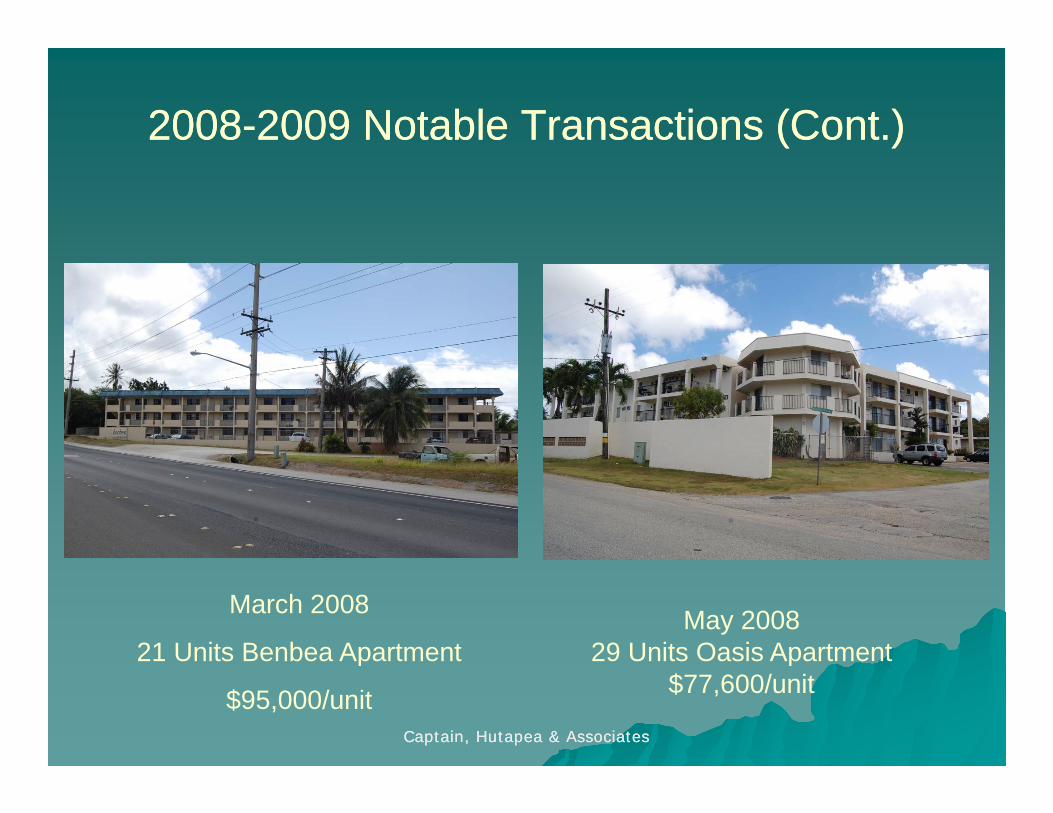
March 2008
21 Units Benbea ApartmentMay 2008
29 Units Oasis Apartment
Captain, Hutapea & AssociatesCaptain, Hutapea & Associates
p
$95,000/unit
p$77,600/unit
20082008--2009 Notable Transactions (Cont.)2009 Notable Transactions (Cont.)
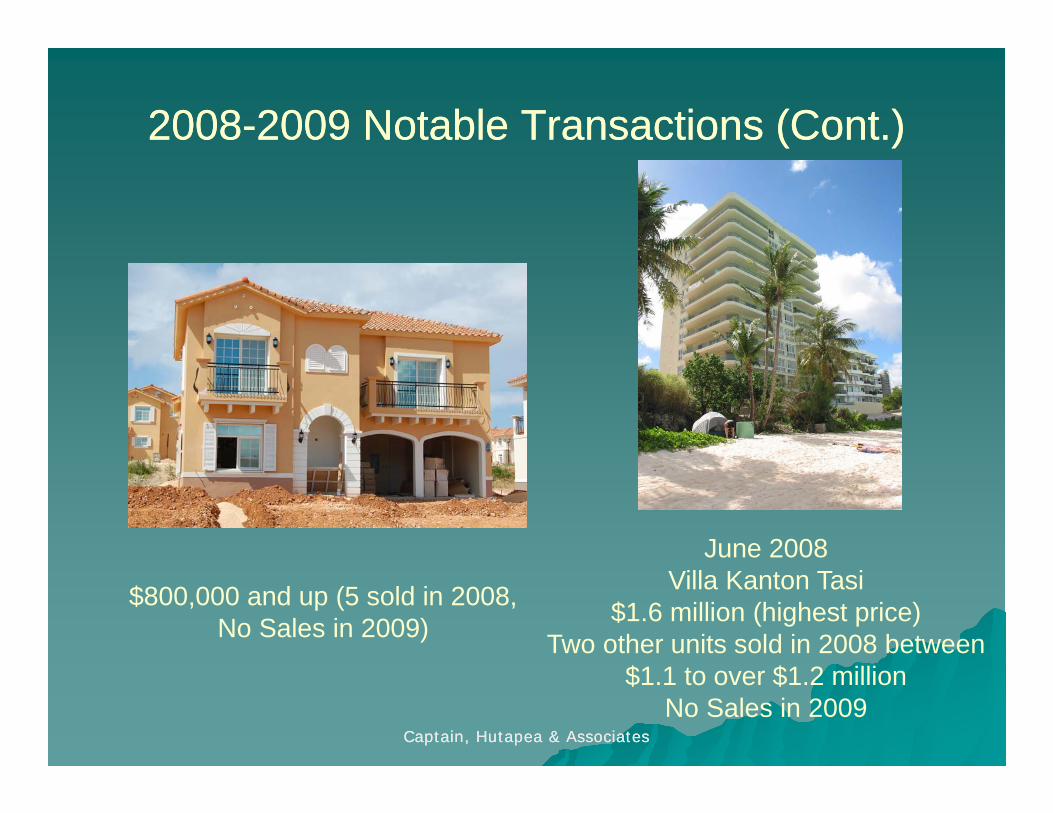
June 2008
$800,000 and up (5 sold in 2008, No Sales in 2009)
Villa Kanton Tasi$1.6 million (highest price)
Two other units sold in 2008 between
Captain, Hutapea & AssociatesCaptain, Hutapea & Associates
$1.1 to over $1.2 millionNo Sales in 2009
Price Decline: Yes?Price Decline: Yes?Price Decline: Yes?Price Decline: Yes?
Half Acre Happy Landing Road Land (Tumon)Half Acre Happy Landing Road Land (Tumon)Half Acre Happy Landing Road Land (Tumon)Half Acre Happy Landing Road Land (Tumon)–– April 2007 Transaction at $500,000: Proposed for April 2007 Transaction at $500,000: Proposed for
condominium developmentcondominium development–– May 2009 Transaction at $430,000 (14 percent May 2009 Transaction at $430,000 (14 percent
decline)decline)O f t T L dO f t T L dOceanfront Tumon LandOceanfront Tumon Land–– December 2006 Transaction at $9.0 millionDecember 2006 Transaction at $9.0 million
2009 Offer at 50 percent off2009 Offer at 50 percent off–– 2009 Offer at 50 percent off2009 Offer at 50 percent off
Captain, Hutapea & AssociatesCaptain, Hutapea & Associates
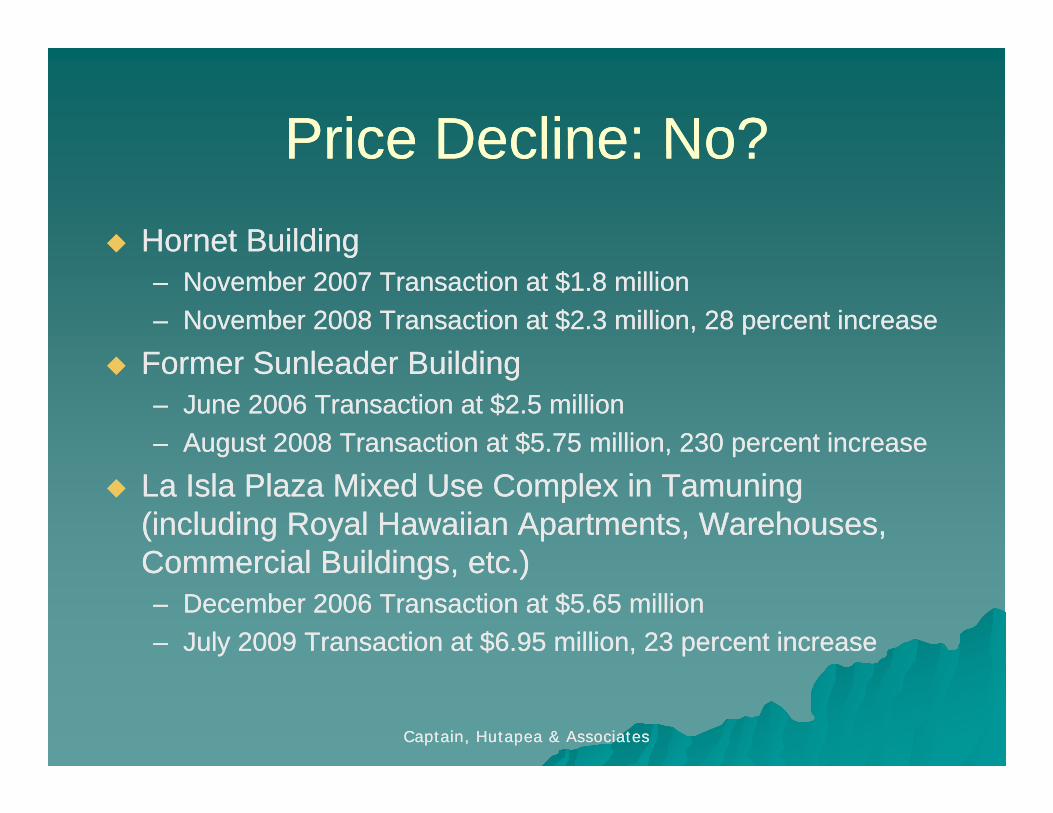
Price Decline: No?Price Decline: No?Price Decline: No?Price Decline: No?Hornet BuildingHornet Buildinggg–– November 2007 Transaction at $1.8 millionNovember 2007 Transaction at $1.8 million–– November 2008 Transaction at $2.3 million, 28 percent increaseNovember 2008 Transaction at $2.3 million, 28 percent increase
F S l d B ildiF S l d B ildiFormer Sunleader BuildingFormer Sunleader Building–– June 2006 Transaction at $2.5 millionJune 2006 Transaction at $2.5 million–– August 2008 Transaction at $5.75 million, 230 percent increaseAugust 2008 Transaction at $5.75 million, 230 percent increase
La Isla Plaza Mixed Use Complex in Tamuning La Isla Plaza Mixed Use Complex in Tamuning (including Royal Hawaiian Apartments, Warehouses, (including Royal Hawaiian Apartments, Warehouses, Commercial Buildings etc )Commercial Buildings etc )Commercial Buildings, etc.)Commercial Buildings, etc.)–– December 2006 Transaction at $5.65 millionDecember 2006 Transaction at $5.65 million–– July 2009 Transaction at $6.95 million, 23 percent increaseJuly 2009 Transaction at $6.95 million, 23 percent increase
Captain, Hutapea & AssociatesCaptain, Hutapea & Associates

SFD Median Prices SummarySFD Median Prices SummarySFD Median Prices SummarySFD Median Prices SummarySFD Percentage
Year Median Prices ChangeYear Median Prices Change2001 $129,500 -6.2%2002 $119,500 -7.7%2003 $114,995 -3.8%2004 $125,000 8.7%2005 $145 920 16 7%2005 $145,920 16.7%2006 $165,000 13.1%2007 $196,850 19.3%2007 $196,850 19.3%2008 $215,000 9.2%
2009 Ann. $187,000 -13.0%
Captain, Hutapea & AssociatesCaptain, Hutapea & Associates
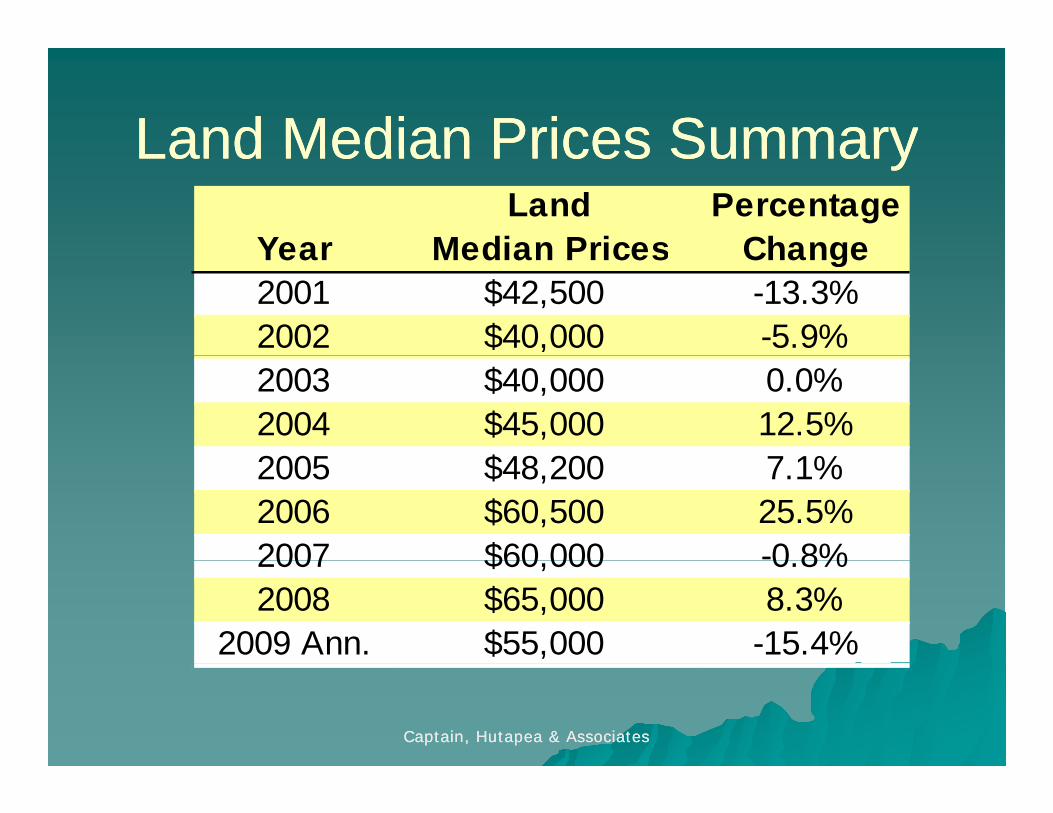
Land Median Prices SummaryLand Median Prices SummaryLand Median Prices SummaryLand Median Prices SummaryLand Percentage
Year Median Prices ChangeYear Median Prices Change2001 $42,500 -13.3%2002 $40,000 -5.9%2003 $40,000 0.0%2004 $45,000 12.5%2005 $48 200 7 1%2005 $48,200 7.1%2006 $60,500 25.5%2007 $60 000 -0 8%2007 $60,000 0.8%2008 $65,000 8.3%
2009 Ann. $55,000 -15.4%
Captain, Hutapea & AssociatesCaptain, Hutapea & Associates
Future ProjectionsFuture ProjectionsFuture ProjectionsFuture Projections
Military build up driven growthMilitary build up driven growthMilitary build up driven growthMilitary build up driven growthIndustrial: GrowthIndustrial: GrowthCommercial: Quality SpaceCommercial: Quality SpaceCommercial: Quality SpaceCommercial: Quality SpaceResidential: affordability, abundant Residential: affordability, abundant inventory of high endinventory of high endinventory of high endinventory of high endResidential MFDs: Current rent still Residential MFDs: Current rent still does not warrant new constructiondoes not warrant new constructiondoes not warrant new constructiondoes not warrant new constructionTourist related: Private public Tourist related: Private public partnershippartnership
Captain, Hutapea & AssociatesCaptain, Hutapea & Associates
partnershippartnership