Embed Size (px)
Citation preview

Domestic Competitive Market Review 2004 Office of Gas and Electricity Markets 79 April 2004
4. Price and non-price offers
4.1. This chapter considers a number of issues about the prices that domestic
customers pay for their gas and electricity supply and includes a discussion
about factors other than price (‘non-price offers’) that might influence customers’
decisions to switch.
4.2. The chapter starts by explaining why price and non-price offers are an important
factor in assessing the development of competition in the domestic gas and
electricity sectors. It then discusses several key issues that have been raised as
areas of concern:
♦ whether domestic customers are benefiting from changes in wholesale prices
to the extent that would be expected in a competitive environment
♦ what the implications are of ex-PESs charging their in-area customers more
than customers in other areas, (‘two tier pricing’) bearing in mind that that
this is a commercial decision taken by those suppliers and not the result of
any regulatory requirement, and
♦ whether all categories of customer (especially prepayment customers, those
in Scotland and customers with dynamically teleswitched meters) are
benefiting to the same extent from competition.
4.3. The chapter then discusses what the results of the pricing analysis mean for the
development of competition, including the potential impact on new entrants.
The section on non-price competition discusses some of the different types of
offers available and how these could be analysed in the context of the
development of competition.
Background
4.4. Information from customer surveys (see Chapter 2) and the analysis of the drivers
of switching (see Chapter 3) show that price is the main factor that customers
consider when deciding whether to switch and to whom. The price on a
customer’s bill comprises a number of different costs, for example:
♦ the cost of buying gas and electricity in the wholesale market
Domestic Competitive Market Review 2004 Office of Gas and Electricity Markets 80 April 2004
♦ the network charges that a supplier must pay for electricity distribution,
electricity transmission and gas transportation (including the costs associated
with transmission and distribution losses and shrinkage on the gas network)1,
and
♦ suppliers’ other costs, for example those arising from marketing, advertising,
call centres, metering charges, billing systems, etc.
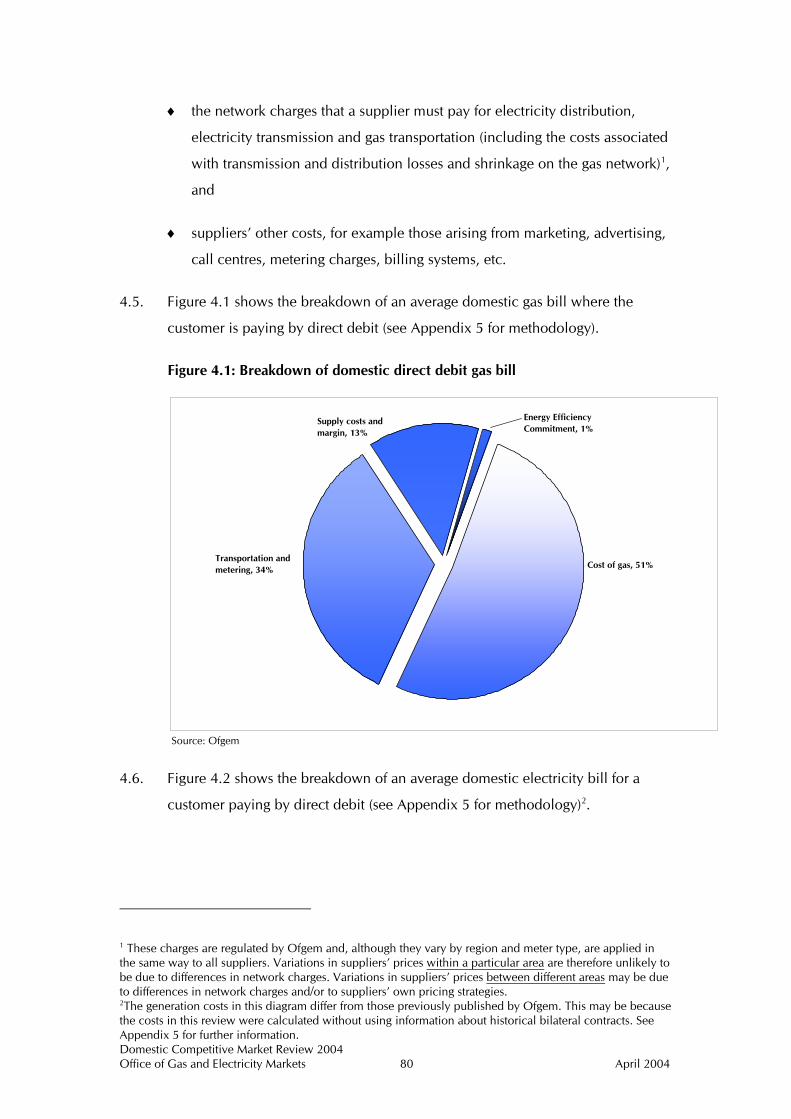
4.5. Figure 4.1 shows the breakdown of an average domestic gas bill where the
customer is paying by direct debit (see Appendix 5 for methodology).
Figure 4.1: Breakdown of domestic direct debit gas bill
Cost of gas, 51%Transportation and metering, 34%
Supply costs and margin, 13%
Energy Efficiency Commitment, 1%
Source: Ofgem
4.6. Figure 4.2 shows the breakdown of an average domestic electricity bill for a
customer paying by direct debit (see Appendix 5 for methodology)2.
1 These charges are regulated by Ofgem and, although they vary by region and meter type, are applied in the same way to all suppliers. Variations in suppliers’ prices within a particular area are therefore unlikely to be due to differences in network charges. Variations in suppliers’ prices between different areas may be due to differences in network charges and/or to suppliers’ own pricing strategies. 2The generation costs in this diagram differ from those previously published by Ofgem. This may be because the costs in this review were calculated without using information about historical bilateral contracts. See Appendix 5 for further information.

Domestic Competitive Market Review 2004 Office of Gas and Electricity Markets 81 April 2004
Figure 4.2: Breakdown of domestic direct debit electricity bill
Generation, 37%
Distribution and metering, 25%
Supply costs and margin, 26%
Energy Efficiency Commitment, 1%
Renewables Obligation, 2%
Transmission, 3%
VAT, 5%
Balancing Services Use of System, 1%
Source: Ofgem
4.7. Ofgem monitors suppliers’ prices across Great Britain. Prices are determined by
market conditions and analysing prices can provide information about a number
of features of competition (which are to some extent inter-dependent). For
example:
♦ cost savings made by a company are usually passed through to customers in
the form of cheaper prices. However, the extent of this pass through depends
on the market structure, with less pass through by a monopolist than in a
competitive market
♦ more efficient companies will be able to pass on their efficiency savings to
customers. These efficiencies may arise because of the size of the company
or because of some innovation by the company
♦ the level of prices provides a “signal” to potential entrants about the scope
for profitable entry (providing entry barriers are not too high), and
♦ prices can indicate whether some companies are able to set their prices
independently of their competitors and customers, thereby indicating that
they have market power.

Domestic Competitive Market Review 2004 Office of Gas and Electricity Markets 82 April 2004
4.8. Even though gas and electricity prices vary between suppliers, the gas or
electricity supplied to customers is identical, whoever the supplier is. In this
type of market where the products are ‘functionally identical’, suppliers may try
to differentiate themselves from their competitors by competing on price or non-
price (or both). Non-price offers may include add-ons such as supermarket
bonus points or Air Miles or links with third parties such as charities. Although
customer survey information indicates that many of these issues are not
particularly important compared to price, Ofgem is interested in the influence
they may have on switching behaviour.
Terminology and data
4.9. This section explains some of the terms used in this Chapter. The Glossary at the
end of this document explains other concepts that may be useful in
understanding the issues raised.
♦ DUoS – Distribution Use of System charges – the charges paid by electricity
suppliers to electricity distribution companies
♦ National Balancing Point (‘NPB’) - a notional position used as point of
reference for pricing. It is not necessarily a physical location, but a
hypothetical position which can be used as reference. When a generator or
gas producer sells electricity or gas at the NBP it has already paid network
access/entry charges
♦ non-price offers – for the purposes of this review, this term refers to a broad
range of inducements offered by a supplier seeking to alter a customers’
valuation of functionally identical products (ie gas and electricity)
♦ TNUoS –Transmission Use of System charges – the charges paid by
electricity suppliers to National Grid Transco for use of the electricity
transmission system
♦ BSUoS - Balancing Service Use of System Charges include: the costs of the
Balancing Mechanism, Balancing Services Contract costs, National Grid
incentive payment (or receipt) and internal costs of the System Operator,
National Grid, and

Domestic Competitive Market Review 2004 Office of Gas and Electricity Markets 83 April 2004
♦ two tier pricing – is the commercial decision taken by ex-PESs to charge
lower prices for customers out-of-area than in-area.
4.10. Throughout this document, Ofgem uses a medium gas consumption level of
19,050kWh a year. In February 2004 energywatch stated that it would use a
medium gas consumption level of 20,500kWh a year. The way in which the
percentage savings are presented in this document and its appendices means
that savings can be analysed at any consumption level. Where a range of
monetary savings are presented, the difference in the consumption levels does
not materially affect the values presented. In addition, maintaining the
19,050kWh level for the purposes of this review provides consistency with
previous publications.
Key facts and trends
4.11. Key findings presented in this chapter are:
♦ on the basis of the analysis carried out for this review, changes in
electricity retail prices appear to be largely unresponsive to changes in
electricity forward wholesale prices. There may be a number of reasons
for this and they are considered in more detail in this chapter
♦ two-tier pricing is more varied in its incidence and extent than is often
implied. In particular it seems that not all suppliers are competing
vigorously out-of-area for prepayment customers
♦ savings are available for customers who have not switched (and to a
lesser extent for those that have switched) for all payment types and at
across consumption levels, and
♦ the differential between electricity and gas prepayment and credit prices
continues to narrow.

Domestic Competitive Market Review 2004 Office of Gas and Electricity Markets 84 April 2004
Analysis
Responsiveness of domestic retail prices to wholesale price
changes
4.12. In a competitive market, prices will tend to reflect the cost of supply. In the
electricity supply sector, these costs will include a range of bought in costs,
including generation, transmission and distribution, as well as operating costs for
the supply business (eg metering, meter reading, billing, customer service and
marketing). Of these costs, fuel costs represent the single largest component
(approximately 37 per cent of an electricity bill and 51 per cent of a gas bill) of
the cost to serve a domestic customer.
4.13. Since the introduction of NETA in March 2001, debate has focussed on whether
domestic electricity customers have benefited fully from significant reductions in
wholesale prices. The Public Accounts Committee (PAC)3 questioned recently
whether domestic customers had seen reductions consistent with reported
reductions in wholesale prices4.
4.14. A key criticism is that when electricity wholesale prices fall, suppliers do not
change domestic electricity prices as quickly (or by as much) as they do when
wholesale prices increase.
4.15. This debate continues, particularly in light of recent significant increases in
wholesale electricity prices. Between May 2002 and January 2004, annual
baseload forward prices increased by 30 per cent. Many suppliers have cited the
higher forward price as the main reason for increasing domestic electricity retail
price increases.
4.16. This section provides an initial assessment of the criticism that domestic prices
have not moved in line with wholesale prices. This is only a preliminary
analysis and Ofgem is likely to carry out additional work on this issue in the
future.
3 House of Commons Committee of Public Accounts: The new electricity trading arrangements in England and Wales, Second report of Session 2003-04. 4 PAC commented that reductions in prices for I&C customers were consistent with the fall in wholesale prices.

Domestic Competitive Market Review 2004 Office of Gas and Electricity Markets 85 April 2004
4.17. The analysis:
♦ considers the relationship between wholesale and retail prices, including the
long run ‘responsiveness’ of retail prices to wholesale prices, and whether
domestic supply prices are equally responsive to both increases and
decreases in wholesale prices, and
♦ considers related factors that might influence how responsive retail prices are
to wholesale prices (eg how suppliers may structure their energy purchasing
to match their customer portfolio, and that they might smooth prices for
domestic customers).
4.18. This analysis alone is insufficient to determine whether supply markets are
competitive but, within the limits of the available data, it will provide some
insights into whether supply competition is securing the full pass through of
wholesale decreases as well as increases in costs.
4.19. This analysis considers gas and electricity prices separately. First, it identifies and
explains relevant wholesale and retail price data. It then provides a descriptive
analysis of the relationship between wholesale and retail prices. Next it
presents and discusses the results of a more robust formal analysis carried out by
Frontier using econometric regression methods. (Details of the methodology
and specification for the regression analysis are in Appendix 6.)
4.20. The section then considers possible explanations for the results of the analysis. It
concludes by outlining areas where Ofgem may expand and refine the analysis
in future.
Electricity
Methodology and data
4.21. For the analysis, a wholesale electricity price series from the period April 1999
to January 2004 is used, comprising:
♦ annual baseload (daily) prices, and

Domestic Competitive Market Review 2004 Office of Gas and Electricity Markets 86 April 2004
♦ annual peak (daily) prices5.
4.22. Annual baseload and peak prices are forward prices (ie prices paid today for the
delivery of an annual wholesale product in the future).
4.23. There are two main reasons for choosing forward wholesale prices for the
analysis:
♦ forward prices reflect the market’s expectation of the additional energy cost
to meet demand for an additional customer. In that sense, they provide a
good measure of prices (and therefore costs) that are faced by both the
expansion of existing suppliers and entry by new suppliers, and
♦ suppliers typically cite increases or decreases in the forward price as the
main cost driver for raising or lowering retail prices. Ofgem will use this
series to examine whether this stated cost driver is in fact relevant in
explaining retail price movements.
4.24. Retail prices were estimated from average nominal direct debit customer bills.
Ofgem has retail prices for the 14 ex-PES regions on a monthly basis, from June
2000 to January 20046. Information on the price charged by the ex-PES, the best
offer and the average price were used. For the purpose of better capturing the
impact of wholesale prices on the competitively driven elements of the domestic
price, the TNUoS and DUoS components of domestic electricity prices were
removed.
4.25. Direct debit prices were used because price controls were lifted from these
prices at a relatively early stage of competition (April 2000). Direct debit is also
characterised by higher levels of switching activity, suggesting that competition
for this group of customers is the most vigorous of all three major payment types.
It would therefore be reasonable to expect direct debt prices to be most
responsive to changes in costs/competitive forces.
5 Wholesale price data is sourced from Ofgem and John Hall and Associates. 6 Retail price data is obtained from several sources. Data from: April 1999 to May 2000 is taken from Which? Price fact sheets; June 2000 – August 2001 is taken from Ofgem pricing fact sheets; October 2001 to September 2003 is taken from energywatch pricing fact sheets, June 2003 onward, is sourced by Ofgem.
Domestic Competitive Market Review 2004 Office of Gas and Electricity Markets 87 April 2004
4.26. The analysis also used several domestic price series in order to test whether the
prices of ex-PESs are more or less responsive than those of other suppliers7:
♦ the unweighted average of ex-PESs in-area prices
♦ the unweighted average of minimum prices available in each region, and
♦ the unweighted average of regional average prices.
Descriptive analysis
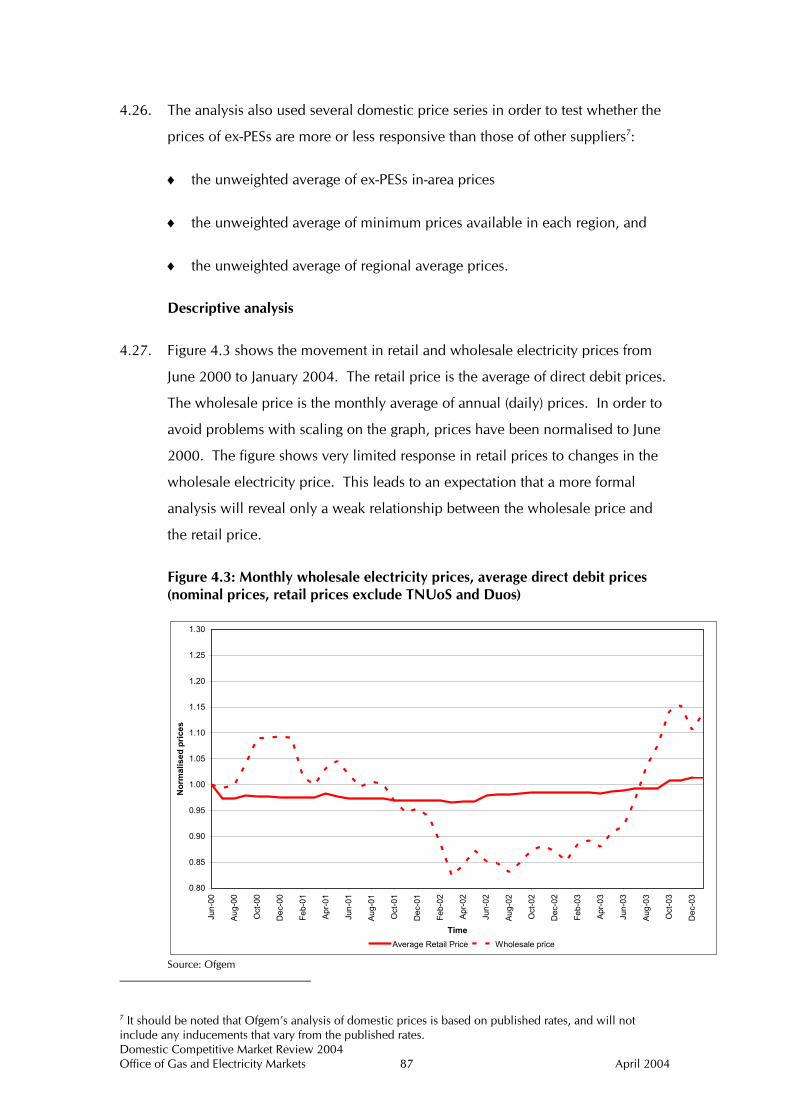
4.27. Figure 4.3 shows the movement in retail and wholesale electricity prices from
June 2000 to January 2004. The retail price is the average of direct debit prices.
The wholesale price is the monthly average of annual (daily) prices. In order to
avoid problems with scaling on the graph, prices have been normalised to June
2000. The figure shows very limited response in retail prices to changes in the
wholesale electricity price. This leads to an expectation that a more formal
analysis will reveal only a weak relationship between the wholesale price and
the retail price.
Figure 4.3: Monthly wholesale electricity prices, average direct debit prices (nominal prices, retail prices exclude TNUoS and Duos)
0.80
0.85
0.90
0.95
1.00
1.05
1.10
1.15
1.20
1.25
1.30
Jun-
00
Aug-
00
Oct
-00
Dec
-00
Feb-
01
Apr-
01
Jun-
01
Aug-
01
Oct
-01
Dec
-01
Feb-
02
Apr-
02
Jun-
02
Aug-
02
Oct
-02
Dec
-02
Feb-
03
Apr-
03
Jun-
03
Aug-
03
Oct
-03
Dec
-03
Time
Nor
mal
ised
pric
es
Average Retail Price Wholesale price
Source: Ofgem
7 It should be noted that Ofgem’s analysis of domestic prices is based on published rates, and will not include any inducements that vary from the published rates.

Domestic Competitive Market Review 2004 Office of Gas and Electricity Markets 88 April 2004
Regression analysis
4.28. The key findings of the regression analysis are:
♦ changes in domestic retail electricity prices appear to be only weakly related
to changes in the wholesale electricity price, with the percentage change in
retail prices reflecting only six per cent of the change in the wholesale price8.
(With full pass through, changes in the retail price would reflect 37 per cent
of the change in the wholesale price (since wholesale prices represent 37 per
cent of the customer bill, see Figure 4.2), and
♦ in as much as they do reflect changes, domestic prices are as responsive to
wholesale price decreases as they are to wholesale price increases in terms
of the size of the response. (Further analysis is needed to identify whether
the timing of the response differs.)
Additional checks
4.29. Ofgem carried out a ‘sense check’ of these results to see whether the formal
econometric results match observed price movements over the last four years.
To provide a more intuitive feel for the responsiveness, consider the following
table which compares the change in prices for two periods, one in which
wholesale prices are falling and one in which wholesale prices are rising.
4.30. In the period from June 2000 to April 2002, wholesale prices fell approximately
15 per cent, while retail prices fell 2 per cent. From August 2002 to January
2004, annual baseload prices rose 30 per cent, while the average direct debit
price rose 5 per cent.
4.31. Table 4.1 looks at these recent domestic electricity price changes. Note
however, that these prices are final prices and hence do not exclude network
charges which would have varied across regions and over time. The retail price
used is therefore different to that used for the formal analysis.
8 That is, if wholesale price changed by 100 per cent, retail prices would change by 6 per cent.

Domestic Competitive Market Review 2004 Office of Gas and Electricity Markets 89 April 2004
Table 4.1: Additional check – Supplier direct debit price changes since June 2000
June 2000 April 2002
March 2004
June 2000-July 2002
June 2002-March 2004
bills bills bills % change % change
Average retail price 233.34 225.86 240.32 -3 6 Wholesale price -18 31 Retail/Wholesale ratio
18 21
Formal result 6 6 Source: Ofgem
4.32. Table 4.1 illustrates that retail price falls are roughly half the size of increases for
wholesale price for the period between June 2000 and March 2004. Dividing
the retail price change by the corresponding wholesale price change for that
period shows that retail prices increases have been passed at a slightly higher
rate than for price reductions (18 per cent compared to 21 per cent).
4.33. This result suggests a higher degree of pass through than the formal analysis.
One reason for this difference could be the inclusion of TNuoS and DUoS,
which may have smoothed underlying price movements.
Gas
Methodology and data
4.34. The analysis used daily wholesale prices from March 1996 to February 2004
using annual NBP prices.
4.35. Ofgem has retail prices for licensed gas suppliers on a monthly basis, from June
2000 to February 2004. This information was used to estimate the direct debit
prices charged by BGT, the best offer and the average price. For the purposes of
better capturing the impact of the wholesale prices on the competitively driven
elements of the domestic price, the average transportation charge in Great
Britain has been subtracted from these charges.
4.36. As with electricity, if retail prices are responsive to movements in wholesale
prices, then the relationship would be strongest for direct debit prices, since
competition for these customers is the most intense.

Domestic Competitive Market Review 2004 Office of Gas and Electricity Markets 90 April 2004
Descriptive analysis
4.37. Figure 4.4 shows the movement of the retail and wholesale gas price over the
period analysed. The retail price is the average of direct debit prices. Prices
have been normalised to June 2000. The figure shows a greater response in gas
retail prices to changes in the wholesale price than in electricity. This leads to
an expectation that a more formal analysis will reveal a more significant
relationship between the retail and wholesale gas prices than the corresponding
electricity analysis.
Figure 4.4: Monthly NBP gas prices, direct debit gas prices (nominal, retail price excludes transportation charges)
0.80
0.85
0.90
0.95
1.00
1.05
1.10
1.15
1.20
1.25
1.30
Jun-
00
Aug
-00
Oct
-00
Dec
-00
Feb-
01
Apr-
01
Jun-
01
Aug-
01
Oct
-01
Dec
-01
Feb-
02
Apr-
02
Jun-
02
Aug
-02
Oct
-02
Dec
-02
Feb-
03
Apr
-03
Jun-
03
Aug
-03
Oct
-03
Dec
-03
Nor
mal
ised
pric
es
Average Retail Price Wholesale Price
Source: Ofgem
Regression analysis
4.38. Key findings of the regression analysis are:
♦ that changes in domestic retail gas prices appear to be fairly strongly related
to changes in wholesale gas prices. In the long run, the percentage change in
the retail price is 43 per cent of the change in the wholesale price. In a
perfectly competitive market, changes in the retail price would reflect 51 per
cent of the change in the wholesale price (since wholesale prices represent
51 per cent of the customer bill) (see Figure 4.1), and

Domestic Competitive Market Review 2004 Office of Gas and Electricity Markets 91 April 2004
♦ there is a small asymmetry in the way in which the size of domestic price
changes respond to wholesale prices but Ofgem does not consider that this
is statistically significant. (As with electricity, further analysis is needed to
identify whether the timing of the response differs.)
Interpretation of results
4.39. A key question is why domestic electricity prices appear to be largely
unresponsive to movements in the forward electricity price.
4.40. Ofgem considers that a number of alternative interpretations could plausibly
explain the lack of relationship between retail electricity prices and wholesale
prices. These include:
♦ suppliers may not price solely according to forward prices, in particular
complex contract structures may affect how suppliers price their overall
domestic portfolio
♦ vertical integration may dilute retail price responsiveness
♦ suppliers ‘smooth’ prices to domestic customers
♦ it is too early to assess whether ‘shocks’ (such as NETA) have come too close
together, relative to the pace at which one would expect prices to revert to
pattern, and
♦ suppliers’ retail prices may be influenced by their competitors’ prices more
than by actual changes in wholesale costs.
The forward price influence on retail price levels
4.41. Retail prices may not be solely determined by forward prices but may better
reflect the weighted average cost of energy (WACOE), which will include not
just forward contract prices. In electricity, suppliers will purchase many
individual contracts to meet an aggregated demand profile for their customers.
From this single portfolio of contracts, the WACOE is calculated and reflected in
the retail price, representing the average energy cost of serving a typical
customer.

Domestic Competitive Market Review 2004 Office of Gas and Electricity Markets 92 April 2004
4.42. Suppliers may enter the contracts that make up the WACOE either internally, or
they may minimise wholesale price risk by entering into risk management
contracts with trading affiliates. The supplier relies on the trading arm to hedge
price risk on its behalf. Retail prices would then tend to reflect the risk-
managed, hedged price rather than the forward price.
4.43. A number of suppliers cite forward price movements as the main driver for
changing retail prices and it seems likely that if suppliers are indeed exposed to
a wholesale risk that they would increase their retail prices. However, the
evidence presented in this review does not appear to support suppliers’ claims.
Vertical integration9
4.44. All ex-PESs are within vertically integrated groups in electricity; BGT is vertically
integrated in gas. Suppliers within these vertically integrated groups may face
fewer incentives to adjust retail prices significantly in response to movements in
wholesale prices, knowing that overall profits for the group will remain largely
unchanged. That is, if wholesale prices increase, suppliers may choose not to
increase retail prices, recognising that lower profits in the retail supply business
will be offset by higher profits upstream (ie generation). This will, however, lead
to lower margins and profitability in the supply business. The company may
adjust retail prices to increase profits from wholesale activities whilst leaving
supply profitability unchanged (assuming that other competitors also adjust their
prices to reflect increased wholesale costs). If wholesale prices have increased
then the price at which companies will consider entering the market will also
have increased.
4.45. Fixed effects, for example, are a significant component of switching behaviour
which could be a factor in suppliers choosing not to adjust retail prices.
Suppliers could decide to maintain higher prices when wholesale prices are
falling because the supplier’s fixed effects mean that some customers will not
switch.
9 The comments on vertical integration do not imply any Ofgem view or specific knowledge that consideration of group positions is taken into account in these businesses.

Domestic Competitive Market Review 2004 Office of Gas and Electricity Markets 93 April 2004
Suppliers ‘smooth’ prices to domestic customers
4.46. Suppliers may believe that domestic customers do not like frequent price
changes and may switch supplier in response to a price increase. Suppliers may
therefore ‘smooth’ prices to domestic customers to try to reduce the incentive to
switch away. Suppliers that do not change retail prices immediately in response
to changes in wholesale prices absorb the changes in their margins for a period
of time.
4.47. If a supplier has a choice between first raising prices and then lowering prices in
response to wholesale price movements – or simply leaving prices unchanged at
the average price - it may choose not to adjust prices at all.
4.48. Linked to this approach is also a possible interaction with direct debit charging.
Because consumption is higher in winter than in summer, a fixed direct debit
price provides income for a supplier so that it over-recovers in summer (when
consumption is low) and the opposite in winter. Suppliers may therefore wait
until an optimal point in the year to change the retail price.
4.49. If supplier margins, rather than prices, are adjusting to movements in the
wholesale price this could be considered as a competitive outcome. More recent
wholesale price increases have placed pressure on margins, since retail prices
have not adjusted to fully reflect the increase. If supplier margins are being
squeezed, customers may benefit to the extent that increasing costs are not
passed through to them immediately.
‘Shocks’ have influenced price changes
4.50. NETA started in March 2001 and it may be that its introduction has not yet had a
significant impact on the way in which changes in wholesale prices are passed
through to domestic customers. However, from inspection of the data series used
in the analysis, there was no visible structural break in the data at the
introduction of NETA. This suggests that NETA may have been factored into
wholesale and retail prices before its actual operation, perhaps from the
announcement in October 1998 of its final design.

Domestic Competitive Market Review 2004 Office of Gas and Electricity Markets 94 April 2004
Influence of competitors’ prices
4.51. The analysis in Chapter 3 indicated the importance of relative prices and that
may be indicative of inadequate incentives to constrain the prices of those
suppliers with the strongest fixed effects.
Possible additional analysis
4.52. Ofgem considers that the analysis presented in this chapter is a preliminary
analysis, which can be built upon and developed in the future as new evidence
is gathered and refinements to the methodology are explored. These may
include:
♦ whether wholesale gas and electricity prices jointly or separately explain
movements in dual fuel prices
♦ an examination of how suppliers contract directly with generators for
bespoke contracts. This may provide more information about the true cost of
purchasing energy for domestic customers
♦ an examination of the lag between wholesale and retail price changes within
the model specifications
♦ extending time series data back to identify possible longer term relationships
not present in the existing series, and
♦ comparing pass through for non-domestic customers to that for domestic
customers.
What does two-tier pricing mean for domestic electricity
supply competition?
4.53. The commercial decision taken by ex-PESs to charge lower prices for customers
out-of-area than in-area is referred to as ‘two-tier pricing’. The chief implication
of this pricing strategy is that domestic electricity supply customers who switch
pay lower prices than non-switchers or customers who switch back to the ex-
PES. Two-tier pricing is not generally seen in gas.

Domestic Competitive Market Review 2004 Office of Gas and Electricity Markets 95 April 2004
4.54. The difference between the price paid by an in-area customer compared to an
out-of-area customer has been the subject of debate, with some people
questioning whether this outcome benefits domestic electricity customers.
4.55. For instance, the Public Accounts Committee (PAC) recently commented on the
implication of this pricing strategy for in-area customers, saying “Customer
loyalty is penalised. Customers who have stayed loyal have benefited much less
from competition and pay much more than those who have switched”10.
4.56. This section will present pricing data to quantify the incidence and extent of
two-tier pricing. It also considers some key hypotheses that could explain
whether two-tier pricing strategies appear transitional or more permanent.
Two tier pricing: background
4.57. The incidence of two-tier pricing can be traced back to market opening, which
started in September 1998 and was finalised in April 1999. Prior to domestic
electricity market liberalisation, domestic electricity customers could only be
supplied by one of 14 regional monopoly suppliers, each with an exclusive
franchise to supply customers in their franchise region. Monopoly regional
prices were regulated by price controls.
4.58. Upon market opening, any licensed supplier could supply any domestic
electricity customer throughout Great Britain. This led to supply competition
for all customers across all 14 ex-PES regions. To attract new customers, many
suppliers chose to offer lower prices out-of-area than those offered in-area under
price controls.
4.59. From April 2002, price controls on in-area prices were lifted on the grounds that
supply competition was sufficiently developed, that the detriments from further
controls were likely to outweigh the benefits.
10 The new electricity arrangements in England and Wales, Second Report, 16 December 2003.

Domestic Competitive Market Review 2004 Office of Gas and Electricity Markets 96 April 2004
Two tier pricing: incidence and extent
4.60. This section explains some of the key assumptions for analysing two-tier pricing.
The analysis derives an in-area and an out-of-area price for each of the ex-PESs.
This provides:
♦ an analysis of two-tier pricing over time (supply groups change, whereas ex-
PESs remain separately identifiable entities over the entire period), and
♦ greater transparency (this can show, for example, how consolidation affects
differences for each supplier within a group).
4.61. The table below can be used when reading the analysis to cross-reference each
ex-PES with the current supply group to which it belongs11.
Table 4.2: List of ex-PES suppliers and supply groups
Ex-PES Supply Group (as at March 2004)
Eastern Powergen East Midlands Powergen London EDF Manweb ScottishPower/Manweb Midlands npower Northern npower Norweb Powergen Scottish Hydro SSE ScottishPower ScottishPower/Manweb Seeboard EDF Southern SSE SWALEC SSE SWEB EDF Yorkshire npower
Source: Ofgem
4.62. To capture more accurately the competitively determined elements of the
differential between in-area and out-of-area prices, non-competitively
determined elements of the bills (DUoS and TNUoS charges) have been
removed. This enables better detection of underlying competitive drivers for the
relative in/out-of-area prices12. Nominal prices are used rather than real prices
11 The only exception to this rule, is that ScottishPower/Manweb are treated as one ex-PES. 12 For example, a final bill analysis of prices could identify higher in-area than out-of-area prices, suggesting the presence of two-tier pricing. However, if this result is driven by relatively higher in-area TNUoS and DUoS charges, then the result will be misleading.

Domestic Competitive Market Review 2004 Office of Gas and Electricity Markets 97 April 2004
in this analysis to enable a more transparent understanding of underling changes
in the ratios overtime.
4.63. The incumbent price is always taken as the price of the ex-PESs. For out-of-area
prices, if the ex-PES has been acquired by another supplier, the analysis excludes
other ex-PES prices within the acquiring supply group from the out-of-area
average13.
Direct debit
4.64. Figure 4.5 measures the incidence and extent of direct debit two-tier pricing
from October 2000 to February 2004. For each ex-PES, it reports the in-area
direct debit nominal price divided by the average out-of-area direct debit
nominal price14. A value of one or greater therefore indicates that the average of
the ex-PES out-of-area prices is less than the in-area price.
13 For example, when calculating the out-of-area price for the Northern supply business from March 2003, the analysis excludes npower’s in-area prices in the Yorkshire and Midlands regions, since these reflect incumbency prices.
14 The measurement of the relative prices is straightforward. The differential between in-area and out-of-area prices can be expressed as the difference between the two prices (ie subtracting the out-of-area price from the in-area price), or by a ratio of the two prices, (ie dividing the in-area price by the out of area price). For this review, Ofgem reports on the ratio of prices.

Domestic Competitive Market Review 2004 Office of Gas and Electricity Markets 98 April 2004
Figure 4.5: Two-tier pricing: nominal direct debit prices, excluding TNUoS and DUoS charges, October 2000 to February 2004
0.95
1.00
1.05
1.10
1.15
1.20
1.25
1.30
Oct
-00
Dec
-00
Feb-
01
Apr
-01
Jun-
01
Aug
-01
Oct
-01
Dec
-01
Feb-
02
Apr
-02
Jun-
02
Aug
-02
Oct
-02
Dec
-02
Feb-
03
Apr
-03
Jun-
03
Aug
-03
Oct
-03
Dec
-03
Feb-
04
Time
Rat
io
Eastern London Northern Norweb Midlands
East Midlands Scottish Hydro Scottish Power Seeboard Southern
SWALEC SWEB Yorkshire
Source: Ofgem
4.65. Two-tier pricing strategies differ across time and by supplier. For example:
♦ within the present npower supply group, the value for Midlands has fallen
from 1.15 to 1.07, since October 2000. The value has also fallen more
recently for the Northern supply business from 1.24 in March 2003 to 1.11
in February 2004 (previously, Northern had one of the highest values among
the ex-PES). The value for Yorkshire has changed only slightly since 2000
and the ratio is the same at February 2004 as at October 2000 (1.06)
♦ within the present Powergen supply group, for the supply licensees East
Midlands, the value indicates that two-tier pricing has been almost been
eliminated (value of 1.01 at February 2004). For supply licensee Eastern,
(also within the Powergen supply group), the value has increased to 1.08
(from 1.05 in October 2000). For Norweb, the value has increased recently,
but still remains below the level at October 2000 (value is now 1.10
compared to 1.12)
♦ for London and SWEB (EDF group), the value has increased steadily since
October 2000. For London, the value has increased from 1.01 to 1.09, and
for Seeboard from 1.05 to 1.17. This differs from the trends seen with present

Domestic Competitive Market Review 2004 Office of Gas and Electricity Markets 99 April 2004
npower and Powergen supply licensees, where values are falling for four of
the six supply businesses
♦ for licensees within the SSE group, the value is fairly stable for Southern,
falling for Scottish Hydro, and increasing for SWALEC, which has one of the
highest two-tier price values, and
♦ ScottishPower/Manweb has increased its two-tier ratio since October 2000
and now has the highest ratio of any supplier (1.14 in October 2000 to 1.24
in February 2004).
4.66. Changes in the ratio are being driven by changes to the levels of both in-area
and out-of-area prices. To illustrate this, Figures 4.6 and 4.7 show how two
suppliers’ in-area and out-of-area prices have changed since October 200015.
Figure 4.6 illustrates how the decrease in the two-tier differential for Powergen
(East Midlands) has resulted from a reduction in in-area prices and an increase in
out-of-area prices between April 2002 until recently, when both in-area and out-
of-area prices were increased. Figure 4.7 illustrates how EDF (London) has
raised in-area prices and lowered out-of area prices, thereby increasing its two-
tier pricing differential.
15 The examples here have been chosen for their illustrative value and not because Ofgem has any particular regulatory interest in these suppliers.

Domestic Competitive Market Review 2004 Office of Gas and Electricity Markets 100 April 2004
Figure 4.6: Powergen (East Midlands) - In-area and out-of-area nominal direct debit prices movements
150
155
160
165
170
175
180
Oct
-00
Dec
-00
Feb-
01
Apr
-01
Jun-
01
Aug
-01
Oct
-01
Dec
-01
Feb-
02
Apr
-02
Jun-
02
Aug
-02
Oct
-02
Dec
-02
Feb-
03
Apr
-03
Jun-
03
Aug
-03
Oct
-03
Dec
-03
Feb-
04
Time
Nom
inal
Pri
ces
(£)
In Area Out Area
Source: Ofgem
Figure 4.7: EDF Energy (London) - In-area and out-of-area nominal direct debit prices movements
150
155
160
165
170
175
180
Oct
-00
Dec
-00
Feb-
01
Apr
-01
Jun-
01
Aug
-01
Oct
-01
Dec
-01
Feb-
02
Apr
-02
Jun-
02
Aug
-02
Oct
-02
Dec
-02
Feb-
03
Apr
-03
Jun-
03
Aug
-03
Oct
-03
Dec
-03
Feb-
04
Time
Nom
inal
Pri
ce (£
)
In Area Out Area
Source: Ofgem
4.67. These figures illustrate how suppliers are making discretionary changes to both
in-area and out-of-area prices (which are driving changes in pricing ratios).

Domestic Competitive Market Review 2004 Office of Gas and Electricity Markets 101 April 2004
4.68. It is also important to note that the withdrawal of certain supplier tariffs for new
business after mergers and acquisitions will also change some pricing ratios.
Standard credit
4.69. Figure 4.8 illustrates the differential of the average standard credit in-area price
compared to the average standard credit out-of-area nominal prices for each ex-
PES from October 2000 to February 2004.
Figure 4.8: Two-tier pricing: nominal standard credit prices, excluding TNUoS and DUoS charges, October 2000 to February 2004
0.90
0.95
1.00
1.05
1.10
1.15
1.20
1.25
Oct
-00
Dec
-00
Feb-
01
Apr
-01
Jun-
01
Aug
-01
Oct
-01
Dec
-01
Feb-
02
Apr
-02
Jun-
02
Aug
-02
Oct
-02
Dec
-02
Feb-
03
Apr
-03
Jun-
03
Aug
-03
Oct
-03
Dec
-03
Feb-
04
Time
Rat
io
London Northern Norweb Midlands East Midlands Scottish Hydro
Scottish Power Seeboard Southern SWALEC SWEB Yorkshire
Source: Ofgem
4.70. The pattern of two-tier pricing is similar to direct debit, with most suppliers
charging more in-area than out-of-area.
4.71. As with direct debit prices, npower and Powergen appear to be reducing the
differential between in-area and out-of-area prices for some of their ex-PES
supply businesses, with the differential eliminated for the East Midlands supply
business. EDF Energy and ScottishPower/Manweb appear to be increasing the
differential.
4.72. Figure 4.9 illustrates how npower has raised out-of-area and in-area prices.

Domestic Competitive Market Review 2004 Office of Gas and Electricity Markets 102 April 2004
Figure 4.9: npower (Midlands) - In-area and out-of-area nominal standard credit prices movements
150
155
160
165
170
175
180
185
190
195
200
Oct
-00
Dec
-00
Feb-
01
Apr
-01
Jun-
01
Aug
-01
Oct
-01
Dec
-01
Feb-
02
Apr
-02
Jun-
02
Aug
-02
Oct
-02
Dec
-02
Feb-
03
Apr
-03
Jun-
03
Aug
-03
Oct
-03
Dec
-03
Feb-
04
Time
Nom
inal
Pri
ces
(£)
In Area Out Area
Source: Ofgem
Prepayment
4.73. Figure 4.10 illustrates the in-area and out-of-area differential for prepayment.
Figure 4.10: Two-tier pricing: nominal prepayment prices, excluding TNUoS and DUoS charges, October 2000 to February 2004
0.70
0.75
0.80
0.85
0.90
0.95
1.00
1.05
1.10
Oct
-00
Dec
-00
Feb-
01
Apr
-01
Jun-
01
Aug
-01
Oct
-01
Dec
-01
Feb-
02
Apr
-02
Jun-
02
Aug
-02
Oct
-02
Dec
-02
Feb-
03
Apr
-03
Jun-
03
Aug
-03
Oct
-03
Dec
-03
Feb-
04
Time
Rat
io
Eastern London Northern Norweb Midlands
Powergen Scottish Hydro Scottish Power Seeboard Southern
SWALEC SWEB Yorkshire
Source: Ofgem

Domestic Competitive Market Review 2004 Office of Gas and Electricity Markets 103 April 2004
4.74. For prepayment, the pricing pattern is reversed, with many suppliers pricing
lower in-area than out-of-area, resulting in seven suppliers’ in/out-of-area pricing
differentials below one. For those remaining six suppliers that do price lower
out-of-area, the ratio of prices is significantly less than for suppliers’ two-tier
pricing differentials for both standard credit and direct debit payment methods.
Key observations include:
♦ London/SWEB prices were almost 30 per cent more out-of-area until
December 2001 when the differential narrowed significantly
♦ Powergen prices are 11 per cent lower for prepayment customers in the East
Midlands region than out-of-area (value of 0.89), but charges are one per
cent and six per cent higher in the Eastern and Norweb regions respectively,
compared to out-of-area, and
♦ ScottishPower/Manweb did not price differentially price at October 2000,
but now prices 12 per cent higher in-area than out-of-area (half the
differential for direct debit of 24 per cent).
Summary
4.75. A chief concern with two-tier pricing outlined at the beginning of this section
was that it penalised customers who remain with their ex-PES compared to
newly acquired customers out-of-area, who benefit from lower out-of-area
prices.
4.76. The analysis presented in the chapter shows that two-tier pricing is far more
varied in its incidence and extent than is often implied:
♦ for direct debit and standard credit payment methods, suppliers continue to
charge higher prices in-area than out-of-area, with significant variation in the
extent of the differential (in-area prices range from one per cent to 21 per
cent higher than out-of-area prices at February 2004)
♦ prepayment prices are less in-area than out-of-area for seven suppliers.
Where suppliers (six) price higher in-area than out-of-area the extent of the
differential is considerably less than for direct debit and standard credit
Domestic Competitive Market Review 2004 Office of Gas and Electricity Markets 104 April 2004
(differential range of one per cent to 21 per cent for direct debit, compared
to one per cent to 10 per cent for prepayment)
♦ players with national brands (eg npower and Powergen) use two-tier pricing
to a lesser extent than regional players such as SSE and EDF Energy, who
have tended to emphasise their regional brand association, and
♦ the reasons for changes in two-tier differentials are varied, being driven by
suppliers changing both in-area and out-of-area prices, as well as through
consolidation.
4.77. In general any domestic electricity customer who pays by standard credit or
direct debit and has chosen to stay with (or switched back to) their ex-PES,
continues to pay a higher price than someone being supplied by that same
supplier out-of-area. There are several possible interpretations of this result.
4.78. One explanation for this finding is that suppliers may be pricing according to the
way in which they allocate costs. Two-tier pricing could therefore be a result of
suppliers allocating more common or joint costs to in-area customers. However,
it is not obvious how supplier acquisition or other costs could differ between in-
area and out-of-area customers to the extent implied in two-tier pricing
differentials for direct debit and standard credit.
4.79. Another possible interpretation is that suppliers are charging whatever they
consider the market will bear. For instance, suppliers may be able to load sunk
costs such as out-of-the-money independent power purchase agreements signed
with independent power producers (IPPs) onto in-area customers. While many
of the contracts will have been written off or renegotiated, suppliers may
continue to recover the historic costs of these agreements. It could be argued
that customer inertia may be placing a weaker restraint on suppliers’ ability to
pass sunk costs on to in-area customers.
4.80. One further explanation may be that suppliers engaged in two-tier pricing could
be trading off greater per customer revenue from higher in-area prices against the
loss of revenue from higher in-area customer losses. This would mean that in-
area prices will be higher than out-of-area prices until the number of switchers
Domestic Competitive Market Review 2004 Office of Gas and Electricity Markets 105 April 2004
in-area makes the loss of revenue from customer attrition greater than the
increase in per customer revenue from the higher price16.
4.81. For prepayment customers, in-area customers may pay less than out-of-area
customer for two reasons. It may be that the costs of serving prepayment
customers out-of-area exceeds that for in-area customers. This could be due to
the cost to suppliers of having to enter into different prepayment infrastructure
charges across the other supply services areas. However, all suppliers must
enter into the same agreements for these services and six suppliers do offer
prices that are lower than the ex-PES.
4.82. A second reason may be that suppliers are less interested in pricing aggressively
to obtain prepayment customers, preferring instead to offer uncompetitive prices
out-of-area.
4.83. Ofgem considers that customers who switch will necessarily gain a larger share
of the benefits of supply competition than non-switchers. Ofgem considers that
in the transition from monopoly to mature competition, this difference in the
share of benefits, reflected in the two-tier price, provides for the dynamic
incentive for customers to switch away from their ex-PES. It may be indicative of
suppliers’ different competitive approaches, either through building a national
brand or because customer losses are reaching a point where suppliers’ in-area
pricing strategies have to change.
4.84. For prepayment customers, the fact that many suppliers price less in-area than
out-of-area could be evidence of fewer suppliers actively competing out-of-area
for this customer group. However, some suppliers do offer lower prices than the
ex-PES. This suggests that suppliers can price competitively for this customer
group. It is possible that the different prepayment infrastructures provided in
each ex-PES region are a barrier to expansion for ex-PESs outside their own
areas.
4.85. Ofgem will continue to monitor movements in both in-area and out-of-area
prices. To help in reducing the costs of supplying prepayment customers, Ofgem

Domestic Competitive Market Review 2004 Office of Gas and Electricity Markets 106 April 2004
will continue its work on the removal of barriers to innovative metering and will
bring forward proposals as part of the distribution price control review.
Analysis of price savings available
4.86. This section identifies how suppliers’ discounts differ across payment type,
region, and consumption level.
Dual fuel prices
4.87. Ofgem’s analysis begins by examining dual fuel offerings. It focuses on dual fuel
savings available to customers who are currently with BGT for gas and their ex-
PES for electricity (ie those who have yet to switch either gas or electricity).
Savings relative to this ‘double incumbent’ supplier are presented for the East
Midlands. East Midlands is representative of the results which appear across
most of the 14 supply services areas in dual fuel direct debit and standard credit
(see Appendix 7 for a detailed illustration of savings available across all 14
supply service areas)17. This review does not consider dual fuel offers for
prepayment customers because suppliers do not generally target specific dual
fuel offers towards these customers.
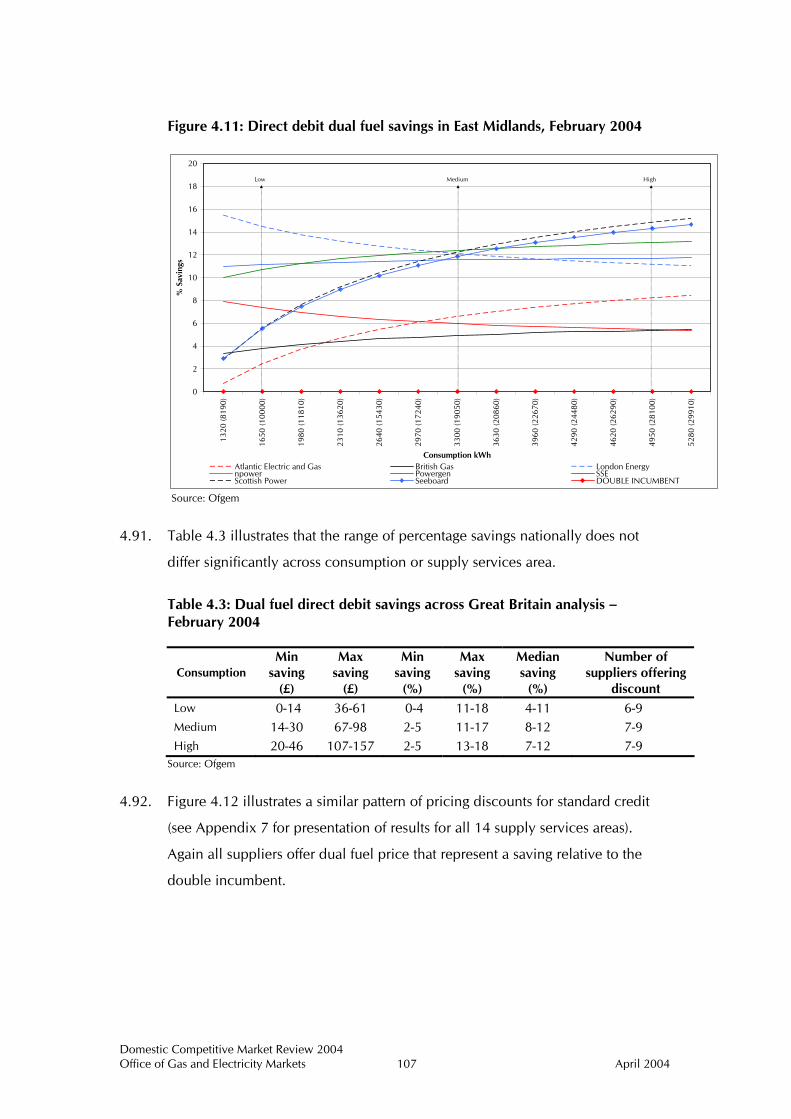
4.88. Figure 4.11 illustrates direct debit dual fuel savings in the East Midlands region.
Note that the consumption scales for gas and electricity are aligned (eg the
medium consumption levels (19050kWh in gas/3300 kWh in electricity) are
aligned at the same point on the graph). The figure illustrates that the double
incumbent bill is the most expensive, with all other dual fuel offers representing
a saving to the double incumbent.
4.89. Of the suppliers offering dual fuel in the East Midlands region, BGT is the most
expensive, with the highest dual fuel price and lowest saving relative to the
double incumbent for customers on medium consumption.
4.90. The incumbent ex-PES, Powergen, also represents among the lowest savings
possible in the East Midlands region at medium and high consumption levels.
17 The examples here have been chosen for their illustrative value and not because Ofgem has any particular regulatory interest in these suppliers.
Domestic Competitive Market Review 2004 Office of Gas and Electricity Markets 107 April 2004
Figure 4.11: Direct debit dual fuel savings in East Midlands, February 2004
0
2
4
6
8
10
12
14
16
18
20
1320
(819
0)
1650
(100
00)
1980
(118
10)
2310
(136
20)
2640
(154
30)
2970
(172
40)
3300
(190
50)
3630
(208
60)
3960
(226
70)
4290
(244
80)
4620
(262
90)
4950
(281
00)
5280
(299
10)
Consumption kWh
% S
avin
gs
Atlantic Electric and Gas British Gas London Energynpower Powergen SSEScottish Power Seeboard DOUBLE INCUMBENT
Low Medium High
Source: Ofgem
4.91. Table 4.3 illustrates that the range of percentage savings nationally does not
differ significantly across consumption or supply services area.
Table 4.3: Dual fuel direct debit savings across Great Britain analysis – February 2004
Consumption Min
saving (£)
Max saving
(£)
Min saving
(%)
Max saving
(%)
Median saving
(%)
Number of suppliers offering
discount Low 0-14 36-61 0-4 11-18 4-11 6-9 Medium 14-30 67-98 2-5 11-17 8-12 7-9 High 20-46 107-157 2-5 13-18 7-12 7-9
Source: Ofgem
4.92. Figure 4.12 illustrates a similar pattern of pricing discounts for standard credit
(see Appendix 7 for presentation of results for all 14 supply services areas).
Again all suppliers offer dual fuel price that represent a saving relative to the
double incumbent.

Domestic Competitive Market Review 2004 Office of Gas and Electricity Markets 108 April 2004
Figure 4.12: Standard credit dual fuel savings in East Midlands, February 2004
0
2
4
6
8
10
12
14
16
18
20
1320
(819
0)
1650
(100
00)
1980
(118
10)
2310
(136
20)
2640
(154
30)
2970
(172
40)
3300
(190
50)
3630
(208
60)
3960
(226
70)
4290
(244
80)
4620
(262
90)
4950
(281
00)
5280
(299
10)
Consumption kWh
% S
avin
gs
Atlantic Electric and Gas British Gas London Energynpower Powergen SSEScottish Power Seeboard DOUBLE INCUMBENT
Low Medium High
Source: Ofgem
4.93. Table 4.4 identifies a summary of savings available across all 14 supply services
areas.
Table 4.4: Dual fuel standard credit savings across Great Britain – February 2004
Consumption Min
saving (£)
Max saving
(£)
Min saving
(%)
Max saving
(%)
Median saving
(%)
Number of suppliers
offering discount
Low 1-23 56-89 0-6 15-22 8-13 7-9 Medium 12-35 79-126 2-5 13-20 10-13 7-9 High 19-47 121-178 2-5 14-19 10-13 7-9
Source: Ofgem
4.94. Table 4.4 illustrates how the range of minimum, maximum and median
percentage savings compared to the double incumbent do not differ significantly
by low, medium and high consumption levels, nor across the 14 supply services
areas. These savings are slightly higher for standard credit than for direct debit.
4.95. An inspection of the detailed savings indicates that BGT is the most expensive
dual fuel supplier at low, medium and high consumption levels in at least 12 out
of 14 regions.

Domestic Competitive Market Review 2004 Office of Gas and Electricity Markets 109 April 2004
Summary
4.96. The evidence on savings for dual fuel customers on direct debit and standard
credit suggests that customers who remain with BGT for gas and their ex-PES for
electricity can make sizeable savings from switching to a dual fuel supplier.
Median savings at medium consumption are 8 to 12 per cent for direct debit
customers and 10 to 13 per cent for standard credit customers. Maximum
savings at medium consumption are 11 to 17 per cent for direct debit customers
and 13 to 20 per cent for standard credit customers.
4.97. Interestingly, BGT (which has 44 per cent of all dual fuel customers) consistently
offers the most expensive dual fuel price at medium and high consumption
levels (in at least 9 out of 14 areas) for direct debit and at all consumption levels
(in at least 12 out of 14 areas) for standard credit. Although BGT still represents
a saving for first time switchers, its dual fuel price represents the least best saving
in these regions.
4.98. A key policy question is therefore why almost half of all dual fuel customers are
currently with the supplier offering one of the most expensive dual fuel prices,
when customer survey results suggest that price, rather than brand or reputation,
is the key driver for switching.
4.99. Reasons may include:
♦ customers may value the BGT brand and reputation, as reflected in the ‘fixed
effects’ observed in Chapter 3
♦ customers are concerned with making a saving, but are less concerned with
the extent of those savings, and
♦ customers are reactive in their switching decisions and take the first saving
offered. To the extent that BGT may have been more prolific in doorstep
selling, it may simply have been the first supplier to doorstep a majority of
prospective dual fuel customers, without having to offer the cheapest prices.
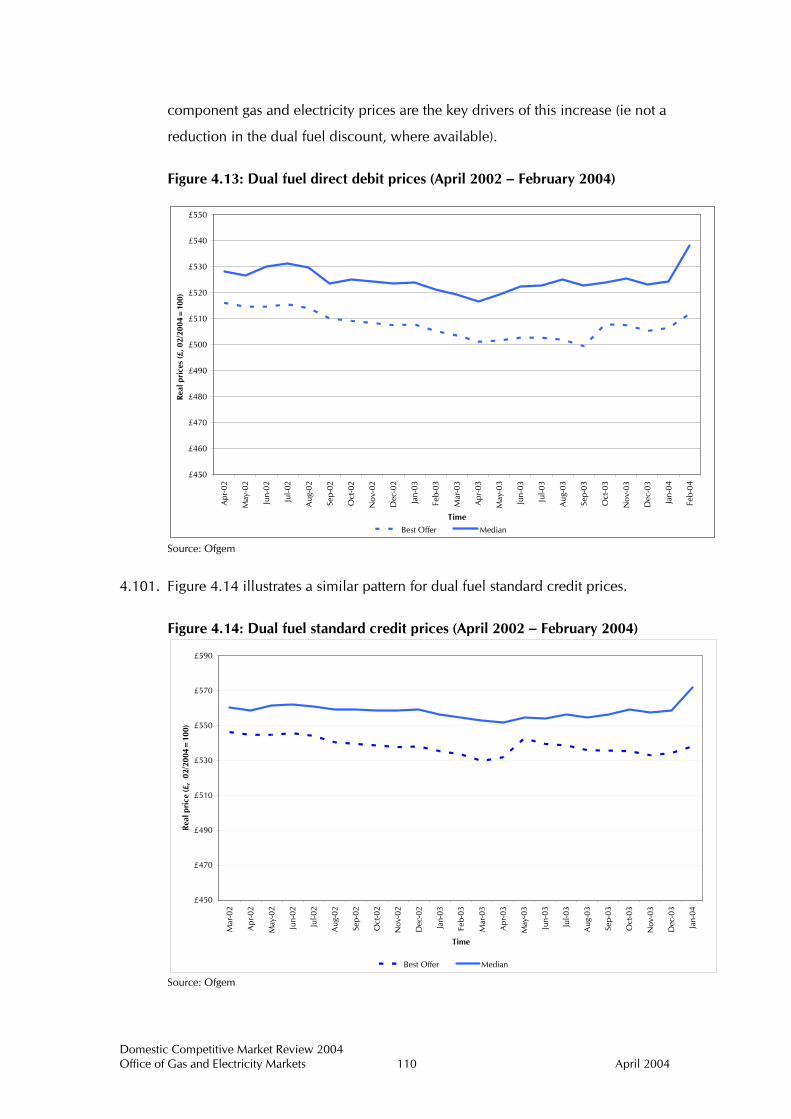
4.100. Figure 4.13 illustrates real price trends for dual fuel direct debit customers since
April 2002. The trends show real prices falling between 2002 and 2003, and
then increasing more recently, with prices increasing in real terms by six per
cent for median bills and one per cent for best offer bills. Real increases in
Domestic Competitive Market Review 2004 Office of Gas and Electricity Markets 110 April 2004
component gas and electricity prices are the key drivers of this increase (ie not a
reduction in the dual fuel discount, where available).
Figure 4.13: Dual fuel direct debit prices (April 2002 – February 2004)
£450
£460
£470
£480
£490
£500
£510
£520
£530
£540
£550A
pr-0
2
May
-02
Jun-
02
Jul-0
2
Aug
-02
Sep-
02
Oct
-02
Nov
-02
Dec
-02
Jan-
03
Feb-
03
Mar
-03
Apr
-03
May
-03
Jun-
03
Jul-0
3
Aug
-03
Sep-
03
Oct
-03
Nov
-03
Dec
-03
Jan-
04
Feb-
04
Time
Real
pri
ces
(£, 0
2/20
04=
100)
Best Offer Median
Source: Ofgem
4.101. Figure 4.14 illustrates a similar pattern for dual fuel standard credit prices.
Figure 4.14: Dual fuel standard credit prices (April 2002 – February 2004)
£450
£470
£490
£510
£530
£550
£570
£590
Mar
-02
Apr
-02
May
-02
Jun-
02
Jul-0
2
Aug
-02
Sep-
02
Oct
-02
Nov
-02
Dec
-02
Jan-
03
Feb-
03
Mar
-03
Apr
-03
May
-03
Jun-
03
Jul-0
3
Aug
-03
Sep-
03
Oct
-03
Nov
-03
Dec
-03
Jan-
04
Time
Rea
l pri
ce (£
, 02
/200
4=10
0)
Best Offer Median Source: Ofgem

Domestic Competitive Market Review 2004 Office of Gas and Electricity Markets 111 April 2004
4.102. The trend shows credit prices increasing in real terms by nine per cent for
median bills and two per cent for best offer bills.
Electricity
Direct debit
4.103. Figure 4.15 illustrates savings available for a single fuel electricity customer in
the East Midlands region, relative to the ex-PES (Powergen)18 (see Appendix 8 for
presentation of results for all 14 supply services areas). Discounts relative to the
ex-PES increase in percentage terms as consumption rises, with maximum
savings of 9 per cent at low consumption and 16 per cent at high consumption.
At low consumption the number of suppliers offering lower prices than the
incumbent falls from eight to five.
Figure 4.15: Direct debit savings in East Midlands, February 2004
-20
-15
-10
-5
0
5
10
15
20
800
1100
1400
1700
2000
2300
2600
2900
3200
3500
3800
4100
4400
4700
5000
5300
5600
5900
Consumption kWh
% S
avin
gs
Atlantic Electric and Gas Basic Power British GasLondon Energy npower PowergenSSE Scottish Power Seeboard
Low Medium High
Source: Ofgem
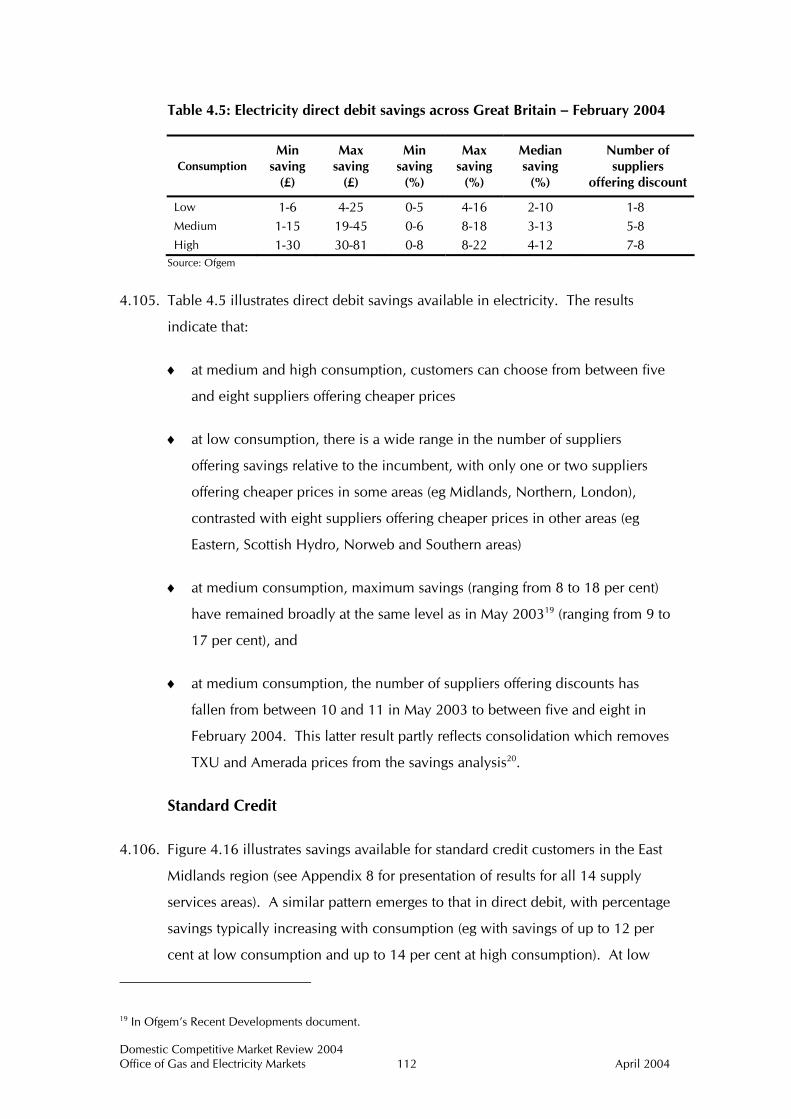
4.104. Table 4.5 summarises electricity direct debit savings for Great Britain (see
Appendix 8 for detailed tabled regional results).
18 The examples here have been chosen for their illustrative value and not because Ofgem has any particular regulatory interest in these suppliers.
Domestic Competitive Market Review 2004 Office of Gas and Electricity Markets 112 April 2004
Table 4.5: Electricity direct debit savings across Great Britain – February 2004
Consumption Min
saving (£)
Max saving
(£)
Min saving
(%)
Max saving
(%)
Median saving
(%)
Number of suppliers
offering discount
Low 1-6 4-25 0-5 4-16 2-10 1-8 Medium 1-15 19-45 0-6 8-18 3-13 5-8 High 1-30 30-81 0-8 8-22 4-12 7-8
Source: Ofgem
4.105. Table 4.5 illustrates direct debit savings available in electricity. The results
indicate that:
♦ at medium and high consumption, customers can choose from between five
and eight suppliers offering cheaper prices
♦ at low consumption, there is a wide range in the number of suppliers
offering savings relative to the incumbent, with only one or two suppliers
offering cheaper prices in some areas (eg Midlands, Northern, London),
contrasted with eight suppliers offering cheaper prices in other areas (eg
Eastern, Scottish Hydro, Norweb and Southern areas)
♦ at medium consumption, maximum savings (ranging from 8 to 18 per cent)
have remained broadly at the same level as in May 200319 (ranging from 9 to
17 per cent), and
♦ at medium consumption, the number of suppliers offering discounts has
fallen from between 10 and 11 in May 2003 to between five and eight in
February 2004. This latter result partly reflects consolidation which removes
TXU and Amerada prices from the savings analysis20.
Standard Credit
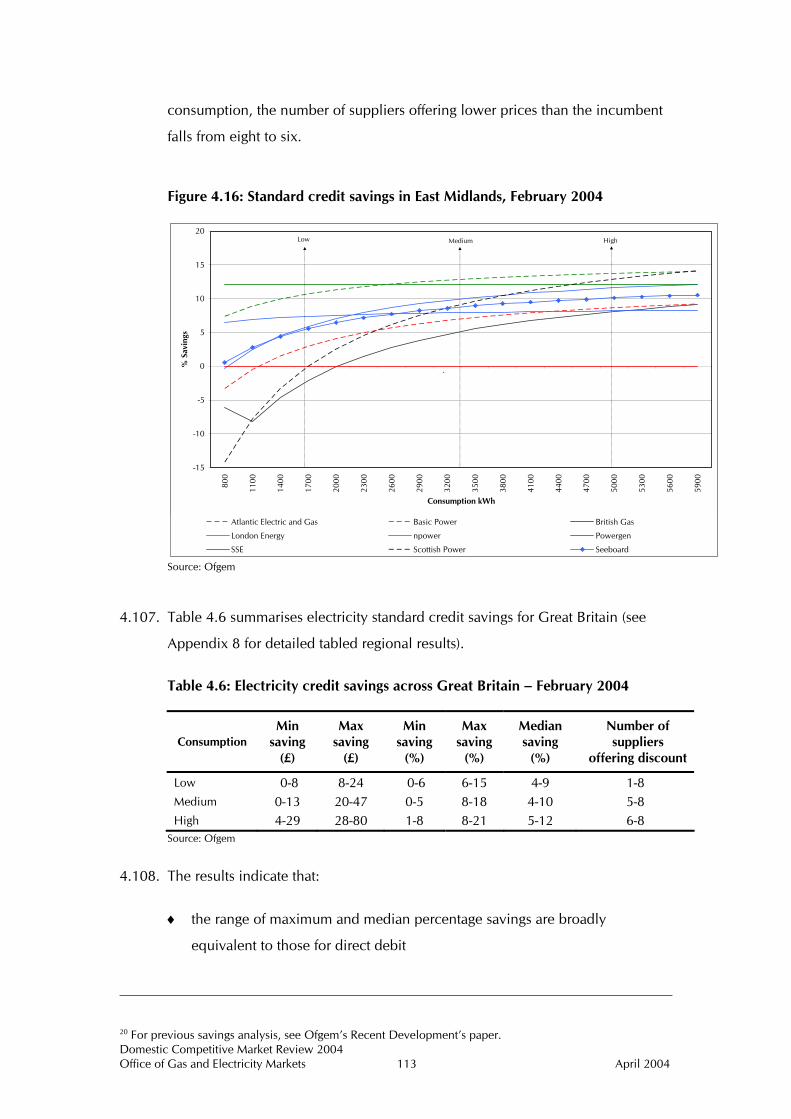
4.106. Figure 4.16 illustrates savings available for standard credit customers in the East
Midlands region (see Appendix 8 for presentation of results for all 14 supply
services areas). A similar pattern emerges to that in direct debit, with percentage
savings typically increasing with consumption (eg with savings of up to 12 per
cent at low consumption and up to 14 per cent at high consumption). At low
19 In Ofgem’s Recent Developments document.
Domestic Competitive Market Review 2004 Office of Gas and Electricity Markets 113 April 2004
consumption, the number of suppliers offering lower prices than the incumbent
falls from eight to six.
Figure 4.16: Standard credit savings in East Midlands, February 2004
-15
-10
-5
0
5
10
15
2080
0
1100
1400
1700
2000
2300
2600
2900
3200
3500
3800
4100
4400
4700
5000
5300
5600
5900
Consumption kWh
% S
avin
gs
Atlantic Electric and Gas Basic Power British Gas
London Energy npower Powergen
SSE Scottish Power Seeboard
.
Low Medium High
Source: Ofgem
4.107. Table 4.6 summarises electricity standard credit savings for Great Britain (see
Appendix 8 for detailed tabled regional results).
Table 4.6: Electricity credit savings across Great Britain – February 2004
Consumption Min
saving (£)
Max saving
(£)
Min saving
(%)
Max saving
(%)
Median saving
(%)
Number of suppliers
offering discount
Low 0-8 8-24 0-6 6-15 4-9 1-8 Medium 0-13 20-47 0-5 8-18 4-10 5-8 High 4-29 28-80 1-8 8-21 5-12 6-8
Source: Ofgem
4.108. The results indicate that:
♦ the range of maximum and median percentage savings are broadly
equivalent to those for direct debit
20 For previous savings analysis, see Ofgem’s Recent Development’s paper.

Domestic Competitive Market Review 2004 Office of Gas and Electricity Markets 114 April 2004
♦ at medium consumption, maximum savings (range of 8 to 18 per cent)
remain at similar levels to those at May 2003 (range of 9 to 16 per cent), and
♦ at medium consumption the number of suppliers offering cheaper prices has
fallen to a range of 5 to 8 suppliers, depending on locality, compared to May
2003 (between 9 and 11 suppliers offered cheaper prices).
Prepayment
4.109. The picture varies for prepayment customers, across consumption and by region,
with many suppliers charging higher prices than the ex-PES. Only Basic Power
consistently prices below the incumbent for all consumption levels. Unlike
direct debit and standard credit, however, the pattern of prepayment savings
varies significantly by region. For instance, in the Midlands region, where
npower is the incumbent supplier, it has the most expensive prepayment prices
at medium and high consumption. These prepayment customers can make
savings between 4 per cent and 13 per cent by switching to another supplier.
Prepayment customers with low consumption are offered savings by four
suppliers. Savings in East Midlands and Manweb (see figures 4.18 and 4.19)
further illustrate the regional variation in savings.
Figure 4.17: Prepayment savings in Midlands, February 2004
-10
-5
0
5
10
15
20
800
1100
1400
1700
2000
2300
2600
2900
3200
3500
3800
4100
4400
4700
5000
5300
5600
5900
Consumption kWh
% S
avin
gs
Atlantic Electric and Gas Basic Power British Gas
London Energy npower Powergen
SSE Scottish Power Seeboard
Low Medium High
Source: Ofgem

Domestic Competitive Market Review 2004 Office of Gas and Electricity Markets 115 April 2004
Figure 4.18: Prepayment savings in East Midlands, February 2004
-70
-60
-50
-40
-30
-20
-10
0
10
20
800
1100
1400
1700
2000
2300
2600
2900
3200
3500
3800
4100
4400
4700
5000
5300
5600
5900
Consumption kWh
% S
avin
gs
Basic Power British Gas London Energy npowerPowergen SSE Scottish Power Seeboard
Low Medium High
Source: Ofgem
Figure 4.19: Prepayment savings in Manweb, February 2004
-25
-20
-15
-10
-5
0
5
10
15
20
800
1100
1400
1700
2000
2300
2600
2900
3200
3500
3800
4100
4400
4700
5000
5300
5600
5900
Consumption kWh
% S
avin
gs
Atlantic Electric and Gas Basic Power British Gas
London Energy npower Powergen
SSE Scottish Power Seeboard
Low Medium High
Source: Ofgem
4.110. Table 4.7 summarises electricity prepayment savings for Great Britain (see
Appendix 8 for detailed tabled regional results).

Domestic Competitive Market Review 2004 Office of Gas and Electricity Markets 116 April 2004
Table 4.7: Electricity prepayment savings across Great Britain – February 2004
Consumption Min
saving (£)
Max saving
(£)
Min saving
(%)
Max saving
(%)
Median saving
(%)
Number of suppliers
offering discount
Low 0-14 13-30 0-10 8-16 0-7 1-8 Medium 0-24 24-42 0-10 9-15 1-8 1-8 High 0-23 34-62 0-6 9-15 0-9 2-8
Source: Ofgem
4.111. The results indicate that:
♦ median savings from switching are lower than for direct debit and standard
credit.
♦ maximum savings are comparable to direct debit and standard credit at low
and medium consumption, although at high consumption, the median is
lower (maximum of up to 15 per cent compared to 22 and 21 per cent for
direct debit and credit, respectively)
♦ at medium consumption maximum savings (range of 9 to 15 per cent) are at
similar levels to those at May 2003 (range of 9 to 12 per cent), and
♦ the number of suppliers offering cheaper prices lies within a range of one to
eight suppliers, depending on locality, compared to May 2003 (between one
and 10 suppliers offered cheaper prices).
4.112. The pricing analysis conducted for electricity illustrates three key results:
♦ customers can make best savings of between £19 and £45 for direct debit,
between £20 and £47 for credit and between £24 and £42 for prepayment,
depending on locality
♦ savings (maximum) are comparable to May 2003, and
♦ the number of suppliers offering cheaper prices than the local ex-PES has
fallen compared to May 2003. This partly reflects consolidation activity that
has seen former TXU and Amerada prices rebranded within the Powergen
group.
4.113. The results suggest that customers can continue to make savings across all
payment types and at low, medium and high consumption levels. However:

Domestic Competitive Market Review 2004 Office of Gas and Electricity Markets 117 April 2004
♦ customers on all payment types at low (and particularly very low)
consumption levels need to exercise greater caution when switching, to
ensure that they are choosing a cheaper supplier, and
♦ although prepayment customers can make savings from switching, these
savings may not be as large as other payment methods.
4.114. Ofgem will continue to monitor electricity prices to assess the extent to which
all electricity customers continue to benefit from domestic electricity supply
competition.
4.115. Figures 4.20-4.23 identifies these trends in aggregated form (ie average prices for
Great Britain) since June 2000.
Figure 4.20: Trends in incumbent, median and best electricity prices, direct debit, medium consumption (June 2000 - December 2003)
210
220
230
240
250
260
270
280
290
300
Jun-
00
Aug
-00
Oct
-00
Dec
-00
Feb-
01
Apr
-01
Jun-
01
Aug
-01
Oct
-01
Dec
-01
Feb-
02
Apr
-02
Jun-
02
Aug
-02
Oct
-02
Dec
-02
Feb-
03
Apr
-03
Jun-
03
Aug
-03
Oct
-03
Dec
-03
Rea
l pri
ces
(£, 1
2/20
03=
100)
Incumbent Best Offer Median
Source: Ofgem

Domestic Competitive Market Review 2004 Office of Gas and Electricity Markets 118 April 2004
Figure 4.21: Trends in incumbent, median and best electricity prices, standard credit, medium consumption (June 2000 - December 2003)
210
220
230
240
250
260
270
280
290
300
Jun-
00
Aug
-00
Oct
-00
Dec
-00
Feb-
01
Apr
-01
Jun-
01
Aug
-01
Oct
-01
Dec
-01
Feb-
02
Apr
-02
Jun-
02
Aug
-02
Oct
-02
Dec
-02
Feb-
03
Apr
-03
Jun-
03
Aug
-03
Oct
-03
Dec
-03
Rea
l pri
ces
(£, D
ec 2
003=
100)
Incumbent Best Offer Median
Source: Ofgem
Figure 4.22: Trends in incumbent, median and best electricity prices, prepayment, medium consumption (June 2000 – December 2003)
210
220
230
240
250
260
270
280
290
300
Jun-
00
Aug
-00
Oct
-00
Dec
-00
Feb-
01
Apr
-01
Jun-
01
Aug
-01
Oct
-01
Dec
-01
Feb-
02
Apr
-02
Jun-
02
Aug
-02
Oct
-02
Dec
-02
Feb-
03
Apr
-03
Jun-
03
Aug
-03
Oct
-03
Dec
-03
Rea
l pri
ces
(£, D
ec 2
003=
100)
Incumbent Best Offer Median
Source: Ofgem
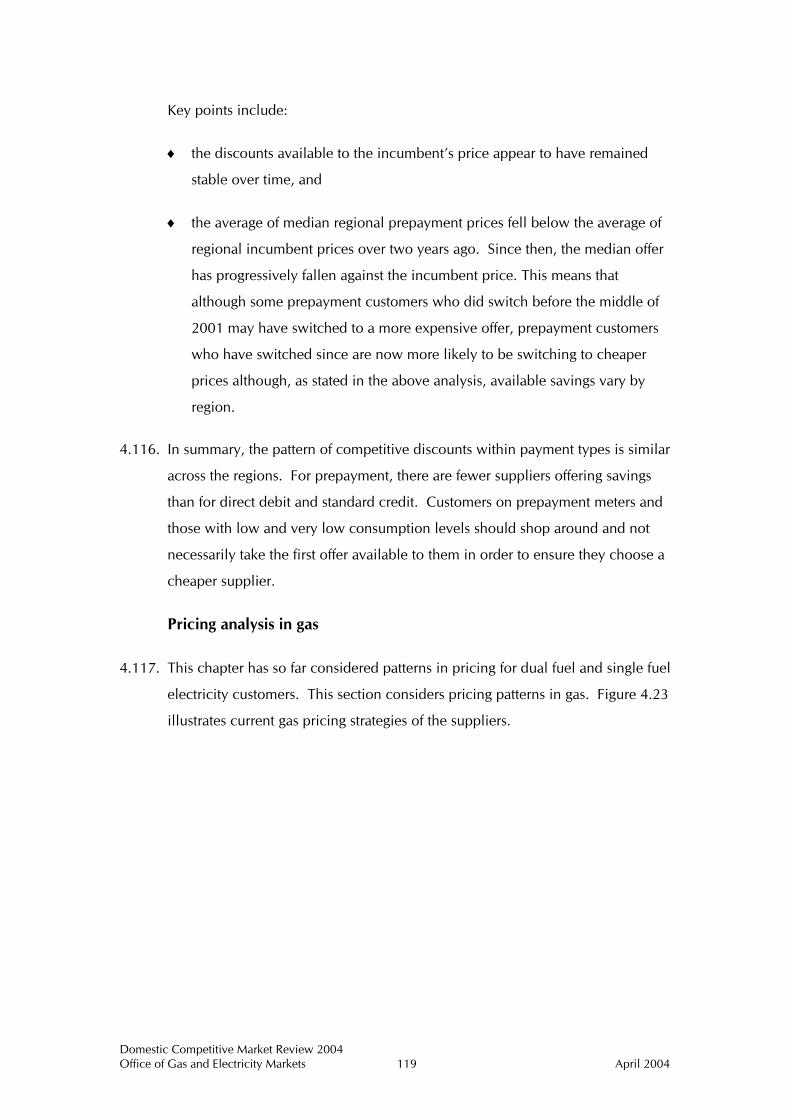
Domestic Competitive Market Review 2004 Office of Gas and Electricity Markets 119 April 2004
Key points include:
♦ the discounts available to the incumbent’s price appear to have remained
stable over time, and
♦ the average of median regional prepayment prices fell below the average of
regional incumbent prices over two years ago. Since then, the median offer
has progressively fallen against the incumbent price. This means that
although some prepayment customers who did switch before the middle of
2001 may have switched to a more expensive offer, prepayment customers
who have switched since are now more likely to be switching to cheaper
prices although, as stated in the above analysis, available savings vary by
region.
4.116. In summary, the pattern of competitive discounts within payment types is similar
across the regions. For prepayment, there are fewer suppliers offering savings
than for direct debit and standard credit. Customers on prepayment meters and
those with low and very low consumption levels should shop around and not
necessarily take the first offer available to them in order to ensure they choose a
cheaper supplier.
Pricing analysis in gas
4.117. This chapter has so far considered patterns in pricing for dual fuel and single fuel
electricity customers. This section considers pricing patterns in gas. Figure 4.23
illustrates current gas pricing strategies of the suppliers.
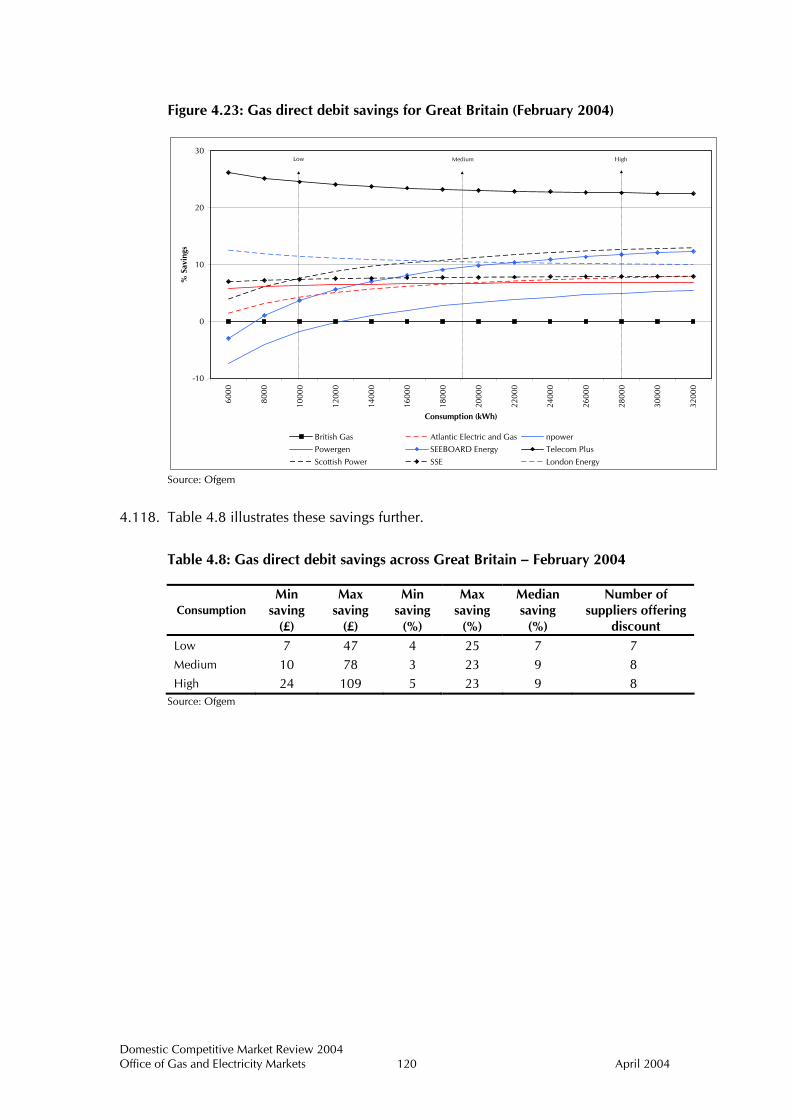
Domestic Competitive Market Review 2004 Office of Gas and Electricity Markets 120 April 2004
Figure 4.23: Gas direct debit savings for Great Britain (February 2004)
-10
0
10
20
30
6000
8000
1000
0
1200
0
1400
0
1600
0
1800
0
2000
0
2200
0
2400
0
2600
0
2800
0
3000
0
3200
0
Consumption (kWh)
% S
avin
gs
British Gas Atlantic Electric and Gas npower
Powergen SEEBOARD Energy Telecom Plus
Scottish Power SSE London Energy
Low Medium High
Source: Ofgem
4.118. Table 4.8 illustrates these savings further.
Table 4.8: Gas direct debit savings across Great Britain – February 2004
Consumption Min
saving (£)
Max saving
(£)
Min saving
(%)
Max saving
(%)
Median saving
(%)
Number of suppliers offering
discount Low 7 47 4 25 7 7 Medium 10 78 3 23 9 8 High 24 109 5 23 9 8
Source: Ofgem

Domestic Competitive Market Review 2004 Office of Gas and Electricity Markets 121 April 2004
Figure 4.24: Gas standard credit savings for Great Britain (February 2004)
-10
0
10
20
30
40
6000
8000
1000
0
1200
0
1400
0
1600
0
1800
0
2000
0
2200
0
2400
0
2600
0
2800
0
3000
0
3200
0
Consumption (kWh)
% S
avin
gs
British Gas Atlantic Electric and Gas npower
Powergen SEEBOARD Energy Telecom Plus
Scottish Power SSE London Energy
Low Medium High
Source: Ofgem
4.119. Table 4.9 further illustrates the savings across Great Britain.
Table 4.9: Gas credit savings across Great Britain – February 2004
Consumption Min
saving (£)
Max saving
(£)
Min saving
(%)
Max saving
(%)
Median saving
(%)
Number of suppliers offering
discount Low 20 67 9 29 16 8 Medium 31 92 8 25 13 8 High 38 118 7 22 13 8
Source: Ofgem

Domestic Competitive Market Review 2004 Office of Gas and Electricity Markets 122 April 2004
Figure 4.25: Gas prepayment savings for Great Britain (February 2004)
-10
0
10
20
30
40
6000
8000
1000
0
1200
0
1400
0
1600
0
1800
0
2000
0
2200
0
2400
0
2600
0
2800
0
3000
0
3200
0
Consumption (kWh)
% S
avin
gs
British Gas Atlantic Electric and Gas npowerPowergen SEEBOARD Energy Telecom PlusScottish Power SSE London Energy
Low Medium High
Source: Ofgem
4.120. Table 4.10 further identifies prepayment savings.
Table 4.10: Gas prepayment savings across Great Britain – February 2004
Consumption Min
saving (£)
Max saving
(£)
Min saving
(%)
Max saving
(%)
Median saving
Number of suppliers offering
discount Low 7 26 3 12 6 6 Medium 2 34 0 10 4 5 High 7 42 1 8 3 4
Source: Ofgem
4.121. Key points include:
♦ all direct debit and standard credit customers can save by switching from
BGT. All suppliers are cheaper for standard credit, with most suppliers
cheaper for direct debit
♦ this indicates similar levels of intensity of price competition across
consumption levels, and suggests suppliers do not differentiate themselves
by targeting particular consumption levels with higher percentage savings,
and

Domestic Competitive Market Review 2004 Office of Gas and Electricity Markets 123 April 2004
♦ for prepayment customers, the pattern is slightly different - fewer suppliers
offer savings relative to the incumbent compared to standard credit or direct
debit.
4.122. Figure 4.26 illustrates key pricing differentials over time for gas.
Figure 4.26: Trends in incumbent, median and best gas prices direct debit, medium consumption (April 1999 – December 2003)
240
250
260
270
280
290
300
310
320
330
340
350
360
370
380
Apr
-99
Jul-9
9
Oct
-99
Jan-
00
Apr
-00
Jul-0
0
Oct
-00
Jan-
01
Apr
-01
Jul-0
1
Oct
-01
Jan-
02
Apr
-02
Jul-0
2
Oct
-02
Jan-
03
Apr
-03
Jul-0
3
Oct
-03
Jan-
04
Time
Rea
l Pri
ces
(£, 0
2/20
04=
100)
Incumbent Best Offer Median
Source: Ofgem

Domestic Competitive Market Review 2004 Office of Gas and Electricity Markets 124 April 2004
Figure 4.27: Trends in incumbent, median and best gas prices standard credit, medium consumption (April 1999 – December 2003)
240
250
260
270
280
290
300
310
320
330
340
350
360
370
Apr
-99
Jul-9
9
Oct
-99
Jan-
00
Apr
-00
Jul-0
0
Oct
-00
Jan-
01
Apr
-01
Jul-0
1
Oct
-01
Jan-
02
Apr
-02
Jul-0
2
Oct
-02
Jan-
03
Apr
-03
Jul-0
3
Oct
-03
Jan-
04
Time
Rea
l Pri
ces
(£, 0
2/20
04 =
100)
Incumbent Best Offer Median
Powergen raise price, Atlantic becomes the Best Offer
Telecom Plus lower SC bills, becoming the new Best Offer
Source: Ofgem
4.123. Although suppliers’ pricing strategies show some consistency over time, there
seems to be slightly more variation than in electricity. Recently the difference
between the best offer and the incumbent’s price has widened. BGT’s price
increase in January 2004 will further increase this differential.
Differential between prepayment and credit bills
4.124. Prepayment customers tend to pay higher prices than credit customers. One
reason for the additional cost is that suppliers incur charges relating to the
provision of cards, keys or tokens to operate prepayment meters as well as
providing pay points at which customers can place credit on these devices21.
Another reason is that prepayment meter asset provision costs, including
provision and maintenance, are higher than for credit meters.
4.125. The costs of serving prepayment customers may be higher than for credit
customers at present. To help in reducing these costs, Ofgem will continue its
work on the removal of barriers to innovative metering and will bring forward
proposals as part of the distribution price control review.
21 These charges are referred to as prepayment infrastructure provision charges.

Domestic Competitive Market Review 2004 Office of Gas and Electricity Markets 125 April 2004
4.126. Figure 4.28 illustrates that the differential between prepayment and credit prices
narrowed between April 1999 and February 2004. The differential has also
reduced since the removal of domestic retail price controls in April 2002.
Figure 4.29: Gas median prepayment – credit bill differential
£220
£240
£260
£280
£300
£320
£340
£360
£380
£400
Apr
-99
Jun-
99
Aug
-99
Oct
-99
Dec
-99
Feb-
00
Apr
-00
Jun-
00
Aug
-00
Oct
-00
Dec
-00
Feb-
01
Apr
-01
Jun-
01
Aug
-01
Oct
-01
Dec
-01
Feb-
02
Apr
-02
Jun-
02
Aug
-02
Oct
-02
Dec
-02
Feb-
03
Apr
-03
Jun-
03
Aug
-03
Oct
-03
Dec
-03
Feb-
04
Time
Rea
l pri
ces
(£, 0
2/20
04=
100)
Standard credit - median Prepayment - median
Source: Ofgem
4.127. Table 4.11 summarises the above results for median bills.
Table 4.11 Gas median prepayment – credit bill differential
Price differential (£) Price differential (%)
April 1999 73.50 24 April 2002 45.61 14 February 2004 25.10 8 Source: Ofgem
4.128. See Appendix 9 for similar results for incumbent and best offer).
4.129. Figure 4.30 illustrates a similar trend in electricity, with the differential between
prepayment and standard credit prices narrowing between June 2000 and
February 2004. The differential has also reduced since the removal of domestic
retail price controls in April 2002.

Domestic Competitive Market Review 2004 Office of Gas and Electricity Markets 126 April 2004
Figure 4.30: Electricity median prepayment – credit bill differential
£220
£230
£240
£250
£260
£270
£280
£290
£300
Jun-
00
Aug
-00
Oct
-00
Dec
-00
Feb-
01
Apr
-01
Jun-
01
Aug
-01
Oct
-01
Dec
-01
Feb-
02
Apr
-02
Jun-
02
Aug
-02
Oct
-02
Dec
-02
Feb-
03
Apr
-03
Jun-
03
Aug
-03
Oct
-03
Dec
-03
Feb-
04
Time
Rea
l pri
ces
(£, 0
2/20
04=
100)
Standard credit - median Prepayment - median
Source: Ofgem
4.130. Table 4.12 presents the above results for median bills.
Table 4.12: Electricity median prepayment – credit bill differential Price differential(£) Price differential (%)
June 2000 36.20 14 April 2002 32.70 13 February 2004 19.10 8 Source: Ofgem
4.131. See Appendix 9 for similar results for incumbent and best offer prices.
4.132. For both gas and electricity, the differential has reduced significantly since
1999/2000 and now stands at eight per cent for both fuels.
4.133. In both gas and electricity, the pricing analysis extends to February 2004 and
therefore includes recent credit price increases for some suppliers, but does not
capture price increases for prepayment customers that will become effective in
March 2004. Preliminary analysis suggests that these increases will not
materially widen the differential beyond the 9 per cent differential that existed at
December 2003.
4.134. Ofgem will continue to monitor the differential between prepayment and credit
prices to assess the extent to which prepayment customers continue to share the
benefits of supply competition.

Domestic Competitive Market Review 2004 Office of Gas and Electricity Markets 127 April 2004
Non-price offers
4.135. In addition to a wide range of price offers, suppliers also offer a variety of non-
price inducements that are designed to alter the value that customers place on
the particular supplier’s offering. This section examines specific forms of non-
price offers available in the domestic gas and electricity supply markets.
4.136. Ofgem examined a range of non-price offers in its Occasional Paper, when it
considered classes of offers in the market including:
♦ tie-ins, and
♦ bundled goods and services.
The Occasional Paper stated that, whilst aiming to retain customers is clearly not
in itself anti-competitive, Ofgem would pay particular attention to focused
initiatives aimed at prospective or past switchers that aim to reduce switching in
the incumbent’s favour and hence may foreclose the market.
4.137. Although this section considers examples of offers that might be included in
these broad categories, it does not attempt to define these offers into particular
categories.
4.138. Ofgem is interested in the incidence and extent of non-price offers, as these
offers can represent another form in which suppliers compete against each other
for the benefit of customers. Gas and electricity supply are functionally identical
products and Ofgem is interested to see how suppliers in practice add value to
gas and electricity supply for the benefit of customers.
4.139. For instance, differentiating a functionally equivalent product can benefit
customers through increasing choice and offering innovation to the basic
product. Equally however, Ofgem is interested in whether innovation and
product differentiation may come at a cost , either through higher costs or
reduced choices in the future.
4.140. This section considers three different types of non-price offers:
♦ affinity deals or partnerships
♦ product diversification, and

Domestic Competitive Market Review 2004 Office of Gas and Electricity Markets 128 April 2004
♦ product differentiation.
4.141. The section then assesses whether, on balance, non-price offers reflect ‘efficient’
outcomes arising from supply competition.
4.142. It is important to note that the examples of the types of non-price offer used in
this chapter are illustrative only, and do not imply any Ofgem view on the
specific offers discussed.
Affinity deals
4.143. Most ex-PESs and BGT have affinity partnerships with other well known brands.
Some key affinity partnerships include:
EDF/Nectar
4.144. EDF Energy offer Nectar card holders 100 Nectar points per fuel for existing
customers or when a customer switches gas or electricity to EDF. Partnership
members include Sainsbury’s, Barclaycard, Debenhams, BP and Vodafone. An
extra one-off bonus of 100 points per fuel is offered when registering on-line.
Customers earn 150 additional points on each fuel for each complete quarter the
customer remains with EDF. A customer who switches gas and electricity
accounts on-line and remains with EDF on both fuels for a full year would
therefore earn 1,600 points. Depending on payment method, self meter reads
and prompt payment, customers can earn up to 3,200 points in one year. The
value of these points to an individual customer will vary according to how they
choose to use them.
Powergen/Tesco Clubcard
4.145. Powergen, in partnership with Tesco, offers Tesco Clubcard points to customers
who switch household gas or electricity to Powergen. Switchers receive 500
points for each fuel (ie if a customer switches both fuels, they receive 1000
points. After switching, customers receive 1 Tesco Clubcard point for every £1
they spend on their bill. The value of these points to an individual customer will
vary according to how they choose to use them.
SSE/Airmiles

Domestic Competitive Market Review 2004 Office of Gas and Electricity Markets 129 April 2004
4.146. SSE offers Airmiles to customers who register with SSE for gas and electricity.
Specifically, SSE offers:
♦ 150 bonus miles for switching electricity supply
♦ 150 bonus miles for switching gas supply
♦ 1 mile for every £2 spent on electricity (ex VAT)
♦ 1 mile for every £2 spent on gas (ex VAT), and
♦ 25 bonus miles every 3 months for switching both gas and electricity
supplies.
4.147. The SSE website indicates that a customer switching to SSE and spending £50 a
month on energy could, in the first year, earn up to 700 miles. The value of
these Airmiles to an individual customer will vary according to how they choose
to use them.
Summary
4.148. With point rewards schemes, customers gain because they have greater
purchasing power with all members of the partnership. However while the offer
provides savings and increased choice in the short run, it may reduce the
incentives for customers to switch away in the long run. However it appears to
be open to other suppliers to create these types of schemes.
Product diversification
4.149. Almost all energy suppliers have diversified to supply both gas and electricity to
the domestic market. Many suppliers have also diversified into ancillary goods
and services, such as appliance services and wiring insurance. Other suppliers
have diversified into less related products, including financial products, and
home security.
4.150. Product diversification can enable a supplier to sell goods that were not
previously available together. In many cases, these attract a customer discount.
Dual fuel

Domestic Competitive Market Review 2004 Office of Gas and Electricity Markets 130 April 2004
4.151. A successful form of product diversification by energy suppliers has been dual
fuel. Customers have benefited from this product diversification through factors
that they may value such as price discounts and/or the convenience factor of
having one supplier22. On this basis, dual fuel offers have been highly beneficial
to customers, with millions of customers making savings from dual fuel
discounts, even if they do not choose the cheapest supplier. Suppliers have
benefited through the ability to retain and acquire new customers.
Product differentiation
4.152. Product differentiation differs from diversification in that suppliers seek to
differentiate a functionally identical product from a competitor’s product.
(Whereas diversification entails selling a range of goods which can then be sold
together, possibly with a discount.)
4.153. Product differentiation will act to raise customer choice. However this choice
can come at a cost, including higher prices, if customers ultimately pay for the
way in which the product has been differentiated (eg through expensive
marketing).
4.154. Products can be differentiated a number of ways. Suppliers may choose to
differentiate their product through direct marketing, or more general brand
awareness. This section only seeks to consider direct marketing (since this
relates to specific, identifiable offers).
Internet offers
4.155. Some suppliers now offer less expensive internet tariffs (eg Atlantic Electric and
Gas, British Gas, Powergen Online, ScottishPower.co.uk). These offers combine
online registration, access and management of bills/accounts and facilitate meter
readings submitted online by the customer. Most suppliers offer paperless billing
as part of their internet proposition.
4.156. Internet offers differentiate themselves from standard offers by targeting
customers who may not value the traditional customer service provided by
suppliers but prefer to manage contact with their supplier electronically.
22 This benefit will be less important for those customers who do not regularly contact their supplier.

Domestic Competitive Market Review 2004 Office of Gas and Electricity Markets 131 April 2004
Other offers
4.157. SSE is in partnership with the Royal Society for the Protection of Birds to provide
RSBP Energy. Under this offer, SSE makes contributions to the RSBP in return for
customers paying a premium price to reflect the cost of renewable sourced
energy.
Summary
4.158. By differentiating what are essentially functionally identical products, suppliers
can increase customer choice. In some cases this may result in lower prices (eg
internet prices), in other cases it may result in higher prices (eg green tariff
prices). In addition to suppliers’ own offers, affinity partnerships may also
increase choice to domestic gas and electricity customers.
Conclusions
4.159. Ofgem continues to monitor the development of non-price offers, to assess
whether these offers are benefiting domestic customers in both the short run and
the long run and in particular to consider their influence on customers’
switching decisions.

Domestic Competitive Market Review 2004 Office of Gas and Electricity Markets 132 April 2004
5. Profitability assessment
5.1. This chapter examines some issues relevant to the level of profits made by
domestic gas and electricity supply companies. This includes:
♦ estimating the discount that a new entrant could potentially offer relative
to the ex-PES in electricity supply or BGT in gas supply, whilst aiming to
operate profitably, and
♦ comparing valuations suggested by more recent merger transactions with
utility analysts’ estimates of the profit levels of some supply businesses.
Background
5.2. Ofgem would expect domestic gas and electricity supplier profitability to reflect
the extent of competition and the risk of operating in the sector. If suppliers are
highly profitable, in the absence of significant barriers to entry or expansion,
new companies would be expected to see opportunities to profit and therefore
enter the market. In doing so, existing suppliers’ profits are likely to fall. Credible
new entry – or the threat of it – therefore exerts competitive pressures on
existing suppliers, to the benefit of customers.
5.3. However ‘high’ profits are not of themselves evidence of a lack of competition.
Profits can also fund investment in service levels and product innovation. If
profits are relatively high in the short or medium term, this can have positive
benefits for customers if there is also adequate competitive pressure to stimulate
such investment.
5.4. In addition, gas and electricity suppliers no longer operate as monopolies.
Opening the supply markets to competition is likely to have increased the risks
faced by many of these suppliers in running their businesses. Profit expectations
in these sectors could therefore be expected to increase to reflect any increase in
risk.
5.5. However, if some suppliers are insulated to some extent from competitive
pressures, this is likely to manifest itself in inefficiencies and/or sustained and

Domestic Competitive Market Review 2004 Office of Gas and Electricity Markets 133 April 2004
high levels of profits without associated benefits to customers. An understanding
of profit levels therefore complements other chapters in this review.
5.6. A number of concerns have been raised about the level of profitability in the
domestic supply market relating to areas such as:
Incentives on ex-PES and BGT suppliers to compete
5.7. The Public Accounts Committee23 has recently suggested the domestic retail
market has been less competitive than the industrial and commercial sector and
has recommended that Ofgem carry out a review to determine whether the
suppliers are acting in an anti-competitive manner to the detriment of domestic
customers.
5.8. There are six major groups that supply the majority of domestic customers with
gas or electricity. Unlike other new entrants who have no legacy customers and
are therefore dependent on acquiring customers from other suppliers, each of
the major supply groups have a substantial number of customers which they
supplied prior to entering the competitive market. The question as to whether
adequate incentives exist on ex-PES or BGT suppliers to compete more
aggressively, given that they have these established and large scale businesses,
has therefore been raised by some parties.
Some customer groups pay more than others for the same product
5.9. Those customers who have never switched from their ex-PES or BGT tend to pay
more than those who have switched. Some observers have suggested that these
suppliers therefore earn profits from these customers that are inconsistent with a
competitive market that has been open for several years.
Switching activity may not reflect savings
5.10. While survey evidence suggests switching activity is driven by expectations of
price savings, the quality of information available to customers when making a
decision to switch raises questions about the extent to which these expectations
23 2nd Report (HC 63), “The new electricity trading arrangements in England and Wales”. The Committee of Public Accounts is appointed by the House of Commons to examine "the accounts showing the

Domestic Competitive Market Review 2004 Office of Gas and Electricity Markets 134 April 2004
have been realised. A number of suppliers have employed direct selling
techniques to encourage customer switching and it is possible that, in these
circumstances, customers may not always be in a position to choose from all of
the available options. It is therefore possible that suppliers charging less
competitive prices may have gained customers to a greater extent than would
otherwise be expected.
Poor quality of market information
5.11. Since the efficiency of markets is dependent on the accuracy and timeliness of
profit signals and ease of access to market information, limited public
information in this area and the complexity of acquiring the necessary
information suggests the gas and electricity supply markets may not be efficient
in terms of information availability24.
5.12. A comprehensive assessment of the validity of these concerns requires a
significant level of information which Ofgem does not believe it is justified in
seeking from the industry at present. The analysis in this chapter therefore seeks
to assess suppliers’ profitability using a headroom analysis and indicative levels
of profits derived from published sources.
Terminology and data
5.13. This section explains some of the terminology and data used in this chapter. The
Glossary at the end of this document explains other concepts that may be useful
in understanding the issues raised.
5.14. Headroom is the discount that a new entrant can offer relative to the ex-PES or
BGT. Ofgem has in the past conducted an analysis of the differential between
the estimated costs of a new entrant in the electricity and gas supply markets and
appropriation of the sums granted by Parliament to meet the public expenditure, and of such other accounts laid before Parliament as the committee may think fit". 24 Publicly available information on profitability does not provide adequate detail or comparable information on profits earned by gas and electricity suppliers to answer many of the questions raised above. While some suppliers, such as BGT and Powergen, do publish information on operating margins for supply to residential customers, there are issues relating to compatibility of financial reporting which limit inferences that can be drawn about the extent of differences in these profit levels. Also, since many of the ex-PES or BGT suppliers are part of vertically integrated groups, all of whom supply more than a single product, issues of cost allocation and differences that may exist between profitability in gas supply compared with electricity supply prevent more detailed analysis of these areas.

Domestic Competitive Market Review 2004 Office of Gas and Electricity Markets 135 April 2004
the prices charged by ex-PESs or BGT. This ‘Headroom analysis’ was last
published in December 2001 and assessed the discount that a new entrant can
offer relative to the ex-PES or BGT supplier. It suggested that for gas supply, a
headroom (net of the risk free rate) of between 5 - 8 per cent existed depending
on payment type. For electricity, headroom varied across regions, with an
average of around 8 per cent for standard domestic and around 3 per cent for
domestic economy 7 where the method of payment was direct debit.
5.15. A further area of information on supplier expectations of potential profits is
derived from the prices paid for domestic customers in the event of a merger.
These prices reflect the anticipated level of profits from acquiring another
supplier’s domestic customers and provide a useful indicator of views about
profit levels in the domestic supply market. This analysis is also presented in this
chapter.
Key facts and trends
5.16. The analysis in this chapter provides some insight into profitability in the supply
of gas or electricity.
5.17. The evidence from the headroom analysis suggests that entrants could still
profitably enter the retail supply market although supply margins for a new
entrant are relatively low for smaller suppliers, particularly in gas. New entry
may require access to existing distribution and marketing channels and/or an
established brand unless the new entrant can lower costs through innovation
below those assumed in this analysis. There is no evidence that this is deterring
new entry, but it appears to constrain what kind of business plan entrants
pursue, eg to enter on a large scale based on an existing brand and/or
distribution channel.
5.18. Published sources suggest that supply businesses may be earning profit margins
of between 5 and 8 per cent. This implies customer valuations lower than those
paid in more recent merger transactions involving domestic supply businesses.
This may be because the price paid in mergers takes account of a wide range of
factors which may account for approximately a third of the price paid.

Domestic Competitive Market Review 2004 Office of Gas and Electricity Markets 136 April 2004
Analysis
Headroom analysis
5.19. This review updates Ofgem’s headroom analysis published in December 2001.
The analysis aims to gauge the level of headroom for new market entrants in the
domestic gas and electricity supply sectors. In obtaining the results presented
below, the costs faced by a new entrant have been compared to the ex-PES or
BGT suppliers’ prices for electricity or gas respectively. Scale has been allowed
for in the analysis of the costs faced by a new entrant as it is likely that a number
of cost components are sensitive to the number of customers that a new entrant
acquires. The process of estimating new entrants’ costs is sensitive to many
assumptions, and the results should be interpreted with this in mind. Changes in
certain assumptions since the headroom analysis of December 2001 mean that
the headroom figures presented below provide a snap-shot rather than a
comparison with previous analyses. For reference, the underlying costs and the
ex-PES or BGT’s prices used to obtain the results for the gas and electricity
headroom analysis are provided in Appendices 10 and 11, along with the
assumptions that have been made.
5.20. Figure 5.1 shows the headroom that a new entrant gas supplier could achieve
given a specified number of customers. The headroom levels presented in the
graph have been formulated by assuming that some supply costs and marketing
costs are sensitive to scale (ie the number of customers the new entrant is able to
acquire). The costs and BGT prices have been calculated assuming a medium
level of consumption25 for each payment method and then weighted by
assuming that 45 per cent of customers pay by standard credit, 45 per cent pay
by direct debit and 10 per cent pay by prepayment. The analysis is based on the
most recent data available for each cost and price component.
25 The medium levels of consumption used for the gas headroom analysis were 19,050 kWh for standard credit and direct debit, and 12,300 kWh for prepayment.

Domestic Competitive Market Review 2004 Office of Gas and Electricity Markets 137 April 2004
Figure 5.1: Gas headroom (per cent) potentially available to a new entrant across varying levels of scale
0
5
10
15
20
25
30
0.5 1 2 3 4 5 6 7 8 9 10 11 12 13 14 15
Number of customers (millions)
Hea
droo
m (p
er c
ent)
Source: Ofgem research
5.21. Figure 5.2 shows the headroom that a new entrant electricity supplier could
achieve given a specified number of customers. As with gas, the headroom
levels presented in the graph have been formulated by assuming that some
supply costs and marketing costs are sensitive to scale. The costs and ex-PES
prices have been calculated assuming a medium level of consumption26 in line
with that of a standard domestic customer and for each payment method. They
have then been weighted by assuming that 45 per cent of customers pay by
standard credit, 40 per cent pay by direct debit and 15 per cent pay by
prepayment. The graph does not illustrate headroom where customers are on an
Economy 7 tariff but costs relating to these types of tariff and the corresponding
headroom figures are given in Appendix 11. The analysis is based on the most
recent data available and assumes that the new entrant has the same costs that
are presented in Appendix 11.
26 The medium levels of consumption used for the electricity headroom analysis were 3,300 kWh for all payment methods.
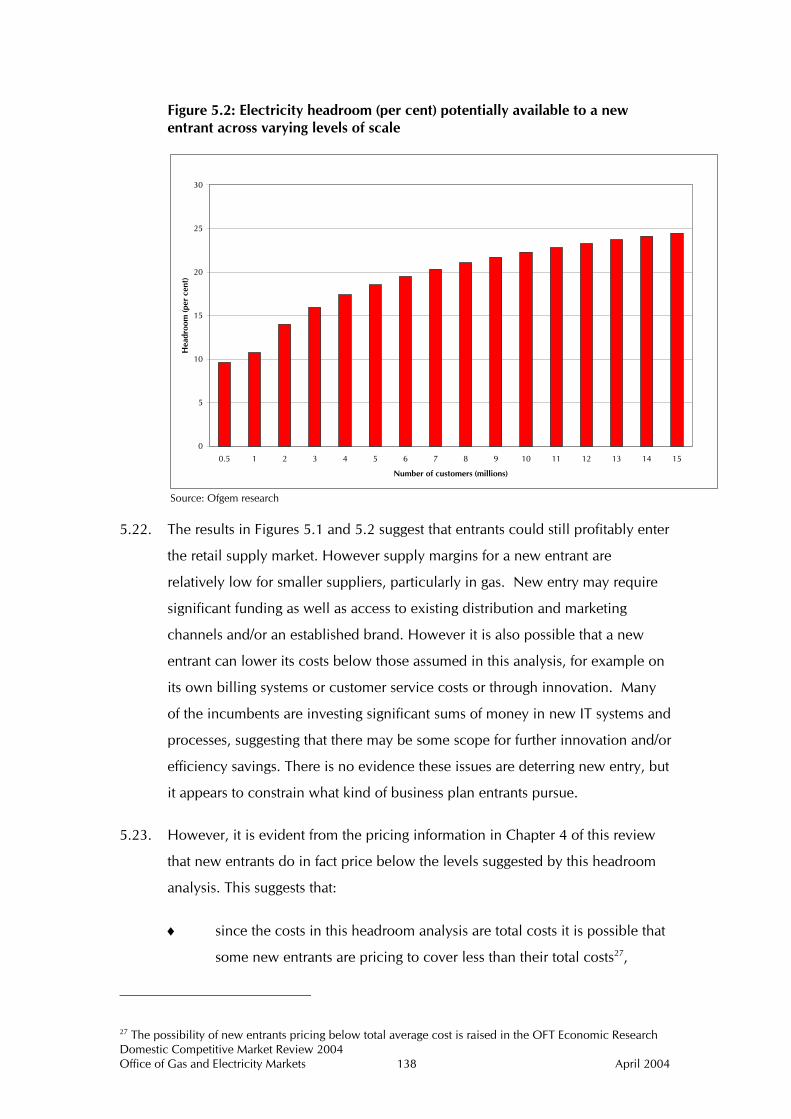
Domestic Competitive Market Review 2004 Office of Gas and Electricity Markets 138 April 2004
Figure 5.2: Electricity headroom (per cent) potentially available to a new entrant across varying levels of scale
0
5
10
15
20
25
30
0.5 1 2 3 4 5 6 7 8 9 10 11 12 13 14 15
Number of customers (millions)
Hea
droo
m (p
er c
ent)
Source: Ofgem research
5.22. The results in Figures 5.1 and 5.2 suggest that entrants could still profitably enter
the retail supply market. However supply margins for a new entrant are
relatively low for smaller suppliers, particularly in gas. New entry may require
significant funding as well as access to existing distribution and marketing
channels and/or an established brand. However it is also possible that a new
entrant can lower its costs below those assumed in this analysis, for example on
its own billing systems or customer service costs or through innovation. Many
of the incumbents are investing significant sums of money in new IT systems and
processes, suggesting that there may be some scope for further innovation and/or
efficiency savings. There is no evidence these issues are deterring new entry, but
it appears to constrain what kind of business plan entrants pursue.
5.23. However, it is evident from the pricing information in Chapter 4 of this review
that new entrants do in fact price below the levels suggested by this headroom
analysis. This suggests that:
♦ since the costs in this headroom analysis are total costs it is possible that
some new entrants are pricing to cover less than their total costs27,
27 The possibility of new entrants pricing below total average cost is raised in the OFT Economic Research

Domestic Competitive Market Review 2004 Office of Gas and Electricity Markets 139 April 2004
perhaps to achieve scale and market share before raising their prices to
achieve sustainable profitability. This sort of pricing strategy by new
entrants is often seen in other markets, and
♦ through efficiency gains and/or innovation, some new entrants may be
able to reduce costs below those levels presented in Appendices 10 and
11.
Analysis of published sources
5.24. There have been a number of mergers and acquisitions in the retail supply
market since it was opened to competition. Figure 5.3 below sets out the
acquisition target, date of acquisition and cost per customer (rebased to 2002
prices) for some of these mergers based on media reports and other sources. It
shows that while the prices paid per customer acquired through merger activity
have varied over time, they have tended to increase. Since this information is
based on sources which have not been verified through Ofgem’s formal powers,
the discussion below should be interpreted with this in mind.
Paper ‘Switching costs - Part one: Economic models and policy implications’ and ‘Part two: annexes’, by National Economic Research Association – April 2003.

Domestic Competitive Market Review 2004 Office of Gas and Electricity Markets 140 April 2004
Figure 5.3: Merger activity in Great Britain gas and electricity supply sector
(rebased to 2002 prices)
£95
£205£190
£234
£321
£299£310
£300
£0
£50
£100
£150
£200
£250
£300
£350
Nov-98 Jun-99 Aug-00 Aug-00 Feb-01 Aug-01 Jul-02 Dec-02
Midlandselectricity
Sweb Norweb Swalec Yorkshire Northern Seeboard TXU
Acquired business and date of acquisition
Cos
t pe
r cu
stom
er (£
)
Source: Datamonitor
5.25. The prices paid in mergers provide a useful basis to assess profitability in the gas
and electricity supply sector since they will take some account of the profit
expectations of the acquiring business. However, merger prices do not only
reflect profit expectations from the domestic supply business. They also take
some account of factors such as long term strategic value or benefits in related
markets arising from the merger transaction. Merger prices can also reflect the
potential for additional revenue streams within the domestic supply market, for
example, revenues from moving single fuel customers to dual fuel offers.
5.26. Given the above, as a contribution to the debate on profitability in the domestic
supply sector, Ofgem has presented illustrative valuations for several supply
businesses and compared these with merger prices paid by acquiring suppliers
in merger transactions. Estimates of domestic supply profit margins and costs of
capital suggested by utility analysts in their assessments of supply businesses are
used in this analysis rather than the results of the headroom analysis set out
above.
5.27. The valuation of gas and electricity supply businesses is made on a per-customer
basis using estimates of average revenues available to Ofgem through its
databases of domestic prices. In this illustration, profit margins of between 5 and
Domestic Competitive Market Review 2004 Office of Gas and Electricity Markets 141 April 2004
8 per cent, and cost of capital of between 11 and 16 per cent have been taken as
these cover the ranges suggested by a number of utility analysts. However, these
should not be taken as Ofgem’s views of the reasonableness or otherwise of
supplier profit margins or costs of capital.
5.28. The three supply businesses considered are Seeboard, TXU and BGT. The
acquisition by LE Group of Seeboard in 2002 and of the TXU business by
Powergen in 2002 are the most recent mergers in this sector. BGT is a significant
player in the supply sector and is therefore included in the analysis.
5.29. The results of this exercise suggest a valuation per customer of around £186
compared to the £310 reportedly paid by LE Group for Seeboard’s customers
and a valuation of around £201 per TXU customer compared to the £300
reportedly paid by Powergen for the TXU supply business. The highest valuation
was for BGT’s customers, almost 28 per cent higher than that for TXU customers,
at about £257.
5.30. The difference between these valuations and the publicised prices paid for
customers in the Seeboard and TXU mergers is material. As discussed above,
prices paid in mergers take account of a wide range of factors and it appears that
these account for approximately a third of the price paid in these mergers.
5.31. Based on these customer valuations Ofgem has also assessed what return on
sales are suggested by these valuations. Given that these are largely incumbent
customer bases and therefore subject to erosion through the introduction of
competition, churn rates of 4 per cent have been assumed given evidence from
other sources28. Based on the range of estimates suggested by utility analysts, this
suggests that return on sales in the supply business taken for purposes of this
illustration might lie between 8 and 10 per cent.
28 Datamonitor report “2002 UK Residential Supply Review”, Table 9, page 35.
Domestic Competitive Market Review 2004 Office of Gas and Electricity Markets 142 April 2004
Summary
5.32. The evidence from the headroom analysis suggests that entrants could still
profitably enter the retail supply market although supply margins for a new
entrant are relatively low for smaller suppliers, particularly in gas. New entry
may require access to existing distribution and marketing channels and/or an
established brand unless the new entrant can lower costs through innovation
below those assumed in this analysis.
5.33. Ofgem’s analysis using the range of estimates of profitability by utility analysts
suggests valuations that are approximately two-thirds of those paid in the
mergers involving Seeboard and TXU.
5.34. In order to further understand supplier profitability Ofgem will assess whether
price changes are justified relative to changes in supplier costs (measured by
changes in market prices).

Domestic Competitive Market Review 2004 Office of Gas and Electricity Markets 143 April 2004
6. Concentration and indicators of competitive intensity
6.1. This chapter considers a number of issues about the structure of the gas and
electricity supply sector, particularly the possible effect that recent changes in
the number of active suppliers may have on competition.
Background
6.2. In competitive markets, different types of competitive activity may arise as a
result of differing market structures. For example a market with many small firms
would be different to one with only two or three firms. Concerns have been
expressed that the recent consolidation that has taken place in gas and electricity
is likely to have the effect of reducing the level of competitive activity and
therefore reducing the benefits to customers of competition.
6.3. The analysis used in this chapter allows an assessment of these concerns:
♦ co-movement of prices may indicate similar competitive pressures on
suppliers, but it may also be indicative of coordination between
suppliers. The analysis therefore looks at how suppliers’ gas and
electricity prices have moved over time, nationally and regionally - a
technique called “price parallelism analysis”. This enables an evaluation
of the extent to which competitive conditions may be the same for
different products (gas and electricity) and in different regions
♦ looking at how concentrated the gas and electricity sectors are using
information about suppliers’ shares of customers that show how the
structure of the market has changed over time, and
♦ discussing whether the economic characteristics of the domestic gas and
electricity sectors may be conducive to coordination among competing
suppliers.
6.4. As explained in Chapter 1, this document does not provide an assessment of
relevant markets that would be needed for a Competition Act investigation. It
should also be noted that Ofgem has never come to a formal view on the

Domestic Competitive Market Review 2004 Office of Gas and Electricity Markets 144 April 2004
relevant market when considering Competition Act complaints about supply
competition.
Terminology and data
6.5. This section explains some of the terminology and data used in this chapter.
Additional information is available in the Glossary at the end of the document.
♦ coordinated effects – given certain market conditions, firms may realise
that it is in their mutual best interest to cease to compete actively, eg by
not undercutting one another on price, and sustain existing prices, rather
than face the threat of price competition (or a price war) tomorrow. If this
behaviour is maintained without direct agreement between firms then
the resulting impact on competition is called ‘coordinated effects’. The
term comes from merger analysis where the ‘effects’ of a merger are
considered
♦ dominance – “…a position of economic strength enjoyed by [a company]
which enables it to prevent effective competition being maintained on
the relevant market by affording it the power to behave to an appreciable
extent independently of its competitors, customers and ultimately of
consumers”29
♦ joint dominance - also known as ‘collective’ or ‘oligopolistic’
dominance. This term is used to refer to separate legal entities that
together hold a dominant position on the relevant market
♦ market share - a measure of industry concentration that shows the
proportion of sales of a good or service held by individual companies
within a market
♦ market definition - market definition delineates the relevant economic
market in which a company competes through a product, geographic
and, possibly, temporal dimension
29 Definition used by the European Court in Case 27/76 United Brands v EC Commission [1978] ECR 207, [1978] 1 CMLR 429; and in other cases.

Domestic Competitive Market Review 2004 Office of Gas and Electricity Markets 145 April 2004
♦ market power - describes a situation where the constraints which would
usually ensure that an undertaking behaves in a competitive manner are
not working effectively30
♦ non-coordinated effects - also referred to as ‘unilateral effects’, this
concept occurs where a single firm is able to exercise market power
independently of other firms in the market, eg by maintaining high
prices. This may occur as a result of a merger, and
♦ substitute - a good or service that is a possible alternative for the
customer so that where good B is a substitute for good A, a change in
price for good A will have an impact on demand for good B.
6.6. The price parallelism analysis (ie examining how suppliers’ prices have moved
over time, nationally and regionally to see if there is co-movement of prices)
uses historical pricing data (from June 2000 – December 2003) extracted from
Ofgem’s Domestic Prices Database (DPD)31. The bills are shown in real prices
(December 2003=100) and are inclusive of VAT. Various strands of analysis
were carried out by product (gas and electricity), region (ex-PES region and
nationally) and payment method (direct debit, standard credit and prepayment).
See Appendices 12 and 13 respectively for more detail on methodology and
different cuts of the analysis32.
6.7. The data used in the concentration section for electricity is collected by Ofgem
on a monthly basis from electricity distribution companies. The gas data on
concentration is collected directly from gas suppliers, also on a monthly basis.
Data from surveys conducted by J.D. Power and Associates has also been used
for some concentration indicators. In June 2003 Ofgem consulted on and
published a decision about its intention to publish information about suppliers’
market shares33; the data set out in this document is consistent with that
decision or with information published in other Ofgem documents.
30 OFT 415, Assessment of Market Power, September 1999, page 2. 31 For dual fuel prices data is only available from April 2002. 32 The direct debit payment method is presented here. Ofgem uses this payment method because it believes direct debit is more reflective of competitive pressures for several reasons: this was the first payment method to have price controls lifted (in gas), most companies use direct debit as their spearhead for gaining customers and it is the fastest growing payment method. 33 “Publishing information about suppliers’ market shares – Ofgem’s decision”, June 2003,

Domestic Competitive Market Review 2004 Office of Gas and Electricity Markets 146 April 2004
6.8. Throughout this chapter, if customer shares do not sum to exactly 100 this is due
to the rounding of figures up or down.
Key facts and trends
6.9. The product analysis indicates that there is little co-movement between gas and
electricity prices indicating that different competitive pressures appear to
influence the prices of these products.
6.10. The regional analysis indicates that competitive pressures, as reflected in prices,
tend to be more uniform across regions for gas than for electricity. This is
consistent with, but not proof of, a regional definition of markets for electricity
and a national market definition for gas.
6.11. The section on concentration measures illustrates the continued erosion of
incumbent suppliers’ shares of customers. BGT now has 61 per cent of gas
customers and on average the ex-PESs have a share of 59 per cent of customers
in-area. The section also illustrates increases in customer shares for BGT in
electricity and the ex-PESs in gas.
6.12. The section illustrates high concentration indices in gas on a national basis and
in electricity on a regional basis. Although there are six large suppliers, there are
a total of nine active domestic gas suppliers and 12 active domestic electricity
suppliers.
6.13. The section on coordination illustrates that some of the pre-conditions for
coordination exist in gas and electricity supply. However, at present there is no
evidence to suggest that coordination between suppliers is taking place.
www.ofgem.gov.uk.

Domestic Competitive Market Review 2004 Office of Gas and Electricity Markets 147 April 2004
Analysis
Price Parallelism Analysis34
6.14. Price parallelism analysis is useful in evaluating the extent to which
competitive conditions may be the same for different products (eg gas and
electricity) and across different geographical regions. It considers whether
prices in different sectors move together over time. If prices do tend to move
together then this may indicate that competitive conditions are similar for the
two products and therefore that they may be substitutes. A correlation of price
movements is consistent with, but not proof of, two goods being sold in the
same market35.
6.15. Co-movement of prices may indicate similar competitive pressures on
suppliers but it may also be indicative of coordination between suppliers.
Coordination is discussed further in the final section of this chapter.
6.16. In some cases a visual check of the data may indicate co-movement; however
a more robust approach is to calculate correlation coefficients. The
correlation coefficient of two sets of data is a number ranging between -1 and
1 that indicates how much a change in one variable may explain a change in
another. It indicates the degree of association between two variables but does
not imply that a change in one variable causes a change in the other.
6.17. Common costs shared across products and/or regions may give a false
impression of co-movement. Therefore the prices used in this analysis
exclude regulated costs, ie transportation, distribution and metering costs for
gas and electricity36. Chapter 4 shows the percentage of a domestic
customer’s bill that comprises these costs; they show more regional variation
34 Ofgem has previously published some price parallelism analysis in its Occasional Paper. The analysis in this review builds on the previous analysis extending it by including a wider spread of prices and stripping out more of the regulated costs. 35 OFT, “The role of market definition in monopoly and dominance inquires”, July 2001, page 11. Also see OFT, “Quantitative techniques in competition analysis”, prepared for the OFT by LECG Ltd, Research Paper 17, October 1999, page 53 to 55 for further discussion on price correlation analysis. 36 For gas prices Transco charges are stripped out. It should be noted that Ofgem is unable to exclude National Transmission System (NTS) Entry Capacity charges. These are determined by auctions and if Transco over recovers on auctions shippers may be refunded. The electricity prices have been stripped of Distribution Use of System (DUoS) charges and Transmission Network Use of System (TNUoS) charges.

Domestic Competitive Market Review 2004 Office of Gas and Electricity Markets 148 April 2004
in electricity than gas. See Appendices 12 and 13 respectively for more detail
on methodology and different cuts of the analysis.
Product boundaries
6.18. Figure 6.1 shows national median gas and electricity direct debit prices from
June 2000 to December 2003. These prices have shown little co-movement
since June 2000. In the early period the prices moved in separate directions with
a steep increase in gas prices and slow reductions in electricity prices. Analysis
of the other payment methods produced similar results (Figures A13.1 and A13.5
in Appendix 13).
Figure 6.1: Price parallelism analysis: electricity and gas direct debit median bills excluding transportation charges (medium consumption bills, inc. VAT, Dec 03 = 100)37
140
150
160
170
180
190
200
210
220
Jun-
00
Sep-
00
Dec
-00
Mar
-01
Jun-
01
Sep-
01
Dec
-01
Mar
-02
Jun-
02
Sep-
02
Dec
-02
Mar
-03
Jun-
03
Sep-
03
Dec
-03
Med
ian
bill
(£)
Electricity Gas
Source: Ofgem
6.19. The correlation coefficient for this price series is -0.89. This suggests a negative
relationship between domestic electricity and gas prices and indicates different
competitive pressures operating on gas and electricity prices. It is also consistent
with domestic gas and electricity supply being in separate markets.
37 Transportation charges for electricity include distribution use of system (DUoS) charges and Transmission Network use of system (TNUoS) charges, gas charges are sourced from Tranco. Medium consumption bills are used for gas this is 19,050kWh and for electricity 3,300kWh per annum.

Domestic Competitive Market Review 2004 Office of Gas and Electricity Markets 149 April 2004
6.20. These results also suggest that gas and electricity are not substitutes. Intuitively
this seems right - customers are unlikely to switch from gas central heating to
electricity central heating in response to an increase in gas prices, at least in the
short run, and gas is not normally used for lighting. However the two fuels are
related due to common costs - about 39 per cent of electricity is generated from
gas38.
6.21. The results are similar to those set out in the Occasional Paper which indicated
that gas and electricity are unlikely to be substitutes in the short term.
Geographical boundaries
6.22. Price parallelism analysis can also be used to assess the extent to which
competitive conditions are the same across different regions. Co-movement of
prices across regions is consistent with those regions forming part of the same
market. As before, this is tested using historical pricing data stripped of regulated
costs.
6.23. Figure 6.2 shows clear co-movement of gas prices across all ex-PES regions. The
visual picture is supported by high and positive correlation coefficients which
are set out in Appendix 14, Table A14.1. This suggests that competitive
conditions are the same across different regions and supports the hypothesis of a
national domestic gas supply market.
38 DTI, “Digest of United Kingdom energy statistics 2003”, a national statistics publication, 2003, page 122.

Domestic Competitive Market Review 2004 Office of Gas and Electricity Markets 150 April 2004
Figure 6.2: Price parallelism analysis: gas direct debit median regional bill excluding transportation charges (medium consumption bills, inc VAT, Dec 03 =100)
150
160
170
180
190
200
210
220
Jun-
00
Sep-
00
Dec
-00
Mar
-01
Jun-
01
Sep-
01
Dec
-01
Mar
-02
Jun-
02
Sep-
02
Dec
-02
Mar
-03
Jun-
03
Sep-
03
Dec
-03
Ave
rage
bill
(£)
East Midlands Eastern LondonManweb Midlands NorthernNorweb Scottish Hydro Scottish PowSeeboard Southern SwalecSweb Yorkshire
Source: Ofgem
6.24. Figures 6.3 and 6.4 show the same type of regional analysis for electricity and
dual fuel respectively. Here, price co-movement is not as evident as in gas.
Figure 6.3: Price parallelism analysis: Electricity direct debit median regional bill excluding DUoS and TNUoS charges (medium consumption bills, inc VAT, Dec 03 =100)
150
160
170
180
190
200
Jun-
00
Sep-
00
Dec
-00
Mar
-01
Jun-
01
Sep-
01
Dec
-01
Mar
-02
Jun-
02
Sep-
02
Dec
-02
Mar
-03
Jun-
03
Sep-
03
Dec
-03
Ave
rage
bill
(£)
East Midlands Eastern LondonManweb Midlands NorthernNorweb Scottish Hydro Scottish PowSeeboard Southern SwalecSweb Yorkshire
Source: Ofgem

Domestic Competitive Market Review 2004 Office of Gas and Electricity Markets 151 April 2004
Figure 6.4: Price parallelism analysis: Dual fuel direct debit median regional bill excluding DUoS, TNUoS and transportation charges (medium consumption bills, inc VAT, Dec 03 =100)
330
340
350
360
370
380
390
Apr
-02
Jun-
02
Aug
-02
Oct
-02
Dec
-02
Feb-
03
Apr
-03
Jun-
03
Aug
-03
Oct
-03
Dec
-03
Ave
rage
bill
(£)
East Midlands Eastern LondonManweb Midlands NorthernNorweb Scottish Hydro Scottish PowSeeboard Southern SwalecSweb Yorkshire
Source: Ofgem
6.25. The correlation coefficients for all regions are in Appendix 14 (Tables A14.2 –
A14.3). The coefficients for electricity are not as consistently high and positive as
for gas. The value of the correlation coefficients varies, many are close to zero
and many of them are negative. This result is inconsistent with a national market
for electricity.
6.26. The correlation coefficients for regional dual fuel prices also present a mixed
result. However, Ofgem currently has fewer data points for dual fuel and the
analysis is therefore less robust than for gas and electricity.
6.27. This analysis tends to confirm the view that competitive conditions in electricity
are more uniform on a regional rather than a national basis.
Concentration measures
6.28. Concentration measures are an important indicator of market structure and,
taken in conjunction with other factors, can also show whether a supplier has
market power. Analysis of the changes in suppliers’ customer shares over time
can give an indication of how they have performed in relation to each other.

Domestic Competitive Market Review 2004 Office of Gas and Electricity Markets 152 April 2004
6.29. This section gives an overview of concentration measures in gas and
electricity. It looks at how concentration has changed over time on a national
and a regional basis for electricity, and on a national basis for gas. It also sets
out:
♦ shares of customers split according to payment type
♦ dual fuel shares
♦ other indices of concentration
♦ total electricity and gas customer number measures, and
♦ the number of active suppliers.
Customers obtained through different brands
6.30. A supplier’s customer share includes all its gas and/or electricity customers,
including those acquired in partnership with other companies. These ‘affinity
partnerships’ are discussed in more detail in Chapter 4 and appear to be playing
an increasingly important role in encouraging credible new entry to the gas and
electricity sectors.
6.31. Ofgem does not currently have information about how many customers
registered to a supplier have been acquired through affinity partnerships. This
information could enhance the understanding of competitive dynamics, identify
the degree of competitive pressure exerted by such offers, help to identify
characteristics of ‘credible new entry’ and could indicate how effective this type
of product differentiation is.
Electricity suppliers’ customer shares
6.32. Ofgem has used data on customer numbers to calculate what percentage of the
total number of electricity customers are supplied by each of the major groups of
electricity supplier. This information has been analysed
♦ on a national basis, ie Great Britain
♦ on a regional basis, ie ‘in-area’

Domestic Competitive Market Review 2004 Office of Gas and Electricity Markets 153 April 2004
♦ over time, from September 2000 to December 2003, and
♦ for customer shares in Scotland.
6.33. Table 6.1 shows that BGT and Powergen have the highest number of domestic
electricity customers on a national basis. BGT’s share of electricity customers
grew by about 10 per cent from September 2000 to September 2002 but since
then has grown more slowly. Powergen’s acquisition of TXU in October 2002
means that it has overtaken npower as the second largest electricity supplier on a
national basis. Appendix 16 gives details of recent merger activity.
Table 6.1: Principal electricity supplier group shares of domestic electricity customers39 in Great Britain (per cent)
Group Sep-00 Sep-01 Sep-02 Sep-03 Dec-03
Powergen 8 8 8 22 21 TXU Energi 17 15 15 BGT 14 17 22 23 24 npower 8 19 17 16 15 Northern Electric 4 Yorkshire 7 EDF Energy 10 10 15 14 14 Seeboard 6 6 SSE Energy 14 14 13 14 14 ScottishPower 10 10 10 10 11 Others 0 1 0 1 1 Source: Distribution companies
6.34. Suppliers’ national shares contrast with their regional shares. Table 6.2 shows
that within their ex-PES regions every ex-PES supplier has a majority of electricity
customers.
39 Meter points are taken as a proxy for customer numbers, ie one electricity meter is assumed to equal one electricity customer.

Domestic Competitive Market Review 2004 Office of Gas and Electricity Markets 154 April 2004
Table 6.2: Ex-PES supplier ‘in area’ customer shares by customer numbers
Current ex-PES Owner
Area Sep-99
Sep-00
Sep-01
Sep-02
Sep-02
Sep-03
Sep-03
Dec-03
Dec-03
Lice
nce
Lice
nce
Lice
nce
Gro
up
Lice
nce
Gro
up
Lice
nce
Gro
up
Lice
nce
Midlands 89 78 68 60 60 55 54 54 53
Yorkshire 91 80 69 64 61 59 54 57 52
npower
Northern 89 75 64 64 58 58 53 56 52
East Midlands
88 76 66 60 60 59 56 58 56
Eastern 89 78 71 65 64 64 60 63 59
Powergen
North West 91 79 67 58 57 55 51 53 49
Southern 91 80 71 68 68 68 68 68 68
North Scotland
94 89 83 83 83 82 82 82 82
SSE Energy
South Wales 90 82 72 68 67 68 68 68 67
South Scotland
93 82 72 65 65 64 64 63 63 Scottish Power
Merseyside & North Wales
90 79 68 60 60 56 56 55 55
London 92 82 73 69 68 67 66 66 65
South West 95 85 75 70 68 66 64 64 63
EDF Energy
South East 89 81 70 67 64 64 62 63 61
All areas All areas 90 80 70 66 65 62 60 61 59
Source: Distribution companies
6.35. The ‘Current ex-PES Owner’ column refers to suppliers who own the ex-PES
business in each region as of December 2003. In 2002 and 2003, the table
distinguishes between customers in the ex-PES ‘Group’ and customers registered
to the ex-PES ‘Licence’40. The ‘Licence’ measure shows how the inherited ex-
PES customer base has eroded over time whilst the slower speed of the erosion
of the ‘Group’ measure represents the acquisition activities of the ex-PES
suppliers. The ‘Group’ measure represents all customers currently supplied by
the ex-PES supplier.
6.36. Regional customer shares show that, despite the erosion of ‘in-area’ share, the
ex-PES suppliers still have the majority of customers for both the ‘Group’ and the
‘Licence’ measure. Although these customer shares can indicate levels of
competitive rivalry in each region they may also reflect underlying factors that
40 The term ‘licence’ is used loosely here, strictly speaking market share by ‘licence’ refers to the number of customers registered to each supplier’s Market Participant ID, or MPID, which are codes allocated to the ex-PES at the start of competition. Recently some suppliers have started re-allocating customers from old ex-PES MPIDs once they have taken them over. Because of this, from 2004 onwards Ofgem will only report on ex-

Domestic Competitive Market Review 2004 Office of Gas and Electricity Markets 155 April 2004
affect competition. For instance, in North Scotland, fewer customers than the
Great Britain average have a gas supply. The comparatively small erosion of
customer shares in that region may reflect a number of factors:
♦ fewer opportunities for suppliers to cross sell gas to electricity customers
♦ lower levels of doorstep sales activity in rural regions because doorstep sales
are less cost effective in sparsely populated areas, and
♦ the strength of the ex-PES brand.
6.37. Table 6.3 shows the total electricity customer shares of the two Scottish ex-PESs
and the share of all other suppliers for the whole of Scotland. Overall
ScottishPower has the largest share of electricity customers in Scotland with 47
per cent of all Scottish customers whilst 25 per cent are with SSE, reflecting the
lower population level in North Scotland. This contrasts with the fact that in the
North Scotland region, SSE has the biggest in-area customer share (83 per cent)
of all ex-PESs. BGT (trading as Scottish Gas) has most of the customers in the
‘others’ category.
Table 6.3: Electricity customer shares by supplier in Scotland (in percentage)
Sep-00 Sep-01 Sep-02 Sep-03 Dec-03
ScottishPower 60 52 48 47 47 SSE Energy 24 25 25 25 25 Other suppliers 17 23 27 28 28 Source: Distribution companies
6.38. Appendix 17 presents charts for each ex-PES region showing the evolution of
electricity incumbent group shares and entrant shares from August 2001 to
December 2003.
Gas suppliers’ customer shares
6.39. Ofgem has used data from gas suppliers on customer numbers to calculate what
percentage of the total number of gas customers are supplier by each of the
principle gas suppliers. This information has been analysed on a national basis,
ie Great Britain as follows:
PES ‘group’ market shares.

Domestic Competitive Market Review 2004 Office of Gas and Electricity Markets 156 April 2004
♦ over time from September 1998 to December 2003 for BGT and new entrant
customer shares
♦ as a snap shot for each major group for December 2003, and
♦ over time from March 2002 to December 2003 for each major group.
6.40. Table 6.4 shows the erosion of BGT’s share of domestic gas customers over time.
It appears that the rate of erosion has been gradually slowing. Figure 3.5 in
Chapter 3 on switching illustrates the flows of customers between new entrants
and BGT.
Table 6.4: BGT's share of domestic gas customers41 over time (per cent)
BGT New Entrants
Sep-98 84 16 Sep-99 75 25 Sep-00 71 29 Sep-01 67 33 Sep-02 64 36 Sep-03 62 38 Dec-03 61 39
Source: Ofgem/Domestic Gas Suppliers
6.41. Figure 6.5 shows the December 2003 national shares of the principal gas
suppliers by customer numbers.
41 Gas customers are defined as each individual supply point being supplied as defined under the network code.

Domestic Competitive Market Review 2004 Office of Gas and Electricity Markets 157 April 2004
Figure 6.5: Domestic gas customer shares (December 2003)
Other, 1%Edf, 5%
BGT, 61%
Scottish Power, 6%
SSE, 7%
Powergen, 12%
Npower, 9%
Source: Ofgem/Domestic Gas Suppliers
6.42. Figure 6.6 shows the monthly movement of gas customer shares since March
2002. The figure uses a logarithmic scale to show the changes over time. This
type of scale enables the graph to show bigger variations in the shares of the
largest companies at the same time as seeing in detail how the ‘others’ category
of suppliers has varied.

Domestic Competitive Market Review 2004 Office of Gas and Electricity Markets 158 April 2004
Figure 6.6: Gas national customer shares time series March 2002 to December 2003)
0.1
1
10
100
Mar
-02
Jun-
02
Sep-
02
Dec
-02
Mar
-03
Jun-
03
Sep-
03
Dec
-03
Mar
ket
Shar
es (%
) - L
ogar
ithm
ic S
cale
BGT Scottish Power Npower Edf Powergen SSE Others
Source: Ofgem/Domestic Gas Suppliers
6.43. BGT’s share of customers has been gradually declining, whilst SSE and
ScottishPower have experienced steady increases in their gas customer numbers.
EDF and Powergen increased their customer share as a result of acquisitions (see
Appendix 16 for recent merger activity details). npower’s customer share has
remained relatively stable over the period (see Chapter 3 for more discussion on
gains and losses).
6.44. The number of gas customers with ‘other’ suppliers has also varied over the
period. In December 2002 the acquisition of Cambridge Gas and Electricity by
SSE caused a sudden drop in the figure for ‘other’ suppliers after which a steady
increase has continued. However, Atlantic Electric and Gas which has most of
the customers in this group is currently for sale.
Electricity and gas customer numbers by payment method
6.45. This section presents some information about customers according to payment
type. Payment types can be broadly classified into three categories: direct debit,
standard credit and prepayment. At the start of competition the majority of
customers paid by standard credit. Direct debit has increased in popularity since
market opening and is the fastest growing payment method. The proportion of
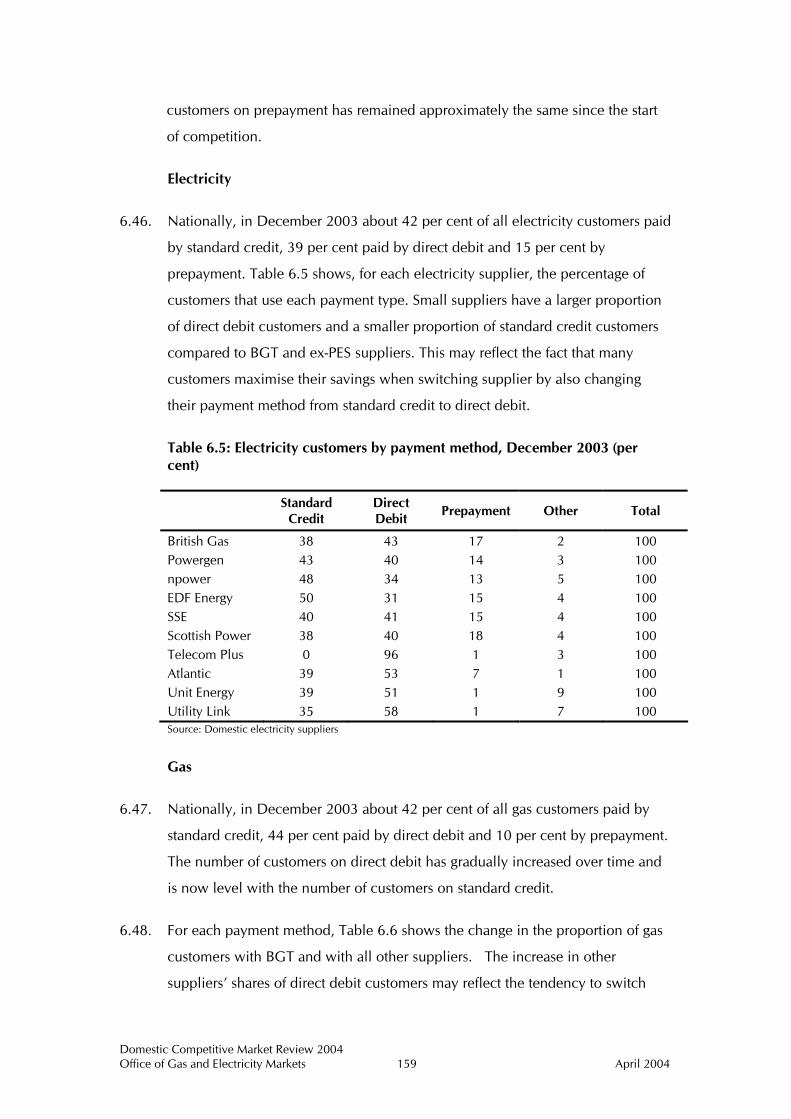
Domestic Competitive Market Review 2004 Office of Gas and Electricity Markets 159 April 2004
customers on prepayment has remained approximately the same since the start
of competition.
Electricity
6.46. Nationally, in December 2003 about 42 per cent of all electricity customers paid
by standard credit, 39 per cent paid by direct debit and 15 per cent by
prepayment. Table 6.5 shows, for each electricity supplier, the percentage of
customers that use each payment type. Small suppliers have a larger proportion
of direct debit customers and a smaller proportion of standard credit customers
compared to BGT and ex-PES suppliers. This may reflect the fact that many
customers maximise their savings when switching supplier by also changing
their payment method from standard credit to direct debit.
Table 6.5: Electricity customers by payment method, December 2003 (per cent)
Standard
Credit Direct Debit
Prepayment Other Total
British Gas 38 43 17 2 100 Powergen 43 40 14 3 100 npower 48 34 13 5 100 EDF Energy 50 31 15 4 100 SSE 40 41 15 4 100 Scottish Power 38 40 18 4 100 Telecom Plus 0 96 1 3 100 Atlantic 39 53 7 1 100 Unit Energy 39 51 1 9 100 Utility Link 35 58 1 7 100 Source: Domestic electricity suppliers
Gas
6.47. Nationally, in December 2003 about 42 per cent of all gas customers paid by
standard credit, 44 per cent paid by direct debit and 10 per cent by prepayment.
The number of customers on direct debit has gradually increased over time and
is now level with the number of customers on standard credit.
6.48. For each payment method, Table 6.6 shows the change in the proportion of gas
customers with BGT and with all other suppliers. The increase in other
suppliers’ shares of direct debit customers may reflect the tendency to switch

Domestic Competitive Market Review 2004 Office of Gas and Electricity Markets 160 April 2004
payment method when switching supplier, and fiercer competition for direct
debit customers than customers on other payment types.
Table 6.6: Gas customers by payment method, December 2003 (per cent)
BGT share Other suppliers share
Direct Debit
Standard Credit
Pre-payment
Direct Debit
Standard Credit
Pre-payment
Sep-99 70 78 88 30 22 12 Sep-00 67 74 83 33 26 17 Sep-01 61 67 78 39 33 22 Sep-02 57 66 74 43 34 26 Sep-03 56 66 72 44 34 28 Dec-03 55 66 71 45 34 29 Source: Domestic gas suppliers
Dual fuel customer shares
6.49. The packaging of gas and electricity products into the ‘dual fuel’ offer has been
one of the most significant market innovations to have emerged since the
introduction of competition. Most suppliers offer dual fuel discounts which
reflect the supply cost savings associated with combining products. It appears
that the dual fuel proposition has been an important driver to switching because
of the discount and convenience it brings to customers and the savings in
acquisition costs to suppliers. Ofgem’s analysis of the J.D. Power and Associates’
gas and electricity surveys for 2003 also shows that about 80 per cent of
switchers take their gas and electricity from the same supplier.
6.50. Table 6.7 shows dual fuel customer shares over time. BGT and the ex-PESs
appear to be in an advantageous position relative to other competitors since they
have inherited large customer bases and can use this position to cross sell
products and so encourage dual fuel take-up.

Domestic Competitive Market Review 2004 Office of Gas and Electricity Markets 161 April 2004
Table 6.7: Dual fuel customer shares (per cent)
Summer 2001 Summer 2002 Summer 2003
British Gas 45 46 44 EDF Energy - - 8 London Electricity 2 3 - Seeboard 2 4 - Npower 11 14 13 Northern Electric 4 - - Powergen 9 8 18 TXU Energi 10 11 - SSE 9 8 10 Scottish Power 6 6 8
Total 100 100 100 Source: J.D. Power and Associates Gas and Electricity Surveys 2001, 2002 and 2003 Sample size: 2001 – 3899, 2002 – 4296, 2003 – 3792.
6.51. BGT has the highest proportion of dual fuel customers. However it consistently
offers the most expensive dual fuel price at medium and high consumption
levels (in at least 9 out of 14 areas) for direct debit and at all consumption levels
(in at least 12 out of 14 areas) for standard credit. Although BGT still represents
a saving for first time switchers, its dual fuel price represents the least best saving
in these regions.
6.52. BGT’s large share of dual fuel customers is an indication that customers’
decisions to switch may not be driven solely by price but that other factors may
play a part. These other factors are discussed in more detail in Chapter 3.
Amongst other things, they indicate that, if there are no price differentials
between suppliers, some suppliers would still continue to gain more customers.
6.53. Appendix 15 contains additional information on the methodology for calculating
dual fuel customer shares.
Indices of concentration
6.54. The HHI42 is influenced both by the number of firms in the market and
differences in their relative sizes. The value of the HHI decreases as the number
of firms in a market rises. Similarly the value of the HHI will be greater the larger
42 Herfindahl Hirschman Index. See glossary for further details.

Domestic Competitive Market Review 2004 Office of Gas and Electricity Markets 162 April 2004
the degree of inequality in firm size. In general, in merger analysis, the OFT
takes the view that an HHI in excess of 1800 is highly concentrated43.
6.55. Table 6.8 shows national HHIs for gas and electricity over time. In gas the high
HHIs reflect BGT’s large national share of customers but, as with national gas
customer shares, the HHI is gradually eroding. For the national electricity picture
the HHIs jump between September 2002 and September 2003 as a result of the
merger of TXU and Powergen. Electricity national HHIs are now approaching
the 1800 threshold.
Table 6.8: National HHIs
Sep-00 Sep-01 Sep-02 Sep-03 Dec-03
Electricity 1146 1364 1551 1770 1767 Gas * * 4279 4129 4049
Source: For electricity distribution companies, for gas Ofgem/domestic gas suppliers *Data not available.
6.56. Figure 6.7 shows electricity HHIs for each ex-PES region. The HHIs are well
above the 1800 threshold, indicating that if viewed on a regional basis electricity
markets remain highly concentrated. The HHIs reflect the picture given in Table
6.2 with a few subtle differences. For example, in the Scottish Power (South
Scotland) and Seeboard (South East) regions, ScottishPower and EDF, the
respective ex-PESs, both have the same group customer share of 63 per cent.
However, the HHI for the Scottish Power region is higher than the Seeboard
region. This indicates that in the Scottish Power region customers are less evenly
distributed between suppliers than in the Seeboard region and that there are
fewer suppliers, each with a larger proportion of customers in the Scottish Power
region than the Seeboard region.
43 OFT, “Mergers: substantive assessment guidance”, May 2003, page 23.
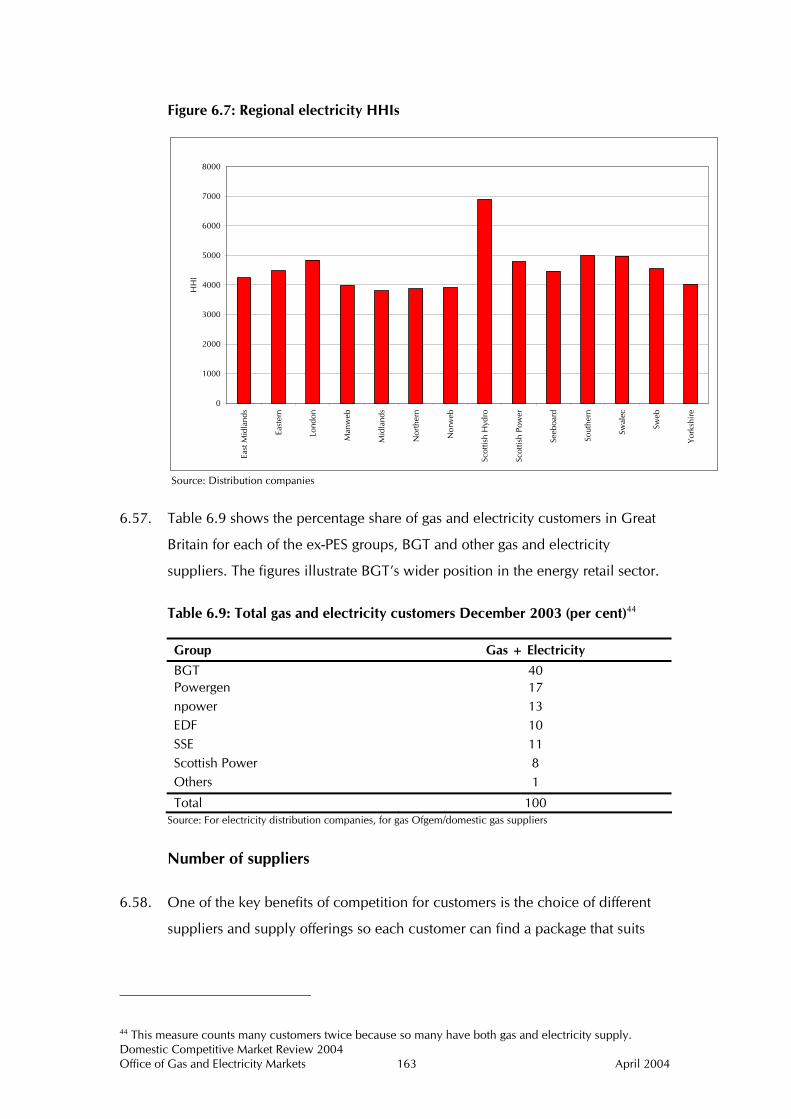
Domestic Competitive Market Review 2004 Office of Gas and Electricity Markets 163 April 2004
Figure 6.7: Regional electricity HHIs
0
1000
2000
3000
4000
5000
6000
7000
8000
East
Mid
land
s
East
ern
Lond
on
Man
web
Mid
land
s
Nor
ther
n
Nor
web
Scot
tish
Hyd
ro
Scot
tish
Pow
er
Seeb
oard
Sout
hern
Swal
ec
Sweb
Yor
kshi
re
HH
I
Source: Distribution companies
6.57. Table 6.9 shows the percentage share of gas and electricity customers in Great
Britain for each of the ex-PES groups, BGT and other gas and electricity
suppliers. The figures illustrate BGT’s wider position in the energy retail sector.
Table 6.9: Total gas and electricity customers December 2003 (per cent)44
Group Gas + Electricity
BGT 40 Powergen 17 npower 13 EDF 10 SSE 11 Scottish Power 8 Others 1
Total 100 Source: For electricity distribution companies, for gas Ofgem/domestic gas suppliers
Number of suppliers
6.58. One of the key benefits of competition for customers is the choice of different
suppliers and supply offerings so each customer can find a package that suits
44 This measure counts many customers twice because so many have both gas and electricity supply.
Domestic Competitive Market Review 2004 Office of Gas and Electricity Markets 164 April 2004
their needs. The number of active suppliers and their various market offerings is
indicative of the choices customers have.
6.59. Table 6.10 shows the number of licences granted as of February 2004, the
number of active suppliers as of December 2003, and the number of active
brands as of February 2004. The ‘active suppliers’ measure indicates all licensed
suppliers with customers. The ‘active brands/offers’ measure uses Ofgem’s
Domestic Prices Database to look at the number of offers available to a customer
paying by direct debit45.
Table 6.10: Number of suppliers
Domestic gas Domestic electricity
Number of licences granted 35 34 Active Suppliers 9 12 Active Brands/Offers 16 16
Source: Ofgem Domestic Prices Database, gas suppliers, distribution companies and Ofgem Licensing
6.60. Since Ofgem last published similar data in November 2001 there has been a
decrease in the number of active gas suppliers reflecting consolidation in supply.
In both gas and electricity there are six main suppliers. However, the number of
electricity suppliers has not changed since Ofgem’s November 2001 review.
Appendix 16 illustrates merger activity since November 2001.
6.61. Table 6.11 shows all the individual active suppliers excluding ex-PES suppliers
and BGT. Two of the new entrants in electricity have a focus on renewable
energy – Good Energy and Ecotricity.
Table 6.11: Active suppliers excluding BGT and ex-PESs (December 2003)
Active suppliers electricity Active suppliers gas
Atlantic Electric & Gas Limited Atlantic Electric and Gas Limited Opus Energy Limited 46 Telecom Plus Plc Economy Power Limited Countrywide Farmers Plc47 Basic Power Limited 48 Good Energy Limited Ecotricity49
Source: Ofgem Domestic Prices Database, Gas suppliers, Distribution companies and Licensing
45 Direct debit is used as a proxy for other payment methods. 46 Telecom Plus acts as an agent for Opus. 47 Countrywide does not supply in all regions of Great Britain. 48 Operates under Utility Link’s licence. 49 Registered company: The Renewable Energy Company Limited.

Domestic Competitive Market Review 2004 Office of Gas and Electricity Markets 165 April 2004
6.62. Table 6.12 shows all the price offerings listed in Ofgem’s Domestic Prices
Database. These do not include certain affinity deals offered by suppliers in
conjunction with supermarkets and other companies. The availability of some of
these brand names depends on which region the customer lives in. For example,
the Manweb offering is only available to customers in the Manweb ex-PES
region.
Table 6.12: Gas and electricity supplier offerings (February 2004)
Electricity supplier offerings Gas supplier offerings
Atlantic Electric and Gas Atlantic Electric and Gas Basic Power BGT BGT Cambridge Gas & Electricity London Energy Countrywide Manweb London Energy npower Manweb Powergen npower Scottish Hydro-Electric Powergen ScottishPower Scottish Hydro-Electric SEEBOARD Energy ScottishPower Servista50 SEEBOARD Energy Southern Electric Servista51 Swalec Southern Electric SWEB Energy Swalec Telecom Plus SWEB Energy Virgin HomeEnergy Telecom Plus Source: Ofgem
6.63. Figure 6.8 shows the change in non-incumbent52 customer shares since January
2003. It shows that for both gas and electricity, new entrants have more than
doubled their customer bases over the past year. However their overall share of
customers is very small, supplying a total of about 131,000 gas customers and
190,000 electricity customers between them. The largest new entrant, Atlantic
Electric and Gas, is for sale.
50 From 11 February 2004 Servista customers have been migrated to Powergen. Servista is no longer available to new customers. 51 From 11 February 2004 Servista customers have been migrated to Powergen. Servista is no longer available to new customers. 52 Gas non-incumbents include: Atlantic, Telecom Plus and Countrywide. Electricity non-incumbents include: Atlantic, Basic Power, Good Energy, Economy Power, Opus and Renewable Energy Company.
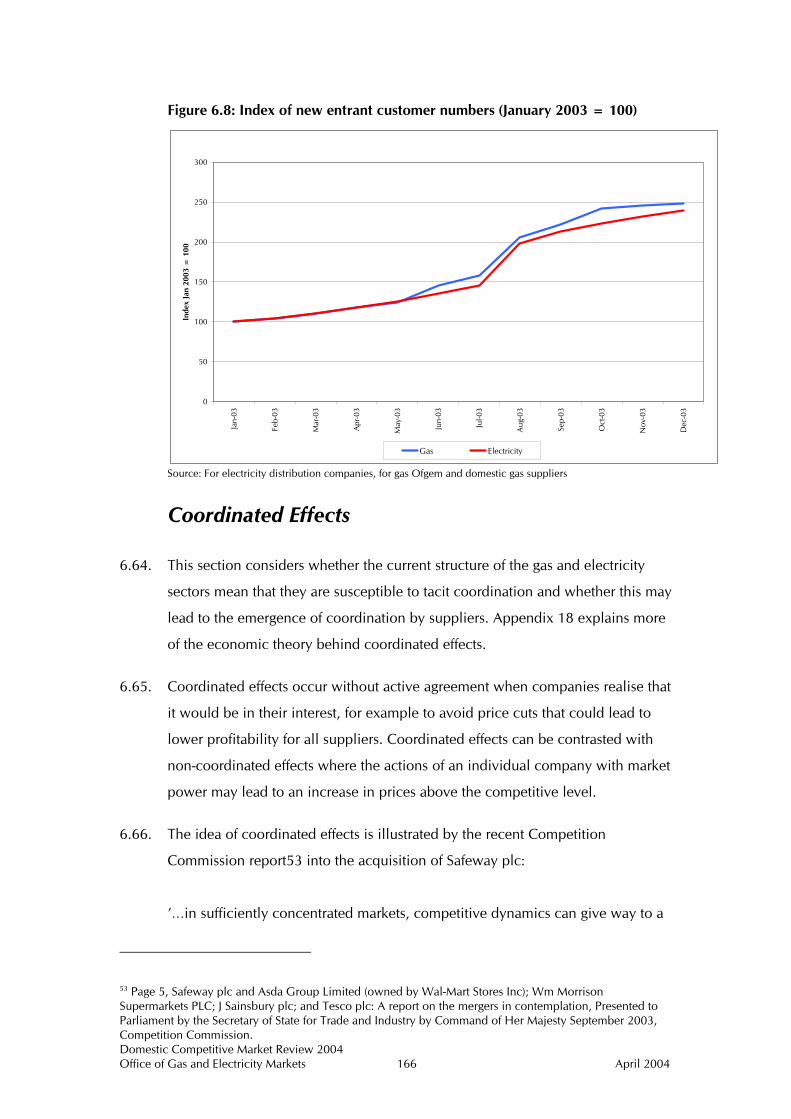
Domestic Competitive Market Review 2004 Office of Gas and Electricity Markets 166 April 2004
Figure 6.8: Index of new entrant customer numbers (January 2003 = 100)
0
50
100
150
200
250
300
Jan-
03
Feb-
03
Mar
-03
Apr
-03
May
-03
Jun-
03
Jul-0
3
Aug
-03
Sep-
03
Oct
-03
Nov
-03
Dec
-03
Inde
x Ja
n 20
03 =
100
Gas Electricity
Source: For electricity distribution companies, for gas Ofgem and domestic gas suppliers
Coordinated Effects
6.64. This section considers whether the current structure of the gas and electricity
sectors mean that they are susceptible to tacit coordination and whether this may
lead to the emergence of coordination by suppliers. Appendix 18 explains more
of the economic theory behind coordinated effects.
6.65. Coordinated effects occur without active agreement when companies realise that
it would be in their interest, for example to avoid price cuts that could lead to
lower profitability for all suppliers. Coordinated effects can be contrasted with
non-coordinated effects where the actions of an individual company with market
power may lead to an increase in prices above the competitive level.
6.66. The idea of coordinated effects is illustrated by the recent Competition
Commission report53 into the acquisition of Safeway plc:
’…in sufficiently concentrated markets, competitive dynamics can give way to a
53 Page 5, Safeway plc and Asda Group Limited (owned by Wal-Mart Stores Inc); Wm Morrison Supermarkets PLC; J Sainsbury plc; and Tesco plc: A report on the mergers in contemplation, Presented to Parliament by the Secretary of State for Trade and Industry by Command of Her Majesty September 2003, Competition Commission.

Domestic Competitive Market Review 2004 Office of Gas and Electricity Markets 167 April 2004
recognition by the participating firms of the interdependence of their prices and
sales, and that they have a clear common interest in avoiding mutually
destructive rivalry, in particular, price cuts, where the response of rivals in each
case would render that price cut unprofitable for the participants’.
6.67. The most serious form of coordination is a price fixing agreement. Such an
agreement could be explicitly set out in a document or a verbal agreement.
However, other forms of coordination with lesser degrees of contact between
parties can be thought of as ‘tacit coordination’. This is the type of coordination
associated with ‘coordinated effects’. All these activities could lead to a financial
penalty under the Competition Act.
6.68. In concentrated markets a smaller number of market players make coordination
easier because company interactions are easier to observe and follow.
6.69. Gas and electricity are homogenous products in that electricity from supplier A
is functionally identical to electricity from supplier B. Markets for homogenous,
undifferentiated products are more susceptible to tacit coordination because in
such markets companies can only compete on price, not service quality for
example, and this means that it is easier for them to come to an agreement
(whether tacit or otherwise) on market sharing or price fixing. In gas and
electricity, suppliers do seem to be attempting to differentiate their products
through branding, special offers and bundling.
6.70. In addition to product homogeneity and concentration the following factors may
be considered when coming to a view on whether markets are likely to give
scope for coordinated effects (each factor is discussed in more detail in
Appendix 18)54:
♦ possible barriers to entry and expansion
♦ capacity to reach a mutually advantageous equilibrium and detect
cheating
♦ capacity for repeated interaction between firms
54 Variations on these factors have been discussed in many merger investigations, such as the supermarkets case and the Competition Commission ‘ Merger references: Competition Commission Guidelines’, March 2003 also discusses them.

Domestic Competitive Market Review 2004 Office of Gas and Electricity Markets 168 April 2004
♦ credible strategies to punish firms for deviating from the mutually
advantageous equilibrium, such as retaliatory pricing strategies, and
♦ switching costs.
6.71. Barriers to entry and expansion make it easier for incumbent firms to raise prices
without attracting new entry. An anti-competitive pricing strategy would be more
difficult to maintain if new firms could quickly enter and exit a market. Barriers
to entry in gas and electricity supply are discussed in more detail in Chapter 7.
6.72. Gas and electricity markets are characterised by stable demand and low demand
growth. Domestic prices are published and therefore suppliers are aware of each
others’ tariffs although the complexity of tariffs makes monitoring more difficult.
Gas and electricity are homogenous, although there is some product
differentiation by suppliers. Levels of domestic consumption do not vary
significantly with price because gas and electricity are necessities. All of these
factors indicate that there is the potential to reach a mutually advantageous
equilibrium and detect cheating.
6.73. However, incumbent customer shares are characterised by steady erosion and
are different for BGT and the ex-PESs. Depending on different market definitions,
levels of concentration vary. In addition there are some customer switching
costs. These market conditions make punishment strategies55 more difficult and
therefore make coordination more difficult.
6.74. Ofgem’s on-going market monitoring pricing analysis aims to identify whether
coordination may be taking place. This pricing analysis looks at gas, electricity
and dual fuel prices on a regional basis and focuses on possible reciprocal
supplier behaviour. From time to time Ofgem compares prices in-area and out-
of-area to identify where competition for customers is fiercest and where it
appears to be weaker. The most recent analysis of this type indicates that
coordination is unlikely to be taking place.
55 Punishment strategy is the ability of firms to retaliate and price low if one firm cheats. Credible punishment strategies result from stable market conditions and a broad symmetry of firms. For more detail see Appendix 18.

Domestic Competitive Market Review 2004 Office of Gas and Electricity Markets 169 April 2004
6.75. Whilst pricing analysis provides some useful insights into supplier behaviour
caution should be taken when interpreting it because it does not capture
different levels of service and the value customers attach to service levels.
Chapter 3 discusses supplier fixed effects which may go some way to explaining
non-price differences between suppliers.
Domestic Competitive Market Review 2004 Office of Gas and Electricity Markets 170 April 2004
7. Barriers to entry and expansion
7.1. This chapter:
♦ explains why Ofgem has considered barriers to entry and expansion as
part of this review of domestic competition
♦ re-visits the barriers that were identified in Ofgem’s November 2001
Review56 and provides a brief update on the work that has been carried
out on each, and
♦ discusses the findings of a more recent exercise that Ofgem has carried
out to assess the potential impact of a variety of barriers on new entrants.
7.2. Further information about new entrants to the supply sector is in Chapter 6.
7.3. This review of competition has not been carried out in the context of an
investigation under the Competition Act. The term ‘barrier’ has therefore been
used loosely to refer to a number of issues which seem to have the potential to
deter entry or expansion and that it may be appropriate for Ofgem (or others) to
take action to change. Some of these may also be barriers to entry and expansion
in the non-domestic gas and electricity sectors. This review in no way commits
Ofgem to considering these issues in a similar way during any future
Competition Act investigation.
Background
7.4. Consideration of the nature and extent of barriers to entry and expansion are
important in the assessment of potential competition since they influence the
number and type of firms in a market and their conduct. The lower the entry
barriers, the more likely it is that the threat of, or actual, new entry will prevent
companies already operating in a market from persistently raising prices above
competitive levels. Even in a market where there are very few companies, if
entry barriers are low then existing companies’ behaviour may be constrained by
the simple threat of credible new entry. For example, if it is observed that an
56 Ofgem, “Review of domestic gas and electricity competition and supply price regulation: Evidence and

Domestic Competitive Market Review 2004 Office of Gas and Electricity Markets 171 April 2004
existing company is very profitable, a new entrant could potentially undercut
their prices and gain some of their market share.
7.5. Obviously, new entry of gas and electricity suppliers (or the threat of it) will help
to protect the interests of customers by countering the threat of entrenched
market power through competitive rivalry on prices and providing incentives for
improvements in service.
7.6. Economic theory presents a range of potential definitions of entry barriers. For
example, a barrier to entry may be defined as any cost that is incurred by a new
entrant but not by an incumbent57. Alternatively a barrier to entry can be
defined as an advantage of incumbents over potential entrants, which is reflected
in the extent to which incumbents may persistently raise their prices above
competitive levels without attracting new entry58. This contrasts with the
concept of an impediment to entry where incumbents can only benefit from the
impediment for a limited period of time59.
7.7. This chapter takes a broad view of what constitutes a barrier to entry or
expansion, the aim being to identify areas where it maybe appropriate for
Ofgem, or others, to take action to reduce such barriers. Some of the discussion
addresses issues that affect existing suppliers as well as new entrants.
Terminology and data
7.8. The following key concepts are used in this chapter. The Glossary at the end of
the document explains other concepts that may be useful in understanding the
issues raised.
♦ barrier to entry – discussed in paragraph 7.6 above. This chapter does
not define barriers in a strictly economic sense but takes a broad view of
what may constitute a barrier to entry or expansion
initial proposals”, November 2001, 71/01. 57 After George J. Stigler, The Organisation of Industry, 1968 (p.67) 58 After Joe S. Bain, Barriers to New Competition,1956, (p.3). 59 See OFT “Barriers to entry and exit in UK competition policy” Research Paper 2, Report by London Economics for OFT, page 6.

Domestic Competitive Market Review 2004 Office of Gas and Electricity Markets 172 April 2004
♦ barrier to expansion – a factor that may limit an entrant’s ability to
increase in size. If expansion is perceived to be difficult this is likely to
deter entry
♦ new entrant - in this chapter this means an entrant that does not have
an incumbent customer base in either gas or electricity
♦ incumbent – a former monopoly supplier – BGT for gas and the ex-PESs
in-area for electricity, and
♦ active supplier – a gas or electricity supplier supplying customers.
Key facts and trends
7.9. This Chapter discusses a number of areas where progress has been made by
Ofgem and the industry on reducing barriers to entry and expansion. Despite
progress on a number of issues, there still remain some areas of concern:
♦ dynamic teleswitched heating loads where the majority of customers
with these types of meter have been unable to switch supplier, although
they have seen similar price changes to other customers
♦ prepayment infrastructure facilities may be a barrier to entry and
expansion, and
♦ the current credit cover requirements.
7.10. For new entrant suppliers without an incumbent customer base, there are a
number of difficulties in obtaining information necessary to develop business
plans and to enter the market, even though the information itself is not
confidential.

Domestic Competitive Market Review 2004 Office of Gas and Electricity Markets 173 April 2004
Analysis
Previous reviews – barriers to entry and expansion
7.11. Ofgem’s November 2001 Review discussed whether certain features constituted
barriers to entry. This section re-visits those features that Ofgem considers may
present barriers to entry and expansion for new entrants and explains the
changes that have taken place. The features discussed here are:
♦ electricity supplier agency services and the provision of prepayment meter
infrastructure services
♦ gas prepayment meter infrastructure facilities
♦ separation of electricity distribution and supply
♦ Scottish electricity trading arrangements
♦ dynamic teleswitched (‘DTS’) heating loads
♦ introduction of competition for metering and metering services, and
♦ debt blocking.
7.12. Appendix 19 gives brief updates on the other features identified in the
November 2001 Review which include the following:
♦ BGT’s and the ex-PES suppliers’ market position and behaviour
♦ shared unmetered supply
♦ competition on gas transportation networks operated by companies other
than Transco (iGTs)
♦ gas system entry capacity auctions
♦ the effect of NETA, and
♦ the Renewables Obligation.

Domestic Competitive Market Review 2004 Office of Gas and Electricity Markets 174 April 2004
Electricity supplier agency services and the provision of prepayment
meter infrastructure services
7.13. The November 2001 Review noted concerns expressed about poor quality
services provided by the supplier agency services of the ex-PES suppliers and/or
distribution companies and that this might represent preferential treatment.
Particular concern was expressed about the provision of prepayment
infrastructure services. Ofgem stated that supplier agency service providers were
obliged to provide these services on a non-discriminatory basis and that Ofgem
would take action if this was not the case. It also noted that suppliers were able
to change metering and data service providers and that Elexon was working to
address any problems with the Change of Agent process.
Update
7.14. Suppliers use prepayment meter infrastructure services when a customer has a
prepayment meter. Prepayment meter infrastructure services include the
following elements:
♦ issuing a device such as a token, card or key
♦ the use by domestic customers of local outlets to purchase of tokens and
add credit to cards or keys
♦ making payments to electricity suppliers which have been received by
the service provider from the customer, and
♦ the transfer of customer data to electricity suppliers.
7.15. In electricity, prepayment meter infrastructure services are currently provided to
all suppliers by the in-area ex-PES as a licence requirement. In gas, these services
are provided by Siemens through contractual arrangements. There is, however,
no requirement to obtain prepayment meter infrastructure services from any one
company.
7.16. Ofgem has no evidence that prepayment infrastructure services are being
operated in a discriminatory way. In 2003 Ofgem used its powers to settle

Domestic Competitive Market Review 2004 Office of Gas and Electricity Markets 175 April 2004
disputes under Standard Licence Condition 53C of the electricity supply licences
of Scottish Power, npower Northern and npower Yorkshire60. This decision
allowed suppliers to unbundle part of the prepayment meter infrastructure
service activities from the incumbent ex-PES supplier.
7.17. In particular Ofgem stated that it supported the principle of an unbundled charge
for the initial payment device since competition in the provision of the payment
device is likely to improve the level of service prepayment customers receive.
7.18. Ofgem is also aware that one supplier has successfully tendered for electricity
prepayment meter infrastructure services from a company other than the ex-PES
supplier61.
7.19. Electricity suppliers are currently working together to improve how suppliers
receive customers’ payments. Ofgem will monitor the operation of a new,
competitive prepayment meter service.
Gas prepayment meter infrastructure services
7.20. The November 2001 Review noted a comment by a supplier that the charge for
gas prepayment services is higher than the equivalent charge in electricity.
Ofgem stated that its review of metering competition had identified the issue of
creating choice in prepayment metering and in the longer term there should be
downward pressure on charges for using these facilities.
Update
7.21. As part of its work on the Social Action Plan, Ofgem has been working with
industry parties to try to identify and remove barriers to the introduction of more
efficient prepayment infrastructure providers and how the efficiency of those
currently in place can be improved.
60 “Decision By The Gas And Electricity Markets Authority Following A Request By British Gas Trading Limited For Settlement Of Terms Of An Agreement In Dispute With Scottish Power Energy Retail Limited Under Electricity Supply Standard Licence Condition 53c”, April 2003; “Decision By The Gas And Electricity Markets Authority Following A Request By British Gas Trading Limited For Settlement Of Terms Of An Agreement In Dispute With Npower Yorkshire Limited Under Electricity Supply Standard Licence Condition 53c”, May 2003; and “Decision By The Gas And Electricity Markets Authority Following A Request By British Gas Trading Limited For Settlement Of Terms Of An Agreement In Dispute With Npower Northern Supply Limited” Under Electricity Supply Standard Licence Condition 53c, June 2003 61 The same supplier also successfully tendered for gas prepayment meter services.

Domestic Competitive Market Review 2004 Office of Gas and Electricity Markets 176 April 2004
Separation of electricity distribution and supply
7.22. The November 2001 Review noted that as a result of changes introduced by the
Utilities Act, distribution companies are obliged by their licences to maintain
managerial and operational independence from supply companies and to
appoint a compliance officer to ensure that this is done. These changes were
introduced to facilitate competition in electricity supply, since separation
reduces incentives and opportunities for owners of both supply and distribution
businesses to allow the former to discriminate in favour of the latter. Ofgem
stated that it would continue to monitor distribution companies’ independence
from other businesses and would take action where necessary.
Update
7.23. Ofgem’s Corporate Plan for 2004 - 200762 proposes to complete research on the
role of brand independence in securing effective separation of supply and
distribution services. Ofgem wants to assess whether common brands for retail
and network businesses are reinforcing customers’ beliefs that the affiliated retail
business will provide a more reliable service (see Chapter 2). This research will
help to inform Ofgem whether there is a need for further work on this issue.
Ofgem will also consider whether additional information should be provided to
customers about the separation of supply and distribution/transportation.
Scottish electricity trading arrangements
7.24. There is no directly competitive wholesale market in Scotland and the
incumbent supply businesses are not subject to the same balancing
arrangements in their own areas as independent generators and suppliers.
Update
7.25. Ofgem and the DTI are introducing Great Britain-wide trading arrangements as
part of the BETTA project. This is due to be implemented in April 200563 and
will mean that all suppliers and generators are subject to the same wholesale
and balancing arrangements, wherever they supply customers.
62 Ofgem Proposed Corporate Plan 2004-2007. Ofgem 59/04 March 2004 63 Subject to Royal Assent to the Energy Bill in July 2004.

Domestic Competitive Market Review 2004 Office of Gas and Electricity Markets 177 April 2004
Dynamic teleswitched (‘DTS’) heating loads
7.26. Some domestic customers have their supply remotely switched by their supplier,
for example if they have a separate heating load circuit. Ofgem considered that
the operation of the DTS regime by incumbent suppliers could give an
information advantage over other suppliers as to the times of day when supply
was made available to heating circuits for these types of customer, and that this
information advantage could deter other suppliers from competing for those
customers. This issue is especially relevant in Scotland where DTS customers
account for about 10 per cent of the domestic customer base and no supplier
other than the incumbent appears to be actively seeking to make DTS supply
offerings to these customers.
Update
7.27. Ofgem has carried out work to understand whether there are any technical
constraints affecting the transfer of DTS customers. The work highlighted that
there are no technical obstacles preventing a supplier from offering supply terms
to these customers. However most suppliers’ billing systems are not designed to
deal with the additional registers on some DTS meters and information from
suppliers indicates that in Scotland the DTS tariff structures are more
complicated than in England and Wales.
7.28. Ofgem’s work has also highlighted low switching rates among DTS customers.
Although Ofgem’s analysis indicates that price changes for DTS customers are
similar to those for other customer groups it remains concerned that competition
has not developed in this area.
7.29. Following an earlier request for information on DTS customers, Ofgem wrote to
suppliers in September 2003 reminding them that they had a duty to offer terms
to supply all domestic customers, that suppliers should ensure that they were in
a position to do so by 1 April 2004 and that failure to do so could lead to
licence enforcement action.
7.30. A number of suppliers have indicated that they have experienced difficulty
getting access to market information on the numbers of DTS customers and the
structure and operation of DTS tariffs. Ofgem will continue to work with the

Domestic Competitive Market Review 2004 Office of Gas and Electricity Markets 178 April 2004
industry on issues concerning DTS customers. In particular it proposes to hold a
seminar to discuss any information or other issues that are impeding progress in
this area.
Introduction of competition in metering
7.31. The November 2001 Review noted concerns about whether the introduction of
metering competition would increase costs for suppliers which would be passed
through to customers. Ofgem stated that the introduction of competition in
metering would provide significant benefit to customers.
Update
7.32. In May 2003 the electricity industry concluded the Review of Electricity
Metering Arrangements (REMA) process and introduced new procedures to
facilitate competition in electricity metering services64. The equivalent process
in gas, the Review of Gas Metering Arrangements (RGMA)65 is scheduled to be
completed by 12 July 2004.
7.33. One large supplier (BGT) has appointed alternative providers of gas and
electricity metering services and is in the process of rolling these out across the
country. Two other large suppliers (Powergen and Innogy – owner of npower)
have issued invitations to tender to for metering services. On 23 March 2004
Ofgem issued a survey66 to gather information for a competitive market review
of the metering market.
64 Information on the REMA process can be found on Ofgem’s website by entering the term “REMA” into the search dialogue 65 Information on the RGMA process can be found on Ofgem’s website at http://www.ofgem.gov.uk/ofgem/work/index.jsp?section=/areasofwork/meteringrgma 66 http://www.ofgem.gov.uk/ofgem/work/index.jsp?section=/areasofwork/meteringstrategy&levelids=,1_6586#top6586

Domestic Competitive Market Review 2004 Office of Gas and Electricity Markets 179 April 2004
Debt blocking
7.34. The November 2001 Review discussed whether debt blocking was an
impediment to the development of competition. Ofgem stated that it was
continuing to work with suppliers to encourage them to stop objecting to
customer transfers on the grounds of debt.
Update
7.35. In October 2003 an industry protocol was agreed and came into force in
February 2004 whereby prepayment customers with less than £100 debt would
be allowed to transfer to another supplier (with the debt transferred as well).
Ofgem has recently imposed financial penalties on a number of suppliers that
had incorrectly objected to the transfer of direct debit customers on the grounds
of debt.
Recent review – impact on new entrants
7.36. In order to assess the potential impact of barriers to entry and expansion, Ofgem
analysed some of the processes that a new entrant to the gas and electricity
domestic supply sectors has to go through before it can start to supply
customers. This analysis consisted of a ‘desk-based’ exercise and talking to
actual and potential new entrants.
7.37. The analysis highlighted a number of areas which may create barriers for a new
entrant. This section discusses some of the issues raised and what action, if any,
Ofgem considers should be taken on them.
7.38. The barriers identified fall into the following (loosely defined) main categories:
♦ entry requirements
♦ regulatory requirements
♦ operation issues
♦ financial issues, and
♦ information issues.

Domestic Competitive Market Review 2004 Office of Gas and Electricity Markets 180 April 2004
Entry requirements
7.39. Gas and electricity suppliers need to be parties to a number of agreements,
either as a requirement of their licence or as part of the general operation of the
markets. These include:
♦ electricity Distribution Use of System Agreements (‘DUoSA’)
♦ the electricity Master Registration Agreement (‘MRA’)
♦ the electricity Balancing and Settlement Code (‘BSC’)
♦ the electricity Connection Use of System Code (‘CUSC’)
♦ the electricity Data Transfer Service Agreement
♦ Scottish electricity trading agreements, and
♦ agreements with metering agents.
7.40. Potential suppliers therefore need access to substantial amounts of information
about how the codes work in practice, how to accede to them and what they
must do to be able to comply with them. Ofgem’s analysis indicated that
although some information was available, there are some key areas where
obtaining the information is disproportionately time-consuming, particularly for
some DUoSAs.
7.41. An electricity supplier must enter into a bi-lateral contract with each electricity
distribution company in whose area it wishes to supply electricity. There are 14
distribution companies: 12 in England and Wales and two in Scotland.
Distribution companies’ DUoSA are broadly similar, although they are not
identical. Potential and actual new entrants have told Ofgem that distribution
companies are inconsistent in their ability to negotiate DUoSAs with new
suppliers - some distribution companies are helpful and responsive, others are
not. In addition, although use of system charges are regulated by Ofgem and are
therefore in the public domain, not all distribution companies provide
information about their charges on their websites.
7.42. It is not clear to Ofgem why there should be such variation between
distribution companies on these issues.

Domestic Competitive Market Review 2004 Office of Gas and Electricity Markets 181 April 2004
7.43. Ofgem has published an ‘information pack’ that provides high level information
for parties interested in becoming licensed electricity suppliers67. It provides an
overview of the structure of electricity supply, some information on relevant
legislation, a brief description of the governance bodies responsible for its
operation and a description of how an organisation becomes a licensed
electricity supplier. The pack includes information from other organisations that
administer various aspects of the electricity supply market. It also provides
contact details of the relevant organisations that can provide further information.
Regulatory requirements
Licensing
7.44. All gas and electricity suppliers must be licensed (unless they fall into certain
exempt categories). Ofgem assesses applications for all types of licence. In April
2003 Ofgem revised the licence Application Regulations68 to reduce the amount
of information supply licensees are required to provide. Ofgem aims to assess
applications for supply licences within 12 weeks of receiving all the information
required by the Application Regulations; in practice applications are often
assessed much more quickly.
7.45. Ofgem’s view – Ofgem considers that recent changes to the application process
mean that this does not present an undue barrier to entry.
Domestic supply licence conditions
7.46. Domestic supply licensees have to comply with more standard licence
conditions than non-domestic suppliers. Some new entrant suppliers have told
Ofgem that they consider that some of these requirements place additional,
unnecessary burdens on them.
7.47. Ofgem’s view - Ofgem’s Corporate Plan for 2004 - 200769 proposes to review
the supply licence conditions with the objective of improving the targeting and
effectiveness of regulation and to reduce barriers to entry. It is likely that part of
67 Ofgem “New Entrants to the Electricity Supply Market”, Information Pack V.1, November 2002. An updated version of this document will be published shortly. 68 Ofgem, “Gas and electricity licence applications: Guidance document”, January 2004. 69 Ofgem, “Proposed Corporate Plan 2004-2007” March 2004, 59/04.

Domestic Competitive Market Review 2004 Office of Gas and Electricity Markets 182 April 2004
this review will include consideration of the impact of these additional
requirements on new entrants.
Operational issues
Supply on iGTs
7.48. Domestic suppliers are obliged by their licence to offer terms to supply
customers on gas networks that are not owned by Transco. Ofgem understands
that very few non-vertically integrated shippers have signed all the iGTs’ network
codes. This therefore presents a new entrant with a potential barrier to entry – if
it cannot contract with a shipper that has signed all network codes, it will have
difficulty complying with its duty to offer terms to all domestic customers.
7.49. Ofgem’s view – Ofgem’s Corporate Plan for 2004 - 200770 proposes to review
the supply licence conditions with the objective of improving the targeting and
effectiveness of regulation and to reduce barriers to entry. It is likely that issues
concerning supply on iGTs will form part of this review.
Electricity wholesale price volatility
7.50. The introduction of NETA necessitates expertise and technical equipment to
match the purchase of energy to customer demand for every half hour. The
difficulty of predicting domestic demand, particularly at a time when the number
of customers may be increasing rapidly, may make it difficult for new entrants to
protect themselves against wholesale price volatility.
7.51. Ofgem’s view – there are a number of ways in which any supplier can mitigate
against wholesale price volatility; how they choose to do so is a commercial
decision for them. NETA ensures that the cost of dealing with system imbalances
falls on those suppliers that create them and that this creates appropriate
incentives to balance a portfolio.
70 Ofgem, “Proposed Corporate Plan 2004-2007” March 2004, 59/04.

Domestic Competitive Market Review 2004 Office of Gas and Electricity Markets 183 April 2004
Acquiring and retaining customers
7.52. A number of issues were identified that present difficulties for a new supplier
trying to acquire and retain new customers.
7.53. Search and switching costs - in deciding whether to switch supplier and which
supplier to switch to, customers incur costs. For instance customers are likely to
want to compare different suppliers’ prices, whether there are additional features
that interest them (such as supermarket loyalty points, single bills, etc) or
whether there are any contractual terms that might restrict their ability to switch
in the future. If this information is not readily available (and easy to understand)
it will take customer time (and possibly actual monetary costs such as telephone
calls) to find it out. Sometimes customers experience problems with the transfer
process itself or with subsequent billing. These also increase the overall ‘cost’ of
switching.
7.54. Ofgem’s view – it is essential that customers have access to accurate and up to
date information about alternative suppliers and that, if they decide to switch,
the transfer process is as straightforward as possible. Ofgem and energywatch
have therefore taken a number of measures aimed at reducing customers’ search
and switching costs. These include producing free gas and electricity pricing
factsheets, approving independent internet price comparison services, proposing
that doorstep sales agents should provide customers with written quotes and
extensive work on improving the customer transfer process.
7.55. Strong incumbent brands and advertising - strong incumbent brands and
advertising can create barriers to entry and expansion since potential new
suppliers may be discouraged from committing the resources necessary to
compete successfully. Ofgem’s research shows that although price is still the
most important factor influencing a customer’s decision to switch their gas or
electricity supplier, the supplier’s brand and other factors are also important (see
Chapter 3 for more details).
7.56. Ofgem’s view – some recent new entrants have used their existing strong brand
from a different sector (eg banks and supermarkets) to enter the gas and
electricity sectors. Other new entrants have focussed on price and/or customer
service rather than brand. Ofgem considers that these types of innovation are a

Domestic Competitive Market Review 2004 Office of Gas and Electricity Markets 184 April 2004
central feature of a competitive market and that this indicates that these issues
are not deterring credible new entry.
7.57. Economies of scale and scope - new entrants may incur large fixed costs in order
to enter the gas and electricity markets. The more customers a supplier has, the
more these fixed costs can be spread between them. Larger suppliers may
therefore have an advantage over a new entrant while it is building its customer
base.
7.58. Ofgem’s view – Chapter 5 considers this issue in more detail. It concludes that
scale may have an impact on new entrants’ profitability. There is no evidence
that this is deterring new entry, but it appears to constrain what kind of business
plan entrants pursue, eg to enter on a large scale based on an existing brand
and/or distribution channel.
7.59. Objections - customer transfers to new entrants could be blocked by their
existing supplier, making it difficult for a new entrant to acquire customers.
7.60. Ofgem’s view - in July 2003 suppliers agreed to the removal of their ability to
object to a customer transfer on the grounds that the customer had not given
adequate notice under their contract. A customer requested objection (‘CRO’)
was introduced that allows a supplier to object to a transfer only if the customer
confirms that they have not signed a contract with the supplier trying to transfer
them. Although not all suppliers carry out CROs yet, a recent fall in the number
of erroneous transfers could be explained by the fact that some suppliers are
using CROs as a way to stop erroneous transfers. Ofgem is currently visiting
suppliers to assess the way they are implementing CROs and will publish
guidance on best practice in spring 2004.
7.61. 28 day rule - all domestic supply contracts must be able to be terminated by
giving 28 days’ notice. However in some circumstances a termination fee must
be paid by the customer, for instance if they have a contract specifying a fixed
price for more than 12 months. Although the use of fixed price contracts has not
been widespread to date, new entrants have raised concerns that they could
prevent customers switching for a considerable period of time, thereby
dampening competition.

Domestic Competitive Market Review 2004 Office of Gas and Electricity Markets 185 April 2004
7.62. Ofgem’s view – in April 2004 a small industry-wide trial is starting which will
suspend the 28 day rule in certain circumstances71. Although these relate to
energy efficiency measures, Ofgem’s monitoring of the trial will consider the
impact on customers’ desire and ability to switch.
7.63. Transfer issues - the complexity of the transfer process in electricity (and to a
lesser extent in gas) raises several issues for a new supplier:
♦ its IT system must be able to deal with the hundreds of data flows that
make up an individual transfer, and
♦ electricity transfer problems involve dealing with up to 14 different
distribution companies. New and potential entrants have told Ofgem that
distribution companies vary in their ability to resolve problems quickly;
this means that suppliers may need to devote considerable resources to
this issue.
7.64. Ofgem’s view – industry testing procedures help new entrants ensure that they
can operate various industry processes such as the MRA and BSC. In addition, in
June 2003 Ofgem and energywatch challenged suppliers to identify solutions to
the problems surrounding customer transfer and to implement measures that
would provide a step change in performance for customers72. As a result of this
challenge, suppliers have put together a report that identifies the problems with
the transfer process. This is due to be published by 7 April 200473. Stage 2 of
the exercise will be to identify solutions to those problems and will start in April
2004.
7.65. Prepayment infrastructure - all domestic suppliers are obliged by their licence to
offer terms to supply prepayment customers (and the ex-PES suppliers are
obliged not to discriminate in the provision of their prepayment services). In
certain circumstances they must also offer a prepayment meter to their existing
credit customers who are in debt. However there are additional costs to
supplying prepayment customers, for instance the administrative costs involved
in replacing key cards or retrieving mis-directed payments. This may mean that
71 “Testing domestic consumer take-up of energy services: trial suspensions of 28 day rule”, Ofgem, January 2004 72 Ofgem, “Customer Transfer Process: Discussion Document”, June 2003, 35/03.

Domestic Competitive Market Review 2004 Office of Gas and Electricity Markets 186 April 2004
new entrants are deterred from offering competitive rates to prepayment
customers.
7.66. Ofgem’s view – suppliers can set different charges for different types of customer
and for different areas. This means that suppliers can reflect in their prices the
different administrative costs incurred by customers paying in different ways.
Ofgem does not agree that all new entrants are deterred from offering
competitive terms to prepayment customers. However there are a number of
issues concerning prepayment customers that have been highlighted in this
review. These are summarised in Chapter 8.
Financial issues
7.67. New entrants are likely to require considerable financial resources to operate
effectively. In addition to having robust IT systems to deal with transfers and
billing, suppliers have to provide credit cover under a number of industry codes
and agreements.
7.68. Ofgem’s view - in February 2003 Ofgem published a second consultation74 on
issues surrounding credit cover. Since then, a number of industry working
groups have considered how these issues could be resolved. A further document
will be published in due course.
Information issues
7.69. Other network costs - in addition to information about distribution charges (see
paragraphs 7.36 to 7.38), it also seems to Ofgem that obtaining information
about other network costs is not as straightforward as it could be. These include
information about transmission costs, gas transportation costs, gas and electricity
wholesale costs and metering costs.
7.70. Information about customer numbers – there is no central source of general
information about customers (for instance non-supplier-specific information
about the total numbers in each ex-PES region).
73 See www.energy-retail.org.cuk and follow link to ‘customer transfer programme’. 74 “Arrangements for gas and electricity network operator credit cover: Conclusions and proposals”, Ofgem, February 2003, 06/03

Domestic Competitive Market Review 2004 Office of Gas and Electricity Markets 187 April 2004
7.71. Competitors’ prices – although domestic pricing information must be published,
the variety of prices in any one area means that new entrants in particular would
have to spend a considerable time assessing their competitors’ prices.
7.72. Ofgem’s view - many of the issues raised concern over the availability of
information. In particular, there is no single source for all the information a new
entrant needs to plan its entry to the supply market. In many sectors this type of
information might be provided by an organisation such as a trade association.
There are various ways in which this type of information could be provided for
the gas and electricity industries. Ofgem has considered whether it should set up
a micro-website comprising links to relevant information such as network
companies’ use of system charges. However it seems more appropriate that the
industry itself should co-ordinate and provide this information centrally. The
work on licensing and new entry by Ofgem and other parties has shown that this
approach can be successful in practice.