Embed Size (px)
Citation preview

65
4. Narrowing China’s Current Account Surplus: The role of saving, investment and the renminbi
Guonan Ma, Robert McCauley and Lillie Lam1
Introduction The widening of the Chinese current account surplus from the neighbourhood
of 2 per cent of GDP about the turn of the century to as much as 10 per cent before the global financial crisis in 2008 led to calls for the renminbi (RMB) to be revalued. The rationale was that a stronger renminbi would make Chinese exports less competitive and imports cheaper for Chinese consumers. This rationale sees the external surplus as a function of relative prices so that exchange-rate appreciation can narrow the surplus to a desired level.2
Another, and in many ways richer, conception of China’s external surplus is that it reflects a shortfall of the domestic absorption of output—whether consumption, investment or government spending—in relation to the economy’s productive capacity. Viewed from this perspective, the Chinese economy in this century showed a rise in investment in relation to output, but an even larger rise in savings. The gap between investment’s substantial rise and the stronger rise in savings widened the current account surplus. On this view, to understand the widening of China’s current account requires an answer to the question: what drove savings up?
Our examination of China’s savings rate emphasises the contribution of both corporate and government savings more than that of households. On this view, a popular account of the rise in Chinese savings—namely, higher household income insecurity—suffers from its silence on corporate and government savings, which rose more. Corporate savings rose in classical fashion as profits rose, and wages declined, in income. Government savings rose as the revenue dividend from higher growth was poured into public capital formation.
1 The views expressed in this chapter are not necessarily those of BIS. We would like to thank the participants of the SUERF Conference in Brussels in May 2011 and Stephen Cecchetti and Lu Feng for discussion.
2 Along these lines, Cline (2012) argues that the renminbi appreciation explains the ‘lion’s share’ of the decline of the Chinese current account surplus of 7.4 per cent of GDP between 2007 and 2010, with help from higher oil prices and lower global interest rates. Moreover, he reports (p. 12) that ‘the policy experiment in which the real effective level of the renminbi continues to rise at 3 per cent annually shows that the result would be [to] shift China into approximate current account balance by 2017’. Cline is right to single out returns on China’s international assets as a determinant of the current account. He et al. (2012a) consider how these returns might be affected by increasing the proportion of China’s external assets held in private Chinese hands.

Rebalancing and Sustaining Growth in China
66
When the global financial crisis hit, Chinese Government spending increased and agencies of sub-national governments borrowed from banks to boost infrastructure and other public investment. This response shrank the current account surplus substantially but only by raising investment to an unprecedented and unsustainable share of output. The scale and distribution of any credit losses from this investment boom remain a matter of keen debate.
Looking forward, demography and domestic policies are working together to narrow China’s current account surplus, which indeed shrank in 2011 to below 3 per cent of China’s GDP. As labour force growth slows, real wages are rising rapidly, making Chinese exports less competitive, allowing higher consumption and squeezing corporate profits and savings. For its part, the Government might shift its spending from building infrastructure to providing services.
In this scenario of a Chinese economy rebalancing towards consumption and government services, the exchange rate can continue to play a complementary role. If the renminbi continues to appreciate in real terms, it would help to shift production from exports to goods and services for home use. In fact, after policymakers broke the peg to the dollar in 2005, the renminbi traded so as to appreciate gradually against a broad basket of trading partner currencies in 2006–08. This experiment was interrupted by the global financial crisis, but appreciation resumed in some fashion from mid-2010.
However one interprets the underlying policy, the nominal renminbi had by the end of 2011 appreciated by 21 per cent against its trading partners’ currencies since June 2005. China’s relatively high inflation pushed up the real effective appreciation to 30 per cent over the same period. And this real appreciation approaches 50 per cent, if one focuses on unit labour costs rather than consumer prices. More likely than not, such a scale of broad real exchange rate appreciation is narrowing China’s current account surpluses.
This chapter first reviews Chinese savings and investment behaviour, noting their more separate evolution over time. Then we review the management of the renminbi.
Saving–Investment Perspective China has run one of the largest surpluses in the world in recent years.
Its current account surplus widened from 5 per cent and 10 per cent of its own GDP between 2005 and 2007, before narrowing to less than 3 per cent by 2011. In terms of global GDP, it ranged between 0.3 per cent and 0.7 per cent. As a result, within one decade, China swung from net international debtor of 10 per cent of GDP to net international creditor of 30 per cent of GDP, despite

Narrowing China’s Current Account Surplus
67
per capita GDP still well below US$5000 (Ma and Zhou 2009). In order to examine the sources of China’s current account surplus, we first focus on savings and investment, whose gap, by national income accounting identity, is the current account balance (Figure 4.1, top panel).
Figure 4.1 China’s Gross National Saving and Gross Capital Formation as a Percentage of GDP
Saving–Investment Balance and Current Account1
Gross National Saving and Capital Formation
1 Gross national saving is estimated using either expenditure-based GDP or production-based GDP. By definition, the current account balance equals expenditure-based gross national saving minus gross capital formation.
Sources: National Bureau of Statistics of China (NBS); authors’ own estimates.

Rebalancing and Sustaining Growth in China
68
The Chinese economy both saves and invests a lot. In 2010, its gross national saving reached 53 per cent of GDP, and investment spending reached 48 per cent (Figure 4.1, bottom panel), leaving a current account surplus at 5 per cent of GDP. The contributions of such high saving and investment to global imbalances and financial crises have attracted much attention (ADB 2009; Bernanke 2005; Zhou 2009).
A high and rising saving rate implies a low and falling consumption share. Private consumption as a share of China’s GDP declined from 50 per cent to 33 per cent between 1990 and 2010. Contrary to common perceptions, however, China’s private consumption has grown at a strong pace of 8 per cent to 9 per cent per annum over the past 20 years; the penetration of colour televisions, refrigerators, washing machines and airconditioners has increased tenfold.
Yet, the overall Chinese economy grew even faster than consumer demand. GDP grew more than 10 per cent annually between 1990 and 2010, powered mainly by stronger investment demand. Gross capital formation increased at a breakneck speed of 15 per cent a year over these two decades, as its share in GDP rose from 36 per cent to a staggering 48 per cent by 2010. Remarkably, such rising investment has been more than fully financed by even faster rising saving since the early 2000s. China’s gross national saving rose from less than 40 per cent of GDP in 1990 to 53 per cent in 2010. As noted, the current account surplus widened from 2 per cent of GDP in the early 2000s to 10 per cent in 2007, before narrowing to less than 3 per cent in 2011.
Thus, from the saving–investment perspective, not weak investment but extremely strong saving provides the key to understanding China’s recent large current account surpluses. Here we first take a closer look at the dynamics of the Chinese saving rate before examining the trends in its investment rate and drawing their joint implication for its current account balance. Admittedly, saving and investment interact with each other and are jointly determined. Indeed, as we argue below, strong profitability raised corporate savings and in turn provided incentives for investment, while high investment boosted growth, thus lifting savings. Still, it is possible to discuss savings and investment separately because the Chinese economy has become more open in recent years, despite binding capital controls.

Narrowing China’s Current Account Surplus
69
Figure 4.2 Feldstein–Horioka Time-Series Regression: Annual data for China
Year-on-Year Change as a Percentage of Lagged GDP1
The Estimated Betas of Gross National Saving
1 (ΔIt)/GDPt-1 and (ΔSt)/GDPt-1, where I stands for gross capital formation and S is gross national saving.
2 The regression equation is (ΔIt)/GDPt-1 = α + ß (ΔSt)/GDPt-1. Recursive regressions, with 1984 as the starting year and the ending year corresponding with that indicated by the x-axis. Regressions of rolling 10-year windows, with ending year corresponding with the x-axis. 3 The F-statistics, log likelihood ratio and Wald statistics all confirm a break point of 2001 in the data sample. The nulls that ß equals unity for the sub-sample of 1984–2001 and zero for the sub-sample of 2002–10 are both accepted.
Sources: CEIC; authors’ own estimates.
In particular, a simple Feldstein–Horioka (1980) analysis shows that savings and investment no longer track each other as they used to (Figure 4.2, top panel). Whereas annual Chinese data indicate no significant difference from a one-to-one relationship between changes in investment and savings before 2000, subsequently

Rebalancing and Sustaining Growth in China
70
a smaller change in investment is associated with a given change in saving. The beta in a regression of changes in investment as a ratio to lagged GDP on changes in savings as a ratio to lagged GDP run over progressively longer periods starting in 1984 dips towards 0.9. More tellingly, the beta estimated over a rolling 10-year window drops to 0.5 for the sample ending in 2010.3 Given that the economy opened up with World Trade Organisation (WTO) accession in 2001, the Chow test rejects the identity of the estimated betas over the two sub-samples of 1984–2001 and 2002–10. A coefficient of 0.5 is close to the 0.58 that Blanchard and Giavazzi (2002) report for the Organisation for Economic Cooperation and Development (OECD) cross-section over 1975–2001, while it is above their estimates for the European Union in the 1990s. These regressions describe Chinese savings and investment that can to some extent be separately discussed.
China’s Exceptionally High Saving Rate and Factors Behind It
China’s aggregate saving rate has been exceptionally high relative to its own history, to the saving of its thrifty Asian peers or to any empirical model predictions. During the 2000s, China’s aggregate marginal propensity to save exceeded 60 per cent. Relative to GDP, China has edged out Singapore to become the highest saver in the world. China emerges as a big outlier in cross-sectional or panel regressions, with its actual saving rate typically 10 to 15 percentage points higher than predictions (Ma and Wang 2010).
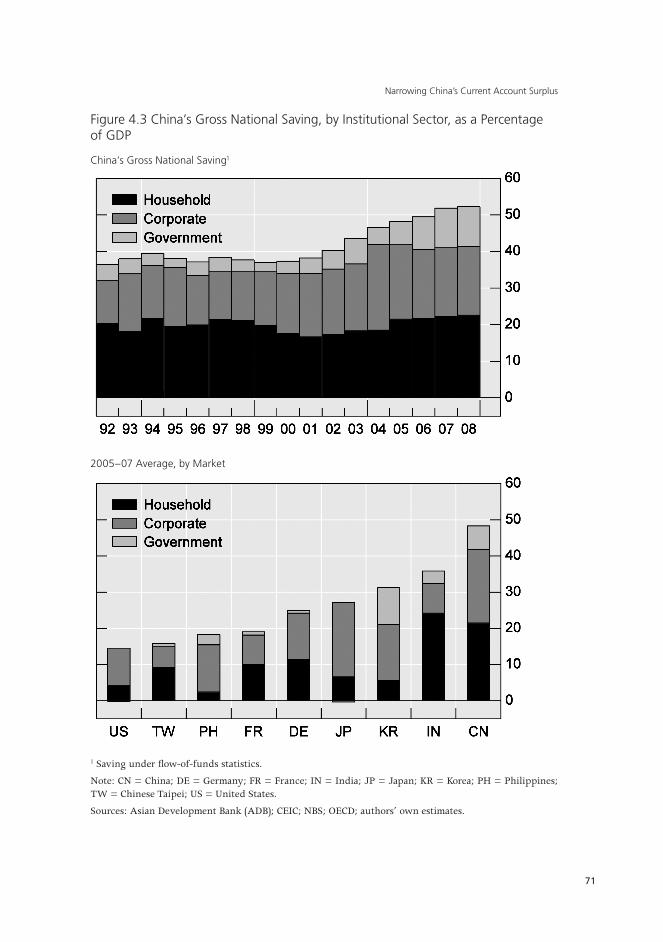
Both the dynamics and the composition of China’s rising gross national saving defy simple interpretations. All three sectors in the Chinese economy—household, corporate and government—have been high savers. Yet, taken individually, none is an exceptional saver by comparison with its global counterparts. Instead, high saving by all three sectors makes China’s aggregate saving rate exceptionally high. And contrary to conventional wisdom, the household sector accounted for less than one-sixth of the increase in China’s gross national saving in the 1990s and 2000s. The corporate and government sectors made bigger contributions to the rising Chinese aggregate saving (Figure 4.3, top panel). In particular, the saving of the government sector almost tripled—from 4.4 per cent of GDP in 1992 to 11 per cent by 2008—as most of the robust gains in government revenues during this period were invested in physical infrastructure rather than used to boost social services. The share of China’s government saving is also relatively high compared with other countries except Korea (Figure 4.3, bottom panel).
3 In statistical terms, a one-tailed test does not reject that the 2010 recursively estimated beta of 0.9 is equal to 1, while the betas estimated by the rolling 10-year regressions ending in each year 2007–10 are significantly smaller than unity at the 5 per cent level.
Narrowing China’s Current Account Surplus
71
Figure 4.3 China’s Gross National Saving, by Institutional Sector, as a Percentage of GDP
China’s Gross National Saving1
2005–07 Average, by Market
1 Saving under flow-of-funds statistics.
Note: CN = China; DE = Germany; FR = France; IN = India; JP = Japan; KR = Korea; PH = Philippines; TW = Chinese Taipei; US = United States.
Sources: Asian Development Bank (ADB); CEIC; NBS; OECD; authors’ own estimates.

Rebalancing and Sustaining Growth in China
72
The factors behind China’s high and rising saving rate are multiple, leaving many puzzles to be resolved and suggesting that a cocktail of policies might be needed to rebalance the Chinese economy. At minimum, the principal causes for high Chinese saving in the 2000s include two sets of interacting forces (Ma and Wang 2010).
The first set consists of powerful structural forces in the domestic Chinese economy. As described by Lewis (1954), surplus rural labour allowed rapid industrialisation paced by capital-widening investment and provided ready migrants willing to work at the going wage. The potential was heightened by the commune system having kept millions of surplus peasants down on the farm for decades and a very compressed demographic transition, featuring a rapidly falling ratio of child dependants to working-age adults. This transfer started as the communes collapsed under Deng Xiaoping. A central result of such a large-scale transfer of labour at a relatively stable wage is a falling labour share of output and rising profit and savings rate. High returns to capital stimulated investment, driving faster growth, which further lifted the saving rate. China’s WTO accession and the supportive global growth environment in the early 2000s also accommodated this profound transition.
The other set of factors encompasses institutional changes during the 1990s and 2000s. These include labour downsizing at state-owned companies, reform of the pension system and the introduction of private home ownership. First, employment at state-owned companies, which had provided much social welfare and security, almost halved during 1995–2005. This restructuring enhanced efficiency and profit in firms while presenting workers with increased job insecurity and expenditure uncertainty. These added to private saving by both the corporate and the household sectors. Second, pension reforms reduced pensions and increased contributions to government pension schemes, thereby lifting both private and public saving. Finally, the introduction of private home ownership in the 1990s boosted household planning for home purchase and increased land revenues to the Government in a high-growth environment, again pushing up both private and public saving.
In addition, other government policies might have played a role in lifting the Chinese saving rate. These include promoting officials who invest rather than provide social services, slow weaving of the new social safety net after the widespread layoffs by state-owned companies, retaining entry barriers to (and levying heavy taxes on) services and maintaining limits on credit access by small companies and households. Of these, the most important might be the promotion policy for officials. Since those presiding over rapid growth were rewarded, local government officials responded by investing additional public
Narrowing China’s Current Account Surplus
73
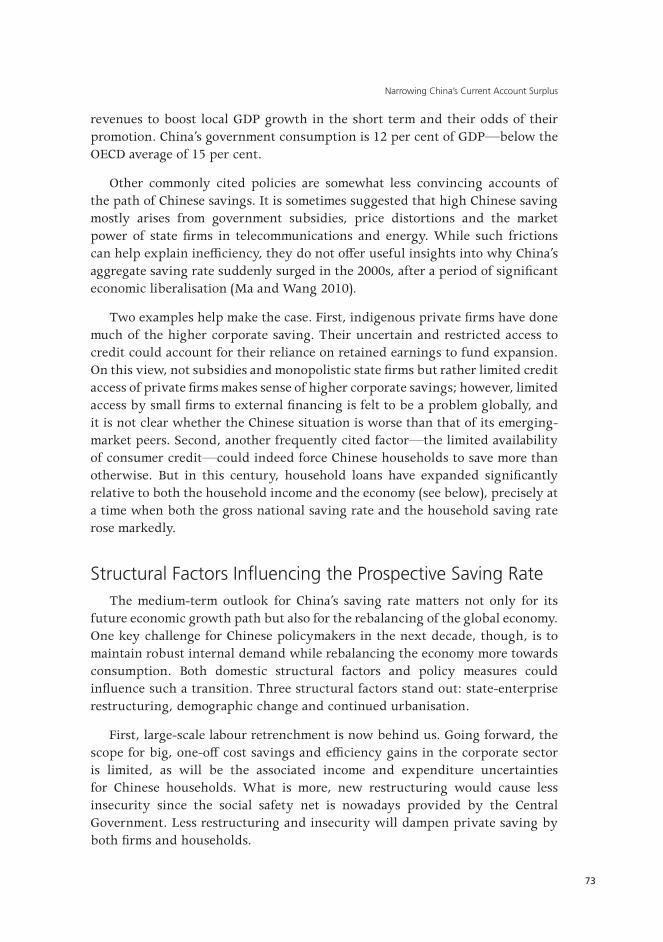
revenues to boost local GDP growth in the short term and their odds of their promotion. China’s government consumption is 12 per cent of GDP—below the OECD average of 15 per cent.
Other commonly cited policies are somewhat less convincing accounts of the path of Chinese savings. It is sometimes suggested that high Chinese saving mostly arises from government subsidies, price distortions and the market power of state firms in telecommunications and energy. While such frictions can help explain inefficiency, they do not offer useful insights into why China’s aggregate saving rate suddenly surged in the 2000s, after a period of significant economic liberalisation (Ma and Wang 2010).
Two examples help make the case. First, indigenous private firms have done much of the higher corporate saving. Their uncertain and restricted access to credit could account for their reliance on retained earnings to fund expansion. On this view, not subsidies and monopolistic state firms but rather limited credit access of private firms makes sense of higher corporate savings; however, limited access by small firms to external financing is felt to be a problem globally, and it is not clear whether the Chinese situation is worse than that of its emerging-market peers. Second, another frequently cited factor—the limited availability of consumer credit—could indeed force Chinese households to save more than otherwise. But in this century, household loans have expanded significantly relative to both the household income and the economy (see below), precisely at a time when both the gross national saving rate and the household saving rate rose markedly.
Structural Factors Influencing the Prospective Saving RateThe medium-term outlook for China’s saving rate matters not only for its
future economic growth path but also for the rebalancing of the global economy. One key challenge for Chinese policymakers in the next decade, though, is to maintain robust internal demand while rebalancing the economy more towards consumption. Both domestic structural factors and policy measures could influence such a transition. Three structural factors stand out: state-enterprise restructuring, demographic change and continued urbanisation.
First, large-scale labour retrenchment is now behind us. Going forward, the scope for big, one-off cost savings and efficiency gains in the corporate sector is limited, as will be the associated income and expenditure uncertainties for Chinese households. What is more, new restructuring would cause less insecurity since the social safety net is nowadays provided by the Central Government. Less restructuring and insecurity will dampen private saving by both firms and households.

Rebalancing and Sustaining Growth in China
74
Second, China can hardly avoid a rapidly ageing population and slower growth of its labour force in this decade. Indeed, China’s working-age population could stop growing in 2015 and thereafter shrink for 10 years or more. This could lead to a declining household saving rate and a slower pace of corporate investment spending, likely resulting in lower potential output growth unless productivity growth rises in an offsetting manner.
Third, while the migration from agriculture to the cities is likely to continue in the years ahead, there are signs that (and considerable academic debate about whether) China has reached the ‘Lewis turning point’ at which the modern economy has absorbed the surplus farmers (Garnaut 2010). When pressure on labour supplies in agriculture reaches this point, industrial wages rise to attract further migrants into industry. Then, wages can rise faster than productivity, raising labour’s share of income and depressing corporate saving (while appreciating the renminbi in real terms), and personal consumption can displace investment. Recent reports of double-digit wage growth make this conjecture plausible.
Taken together, these medium-term structural forces suggest that China’s aggregate saving rate over the coming years could plateau and then ease off noticeably from its current half of output. During this process, government policy can play a role in assisting the desired transition to a more balanced growth model, including: 1) further deregulation to reduce entry barriers in labour-intensive services to create more jobs and thereby to support the demand for labour and wage growth; 2) a stronger but sustainable social safety net; and 3) improved incentives for government provision of services (Ma and McCauley 2012).
China’s High Investment Rate and Factors Behind ItWe next turn to China’s investment rate, highlighting its recent trends
and reviewing its possible determinants. Over the past two decades, China’s gross capital formation, like its savings, has been high and rising in relation to output. Between 1990 and 2010, its investment–GDP ratio rose from 36 per cent to 48 per cent—an exceptionally high level for a big economy (Figure 4.1, top panel). Much of the marked rise in the Chinese investment rate took place in the decade following China’s 2001 WTO accession. It matches or exceeds peak investment rates reached during the high-growth phases of Korea and Singapore and on the eve of the Asian financial crisis by other Asian economies (Park and Shin 2009). Hence, the conventional wisdom is that China over invests.

Narrowing China’s Current Account Surplus
75
Figure 4.4 China’s Investment and Household Loans, as a Percentage of GDP
Gross Capital Formation, by Sector
Real Estate Investment and Household Loans
1 Real estate investment includes land purchases and demolition expenses, which could exaggerate relative to gross capital formation. 2 Household loans include mortgage loans, auto loans, credit card loans and others.
Source: CEIC.
As with Chinese saving, a breakdown of Chinese investment for the period 1992–2008 reveals that the three sectors all increased their investment, but not evenly. As of 2008, Chinese firms, households and government undertook 70 per cent, 20 per cent and 10 per cent, respectively, of the overall gross capital formation—similar to the OECD averages of 60 per cent, 25 per cent and 15 per cent. This raises a question about the assertion that housing and infrastructure investments in China have recently been excessive, especially in a

Rebalancing and Sustaining Growth in China
76
decade when state-owned firms provided employees with fewer apartments. Over this period, all three sectors contributed to a rise in the aggregate investment rate (Figure 4.4, top panel). In particular, government investment relative to GDP more than doubled—from 2.2 per cent to 4.8 per cent. In contrast, firms and households each added less than 2 percentage points of GDP to investment. Finally, while government and household investment as a share of GDP rose steadily, corporate investment swung sharply, dropping by more than 3 per cent during 1992–99 and then surging by 5 per cent during 2000–08.
Policymakers, academics and market participants disagree over whether China has invested excessively (Knight and Ding 2010; Park and Shin 2009). In light of the domestic demand composition, the Chinese investment rate is often regarded as too high—a sign of the so-called ‘internal imbalance’. But it remained lower than its even higher saving rate, giving rise to large current account surpluses in the mid-2000s—the so-called ‘external imbalance’.
Documented high investment returns sit uneasily with claims of widespread over-investment. Anecdotal examples of wasteful investments include see-through apartments, traffic-free highways, idle stadiums and unused capacity in some industries. Yet most studies find high, typically double-digit, returns to capital in the past two decades (Bai et al. 2006; Knight and Ding 2010). High returns to investment are sometimes ascribed to low interest rates, yet subsidised corporate borrowers who invest more should earn lower returns. In any case, while administered interest rates held below equilibrium levels can boost investment, they should also lead to inefficiency, affording inefficient state firms preferred access to cheap credit. As a result, returns on capital could rise if the prevailing benchmark interest rates converge towards some higher equilibrium levels, thanks to improved allocative efficiency.
In our view, there are at least four proximate determinants of the sustained high Chinese investment rate over the past two decades. First is the high expected return to capital, as discussed below. Second is the reduced risk to investment (higher risk-adjusted returns), arising from more pro-business policy and increasing official recognition of private property. Third, managers even at state firms have increasingly faced financial rewards based on profit. Fourth, local government officials have faced promotion incentives to undertake investment projects, amid weak constraints on local government competition with the private sector in the marketplace (Ma and Wang 2010; Xu 2011).
Some of the factors contributing to high investment returns have already been identified as underpinning the high Chinese saving rate, though increased global integration has weakened the domestic saving and investment correlation. The initially large pool of surplus rural labour as well as the surge in the working-age share of the population restrained wage growth and lifted

Narrowing China’s Current Account Surplus
77
profits. Large-scale resource reallocation, both from the farm to manufacturing through labour migration and from state to non-state firms through tough corporate restructuring, improved allocative efficiency. High growth, high saving and high investment tended to reinforce each other, particularly from an initially low capital–labour ratio (Knight and Ding 2010). China’s WTO accession in 2001 helped accommodate these structural transformations, allowing an expanding export sector to absorb surplus labour and to increase savings out of foreign sales to finance increased investment. Finally, private home ownership and more household credit led to rising real estate investment, accounting for as much as half of the rise in China’s investment rate in the 2000s (Figure 4.4, bottom panel).
Structural Factors Influencing the Prospective Investment Rate
Going forward, these same forces could influence the prospects for the Chinese investment rate. On the one hand, three factors could lead to a somewhat slower pace of investment relative to that of the past two decades. First, one-off windfalls from both the Chinese corporate restructuring and WTO entry could fade, and the per capita capital stock has been rising—both pointing to falling returns to capital. Stimulus from international trade could fade if the global financial crisis has weakened medium-term global growth. Second, an expected decline in the Chinese saving rate could push up the costs of capital. But, as discussed earlier, higher interest rates can also enhance efficiency and returns to investment. Third, the recent property price booms could cool off considerably, resulting in a collapse in real estate investment. This possible headwind could be overstated if real estate’s contribution to gross capital formation is exaggerated or if stimulus from public housing construction is overlooked.
On the other hand, high risk-adjusted expected returns to capital could continue. First, China’s capital–labour stock ratio, though rising, is still only a small fraction of the OECD average (Qu 2012). Second, such infrastructure as railways, subways and highways all could have ample room to expand relative to China’s population. Continued urbanisation and large-scale environmental projects could provide attractive investment opportunities for years to come, despite recent problems of bank lending to local government bodies. Third, ongoing technological progress, industrial upgrading and slower labour force growth could stimulate investment in labour-saving technology. Fourth, much-needed progress in the rule of law and contract enforcement could further reduce investment risks, while strengthened institutions might dampen cyclical volatility and enhance regulatory efficacy.
Rebalancing and Sustaining Growth in China
78
In sum, China’s government and firms might continue investing strongly in infrastructure and manufacturing capacity for some years to come, to build up the physical capital stock (and corresponding pension assets) as the population ages, to invest in labour-saving processes in manufacturing, to expand cities and to meet environmental challenges. Thus, the Chinese investment rate seems unlikely to decline sharply anytime soon. In other words, any expected domestic rebalancing between investment and consumption should be modest and gradual over the next decade.
Outlook for China’s Current AccountSo far, we have discussed, separately, the determinants and prospects for
China’s saving and investment. We have suggested that they both could trend lower in the coming decade. To assess their impacts on the saving–investment (or current account) balance, however, we need to ascertain their interaction within a general equilibrium framework, which is beyond the scope of this chapter. Small variations in these two bigger variables can produce material changes in their balance.
How might China’s domestic and external rebalancing play out in the coming decade? International experience offers mixed guidance. As emphasised by Kindleberger (1967) and seconded by Garnaut (2010), the Lewis turning point itself is likely to lead to a reduction of the current account surplus, as the rise in the wage share lowers savings. In China’s case, Kuijs (2006) tabled a set of policy measures and reforms that could potentially lower both Chinese saving and investment as a share of GDP by 18 percentage points and 11.5 percentage points, respectively. These estimates imply a fall in the current account surplus of 6.5 per cent of GDP. Nevertheless, the Japanese experience in the 1980s cautions that domestic rebalancing does not necessarily bring about external rebalancing. In fact, the Japanese domestic rebalancing was accompanied by growing external imbalances—Japan’s current account surpluses widened considerably during this transition phase (Fukumoto and Muto 2011).
As a baseline case, we envisage a more gradual scenario in which changing structural forces and sensible policy initiatives rebalance the Chinese economy. While growth remains respectable, the saving rate could fall more than the investment rate, further narrowing the current account surplus. The Chinese saving and investment rates could fall by 8 per cent and 4 per cent from the 2010 rates, respectively, to about 45 per cent and 44 per cent of GDP. The current account surplus could then narrow from 3 per cent of GDP in 2011 towards about 1 per cent over the coming decade. While this would require both private and public consumption spending to do more to drive economic growth, investment could remain a leading growth engine. One important variable helping to shape such a scenario is the Chinese exchange rate.
Narrowing China’s Current Account Surplus
79
The Renminbi Exchange Rate ManagementBesides the controversy over the fair value of the renminbi (Cheung et
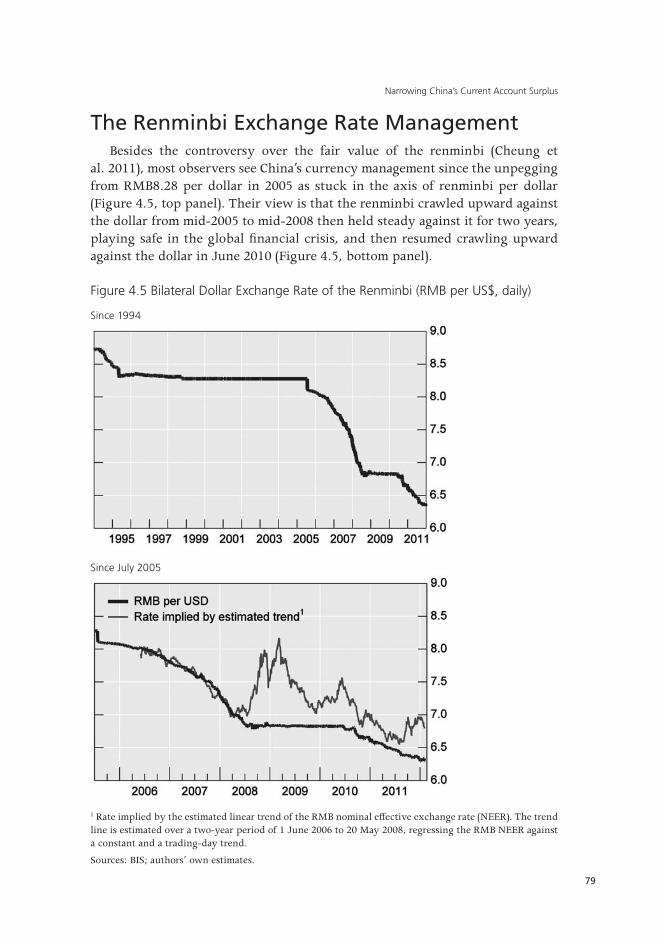
al. 2011), most observers see China’s currency management since the unpegging from RMB8.28 per dollar in 2005 as stuck in the axis of renminbi per dollar (Figure 4.5, top panel). Their view is that the renminbi crawled upward against the dollar from mid-2005 to mid-2008 then held steady against it for two years, playing safe in the global financial crisis, and then resumed crawling upward against the dollar in June 2010 (Figure 4.5, bottom panel).
Figure 4.5 Bilateral Dollar Exchange Rate of the Renminbi (RMB per US$, daily)
Since 1994
Since July 2005
1 Rate implied by the estimated linear trend of the RMB nominal effective exchange rate (NEER). The trend line is estimated over a two-year period of 1 June 2006 to 20 May 2008, regressing the RMB NEER against a constant and a trading-day trend.
Sources: BIS; authors’ own estimates.

Rebalancing and Sustaining Growth in China
80
On this view, the years since mid-2005 have not well anticipated the renminbi playing a supporting role in the rebalancing of the Chinese economy. Such a supporting role would require that the renminbi gain value against the currencies of China’s trading partners as a whole. Only accidentally can a gradual upward crawl against the dollar have this result.
We contend that this conventional view of the management of the renminbi is materially incomplete. Two developments in the renminbi’s management over the seven years since 2005 have prepared for an exchange-rate contribution to the rebalancing of the Chinese economy. First, exchange-rate movements have shown a multi-currency orientation and, second, they have allowed a substantial real effective appreciation (Ma and McCauley 2011a, 2011b). Both a transition away from the focus on the dollar and a real appreciation are conducive to a rebalancing of the Chinese economy away from investment and exports to domestic consumption.
An extraordinary set of essays by a People’s Bank of China deputy governor gives weight to both the nominal effective exchange rate (NEER) and the real effective exchange rate (REER). Hu (2010b) starts with the observation that ‘[t]heoretically, the best indicator to measure the international relative price of tradeables is [the] real effective exchange rate’. A lower price of tradeables (an appreciation of the real effective exchange rate) signals greater profit in production of services (whether haircuts or karaoke), than in production of goods for export, and so contributes to rebalancing the economy. She points out, however, two practical advantages of the NEER for policymaking: first, there is no need to agree on an appropriate and comparable price index; and second, the ‘real time’ availability of the NEER. Hu (2010c, 2010d) also refers to the power of renminbi appreciation to dampen imported inflation, pointing to the NEER as an important point of reference. Thus, both the NEER and the REER emerge as points of reference for Chinese currency policy.
We turn first to the renminbi movement against the basket of currencies of China’s trading partners. Then we show how the real or price-adjusted renminbi has appreciated, considering a newly constructed index based on unit labour costs as well as the Bank for International Settlements (BIS) index based on consumer prices. By this new measure, the renminbi’s competitiveness has eroded very substantially in this century.
Management of the Nominal Effective Exchange Rate After the abandonment of the peg against the dollar in July 2005, for about a
year the renminbi did in fact do little more than crawl upward against the dollar. As a result, the renminbi NEER tracked the dollar NEER.

Narrowing China’s Current Account Surplus
81
Starting in late spring of 2006, however, there was a subtle shift. Observers were looking for a widening in the renminbi’s daily moves against the US dollar but these remained very small by any standard. Despite continued tight management of daily fluctuations, however, over weeks and months, the renminbi NEER no longer shared the movements of the dollar NEER (Figure 4.6, top panel).
Figure 4.6 Nominal Effective Exchange Rate of the Renminbi (2005 = 100)1
RMB NEER and US Dollar NEER
RMB NEER and its 2006–08 Trend2, 3
1 BIS effective exchange rate index based on 61 economies.2 The trend line is estimated over the two-year period 1 June 2006 to 30 May 2008, regressing the RMB NEER against a trading-day trend. The adjusted R-squared is 0.48, while both the constant term and the trend coefficient are statistically significant at 1 per cent.3 The thick dotted lines represent ±2 per cent of the trend line, while the thin dotted lines represent ±1 per cent of the trend line.
Sources: BIS; authors’ own estimates.
Rebalancing and Sustaining Growth in China
82
Instead, the NEER of the renminbi showed steady upward movements. In short, what appeared to remain an upward crawl against the dollar slowly and imperceptibly turned into an upward crawl against China’s trade-weighted currency basket as measured by the BIS NEER index (Figure 4.6, bottom panel). Daily movements suggested management against the dollar but weekly or monthly movements favoured a broader, multi-currency orientation.4
In mid-2008, the global financial crisis worsened, sending the dollar soaring as non-US banks scrambled to obtain dollars. The renminbi quietly reverted to a familiar and easily understood dollar peg (Hu 2010d). Considering that the US dollar rose sharply in value, a continuation of NEER stability would have required a sharp depreciation of the renminbi against the dollar—even if neighbours’ currencies had not depreciated further in response to the renminbi movements (Figure 4.5, bottom panel). There is no telling how much more the offshore non-deliverable renminbi might have depreciated, and how much capital might have flowed out of China, had the renminbi not stabilised against the US dollar.
In June 2010, the renminbi resumed its movement against the dollar when the People’s Bank of China (PBC) announced an end to the ‘special measure’ of pegging to the dollar, appreciating by almost 8 per cent by the end of 2011. Some observers detected a quickening of its appreciation vis-a-vis the dollar in August 2011 after the downgrade by Standard & Poor’s of US Treasury obligations.
Looking at Figure 4.6 (bottom panel), the renminbi exchange rate policy since June 2010 is not clear. From mid-2010 to mid-2011, the NEER traded in a fairly narrow range against the currencies of China’s trading partners, only to rise in late 2011. If the renminbi’s NEER in 2006–08 described a basket, band and crawl (the so-called BBC of Williamson 2001) then the currency did not revert to it in 2010–11 (Figure 4.6, bottom panel).
Does this finding hold for the REER? After all, as noted, an appreciation of the REER provides incentives for production for domestic use rather than net exports. For China’s role in the global rebalancing, the renminbi’s REER, to which we now turn, is key.
4 Ma and McCauley (2011b) argue that the mid-2006 to mid-2008 data do not reject a hypothesis of a Singapore-style management with the NEER rising at 2 per cent per annum, mostly trading within 1 per cent of the centre and remaining within a ±2 per cent band (Figure 4.4, bottom panel, thin and thick dotted lines, respectively).

Narrowing China’s Current Account Surplus
83
Management of the Real Effective Exchange Rate Based on Consumer Prices
A rising REER would complement a rebalancing of the Chinese economy to more domestic, consumption-led growth. The experience of gradual NEER appreciation described in the preceding section was at the same time an experience in slightly faster appreciation of the REER, as defined by consumer prices. The next section introduces our unit labour cost-based measure, which suggests a significantly faster appreciation.
The REER appreciation of the renminbi in the period mid-2006 to mid-2008 was more pronounced than its NEER appreciation (Figure 4.7, top panel). That is, higher inflation in those years in China than in her trading partners meant a steeper REER path than NEER path for the renminbi. In particular, using monthly data—inflation data are available only monthly in most economies—the rate of appreciation was 0.44 per cent per month or about 5 per cent per annum (Figure 4.7, bottom panel).
From mid-2005 to December 2011, the renminbi’s REER appreciated by 30 per cent, while the nominal effective rate had appreciated by only 21 per cent. From June 2010 when the renminbi resumed fluctuations against the dollar, through December 2011, the NEER appreciated by some 3 per cent, while the REER appreciated by 6 per cent.
In contrast with the NEER, the REER in 2010–11 returned to the trend estimated in 2006–08. On this view, while the data for the earlier period could not distinguish between a NEER or a REER path for the renminbi, the data since mid-2010 weigh in for the REER path.
Looking forward, some observers have concluded that the policy of allowing substantial wage increases and rises in distorted administered prices (for energy, water, and so on) implies that future appreciation of the REER will be accomplished more through rises in the price level in China than through the nominal appreciation of the renminbi.

Rebalancing and Sustaining Growth in China
84
Figure 4.7 BIS Nominal and Real Effective Exchange Rates for the Renminbi (Index, 2005 = 100)1
Nominal Versus Real
Real
1 BIS effective exchange rate index based on 61 economies. The trend line is estimated over the two-year period of 1 June 2006 to 30 May 2008, regressing the effective exchange rate against a trend. The thick dotted lines represent ±2 per cent of the trend line, while the thin dotted lines represent ±1 per cent of the trend line.
Sources: BIS; authors’ own estimates.

Narrowing China’s Current Account Surplus
85
The Renminbi’s Real Exchange Rate Based on Unit Labour Costs
Reference to wage increases raises the question of how the renminbi’s exchange rate looks to a manufacturer. For a manufacturer, the inflation that matters is not that in consumer prices, which are more relevant to a tourist. Instead, manufacturers would want to compare the evolution of unit labour costs—that is, wage inflation in relation to productivity increases. If wage gains just match productivity increases then unit labour costs are steady; if they exceed them, unit labour costs are rising.
Combined with an exchange rate, unit labour costs in two economies can answer how the cost of manufacturing goods in one economy is changing relative to the cost of manufacturing goods in another economy.5 Is the exchange rate simply offsetting changes in relative unit labour costs, or amplifying them? Combined with the exchange rates of major manufacturing countries, unit labour costs can better answer the question of how the cost of manufacturing in one economy is changing relative to the cost of manufacturing in a weighted average of trading partner economies.
In any economy, measuring wages and productivity in manufacturing is challenging. It is all the more difficult in an economy like China’s where structural change is rapid. We estimate China’s unit labour cost by dividing total nominal wages paid in manufacturing by real GDP in manufacturing. For China’s trading partners, we rely on the OECD data for OECD members as well as a few other economies (such as Brazil and India) and national data for some important Chinese trading partners: Hong Kong SAR, Malaysia, Singapore, Thailand and Chinese Taipei. The resulting coverage is 43 economies—fewer than the 61 economies for which the BIS effective exchange rates are calculated.6
5 A related question is how the internal exchange rate between traded and non-traded goods evolves. He et al. (2012b) find that prices in the non-tradable sectors have risen significantly faster than those in the tradable sectors, and China’s internal real exchange rate has appreciated at a faster pace than the renminbi real effective exchange rate.
6 China’s total wage bill series changed its coverage in 1998, so that the data before and after 1998 are not comparable (Lu 2007). We first bridged the 1998 break in the manufacturing wage series and then used percentage changes in the old series to pad the new series back to 1994 (see Figure 4.8 for more details). The 43 economies for which we have unit labour costs collectively account for 95 per cent of the 60 BIS trade weights for China. We increase each weight by about 5 per cent so that the 43 weights add up to 100 per cent. Our estimates are closely in line with the World Bank (2010) estimates that were later cited by the Economist Magazine.

Rebalancing and Sustaining Growth in China
86
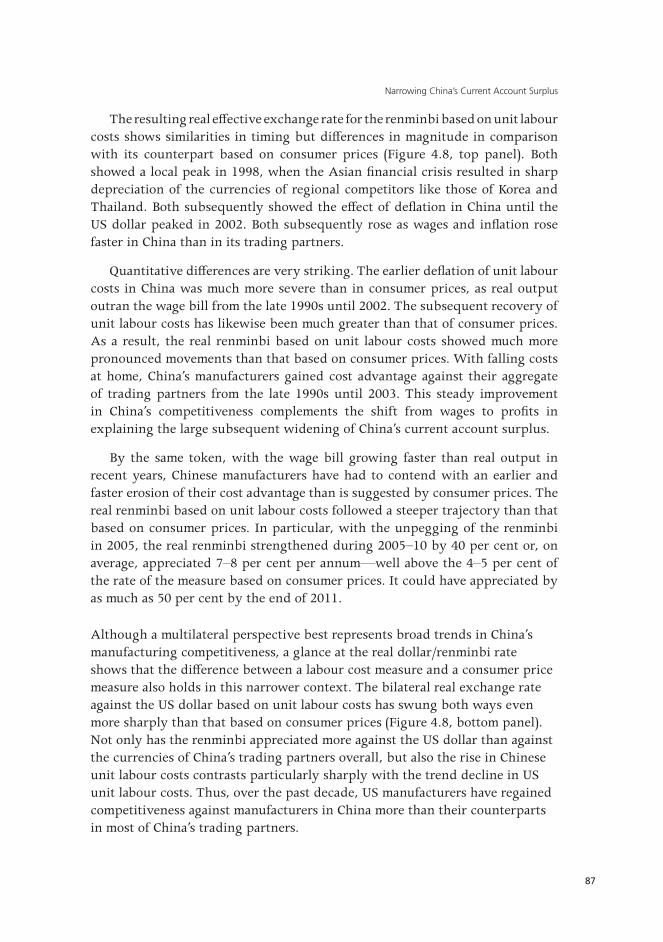
Figure 4.8 The Renminbi’s Real Exchange Rates Based on CPI and Unit Labour Costs (2005 = 100)
Effective Exchange Rates
Bilateral Dollar Exchange Rates
1 The ULC–based REER basket covers 43 trading partners’ currencies, with a combined trade weight of 95 per cent of the broad BIS basket for the renminbi. The 43 BIS trade weights are re-normalised for our ULC-based REER basket. 2 Unit labour cost of the industry sector for the euro area and of manufacturing sector for others; China’s unit labour cost is estimated using the ratio of the total nominal wage bill to the real GDP of the manufacturing sector. The coverage of the total wage bill was altered starting from 1998. The wage bill of 1997 is estimated by assuming the 1997–98 growth rate is the simple average of the 1996–97 growth rate and 1998–99 growth rate. The wage bill of 1993–96 is then estimated backwards using the growth rate of the original series. 3 The CPI-based REER and NEER of the broad BIS basket consisting of 61 trading partners’ currencies. 4 Nominal bilateral rate adjusted for the relative unit labour cost or CPI.
Sources: BIS; CEIC; national data; OECD; authors’ own estimates.
Narrowing China’s Current Account Surplus
87
The resulting real effective exchange rate for the renminbi based on unit labour costs shows similarities in timing but differences in magnitude in comparison with its counterpart based on consumer prices (Figure 4.8, top panel). Both showed a local peak in 1998, when the Asian financial crisis resulted in sharp depreciation of the currencies of regional competitors like those of Korea and Thailand. Both subsequently showed the effect of deflation in China until the US dollar peaked in 2002. Both subsequently rose as wages and inflation rose faster in China than in its trading partners.
Quantitative differences are very striking. The earlier deflation of unit labour costs in China was much more severe than in consumer prices, as real output outran the wage bill from the late 1990s until 2002. The subsequent recovery of unit labour costs has likewise been much greater than that of consumer prices. As a result, the real renminbi based on unit labour costs showed much more pronounced movements than that based on consumer prices. With falling costs at home, China’s manufacturers gained cost advantage against their aggregate of trading partners from the late 1990s until 2003. This steady improvement in China’s competitiveness complements the shift from wages to profits in explaining the large subsequent widening of China’s current account surplus.
By the same token, with the wage bill growing faster than real output in recent years, Chinese manufacturers have had to contend with an earlier and faster erosion of their cost advantage than is suggested by consumer prices. The real renminbi based on unit labour costs followed a steeper trajectory than that based on consumer prices. In particular, with the unpegging of the renminbi in 2005, the real renminbi strengthened during 2005–10 by 40 per cent or, on average, appreciated 7–8 per cent per annum—well above the 4–5 per cent of the rate of the measure based on consumer prices. It could have appreciated by as much as 50 per cent by the end of 2011.
Although a multilateral perspective best represents broad trends in China’s manufacturing competitiveness, a glance at the real dollar/renminbi rate shows that the difference between a labour cost measure and a consumer price measure also holds in this narrower context. The bilateral real exchange rate against the US dollar based on unit labour costs has swung both ways even more sharply than that based on consumer prices (Figure 4.8, bottom panel). Not only has the renminbi appreciated more against the US dollar than against the currencies of China’s trading partners overall, but also the rise in Chinese unit labour costs contrasts particularly sharply with the trend decline in US unit labour costs. Thus, over the past decade, US manufacturers have regained competitiveness against manufacturers in China more than their counterparts in most of China’s trading partners.

Rebalancing and Sustaining Growth in China
88
How much real exchange rate appreciation would be required by the 2 per cent decline in net savings that we discussed above? Obstfeld and Rogoff (2007) analyse the implications of a hypothesised jump in US savings for the real exchange rate, given the need to maintain employment in the non-traded goods sector. Working through their argument for China, the challenge would be to keep a sudden decline in savings from leading to excess demand for non-traded goods and services, given the short-run capacity to produce them. One would have to take into account that the structure of the Chinese economy is different from that of the US economy, with a larger traded goods sector and a smaller non-traded goods and services sector.
As these authors acknowledge, however, if the adjustment takes place over the medium term, the problem changes. What price signals are sufficient to induce private investment in non-traded goods and services so that supply is sufficient given eventually lower savings and higher consumption? We do not have a rigorous answer to this question. Over five to 10 years, we conjecture that a continued real appreciation of something like 5 per cent per year might be sufficient. In any case, such a scale of the renminbi’s real effective appreciation is most likely contributing to narrowing China’s current account (Cline 2010).
SummaryThis chapter has argued that China’s current account surplus will likely
trend lower from the 5–10 per cent of GDP seen in the mid-2000s towards 1 per cent in the coming decade, as saving declines more than investment and the renminbi continues its real appreciation. Factors that helped to account for the rise of Chinese savings over the past decade, such as one-off productivity gains and abundant supply of labour, point to their decline over the present decade. Investment is also likely to moderate but will remain robust on the back of large infrastructure projects and technical upgrading during China’s still early catch-up phase. Thus, China’s prospective saving–investment balance could well shrink on a trend basis. Policy might prove to cut in the same direction. The Government might deregulate services, strengthen the social safety net, bolster state-funded pensions and flush dividend income out of state-owned industry while shifting incentives for officials to deliver services rather than to pour concrete.
The exchange rate can play a supporting role in shifting to a more balanced growth model. Ongoing appreciation of the renminbi’s real effective exchange rate provides signals of profit for investment in the non-traded goods sector. It has been under way in the past seven years, with a real effective appreciation of about 4–5 per cent per annum coming from a nominal effective appreciation
Narrowing China’s Current Account Surplus
89
against the currencies of China’s trading partners of 2–3 per cent per annum, amplified by faster inflation in China than in its trading partners. Our new estimates based on unit labour costs rather than consumer prices suggest an even higher rate of 7–8 per cent per annum in real appreciation. There is no reason to believe that real appreciation cannot continue. Its balance between relative inflation of wages and prices, on the one hand, and nominal currency appreciation, on the other, remains to be seen.
Looking forward, a narrowed current account surplus and appreciated currency can eventually impart a greater sense of two-way risk in the trading of the renminbi. This sense would form a more propitious backdrop to further financial liberalisation and greater monetary autonomy as China makes the transition towards a more balanced economy.
BibliographyAsian Development Bank (ADB), 2009, Asian Development Outlook 2009:
Rebalancing Asia’s growth, Asian Development Bank, Manila.
Bai, C., Hsieh, C. and Qian, Y., 2006, ‘The return to capital in China’, Brookings Papers on Economic Activity, vol. 2, pp. 61–88.
Bernanke, B., 2005, The global saving glut and the US current account deficit, Homer Jones Lecture, St Louis, 14 April.
Blanchard, O. and Giavazzi, F., 2002, ‘Current account deficits in the euro area: the end of the Feldstein–Horioka puzzle?’, Brookings Papers on Economic Activity, vol. 2, pp. 147–209.
Cheung, Y., Chinn, M. and Fujii, E., 2011, ‘A note on the debate over renminbi undervaluation’, in Y. Cheung and G. Ma (eds), Asia and China in the Global Economy, World Scientific Publishing, Singapore, pp. 155–87.
Cline, W., 2010, Renminbi undervaluation, China’s surplus, and the US trade deficit, Policy Brief No. PB10-20, Peterson Institute of International Economics.
Cline, W., 2012, Projecting China’s current account surplus, Policy Brief No. PB12-7, April, Peterson Institute of International Economics.
Feldstein, M. and Horioka, C., 1980, ‘Domestic saving and international capital flows’, Economic Journal, vol. 90, no. 358 (June), pp. 314–29.
Fukumoto, T. and Muto, I., 2011, Rebalancing China’s economic growth: some insights from Japan’s experience, Working Paper Series No. 11-E-5, July, Bank of Japan, Tokyo.

Rebalancing and Sustaining Growth in China
90
Garnaut, R., 2010, ‘Macroeconomic implications of the turning point’, China Economic Journal, vol. 3, no. 2, pp. 181–90.
He, D., Cheung, L., Zhang, W. and Wu, T., 2012a, How would capital account liberalisation affect China’s capital flows and the renminbi real exchange rates?, Working Paper No. 09/2012, April, HKIMR.
He, D., Zhang, W., Han, G. and Wu, T., 2012b, Productivity growth of the non-tradeable sectors in China, Working Paper No. 08/2012, March, HKIMR.
Hu, X., 2010a, A managed floating exchange rate regime is an established policy, 15 July.
Hu, X., 2010b, Three characteristics of the managed floating exchange rate regime, 22 July.
Hu, X., 2010c, Exchange rate regime reform and monetary policy effectiveness, 26 July.
Hu, X., 2010d, Successful experiences of further reforming the RMB exchange rate regime, 27 August.
Kindleberger, C. P., 1967, Europe’s Postwar Growth: The role of labor supply, Harvard University Press, Cambridge, Mass.
Knight, J. and Ding, S., 2010, ‘Why does China invest so much?’, Asian Economic Papers, vol. 9, no. 3, pp. 87–117.
Kuijs, L., 2006, How will China’s saving–investment balance evolve?, World Bank Policy Research Working Paper No. 3958, The World Bank, Washington, DC.
Lewis, W., 1954, ‘Economic development with unlimited supplies of labour’, The Manchester School, vol. 22, no. 2, pp. 139–91.
Lu, F., 2007, China’s evolving manufacturing unit labour cost and its impact on the exchange rate, Working Paper No. C2007003, China Centre for Economic Research.
Ma, G. and McCauley, R., 2011a, ‘La gestion du renminbi depuis 2005’, in Finance Chinoise, Revue d’économie financière, no. 102 (June), pp. 163–81.
Ma, G. and McCauley, R., 2011b, ‘The evolving renminbi regime and implications for Asian currency stability’, Journal of the Japanese and International Economies, no. 25, pp. 23–38.
Ma, G. and McCauley, R., 2012, ‘China’s saving and exchange rate in global rebalancing’, SUERF Studies, vol. 2012, no. 1, pp. 123–40.

Narrowing China’s Current Account Surplus
91
Ma, G. and Wang, Y., 2010, ‘China’s high saving rate: myth and reality’, International Economics, no. 122 (December), pp. 5–40.
Ma, G. and Zhou, H., 2009, China’s evolving external wealth and rising creditor position, Working Papers No. 286, July, Bank for International Settlements, Basel.
Obstfeld, M. and Rogoff, K., 2007, ‘The unsustainable US current account position revisited’, in R. Clarida (ed.), G7 Current Account Imbalances, Chicago, pp. 339–66.
Park, D. and Shin, K., 2009, Saving, investment and current account surplus in developing Asia, Economics Working Paper No. 158, Asian Development Bank, Manila.
People’s Bank of China (PBC), 2008, China’s Monetary Policy Report, May, People’s Bank of China, Beijing.
People’s Bank of China (PBC), 2010, Further reform of the RMB exchange rate regime and enhancing the RMB exchange rate flexibility, Policy announcement, 19 June 2010, People’s Bank of China, Beijing, <http://www.pbc.gov.cn/english/detail.asp?col=6400&id=1488>
Qu, H., 2012, ‘China macroeconomics: what overinvestment?’, HSBC Global Research, February.
Williamson, J., 2001, ‘The case for a basket, band and crawl (BBC) regime for East Asia’, in Reserve Bank of Australia, Future Directions for Monetary Policies in East Asia, pp. 97–111.
World Bank, 2010, China Quarterly Update, June 2001, World Bank Office, Beijing, <http://www.worldbank.org/en/country/china/research/all?qterm=China+Quarterly+Update&lang_exact=English>
Xu, C., 2011, ‘The fundamental institutions of China’s reforms and development’, Journal of Economic Literature, vol. 49, no. 4 (December), pp. 1076–151.
Zhou, X., 2009, On savings ratio, Speech at the High Level Conference hosted by Bank Negara Malaysia, Kuala Lumpur, 10 February, <http://www.bis.org/review/r090327b.pdf>