Embed Size (px)
Citation preview
4 in every 10
Disabled children living in poverty
A better childhood. For every child. www.childrenssociety.org.uk
This report reveals that 4 in every 10 disabled children in this country live in poverty – that’s around 320,000 disabled children. Of those, 110,000 are experiencing severe poverty. When there is also a disabled adult in the household, around half of disabled children live in poverty. This is far too many and is simply not fair.
The Children’s Society has worked with disabled children for more than 120 years. In that time we have always worked to provide the support that they need to have a good childhood. This may be from providing short breaks to get out and about with other children, through to intensive family support services for families who need more help. However, we consistently find that where children are faced with deprivation within the home, our job becomes much harder.
We know from our work with thousands of children and families across our services, that the impact of poverty on any child is to blight their life chances and their prospects of a happy childhood. However, for children with disabilities, the impact can be particularly severe. They often already struggle against barriers to social inclusion, education and a healthy upbringing, and where their families lack the income needed to pay for basic necessities, these problems are greatly exacerbated.
This is why we need the Government to do more to lift these children out of poverty. In particular, they must rethink welfare reforms which would see upwards of 100,000 disabled children face a cut in support of up to £27 per week, following the introduction of the Universal Credit.
The action cannot end there. We simply cannot afford to ignore the 4 in 10 disabled children living below the breadline. The Government needs to make sure that all disabled children are getting their right entitlement to support, and that they are making the investment in financial support and services for disabled children, to ensure that they meet their 2020 commitment that no disabled child should live in poverty.
Bob ReitemeierChief Executive, The Children’s Society 6 October 2011
Foreword
Acknowledgements
Many thanks to Jonathan Bradshaw and Emese Mayhew at the University of York for their initial suggestions about the methodological approach to removing Disability Living Allowance from households with disabilities. Many thanks also to Haridhan Goswami, from The Children’s Society research team, for checking the methodology, and particular thanks to the Household Below Average Incomes team at the Department for Work and Pensions, for checking and fine-tuning our methodology and findings.
Any errors remain our own in entirety.
02

This report highlights four key recommendations for addressing poverty in families with disabled children. Detailed outlines of these recommendations are on pages 15–17.
1) Child poverty statistics should reflect the additional costs of raising a child with a disability
The Department for Work and Pensions and Office for Disability Issues should develop and implement disability equivalence value(s) to use when calculating levels of child poverty in the UK. At present, the child poverty statistics take no account of the additional costs faced by families caring for a child with disabilities. The analysis in this paper shows that the official statistics need to reflect the additional financial needs of these families.
2) The Government needs to ensure all households with disabled children take up their full entitlement to disability benefits
Lack of information, complexity in making a claim and the stigma attached to benefit receipt mean that too many families with disabled children do not take up their full entitlement to disability benefits. This hides the true extent of the problem.
The Government should invest in measures to improve uptake of Disability Living Allowance for disabled children. This could be achieved through a range of services, including welfare rights providers, family support workers and children’s centres.
3) The Child Poverty and Social Mobility Commission and the Office for Disability Issues should work together to establish an implementation plan for eradicating poverty among disabled children by 2020
Eradicating poverty among disabled children must be a key part of the implementation of the Government’s child poverty strategy. Although there is considerable mention in the child poverty strategy1 of support for families with a disabled adult, there is very little mention of the targeted support needed for families with disabled children.
The Office for Disability Issues and the Child Poverty and Social Mobility Commission should work together to formulate a strategy for eradicating poverty among disabled children by 2020.
4) The government must not cut rates of support for disabled children under the Universal Credit
The government has announced its intention to make a considerable cut to the financial support received by families with disabled children following the introduction of the new ‘Universal Credit’ benefit. This cut, which will cost an estimated 100,000 disabled children up to £27 per week, is likely to cost the poorest families the most because the support is means tested.
We believe that this cut in support will lead to more disabled children being pushed into poverty and call on the government to review it.
Summary of recommendations
1. HM Government (2011) “A new approach to Child Poverty: Tackling the Causes of Disadvantage and Transforming Families’ Lives” TSO: London
03
The Children’s Society has worked with disabled children for more than 120 years. Our earliest work focused on providing specialist care in residential children’s home settings, but by the 1960s, we were pioneering new forms of work with children and young people.
We now work directly with around a thousand disabled children across England. Our services provide advocacy for disabled children, support services to disabled children and their families, and short break opportunities. Our 34 Sure Start children’s centres provide support for families with very young disabled children and put them in touch with the support networks they need.
All forms of support for disabled children are hampered when families live on low incomes, making it harder for services to help disabled children to live a full and socially included life.
Introduction
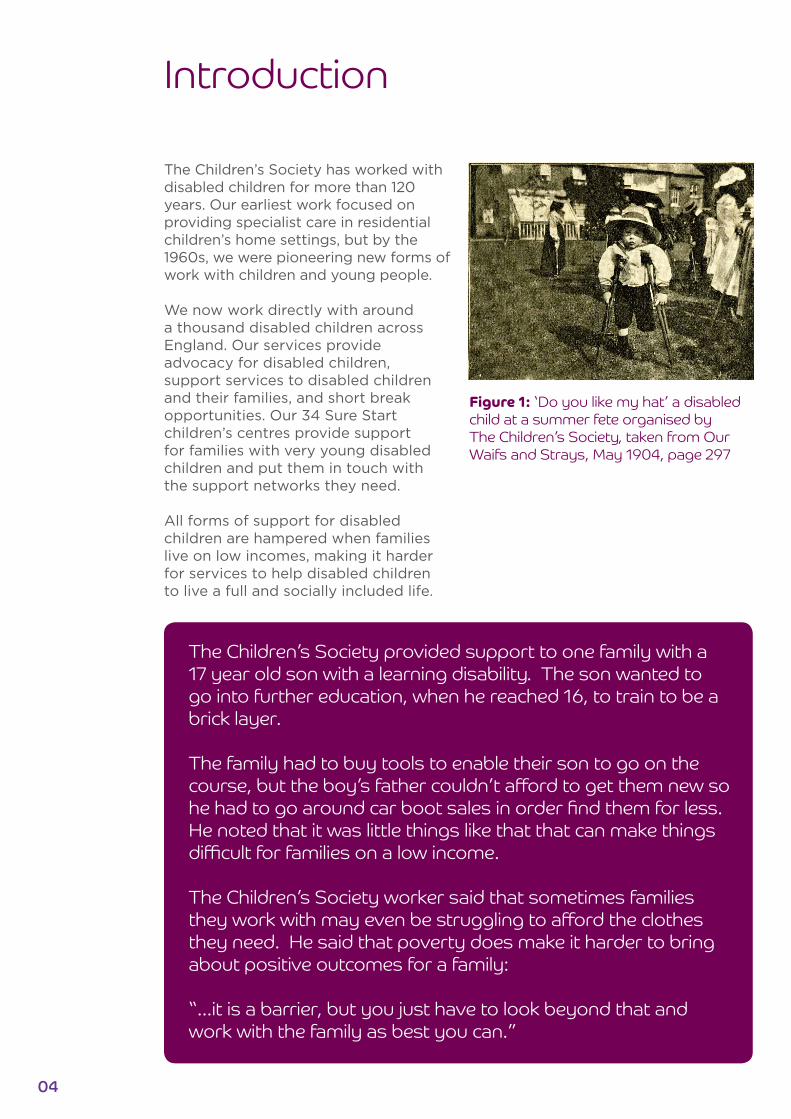
Figure 1: ‘Do you like my hat’ a disabled child at a summer fete organised by The Children’s Society, taken from Our Waifs and Strays, May 1904, page 297
The Children’s Society provided support to one family with a 17 year old son with a learning disability. The son wanted to go into further education, when he reached 16, to train to be a brick layer.
The family had to buy tools to enable their son to go on the course, but the boy’s father couldn’t afford to get them new so he had to go around car boot sales in order find them for less. He noted that it was little things like that that can make things difficult for families on a low income.
The Children’s Society worker said that sometimes families they work with may even be struggling to afford the clothes they need. He said that poverty does make it harder to bring about positive outcomes for a family:
“...it is a barrier, but you just have to look beyond that and work with the family as best you can.”
04

Introduction
Children in poverty can face deprivation in every aspect of their lives. One Department for Work and Pensions research report noted that:
‘Poverty permeates every facet of children’s lives from economic and material disadvantages, through social and relational constraints and exclusions, to the personal and more hidden aspects of poverty associated with shame, sadness and the fear of difference and stigma.’2
Previous research by The Children’s Society3 has shown that children living on a low income are far less likely to have a high level of subjective well-being than other children – only 8% of children in the top fifth of household incomes reported low levels of well-being, compared with 17% in the poorest fifth of households. Such low well-being is associated with depression and anxiety, as well as hampering child outcomes, such as educational attainment.
For children with disabilities, the impact of poverty can be particularly severe. These children can face substantial additional costs, such as larger heating bills, higher travel costs, and a wide variety of other needs – as broad as the types of disability which can affect them.
Without the additional support they need, such children may end up both deprived of material items and unable to engage in the normal day to day activities that other children take for granted – making it harder for them to develop friendships and leaving them socially isolated.
What it means to live in poverty
Top 4 3 2 Bottom
18
16
14
12
10
8
6
4
2
Figure 2: Well-being by household income
% lo
w li
fe s
atis
fact
ion
Equivalised household income (quintiles)
8% 9%12%
13%
17%
2. Tess Ridge (2009) “Living with poverty A review of the literature on children’s and families’ experiences of poverty” DWP: London3. The Children’s Society (2011) “How happy are our children: measuring children’s well-being and exploring economic factors” The Children’s Society: London
05
Under the Child Poverty Act, the Government is committed to eradicating child poverty by 2020. Over the last ten years there has been some limited progress towards this target – with child poverty rates falling from 34% in 1998/99 down to 30% in 2008/09.4
To measure progress towards this target, the Department for Work and Pensions produces a yearly analysis of poverty rates based upon data from the Family Resources Survey. This is called the Households Below Average Income (HBAI) analysis.
The HBAI analysis indicates that for the year 2008/09,5 27% of disabled children lived in poverty before housing costs are deducted, and 36% after the deduction of housing costs.6 However, our analysis shows that these figures underestimate the number of disabled children living in poverty.
We have reviewed the most recently available data7 to determine the proportion of disabled children living in poverty in the UK. Critically, we have taken into account the additional costs faced by households with disabled children. As a result, our analysis shows that the numbers of households with disabled children living in poverty are higher than previously estimated by government.
By removing benefits paid to cover the additional costs of living with disability from household income, the analysis provides a considerably more accurate assessment of poverty levels among disabled children than those which have been produced up to the present.
Measuring child poverty
4. Department for Work and Pensions (2010) “Households Below Average Income: An analysis of the income distribution 1994/95–2008/09” DWP Child Poverty rates on After Housing Cost measure.
5. For this report the 2008/09 HBAI is referred to throughout. This is because, although the 2009/10 HBAI has now been released, the FRS dataset for 2009/10 has not yet been made available. Therefore the analysis uses data based on the 2008/09 dataset, and the 2008/09 HBAI is referred to for comparison.
6. Department for Work and Pensions (2010) “Households Below Average Income: An analysis of the income distribution 1994/95–2008/09” DWP; p447. UK DWP Family Resources Survey (2008/09).
06
Measuring child poverty
Many disabled children receive Disability Living Allowance (DLA). This is paid to families who need additional financial support on account of their care or mobility needs. It is paid specifically ‘to help with extra costs you may have because you’re disabled.’8
HBAI analysis includes household income in full, including disability benefits (including DLA), and yet it makes no adjustment for the additional costs these households may face. To compare household incomes on a like-for-like basis, this benefit payment needs to be removed, to show the ability of households to pay for their needs but not the costs incurred as a result of disability.
This means that for two households, one with a disabled child and the other without, the household with a disabled child may appear to have a higher level of income than the equivalent household with no disabled children.
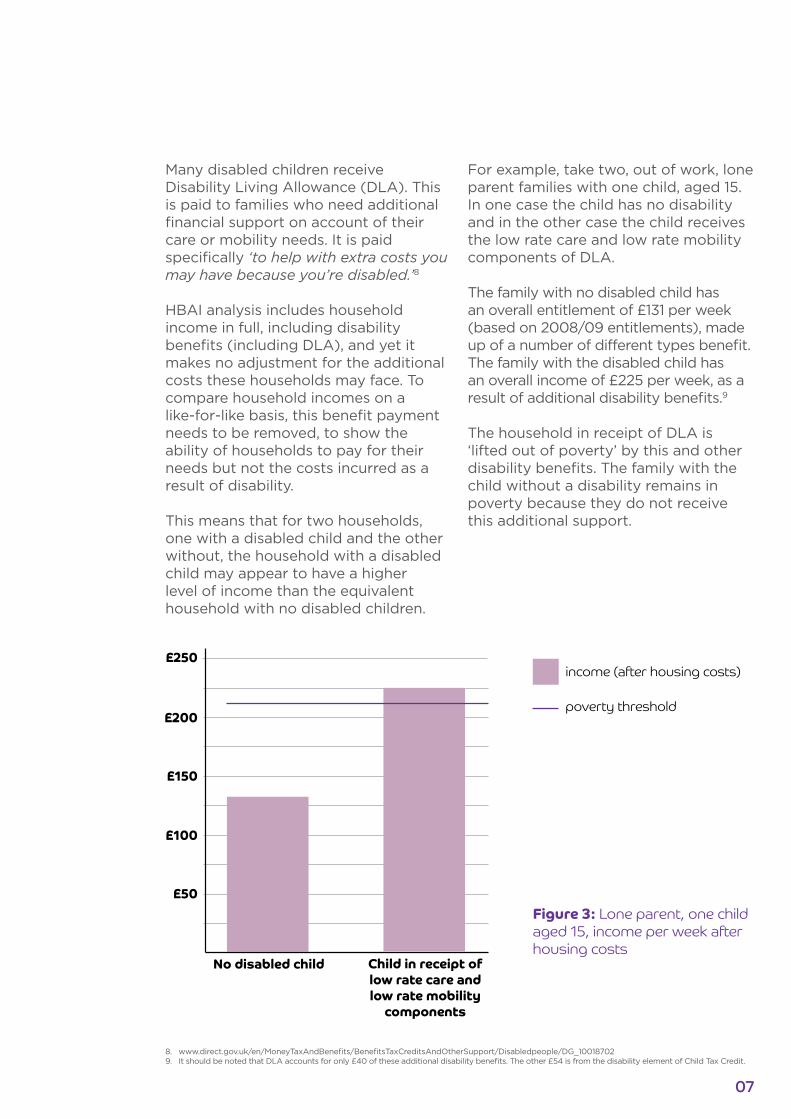
For example, take two, out of work, lone parent families with one child, aged 15. In one case the child has no disability and in the other case the child receives the low rate care and low rate mobility components of DLA.
The family with no disabled child has an overall entitlement of £131 per week (based on 2008/09 entitlements), made up of a number of different types benefit. The family with the disabled child has an overall income of £225 per week, as a result of additional disability benefits.9
The household in receipt of DLA is ‘lifted out of poverty’ by this and other disability benefits. The family with the child without a disability remains in poverty because they do not receive this additional support.
No disabled child
£200
£150
£100
£50Figure 3: Lone parent, one child aged 15, income per week after housing costs
£250
Child in receipt of low rate care and low rate mobility
components
income (after housing costs)
poverty threshold
07
8. www.direct.gov.uk/en/MoneyTaxAndBenefits/BenefitsTaxCreditsAndOtherSupport/Disabledpeople/DG_100187029. It should be noted that DLA accounts for only £40 of these additional disability benefits. The other £54 is from the disability element of Child Tax Credit.
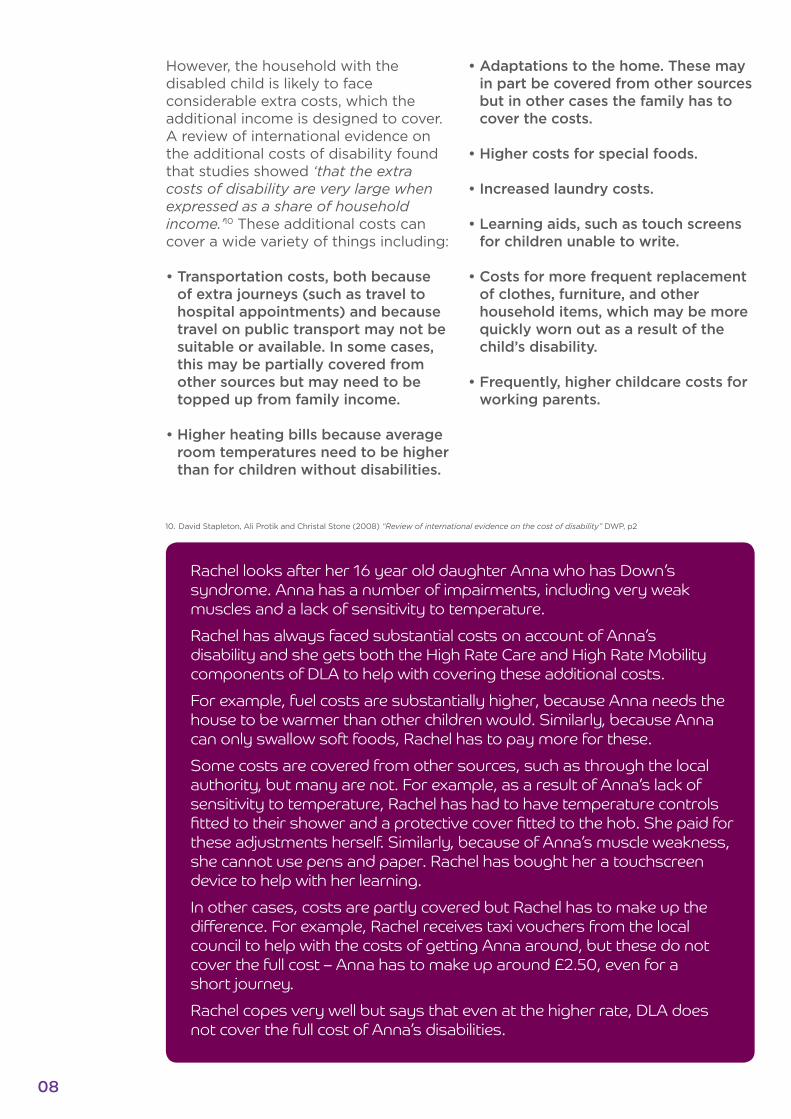
However, the household with the disabled child is likely to face considerable extra costs, which the additional income is designed to cover. A review of international evidence on the additional costs of disability found that studies showed ‘that the extra costs of disability are very large when expressed as a share of household income.’10 These additional costs can cover a wide variety of things including:
• Transportation costs, both because of extra journeys (such as travel to hospital appointments) and because travel on public transport may not be suitable or available. In some cases, this may be partially covered from other sources but may need to be topped up from family income.
• Higher heating bills because average room temperatures need to be higher than for children without disabilities.
• Adaptations to the home. These may in part be covered from other sources but in other cases the family has to cover the costs.
• Higher costs for special foods.
• Increased laundry costs.
• Learning aids, such as touch screens for children unable to write.
• Costs for more frequent replacement of clothes, furniture, and other household items, which may be more quickly worn out as a result of the child’s disability.
• Frequently, higher childcare costs for working parents.
Rachel looks after her 16 year old daughter Anna who has Down’s syndrome. Anna has a number of impairments, including very weak muscles and a lack of sensitivity to temperature.
Rachel has always faced substantial costs on account of Anna’s disability and she gets both the High Rate Care and High Rate Mobility components of DLA to help with covering these additional costs.
For example, fuel costs are substantially higher, because Anna needs the house to be warmer than other children would. Similarly, because Anna can only swallow soft foods, Rachel has to pay more for these.
Some costs are covered from other sources, such as through the local authority, but many are not. For example, as a result of Anna’s lack of sensitivity to temperature, Rachel has had to have temperature controls fitted to their shower and a protective cover fitted to the hob. She paid for these adjustments herself. Similarly, because of Anna’s muscle weakness, she cannot use pens and paper. Rachel has bought her a touchscreen device to help with her learning.
In other cases, costs are partly covered but Rachel has to make up the difference. For example, Rachel receives taxi vouchers from the local council to help with the costs of getting Anna around, but these do not cover the full cost – Anna has to make up around £2.50, even for a short journey.
Rachel copes very well but says that even at the higher rate, DLA does not cover the full cost of Anna’s disabilities.
10. David Stapleton, Ali Protik and Christal Stone (2008) “Review of international evidence on the cost of disability” DWP, p2
08
The most recent HBAI release recognises that not accounting for additional costs of disabilities is an issue, noting:
‘No adjustment is made to disposable household income to take into account any additional costs that may be incurred due to the illness or disability in question. This means that the position in the income distribution of these groups, as shown here, may be somewhat upwardly biased.’11
A fair comparison would deduct in full these additional costs from the overall household income, to give a true equivalent worth of the financial resources the two families possess. However, measurement of the ‘true’ costs of disability is extremely complicated and so is not attempted in our analysis. Instead, as a proxy, we deduct DLA payments in calculating poverty rates because this gives us a closer comparative indicator.
11. Department for Work and Pensions (2011) Households Below Average Income: An analysis of the income distribution 1994/95–2009/10, May 2011, London: DWP, p39
09

The following table sets out the proportions of all disabled children, and proportions of disabled children who live in households with disabled adults, living in poverty compared to poverty rates for all children. The poverty rates are shown with Disability Living Allowance both included and excluded from household income, and with both the before and after housing costs income measures.
Analysis of proportions of disabled children living in poverty
Group
All children (proportion)
All children (number)
All disabled children (proportion)
All disabled children (number)
Disabled children living with disabled adults (proportion)
Disabled children living with disabled adults (number)
Before housing costs (BHC)
DLA included in income
22%
2.8m
27%
215,000
33%
105,000
After housing costs (AHC)
DLA excluded from income
22%
2.8m
31%
245,000
41%
130,000
DLA included in income
30%
3.8m
36%
285,000
41%
130,000
DLA excluded from income
30%
3.8m
40%
320,000
49%
155,000
Sample size
13,638
845
339
Table 1: Proportions and numbers of children living in poverty before and after housing costs (numbers in millions rounded to nearest 100,000, numbers in thousands rounded to nearest 5,000)
Figure 4: Proportions of all children living in poverty, and all disabled children living in poverty (AHC) before and after DLA is excluded from household income.
All children
45%
40%
35%
30%
25%
20%
15%
10%
5%
30%
All disabled children
36%
Disabled children living with disabled adult
41%
50%
8%
4%
DLA excluded from income (additional)
DLA included in income
10
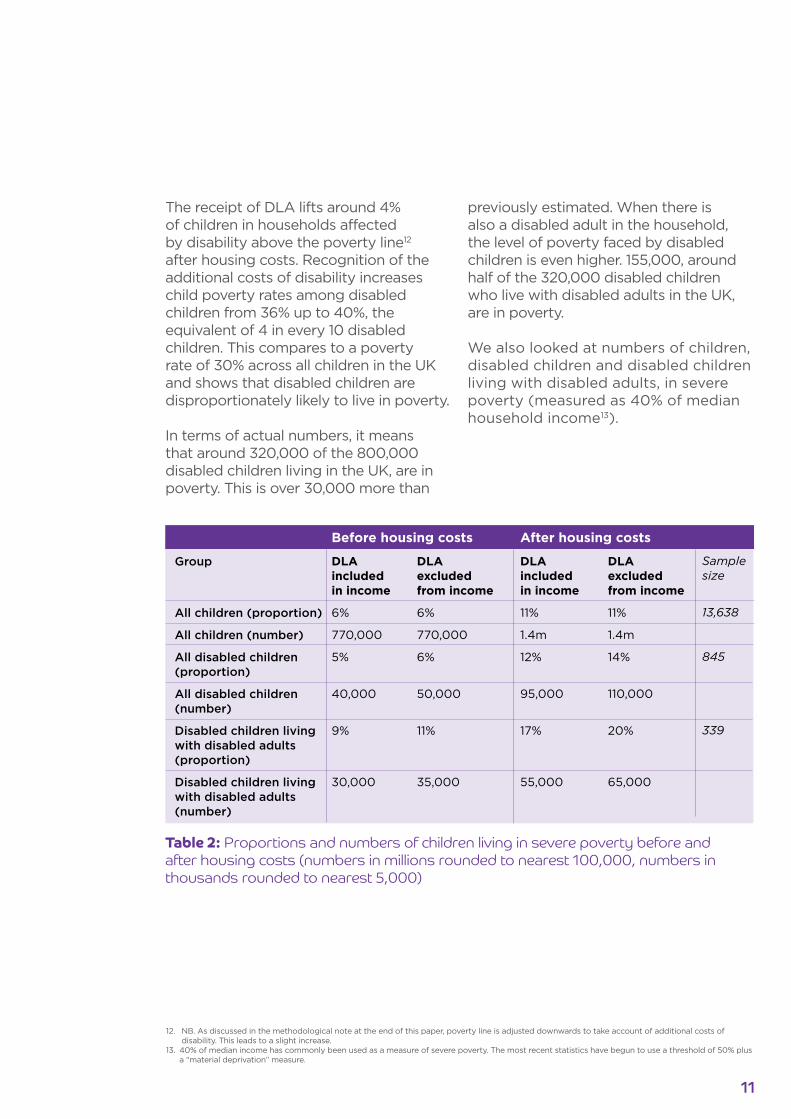
The receipt of DLA lifts around 4% of children in households affected by disability above the poverty line12 after housing costs. Recognition of the additional costs of disability increases child poverty rates among disabled children from 36% up to 40%, the equivalent of 4 in every 10 disabled children. This compares to a poverty rate of 30% across all children in the UK and shows that disabled children are disproportionately likely to live in poverty.
In terms of actual numbers, it meansthat around 320,000 of the 800,000 disabled children living in the UK, are in poverty. This is over 30,000 more than
previously estimated. When there is also a disabled adult in the household, the level of poverty faced by disabled children is even higher. 155,000, around half of the 320,000 disabled children who live with disabled adults in the UK, are in poverty.
We also looked at numbers of children, disabled children and disabled children living with disabled adults, in severe poverty (measured as 40% of median household income13).
Group
All children (proportion)
All children (number)
All disabled children (proportion)
All disabled children (number)
Disabled children living with disabled adults (proportion)
Disabled children living with disabled adults (number)
Before housing costs
DLA included in income
6%
770,000
5%
40,000
9%
30,000
After housing costs
DLA excluded from income
6%
770,000
6%
50,000
11%
35,000
DLA included in income
11%
1.4m
12%
95,000
17%
55,000
DLA excluded from income
11%
1.4m
14%
110,000
20%
65,000
Sample size
13,638
845
339
Table 2: Proportions and numbers of children living in severe poverty before and after housing costs (numbers in millions rounded to nearest 100,000, numbers in thousands rounded to nearest 5,000)
12. NB. As discussed in the methodological note at the end of this paper, poverty line is adjusted downwards to take account of additional costs of disability. This leads to a slight increase.
13. 40% of median income has commonly been used as a measure of severe poverty. The most recent statistics have begun to use a threshold of 50% plus a “material deprivation” measure.
11

All children
20%
15%
10%
5%
Figure 5: Proportions of all children living in severe poverty, and disabled children living in poverty (AHC) before and after DLA is excluded from household income.
11%
All disabled children
12%
Disabled children living with disabled adult
17%
25%
3%2%
DLA excluded from income (additional)
DLA included in income
2%
As can be seen, when DLA is included in household income, a very similar proportion of all children and disabled children live in severe poverty. Once DLA is removed, and after housing costs, a slightly higher proportion of disabled children (14%) live in severe poverty when compared to all children (11%). This is the equivalent of 110,000 disabled children.
The severe poverty rate for disabled children, when there is also a disabled adult in the household, is again much higher, with one in every five of those disabled children living in severe poverty, equivalent to 65,000 disabled children.
The impact of DLA on increasing household income depends on the level of DLA which is paid. DLA can be paid at 11 different rates depending on the nature of the disability. (Three rates of support for help with care needs and two rates of support for help with mobility needs, which can each be paid separately or in combination.)14
However, DLA can also be paid in combination with other disability related benefits. For example, children with disabilities may be entitled to the disability element of Child Tax Credit (CTC), which is worth up to £49 per week, and the severe disability element of CTC, which is worth up to an additional £19.50 per week. It is the combination of DLA with these other benefits which serve to lift families affected by disability above the poverty line.
The impact of DLA and other disability benefits on household income can be shown for an example family type in the following model.
14. The lowest rate of support which could be paid was £17.75 per week (lower rate care or mobility), the highest rate is £67 for high rate DLA plus £46.75 for high rate mobility giving a total DLA entitlement of £113.75 per week.
12
£200
£150
£100
£50
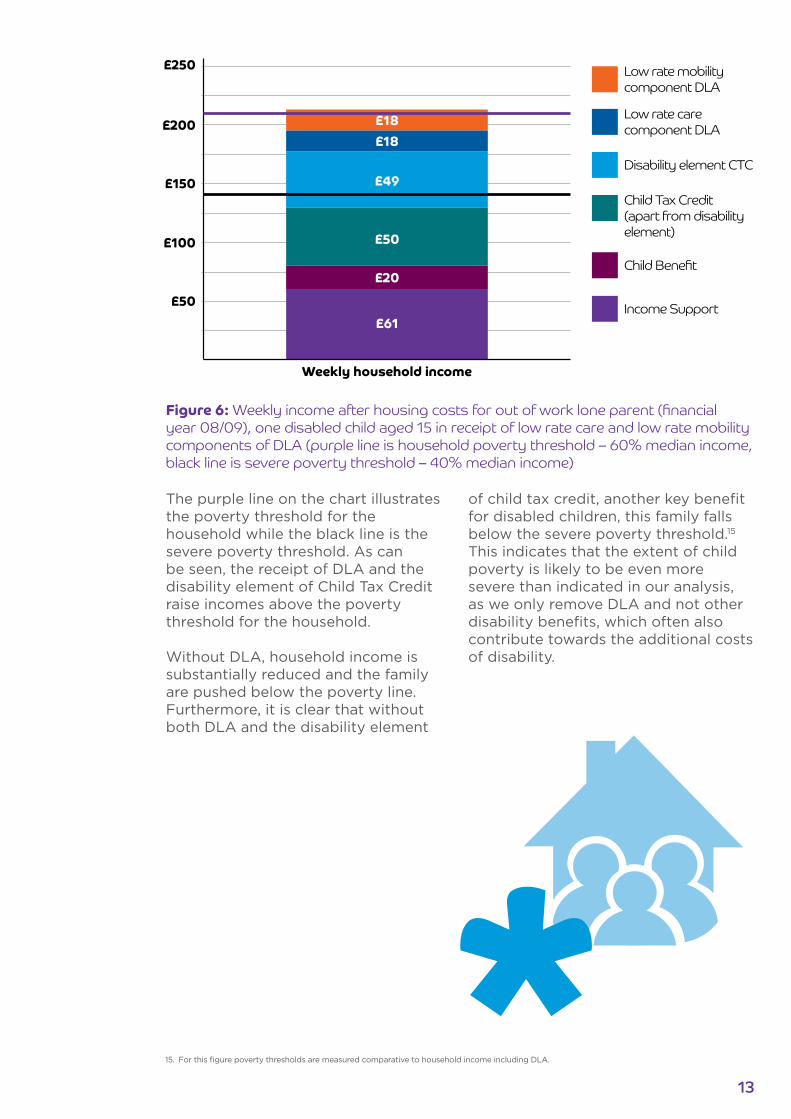
Figure 6: Weekly income after housing costs for out of work lone parent (financial year 08/09), one disabled child aged 15 in receipt of low rate care and low rate mobility components of DLA (purple line is household poverty threshold – 60% median income, black line is severe poverty threshold – 40% median income)
Weekly household income
£61
£250 Low rate mobility component DLA
£20
£50
£49
£18
£18 Low rate care component DLA
Disability element CTC
Child Tax Credit (apart from disability element)
Child Benefit
Income Support
The purple line on the chart illustrates the poverty threshold for the household while the black line is the severe poverty threshold. As can be seen, the receipt of DLA and the disability element of Child Tax Credit raise incomes above the poverty threshold for the household.
Without DLA, household income is substantially reduced and the family are pushed below the poverty line. Furthermore, it is clear that without both DLA and the disability element
of child tax credit, another key benefit for disabled children, this family falls below the severe poverty threshold.15 This indicates that the extent of child poverty is likely to be even more severe than indicated in our analysis, as we only remove DLA and not other disability benefits, which often also contribute towards the additional costs of disability.
15. For this figure poverty thresholds are measured comparative to household income including DLA.
13
1) Households affected by disability are more likely to not be working, or working fewer hours
The additional care responsibilities of looking after a child with a disability mean that families are more likely to be unable to move into work, or are working fewer hours in order to care for their child or children compared to other households.
As illustrated in Angela’s case study, the level of worklessness is much higher for households with disabled children, with 38% of disabled children living in workless households, compared to 16% of all children.16 And when those families are able to move back into work, on average they work slightly less hours than other families (48 hours per week compared to 50 hours per week17).
2) Households affected by disability who are working are more likely to be earning less
Working households with disabled children have lower earnings than working households without disabled children. Median weekly earnings for working households with disabled children are £23 per week lower than in households without disabled children. And, on average, hourly pay for working families with disabled children is lower than other families (£7.15 per hour compared to £7.50 per hour18).
A number of factors may be influencing the earnings levels of parents with disabled children. Caring for their disabled children may mean that parents are less able to take on full time work, with part-time work also paying less per hour.19 Also, those parents are unlikely to be able to invest the same amount of time into further skills development or training, enabling them to take on more skilled, higher-paid, work.
Why are children with disabilities more likely to live in poverty?
Angela is a single mum bringing up her disabled son. Toby is now 14 and has both severe learning disabilities and problems with his hearing.
Angela needs to be with her son the whole time when he is not in school. Although she feels able to occasionally pop down the road to the shop, she cannot leave him for more than 5–10 minutes in case he gets into any difficulties. She currently gets carer’s allowance for looking after him.
At some point Angela would like to move back into work. She previously worked in a care home and would like to go back to that work. However, for now, her home caring responsibilities make this impossible.
There are various reasons why, without the receipt of Disability Living Allowance, households with disabled children may be more likely to live in poverty than households with one or more disabled children. These include:
16. Figures taken from latest available Family Resources Survey (2008/09)17 Figures taken from latest available Family Resources Survey (2008/09).18. Figures taken from latest available Family Resources Survey (2008/09).19. In 2010, median pay for part time employees was £7.97, and £12.50 for full time employees (Office for National Statistics (2010) “2010 Annual Survey of
Hours and Earnings” ONS: Newport
14
Conclusions and recommendations
Four in ten disabled children live in poverty – that’s 320,000 children. Of those, more than a third live in the most severe poverty – in households living on less than 40% of median income.
Half of disabled children living with a disabled adult live in poverty.
The full extent of these poverty statistics have previously been hidden because no account was taken of the additional costs of disability in calculating poverty levels. The Children’s Society hope that this work will contribute to a more developed understanding of child poverty in the UK, and a deeper recognition of the need for further action to alleviate the levels of deprivation facing this group.
But the Government needs to begin to act now. Below are our four key recommendations to start to progress towards eradicating poverty for disabled children:
1) The Department for Work and Pensions and Office for Disability Issues should develop and implement a disability equivalence value or values to use when calculating levels of child poverty in the UK
The child poverty statistics need to reflect the additional costs faced by households with disabilities. Initially, Disability Living Allowance20 and other disability-related benefits need to be deducted from household income for the purposes of calculating poverty rates.
However, as already highlighted, many households with children with disabilities21 are not in receipt of disability benefits. This method does not capture these households.
Nor does it capture the costs incurred by households with disabilities above and beyond any disability benefits received and these hidden costs of disability need to be uncovered.
As a result, it is recommended that the DWP and the cross departmental Office for Disability Issues work to develop and agree an ‘equivalence’ value (or values) for households affected by disabilities. This would change the way in which household income is calculated for the purposes of identifying disabled children living in poverty.
2) The Government needs to ensure all households with disabled children take up their full entitlement to disability benefits
Many families with disabled children do not take up their full entitlement to disability benefits. This hides the true extent of the problem.
It is very difficult to estimate how many people not currently claiming disability benefits would be entitled were they to do so. However, it is notable that of the children identified in the Family Resources Survey as disabled, only around a third received Disability Living
20. And possibly other disability benefits paid to assist with the additional costs of disability.21. As identified within the Family Resources Survey.
15
Allowance. Not all of these families would be eligible for support but many may simply not be making a valid claim, or have their claim wrongly turned down. For example, in the year 2009–10, 41% (21,000) of DLA appeal cases were found in favour of the claimant,22 suggesting a large number of DLA claimants are initially, wrongly being refused the benefit. Many claimants will also give up before their appeal.
Even if the family are not eligible for DLA, they may face additional costs of caring for a disabled child, which are not currently met through the benefits system.
Lack of information, complexity of making a claim, and the stigma attached to receipt of benefits have all been identified as reasons why families fail to claim their full entitlement to DLA.23
The Government should promote increased uptake of DLA for disabled children. This could be achieved through partnership with a range of services including welfare rights providers, family support workers and children’s centres.
The most disadvantaged households, who find it most difficult to cover the additional costs of disability, and therefore are likely to suffer the most as a result of failing to take up their full entitlement, should be prioritised.
3) The Child Poverty and Social Mobility Commission and the Office for Disability Issues should work together to establish an implementation plan for eradicating poverty among disabled children by 2020
Eradicating poverty among disabled children needs to be a key part of the implementation of the Government’s child poverty strategy. Although there is considerable mention in the child poverty strategy24 of support for families
with a disabled adult, there is very little mention of the targeted support needed for families with disabled children.
The Office for Disability Issues and the Child Poverty and Social Mobility Commission should work together to formulate a strategy for eradicating poverty among disabled children by 2020. This strategy should address:
• The evolution of welfare support for families with disabled children to 2020
• Support services needed by low income families with disabled children
• Employment support to help parents with disabled children to move into work, including the need for additional support with childcare costs.
4) The Government must not reduce the rate of child disability additions paid under Universal Credit when compared to the rates paid through the disability element of child tax credit
In addition to DLA, families with a disabled child may currently be entitled to receive support through the disability elements of child tax credit. Under the Universal Credit, this support is to be provided through ‘disability additions’ within household benefit entitlements.
The policy intention of government is to halve the maximum level of support provided through the disability additions within Universal Credit, when compared to the disability element of child tax credit – reduced from £54 per week at current rates, down to £27 per week. This is equivalent to a loss of around £1,400 per year. This change could push families below the poverty line or further into poverty.25
This could result in a loss of income for families with a child born with a disability of around £22,000 by the time the child reaches 16 years old.
22. www.theyworkforyou.com/wrans/?id=2010-07-15d.6088.h&s=dla+appeals+section%3Awrans+section%3Awms#g6088.r023. Preston, G and Robinson, M (2006) “Out of Reach: benefits for disabled children” CPAG and Contact a Family: London.24. HM Government (2011) “A new approach to Child Poverty: Tackling the Causes of Disadvantage and Transforming Families’ Lives” TSO: London25. See The Children’s Society (2011) “Cuts to financial support for 100,000 disabled children under the Universal Credit” The Children’s Society: London.
16

The rate is paid per child, so a family with two disabled children could lose double this amount.
All but the most disabled children (those receiving the higher rate care component of DLA) will lose out substantially as a result of this change.
The Government estimates that around 100,000 disabled children will lose
out as a result of this change. Other estimates suggest that this figure is considerably higher.
The Government must recognise that given the high levels of disabled children in poverty, there is a crucial need to rethink this policy, which could further discriminate against some of the most vulnerable families with disabled children.
The Children’s Society works with David, a single dad with three children, two of whom have disabilities. Andrew aged 5 has Down’s syndrome, while his one year old sister Amy, has cerebral palsy.
David is already relying on family and friends to help out with caring from time to time, and his budget is tight. He could stand to lose £27 per week in support for Andrew under the Universal Credit. He is currently applying for disability benefits for Amy, and depending on the level of support she is awarded, could lose a further £27 per week from this support. He noted that:
‘Any cut to what we survive on now would have a real impact on our living. So many of the things we need every day, like milk for my youngest and nappies, are already more expensive... We just about manage.’
Now is a crucial time for addressing the needs of disabled children living in poverty. There are only nine years left to the Government’s target date for the eradication of child poverty in the UK, and the Welfare Reform Bill, which will be made law around the end of 2011, will define much of the future direction for financial support up until the end of that period.
It is clear that a lot more needs to be done to lift disabled children above the poverty line. The recommendations set out in this report would ensure that the most vulnerable children with disabilities receive a better childhood and a brighter future.
17
Appendix: Methodological note
The analysis for this report recalculated levels of poverty among households with children affected by disability to take account of the additional costs of raising a child with a disability. The analysis used the latest available Family Resources Survey (FRS) and Household Below Average Income (HBAI) datasets. The detailed methodology has been checked by the HBAI team at the Department for Work and Pensions to ensure the methodology was consistent, and results presented in this briefing comparable, to official child poverty statistics.
The first step was to identify the level of Disability Living Allowance (DLA) for each household receiving DLA and deduct this from household income (DLA was removed prior to household income equivalisation). DLA was deducted in order to both obtain individual household income without receipt of DLA and to recalculate median income. Recalculating median income was necessary in order to assess relative poverty rates (on incomes where DLA was deducted) for households with disabled children compared to all households.
The second step was to identify households with a disabled child and the number of disabled children within those households, as well as households with at least one disabled adult. Household income (with DLA receipt deducted) for all households was then compared to the recalculated median income level, and used to recalculate poverty rates among households with disabled children, households with disabled children and at least one disabled adult, and all households with children.
The poverty rates were then applied to the total child population covered by the FRS survey (12.8 million children) to estimate overall numbers of disabled
children in poverty with DLA removed from income. It should be noted that all DLA from the household was removed, so this includes any DLA received by adults within the household, as well as that received by children. This is correct as DLA is received to cover additional costs of a disability for both adults and children, and poverty statistics are measured at a household level.
The results showed that the poverty rates for households with disabled children, and for those with disabled children and at least one disabled adult, increased both before and after housing costs were deducted. Despite markedly increasing poverty rates for disabled children, this analysis is still likely to deliver an underestimate of the numbers of disabled children who are living in poverty. This is for three main reasons:
1) This methodology removes DLA from households with disabled children, but it does not remove significant additional disability-related costs from households with disabled children who are not claiming DLA (around 2/3 of disabled children do not receive DLA based on FRS estimates though many of these households will face additional disability related costs). As such it understates the level and depth of poverty for households, who face substantial disability-related costs, but either underclaim DLA, or are not entitled to DLA support.
2) Although DLA is removed, other disability related benefits are not. So, for example, the disability element of child tax credit is not removed from these cases (this was worth up to £2,405 pa for the year 2008/09, or £3,425 for the most severely disabled children – those in receipt of the high rate care component of DLA). It can be argued
18
that this money is also paid and used to help to cover the additional costs of disability. For example, the HMRC website notes that ‘if you’re responsible for a child with a disability, you may qualify for extra Child Tax Credit, to help cover the cost of looking after them.’26
As such, a strong argument can be made that, for the purposes of calculating poverty rates for disabled children, the disability element of child tax credit (and potentially certain other disability benefits) should be removed, as well as DLA.
3) DLA does not necessarily accurately reflect the additional costs of disability. While in this report DLA is used as a proxy for the additional costs incurred as a result of a disability, the true additional costs are very complex and not necessarily clearly connected to the rates of benefit that are received. For many families the level of DLA received may be insufficient to cover the full costs incurred as a result of a disability.
While one review of international evidence on the additional costs of disability found that costs are very large when expressed as a share of household income, it found little evidence on how to objectively determine the adequacy of disability benefit payments.27 There is a clear need for substantial further research addressing the adequacy of DLA.
26. www.hmrc.gov.uk/taxcredits/start/who-qualifies/children/disabled-child.htm27. Department for Work and Pensions (2008), Review of International Evidence on the Cost of Disability, London: DWP
19
© The Children’s Society, 2011
A better childhood. For every child.
The Children’s Society, Edward Rudolf House, Margery Street, London WC1X 0JLTel: 0845 300 1128 | Email: [email protected] Registration No. 221124 | Photographs posed by models | © Laurence Dutton | © Shutterstock
The Children’s Society wants to create a society where children and young people are valued, respected and happy. We are committed to helping vulnerable and disadvantaged young people, including children in care and young runaways. We give a voice to disabled children, help young refugees to rebuild their lives and provide relief for young carers. Through our campaigns and research, we seek to influence policy and perceptions so that young people have a better chance in life.
Children are at the heart of all we do. That’s why we want to build a better childhood – for every child.
For more information on this study, please contact Sam Royston, Poverty and Early Years policy adviser at: [email protected]
For more information on the analysis and methodology, please contact David Hounsell,economic adviser at: [email protected]
For more copies of this report and the summary, please visit: www.childrenssociety.org.uk/policy