Embed Size (px)
Citation preview

1 | P a g e
4-H Thrive!
Implementation of the Step-It-Up-2-Thrive
Curriculum in 4-H 2010 – 2012
“I think everyone should do this, not just 4-H
kids…I think it's really important, even for adults.”

2 | P a g e
4-H Thrive! 2010 – 2012
Recap of Planning Efforts & Summary of Findings
California 4-H Youth Development Program
Program Development and Implementation by
Gemma M. Miner, Scott Mautte, Shannon J. Horrillo, Kali Trzesniewski, and Keith
Nathaniel
Analyses by Kendra M. Lewis
Report Narrative Drafted and Edited by
Kendra M. Lewis, Kali Trzesniewski, Shannon J. Horrillo, Latonya S. Harris &
Gemma Miner
Contact Information:
Kendra M. Lewis, PhD
UC ANR
State 4-H Office
2801 Second Street
Davis, CA 95616
http://4h.ucanr.edu/

3 | P a g e
ANNUAL REPORT FROM CA 4-H YDP 2010 - 2012
Contents
INTRODUCTION ............................................................................................................................................. 5
Overview ................................................................................................................................................... 5
Background ............................................................................................................................................... 5
POSITIVE YOUTH DEVELOPMENT .......................................................................................................... 5
About the California 4-H Youth Development Program ....................................................................... 6
MINDSET ............................................................................................................................................... 7
SPARKS .................................................................................................................................................. 7
GOAL MANAGEMENT............................................................................................................................ 7
SELF-REFLECTION ON THRIVING INDICATORS ...................................................................................... 7
The 4-H Thrive! Model .......................................................................................................................... 8
4-H Staff and Project Leaders ............................................................................................................... 8
Planning and Development ................................................................................................................... 9
Training ................................................................................................................................................. 9
Pilot and Implementation ................................................................................................................... 10
EVALUATION ............................................................................................................................................... 12
Overview ................................................................................................................................................. 12
Research Questions ................................................................................................................................ 12
Listening to youth: .............................................................................................................................. 12
Testing benefits to youth: ................................................................................................................... 12
Listening to project leaders: ............................................................................................................... 13
Testing project leader impacts: .......................................................................................................... 13
Methods .................................................................................................................................................. 13
Procedures .......................................................................................................................................... 13
Measures ............................................................................................................................................. 13
Sample ................................................................................................................................................. 14
Results ..................................................................................................................................................... 14
Listening to youth ............................................................................................................................... 14
Testing Benefits for Youth................................................................................................................... 16
Listening to project leaders................................................................................................................. 27
Testing project leader impacts ............................................................................................................ 29
FUTURE DIRECTIONS ................................................................................................................................... 30

4 | P a g e
ANNUAL REPORT FROM CA 4-H YDP 2010 - 2012
Programmatic Future Directions............................................................................................................. 30
Monitor Implementation ............................................................................................................ 30
Revise training as needed ........................................................................................................... 33
Revise curriculum as needed ...................................................................................................... 33
Increase outreach and awareness .............................................................................................. 34
Looking ahead to Time 3 ............................................................................................................. 34
Years 4 and 5 Implementations .............................................................................................................. 35
Expanding the curriculum ........................................................................................................... 35
A randomized-controlled study .................................................................................................. 36
Using Data to Help Develop a Model of Thriving .................................................................................... 37
Measurement .............................................................................................................................. 37
Analyses ...................................................................................................................................... 39
CONCLUSION ............................................................................................................................................... 41
References .................................................................................................................................................. 42

5 | P a g e
ANNUAL REPORT FROM CA 4-H YDP 2010 - 2012
Overview In March 2010, the California 4-H Youth Development Program (YDP) received a gift from the
Thrive Foundation for Youth and with this gift embarked on an exciting opportunity to strengthen
the program through integration of the most recent, cutting edge research on positive youth
development. After conducting a thorough review of the research on youth development and
promising youth development programs, the Thrive Foundation for Youth developed a “theory
of change,” to identify what young people need to experience in youth programs to thrive and
reach their full potential. Based on the theory, the Thrive Foundation for Youth designed a
curriculum called Step-It-Up-2-Thrive aimed at actively promoting thriving in youth ages 10-19
years old. The California 4-H YDP is one of several youth programs to partner with the Foundation
with the goal of delivering the thriving curriculum to their youth. The California 4-H YDP staff
have adapted the curriculum and fully integrated it into 4-H programming.
This report summarizes the work that 4-H has done over the first three years of the gift,
including the planning process and the activities that 4-H engaged in to imbed and integrate the
Thrive curriculum into existing programming. In this report we also provide a preliminary
assessment of the effect of the Thrive curriculum on youth in the
program. Finally, we make suggestions for (1) adjusting and improving
implementation of the Thrive curriculum into 4-H activities to
maximize youth thriving outcomes and (2) extending the
evaluation efforts to include testing theoretical models of
thriving.
Background
POSITIVE YOUTH DEVELOPMENT Positive youth development (PYD) forms the context through which 4-H provides programs to
youth. PYD is a practice that fosters young people’s relationships with people and institutions
that are mutually beneficial, productive and constructive; that
recognizes and enhances youth’s strengths; and that promotes positive
outcomes by providing youth with opportunities to build on their
strengths. In theory, infusing positive youth development practices into
INTRODUCTION
INTRODUCTION

6 | P a g e
ANNUAL REPORT FROM CA 4-H YDP 2010 - 2012
programming leads to
thriving, or the growth
of attributes that mark
a flourishing, healthy
young person. Dr.
Richard Lerner
proposed that key
characteristics of
youth are important
for positive youth
development
including being
competent—having a
positive view of one’s
efficacy; confident –
having an internal
sense of positive self-
worth; connection –
forming positive
bonds with people or
institutions; having
character—respect
for social and cultural
norms; having a sense
of caring—a sense of
empathy for others;
and contribution –
giving of one’s self,
family, and
community (Lerner et
al., 2011). To
summarize, these
attributes or
indicators of thriving are defined as – competence, confidence, character, connection, caring,
and contribution to self, family, community, and civil society. These outcomes have been called
the Six Cs (6 Cs) of PYD (Lerner et al., 2005; Roth & Brooks-Gunn, 2003a,b).
About the California 4-H Youth Development Program
The University of California 4-H YDP is dedicated to helping young people 5-
to 19 years old reach their full potential and grow into competent, contributing,
and caring citizens. The mission of the program is to “engage youth in reaching
their fullest potential while advancing the field of youth development.”
The California 4-H YDP is part of the national 4-H movement, established over
a century ago. 4-H is delivered through the Cooperative Extension System and is a
partnership between the United States Department of Agriculture, the land-grant
university system, and local governments. In California, the 4-H YDP is
administered by the University of California Division of Agriculture and Natural
Resources and delivered through Cooperative Extension to youth, families, and
communities in 57 counties.
The California 4-H YDP has four core content areas that serve as the
framework for youth learning and activities: Science, Engineering, and Technology
(SET), Citizenship, Leadership, and Healthy Living. Within these areas, youth may
engage in project-based learning activities such as robotics, rocketry, water
education, environmental science, animal science, leadership, service learning,
agriculture, gardening, health, nutrition, and public speaking. The youth engage in
these activities through 4-H’s existing delivery modes including clubs, afterschool
programs, residential camping programs, school enrichment, and short-term and
special interest programs. These programs are all delivered in a positive youth
development context that incorporates youth development and educational
practices shown to best promote positive youth development.
During the 2011-12 program year, the California 4-H YDP program served over
78,730 youth. Of these youth, approximately 32,014 of these youth participated
in 4-H clubs, 32,975 youth participated in school enrichment programs delivered
by 4-H, 3,381 youth participated in after school programs that used 4-H curricula,
and 5216 youth, including many of who were involved in 4-H in other capacities,
also participated in 4-H camping programs. Youth were served directly by nearly
13,400 adult and 6,893 youth leaders; and indirectly by approximately 135 county
staff.

7 | P a g e
ANNUAL REPORT FROM CA 4-H YDP 2010 - 2012
MINDSET A wealth of research has been conducted to identify the practices that help youth thrive. For
instance, Dr. Carol Dweck proposed that success (e.g., school success) is related to one’s view
about the fixed versus malleable nature of traits and ability. Having a “fixed mindset,” the belief
that intelligence or a given ability is innate and unchanging, leads youth to disengage and give up
when they are confronted with a challenging task. On the other hand, youth who have a “growth
mindset” believe that through sustained effort, even in the face of challenge, they can learn
and improve (Dweck & Leggett, 1988).
SPARKS Based on his research on positive youth development, Dr. Peter Benson, with Dr. Peter
Scales, proposed that having a “spark,” or a passion for a self-identified interest, skill, or talent,
provides youth with excitement and joy, gives them a sense of purpose and direction, and a
way to contribute to the world. Sparks shape development because they provide a source of
intrinsic motivation, meaning, and self-directed action that help drive young people to put forth
initiative to act in a particular area (e.g., further develop one’s leadership skills). Benson and
Scales (2009) proposed that having a positive, caring, adult as a guide to help provide youth
support, opportunities to pursue their sparks, and appropriate pressure to keep moving to take
the next step helps youth thrive.
GOAL MANAGEMENT Research shows us that youth thrive when they have strong goal management skills to
support and guide their interests and skills. Components
that are important for goal management include “goal
selection,” or the ability to identify a goal; “pursuit of
strategies,” or the ability to plan a method for meeting
goals; and “shifting gears,” or an understanding how to
adapt or modify goals or strategies when difficulties are
encountered. These facets of goal management are
known as GPS (Gestsdóttir & Lerner, 2008; Lerner, Lerner,
Lewin-Bizan, Bowers, Boyd, Mueller et al., 2011).
SELF-REFLECTION ON THRIVING INDICATORS Self-reflection is a higher order meta-cognitive process and involves recreating and making
sense of an experience through memories of feelings and thoughts. Reflecting on previous
experiences provides information for moving forward in pursuit of goals and leads to goal clarity.
Moreover, positive youth development researchers have shown that self-reflection is an

8 | P a g e
ANNUAL REPORT FROM CA 4-H YDP 2010 - 2012
important component of the intentional self-regulation cycle, which includes responding to
performance feedback by adjusting goals and motivations in productive ways (Zimmerman,
2002). Self-reflection is also an important component of the experiential learning cycle (Kolb,
Boyatzis, & Mainemelis, 1999), which is a holistic and cyclical theory of learning.
The vast array of research that has been conducted by leaders in the field of positive youth
development and the theories that resulted have been integrated into the Step-It-Up-2-Thrive
theory of change and associated curriculum. Through a partnership with the Thrive Foundation
for Youth, the California YDP worked to implement this theory and curriculum into its program
for youth.
The 4-H Thrive! Model
The California 4-H YDP has a long history of promoting positive youth development and,
therefore, provided an optimal environment in which to implement the Step-It-Up-2-Thrive
curriculum. 4-H Thrive! is the adapted version of Step-It-Up-2-Thrive designed for the California
4-H YDP. The curriculum incorporates the research described above and guides youth through
activities designed to promote thriving, specifically the Six Cs of PYD. 4-H Thrive! encourages
youth to identify their sparks, adopt a growth mindset, self-reflect on the indicators of thriving,
and build goal management skills; all of which have been shown to be critical for promoting
thriving. The expectation is that youth who participate in 4-H Thrive! will gain skills in the key
components of positive youth development, which will lead to increases in the 6 Cs and overall
thriving.
4-H Staff and Project Leaders
Project leaders are the core of the 4-H YDP and are
primarily responsible for mentoring and working directly
with youth, guiding them through activities and projects.
Thus, project leaders directly influence youth
experiences in the program and are an essential part of
the California 4-H YDP. As such, project leaders are a
critical part of the success of 4-H Thrive! because they
are responsible for the direct implementation of the
curriculum.
Project leaders are supported by University of California Division of Agriculture and Natural
Resources staff, which includes 4-H Program Representatives who plan, implement, and deliver
4-H educational programs; 4-H Youth Development Advisors who provide academic leadership
to the 4-H YDP in their counties; specialists (faculty who provide expertise to Cooperative
Extension); community members; and the State 4-H Office.

9 | P a g e
ANNUAL REPORT FROM CA 4-H YDP 2010 - 2012
The goal of the California 4-H YDP partnership with the Thrive Foundation for Youth was to
integrate the Step-It-Up-2-Thrive Theory of Change into 4-H’s programs, curricula and other
educational materials, and professional and volunteer development efforts. The section below
describes the overall planning and development phase, training plan, evaluation plan, and pilot
and implementation phase.
Planning and Development
The first year was devoted to establishing a 5-year plan,
developing program infrastructure, creating the initial
curriculum and core messages, and developing training
programs so that Step-It-Up-2-Thrive could be infused
throughout the California 4-H YDP.
In addition, the 4-H Online Record Book (ORB) was
developed as a tool to integrate components of the theory of change such as goal management
and self-reflection into the existing record keeping traditions and practices of the 4-H YDP, as
well as a tool to collect data and assess the effectiveness of the Thrive curriculum.
The second year we launched 4-H Thrive! curriculum that was written and designed for junior
and teen leaders who are in the club program and enrolled in a 4-H Leadership Development
Project. In addition, extensive professional development and training modules were developed
and delivered to over 4,000 adults by the end of the second year.
Training
Training began in September 2010 with a statewide
conference for all 4-H YDP staff. Staff learned about the
components of the theory of change, and the research on
which it was based. Subsequently, each county selected two
adult volunteers, two youth members, and one 4-H YDP staff
to serve as “Master Trainers.” Employing a “train-the-trainer”
approach, Master Trainers attended two-day training sessions
(the first occurring during the spring of 2011) and then
returned to their counties to train local project leaders who
would deliver the Thrive curriculum in leadership projects to
4-H youth in grades 6 through 12. Master Trainers and 4-H YDP staff provided on-going
IMPLEMENTATION

10 | P a g e
ANNUAL REPORT FROM CA 4-H YDP 2010 - 2012
individualized support to project leaders who implemented the curriculum to youth. Annually,
everyone received refresher training including Master Trainers, 4-H YDP staff, and project leaders
implementing the Thrive curriculum in leadership projects. The refresher training sessions were
designed to reinforce key concepts, train new components of the curriculum, and provide
opportunities to share experiences with others administering Thrive. These training sessions
occurred in the fall of each program year. In addition to receiving training on implementing the
curriculum, staff and project leaders statewide received training on how to navigate and promote
the 4-H ORB.
Pilot and Implementation Implementing the Step-it-Up-2-Thrive curriculum into existing 4-H programming was a vast
and comprehensive statewide effort. A team of 4-H academic coordinators, specialists, and
advisors worked together (“4-H Thrive! Leadership Team”) to plan for the implementation of
the Thrive curriculum. There were several major accomplishments associated with the effort to
implement and integrate Thrive into 4-H as described below.
The 4-H Thrive! Leadership Team adapted Step-It-Up-2-Thrive curriculum for delivery in 4-H
programs.
Key Training Outputs 15 hours of train-the-trainer sessions were
conducted 17 times throughout the state over a two-
year period for a total of 6960 training hours
completed.
464 Master trainers were trained, including 128
youth.
529 adults received curriculum-based leadership
training.
325 staff participated in annual 4-H conferences or
staff development days where they received Thrive
lessons or messages integrated into existing content.

11 | P a g e
ANNUAL REPORT FROM CA 4-H YDP 2010 - 2012
We distributed over 770 iChampion Adult Volunteer Guides to project leaders,
which provide extensive content on 4-H youth development practices as well as
the Step-It-Up-2-Thrive Theory of Change.
We distributed approximately 3,500 iThrive Youth Member Guides to youth
members, which cover the thriving concepts and guide youth through activities
and self-reflection.
Thrive language was imbedded in all of 4-H publications (samples available upon request),
such as
UC 4-H YPD Framework
Project Sheets
4-H statewide website
4-H’s monthly E-newsletters
Key Implementation Outputs 35 counties implemented the Thrive curriculum.
6,760 adults participated in at least one event in
which they received Thrive lessons or messages.
5,242 youth received Thrive messages during the 2010-11 and/or 2011-12 4-H year. o 1,726 of these youth participated in at least one event in which they received Thrive lessons or messages. o 3,516 of these youth received the Thrive
curriculum during a year-long leadership project.

12 | P a g e
ANNUAL REPORT FROM CA 4-H YDP 2010 - 2012
Overview Evaluation of the 4-H Thrive! curriculum began in 2011 and continues today. Evaluation data
are collected yearly from youth, project leaders, and master trainers. Project leaders and
master trainers report on their content knowledge about Thrive concepts and feelings of efficacy
about their ability to train project leaders (master trainers) or to deliver the Thrive curriculum
(project leaders). In addition, master trainers and project leaders report their beliefs about
whether they feel the Thrive curriculum will positively affect youth. 4-H youth report on their
sparks, growth mindset, GPS (goal management), the 6 Cs of PYD (caring, character, competence,
confidence, connection, and contribution), self-esteem, depression, and stress. Finally, fidelity
data and qualitative data are gathered throughout the year.
Research Questions
The goal of the evaluation is to document whether youth benefited from participating in
the evidence-based Step-It-Up-2-Thrive curriculum, as adapted for and delivered throughout
the California 4-H YDP. Below we list the specific research questions we tested, based on youth
surveys and project leader surveys collected in 2011 and 2012. Following the list of research
questions there is a brief overview of the methods (full surveys are available in Appendix A),
followed by the results. Clicking on any research question below will take you to the results for
that question.
We first asked whether participating in 4-H Thrive! was a positive experience for youth and
project leaders. These qualitative data come from individual interviews with the youth and
project leaders. We then used the quantitative data to test the effects of 4-H Thrive!.
Listening to youth:
1. Did youth enjoy participating in 4-H Thrive!?
2. Would youth recommend 4-H Thrive! to others?
Testing benefits to youth:
1. Do youth who participate in 4-H Thrive! increase in
program components?
2. Do youth who increase in one program component also
increase in other programs components?
EVALUATION

13 | P a g e
ANNUAL REPORT FROM CA 4-H YDP 2010 - 2012
3. Do youth who increase in one program component also increase in adjustment
outcomes?
Listening to project leaders:
1. What did project leaders enjoy most about leading 4-H Thrive!?
2. Would project leaders recommend 4-H Thrive! to others?
3. Would project leaders lead 4-H Thrive! again?
Testing project leader impacts:
1. Do project leader characteristics influence youth’s outcomes?
2. Do project leaders become better Spark Champions, as reported by youth?
Methods
Procedures
Data were collected from 4-H youth in California who participated in 4-H Thrive!. Youth
surveys were embedded in the newly developed Online Record Book (ORB). Project leader
surveys were collected at the end of their training session. In addition, a small subset of youth
and project leaders were interviewed by a 4-H staff member in their county.
Measures
Youth surveys. Data were collected once in 2011 and once in 2012 to assess youth gains on
core Step-It-Up-2-Thrive program components and adjustment outcomes.
Program components: Sparks, Mindset, GPS, and Thriving Indicators
Adjustment outcomes: Stress, Depression, and Self-Esteem
Project leader surveys. Data were collected in 2011 following project leader training. Project
leaders reported their buy-in (enthusiasm) about 4-H Thrive! and their perceived skills as a leader.
Interviews. Following the completion of the project in 2012, both youth and project leaders
were asked about their experiences with 4-H Thrive!, their knowledge about the core program
components, what they enjoyed about the program, and what they would tell others about the
program. In addition, youth were asked how they have applied what they learned from 4-H
Thrive! to other parts of their life, and project leaders were asked how 4-H helps promote the
core program components in youth.

14 | P a g e
ANNUAL REPORT FROM CA 4-H YDP 2010 - 2012
Sample
Participants in the initial phase of 4-H Thrive! were drawn from leadership projects across
California. The evaluation sample was primarily drawn from four counties: Santa Clara, Marin,
San Joaquin, and Lake. These counties were chosen to represent both rural
and urban environments in California.
Time 1 sample:
582 youth, ages 9 to 19 years
48 project leaders
Time 2 sample:
501 youth, ages 9 to 19 years
Most of the research questions are related to change
over time (e.g., did youth show increases in program
components from pre-4-H Thrive! to post-4-H Thrive!), so
most analyses are based on our longitudinal sample (N
range= 89 to 151).
Results
Listening to youth
Did youth enjoy participating in 4-H Thrive!?
Fourteen youth were interviewed about their experiences participating in 4-H Thrive!.
Below is a word cloud displaying the most frequently used words in their responses to being
asked what they enjoyed the most about the Thrive program. Words in larger font were
mentioned more often than words in smaller font. As can be seen, youth referred to
“collaboration”, “fun” and “learn” as parts of the program they enjoyed the most. In addition,
youth made references to personal growth, with words like “confident,” “goals,” and
“stronger,” and to connections they made, with words like “teamwork,” “socializing,” and
“group”. Finally, youth talked about activities with words like “games,” “activities,” and
“projects.”
Longitudinal sample
187 youth with at least one measure completed
91.6% White
70.6 % female
Ages 10 to 18 (mean 14.33)
62.1% live in rural areas

15 | P a g e
ANNUAL REPORT FROM CA 4-H YDP 2010 - 2012
One youth found many benefits to 4-H Thrive, and that these benefits exceeded those of any
other project or programs she has experienced:
“The connections you
establish with your group and
the amount of knowledge that
you gain and the leadership that
you get, and the self-confidence
that it makes in you overcomes
any other project that I’ve been
in, any other leadership project
in any aspect of my life, and it
makes a stronger, more
confident, better leader.”
Another youth, who was a 4-H
Thrive! Teen Leader, enjoyed being part of the project leader process:
“I enjoyed teaching it, because it was like opening up people’s minds to saying there are
other ways of doing things and there [are] many ways of learning, and learning about learning is
fun.”

16 | P a g e
ANNUAL REPORT FROM CA 4-H YDP 2010 - 2012
Would youth recommend 4-H Thrive! to others?
Youth were asked, “What would you tell other young people about Thrive?” Youth explained
what they learned in the program and how the program helps them, providing evidence of youth
buy-in and enthusiasm for the program.
“I would tell [other youth] that they should join the project and that they should come into it
with an open mind. Just interact with others and that you’ll automatically get something from
it. Everyone can get anything from it.”
“I would say it helps you find goals for yourself, and makes you a better person.”
“I would tell them that it's really fun, and you learn more about yourself and what you like
doing.”
Youth believed that the 4-H Thrive! program was meaningful. They enjoyed the hands-on
activities, and were eager to tell other youth to participate in the program. 4-H youth clearly
enjoyed 4-H Thrive! and felt that the program is worthwhile and beneficial for everyone. But, did
4-H Thrive! have a measurable impact on youth?
DO YOUTH WHO PARTICIPATE IN 4-H THRIVE! INCREASE IN PROGRAM COMPONENTS?
Testing Benefits for Youth

17 | P a g e
ANNUAL REPORT FROM CA 4-H YDP 2010 - 2012
The task: Youth were asked to draw pictures that illustrated what things they enjoyed doing, the
people that mattered to them, what activities and social issues or causes mattered, and what
makes the youth want to jump out of bed in the morning.
The goal: Give youth the opportunity to identify, think about, and discuss their spark.
The challenges: 4-H provides a high-quality context for
identifying and developing sparks; thus, a large majority of 4-
H youth can identify a spark making it difficult to find large
pre-post changes. Nonetheless, education and
guidance will continue to be provided with the
goal of getting 100% of 4-H youth to be able
to identify and grow their spark(s).
Presented below are the mean scores on Spark items pre 4-H
Thrive! and post 4-H Thrive!. We also present the effect size (d), which
measures the standardized difference between these means. For comparison, a .20 standardized
difference is considered a “small”, .50 “medium”, and .80 “large” effect size.
Note: Scale is ½ standard deviation. Error bars are 2*standard error of the mean. N= 129, 130, and 105, respectively.
3.263.32 3.36
3.093.26 3.23
2.75
3.30
3.85
4-H helped me find my spark 4-H helped me get better at myspark
4-H gave me opportunities to workon my spark
Spar
ks S
amp
le M
ean
Pre-Thrive Post-Thrive
d= -.05 d=-.13
Did you know…?
75% of 4-H youth can identify a
spark!
d = -.14

18 | P a g e
ANNUAL REPORT FROM CA 4-H YDP 2010 - 2012
The result: Overall, a large majority of youth reported having a spark and this did not change over
time. There was a slight, non-significant, decrease in youth reporting that 4-H helped them find
their spark, 4-H helped youth get better at their spark and 4-H provided opportunities to get
better at their spark. However, 28% did show increases on these measures.
Future directions: We will code youth’s sparks for clarity, contribution to their community, and
the overall quality of the spark. This will allow us to better understand program impacts on
youth’s sparks. Based on the findings above, we will work with project leaders to provide training
and resources so they can learn how to help youth get better at their spark and provide more
opportunities for youth to work on their spark. We will also review videos of sparks lessons to
try to identify areas for improvement. In addition, the current measure may not be sensitive to
changes in individual differences. We propose supplementing the current measures with
measure tapping passion to see if that captures the spark concept and shows more change over
time. See the Future Directions for a detailed discussion.
The task: Youth were taught that the brain grows and gets stronger when exercised, like all
muscles in the body, and they learned that the best way to grow their brain is to try new things
and persist through challenge. Youth played challenging games and discussed which attitudes
during the challenge represented a growth versus a fixed mindset.
28% of youth increased their Sparks at least
¼ of a standard deviation.

19 | P a g e
ANNUAL REPORT FROM CA 4-H YDP 2010 - 2012
The goal: Give youth the opportunity to see how having a growth attitude toward challenge can
help them persist during difficulty.
The challenges: Although 4-H emphasizes personal growth and reflection (e.g., youth writing
about their experiences in their record book), there are many project leaders and youth who
emphasize external rewards (e.g., winning at the County Fair). This is one of the greatest
challenges for 4-H. Given that 4-H’s mission is to help youth thrive and that staff, project leaders,
and youth are all committed to this mission, we believe that we can create a paradigm shift
through teaching about the benefits of having a
growth mindset and focusing on effort and
persistence.
The result: Youth, on average, did not
significantly change in their growth mindset from
pre-Thrive to post-Thrive. Although there was no
change found overall, 31% of youth showed
positive development.
31% of youth increased their Growth Mindset at least
¼ of a standard deviation.
Youth and project leaders
participate in the “Traffic Jam”
game. This game gives participants
a challenging obstacle in which they
must persist to solve the game. The
objective of the game isn’t to solve
the Traffic Jam, but to teach youth
about persistence and the benefits
of having a growth mindset when
faced with challenges.
3.97 3.91
3.30
3.65
4.00
4.35
Gro
wth
Min
dse
t Sa
mp
le M
ean
Pre-Thrive Post-Thrive
d = -.10
Note: Scale is ½ standard deviation. Error bars are
2*standard error of the mean. N= 138.

20 | P a g e
ANNUAL REPORT FROM CA 4-H YDP 2010 - 2012
Future directions: We will review the interviews with youth and project leaders and note which
growth mindset messages made the most impact (i.e., the messages that are mentioned the
most). In addition, videos of project meetings are being coded and exemplars will be identified
to use for future trainings. Finally, videos and results from a randomized-controlled trial with 4-
H partnered afterschool programs (in which external rewards might be emphasized less) will be
compared with the 4-H community club program results to gain further insight into effective
delivery of growth mindset messages. See the Future Directions for a more detailed discussion
about the videos and the randomized-controlled trial.
The task: Youth were taught the three steps of goal management: Goal selection, Pursuit of
Strategies, and Shifting Gears (GPS). Youth then participated in challenging activities followed by
discussion of and reflection on how they applied what they learned about GPS.
Youth participate in the
“Puzzle Cube” activity, one of
the favorite activities among
youth. This activity challenges
youth to build a cube with pre-
cut PVC pipe. Here, youth are
reflecting on their progress
and discussing the next step in
reaching their goal.

21 | P a g e
ANNUAL REPORT FROM CA 4-H YDP 2010 - 2012
The goal: Give youth the opportunity to collaborate to solve a problem, learn about strategies,
be persistent to reach a goal, and know when to change goals.
The challenges: We may expect that there would not be any growth in goal management due to
ceiling effects because 4-H has a long history of teaching and providing experiences related to
goal setting and management. The increase shows that even though 4-H already promotes goal
management training and support for project leaders, an intentional focus on goal management
can still lead to growth.
The result: Youth, on average, showed no
significant changes in goal management skills,
but we do see a percentage of youth who
increased in these skills.
Future directions: Continue to give youth opportunities to learn about setting goals, strategies
to reach those goals, and reflection on their goal management process and skills. Additionally,
the current measure of goal management is in the form of a rubric. This may not be the strongest
measure for assessing goal setting, pursuit of strategies, and shifting gears. Although we found
effects of 4-H Thrive! on goal setting using the rubric, we believe that we will find stronger effects
and will be able to look at G, P, and S separately using the Youth Selection Optimization and
Compensation scale (Freund & Baltes, 2002; Gestsdóttir & Lerner, 2007; Zimmerman, Phelps, &
Lerner, 2007), which we are now including in our study. See the Future Directions for more
information regarding the measurement of goal management.
43% of youth increased their Goal Management Skills at least
¼ of a standard deviation.
4.204.27
3.83
4.14
4.45
Go
al M
anag
em
en
t Sa
mp
le M
ean
Pre-Thrive Post-Thrive
d = .12
Note: Scale is ½ standard deviation. Error bars are
2*standard error of the mean. N= 133.

22 | P a g e
ANNUAL REPORT FROM CA 4-H YDP 2010 - 2012
The task: Youth are given the opportunity to review the 6 Cs of positive youth development.
Youth then read scenarios and guess which “C” the scenario illustrated, and the youth provided
examples of their skills related to 3 of the 6 Cs and shared them with fellow members.
The goal: Help youth understand if they are thriving and practice self-reflection.
The challenges: This program component requires youth to practice self-reflection, a task that
can be difficult even for adults. By continually giving youth opportunities to practice self-
reflection, we believe we can increase youth’s development on these thriving indicators.
Immediate change on the 6 Cs may be difficult to detect. Although self-reflection is emphasized
in every lesson, specific discussions of the 6 Cs occurs at the end of the program year and youth
may need more time to reflect and internalize these messages. Therefore, it is possible that
changes in the 6 Cs will take more time to see.
Note: Scale is ½ standard deviation. Error bars are 2*standard error of the mean. N=67,60,59,63,56,63
4.40
4.62
4.46
4.26
4.454.35
4.484.57
4.42
4.27
4.58
4.45
4.00
4.26
4.52
4.78
Competence Character Connection Caring Confidence Contribution
6 C
s o
f P
YD
Sam
ple
Me
an
Pre-Thrive Post-Thrive
d=.14 d=-.15 d=-.08 d=.01 d=.23 d=.18

23 | P a g e
ANNUAL REPORT FROM CA 4-H YDP 2010 - 2012
The result: Youth, on average, showed no significant change in the 6 Cs. Only increases in
confidence were significant (t(62)= 2.04, p<.05). However, there were youth who showed
positive development.
Future directions: Continually provide youth with opportunities to learn about the 6 Cs and
identify the Cs in real-life examples, as well as provide youth with opportunities to practice self-
reflection. Similar to goal management, the Cs were assessed using a rubric. It may be difficult
to capture individual differences with this measure. For example, “Connection” has poor
reliability at Time 2 (see Appendix A); this could help explain the lack of findings for this
measure. See the Future Directions for more information regarding this rubric.
25% of youth increased their thriving on one or more indicators at least ¼ of a standard deviation.
d=-.04 Youth show off posters of Thriving messages.

24 | P a g e
The goal: To test whether youth experiences with 4-H Thrive!
leads to improved adjustment outcomes.
The challenges: Adjustment outcomes likely take a longer
time to impact than the program components that are being
directly taught, so changes may take longer to find.
The result: Youth, on average, did not show change in
adjustment outcomes.
Future directions: We will continue to monitor these general
adjustment outcomes to see whether greater change can be
found after longer exposure to 4-H Thrive!. In addition we will
test for changes on other outcomes, such as academic
performance, science literacy, healthy living, and citizenship.
2.32 2.29
1.64
2.00
2.36
2.72
Stre
ss S
amp
le M
ean
Pre-Thrive Post-Thrive
1.64 1.67
1.00
1.28
1.56
1.84
De
pre
ssio
n S
amp
le M
ean
)
Pre-Thrive Post-Thrive
4.33 4.34
3.68
4.00
4.32
4.64
Self
Est
ee
m S
amp
le M
ean
Pre-Thrive Post-Thrive
33% of youth showed improved adjustment outcomes
at least ¼ of a standard deviation.
Note: Scale is ½ standard deviation. Error bars are
2*standard error of the mean. N= 151.
Note: Scale is ½ standard deviation. Error bars are
2*standard error of the mean. N= 150.
Note: Scale is ½ standard deviation. Error bars are
2*standard error of the mean. N= 141.
d=.06
d=.02
d=-.04
d=.02
ADJUSTMENT OUTCOMES

25 | P a g e
ANNUAL REORT FROM CA 4-H YDP 2010 - 2012
To answer this question, we conducted regressions with residual change in each component as
an outcome and residual change in each other program component as the predictor. The residual
change scores were calculated by saving the residual from a regression analysis in which the Time
2 score was predicted by the Time 1 score. We then used regression analyses to see if change in
one program component predicted change in other program components.
We found that increases in youth’s feelings that 4-H helped them find their spark was related
to increases in character (β=.35, p<.05). Additionally, increases in youth’s feelings that 4-H
helped them get better at their spark was associated with increases in overall thriving (β=.24,
p<.05), and more specifically, character (β=.31, p<.05). We also found that youth who increased
in growth mindset showed increases in overall thriving (β=.23, p<.05). Youth with increased goal
management also showed
increases in overall thriving
(β=.49, p<.05). Specifically,
goal management was related
to increases in character
(β=.42, p<.05), competence
(β=.28, p<.05), confidence
(β=.43, p<.05), and
contribution (β=.49, p<.05).
To answer this question, we used the same regression analyses as above (change scores were
calculated by saving the residual from a regression analysis in which the Time 2 score was
predicted by the Time 1 score).
Here we found that increases in
connection were related to
decreases in stress (β=-.27, p<.05).
Preliminary results using a portion of
Time 3 data shows that a second
measure of thriving (Arnold, Nott, &
Meinhold, 2012) and goal
management (Freund & Baltes, 2002;
DO YOUTH WHO INCREASE IN ONE PROGRAM COMPONENT ALSO
INCREASE IN OTHER PROGRAM COMPONENTS?
DO YOUTH WHO INCREASE IN PROGRAM COMPONENTS ALSO
INCREASE IN ADJUSTMENT OUTCOMES?

26 | P a g e
ANNUAL REORT FROM CA 4-H YDP 2010 - 2012
Gestsdóttir & Lerner, 2007; Zimmerman, Phelps, & Lerner, 2007) to be related to adjustment
outcomes as well. Specifically increases in character (β=-.32, p<.05), connection (β=-.32, p<.05),
competence (β=-.36, p<.05), and confidence (β=-.38, p<.05), and goal management (β=-.35,
p<.05) were related to decreases in stress; and increases in confidence were related to increases
in self-esteem (β=.30, p<.05). However, the reliability of these findings is unknown, as only 56
youth have longitudinal data using these measures. More data using these measures will be
available next year.
SUMMING IT UP
We find that youth enjoyed the program and found it to be beneficial and
meaningful.
In general, we see increases in goal management, decreases in sparks and
thriving, and no change in mindset.
We see that increases in one program component is related to increases
in other components.
We see that increases in program components are related to better
adjustment outcomes.
Take away message: the program is showing effects on positive youth
development and we can have identified areas to focus on for the future.
“Do it. It’s fun and you learn more about your spark, and being safe
in the environment and reaching your goals, and being with people
who are positive and not negative.”

27 | P a g e
ANNUAL REORT FROM CA 4-H YDP 2010 - 2012
Project leaders are a crucial component of implementing the 4-H YDP. Perceptions about
their ability to lead the program and work with youth can impact how they deliver the program
and influence youth outcomes. 4-H has made project leader training a key component of the
4-H Thrive! program. Taking information from the project leader and youth surveys, we found
that project leader characteristics influence youth outcomes.
Listening to project leaders What did project leaders enjoy most about leading 4-H Thrive!?
Project leaders were interviewed about their experiences leading 4-H Thrive!. Their
answers to the question “What do you enjoy most about the curriculum?” are shown below in
a word cloud displaying the most frequently used words. Words in larger font were mentioned
more often than words in smaller font. The most common word was “youth”, something all
project leaders have in common – a passion for working with youth. Similar to the youth word
cloud, there are several interactive words, such as “learning,” “activities,” and “hands-on.”
Below the word cloud are a few example responses to this question as well.
ROLE OF PROJECT LEADERS

28 | P a g e
ANNUAL REORT FROM CA 4-H YDP 2010 - 2012
Would project leaders recommend 4-H Thrive! to others?
Fourteen project leaders were interviewed via telephone about their experience leading 4-H
Thrive!. When asked “Would you tell other adults that they should volunteer to be a project
leader for 4-H Thrive!?” 93% of 4-H Thrive! leaders said yes. Below are some example responses:
“Yes I definitely would because it’s a good program with good bones and good
intentions.”
“I do tell other adults that they should because it’s a good program and a worthwhile
topic, and something that our organization needs.”
“I would and I have because it’s a great opportunity to have an impact on our young
leaders.”
When asked “Would you lead 4-H Thrive! again?”, fifty-seven percent said they would. The
biggest roadblock to leading the program was time and youth scheduling conflicts. Some leaders
were also interested in leading 4-H Thrive!, but for a younger age group. These leaders expressed
interest in leading iGrow, designed for 9-12-year-olds, rolling out in 4-H clubs in Fall 2014.
What do you
enjoy most about
the curriculum?
“I enjoy working with the kids and
listening to what they have to say
and their input and interpretations
of the curriculum.”
“[4-H Thrive!] gives kids a place to
explore their interests in a way
that they are unable to do at
school. It provides supportive
peers and interested adults. It
provides the scaffolding that kids
need for optimal development.“

29 | P a g e
ANNUAL REORT FROM CA 4-H YDP 2010 - 2012
Testing project leader impacts Do project leader characteristics influence youth’s outcomes?
To answer this question,
we used the residual change
scores described earlier.
Using regression analyses
we examined whether Time
1 project leader
characteristic scores were
related to change scores in
youth program components
and adjustment outcomes.
We found that when
project leaders have greater
program buy-in and skills at
Time 1, youth show increases in
feeling that 4-H helped them
find their spark (buy-in β=.25,
p<.05; skills β=.21, p<.05) and
develop their spark (buy-in
β=.22, p<.05; skills β=.21,
p<.05). This is a particularly
important finding given that,
overall, youth did not report
increases in these critical
aspects of sparks. If we can
increase the number of
volunteers who buy-in to the
program and feel confident in
their skills, then we will be
more likely to be able to detect
changes in sparks. Additionally,
greater volunteer skills were
related to increases in goal management (β=.31, p<.05) and thriving (β=.31, p<.05). These
findings provide valuable information that can be used to improve training and as a result
increase youth outcomes. We believe that the findings presented in this report can be used to
help increase buy-in of the project leaders.
Do project leaders become better Spark
Champions, as reported by youth?
Yes! At Time 1, 55.4% of youth said that
they have a Spark Champion in 4-H. At
Time 2, this increased to 90.8%!

30 | P a g e
ANNUAL REORT FROM CA 4-H YDP 2010 - 2012
Programmatic Future Directions Below are ways we are monitoring program delivery and collecting qualitative and
quantitative data that can be used to make revisions to the curriculum, training, and
implementation of 4-H Thrive!.
Monitor Implementation
We will review videos of project meetings that have been collected and find exemplars to
use for training. For example, the videos will be coded for: (1) areas of the curriculum project
leaders struggle with the most, as well as are most proficient; (2) youth participating and
engagement; (3) youth and volunteer interactions; and (4) which portions of the curriculum
were adhered to the most. These videos will be used to understand how the 4-H Thrive!
messages are being delivered, areas of confusion or misinformation, and how the youth are
responding to program involvement, all of which can be used to inform future trainings. In
addition, in the randomized-controlled trials videos and surveys from the adults and youth in
the videos are being collected. The videos will be coded for all of the above and used to test
whether higher quality delivery and engagement is related to increased changes in the
program components.
SUMMING IT UP
Project leaders enjoyed delivering the program and enjoyed
watching youth develop through program involvement.
Project leaders would lead 4-H Thrive! again and recommend that
other adults lead it as well.
Enthused and confident project leaders help youth experience
greater positive development outcomes.
Take away message: Project leaders, their buy-in and skills, are
crucial to youth development.
FUTURE DIRECTIONS

31 | P a g e
ANNUAL REORT FROM CA 4-H YDP 2010 - 2012
We are also
collecting fidelity data
from project leaders. At
the end of each lesson,
project leaders are asked
to send in a pre-
addressed, pre-stamped
postcard with
information about the
lesson. This information
includes names of those
present, which parts of
the lesson were
completed at the
meeting, at home, or not
completed, and whether there were any modifications made. Fidelity cards were added to
the curriculum in 2013. Currently we are collecting youth data so that we test whether higher
fidelity is related to greater pre-/post-program changes for youth. These data will be available
for analysis in 2014. Below we summarize what we know about program delivery based on
the fidelity cards collected up to this point.
We have collected fidelity information from 33 4-H Thrive! clubs. Fidelity was coded for
level of implementation. Each lesson consisted of three sections: iexplore (a hands on shared
experience about the topic), ireflect (internalize and personalize what is learned), and
istretch (apply what is learned by watching a short video and completing an activity
between meetings). Project leaders reported, for each section, whether they did not
complete the task (coded as 0), completed part of the task (coded as 1), or completed all of
the task (coded as 2). Using these codes, we calculated a mean score for each task within a
lesson. Mean scores of each section by lesson are presented in Table 1. Overall, we see:
“Connections”, “Light Your Spark,” and “Flex Your Brain” lessons have the highest
fidelity.
The “Reach Your Goals B” lesson, in which youth learned about pursuit of
strategies and shifting gears, has the lowest fidelity across the three sections .
Fidelity tended to be highest for iexplore, lowest for istretch, and in between for
ireflect.

32 | P a g e
ANNUAL REORT FROM CA 4-H YDP 2010 - 2012
Overall, fidelity was high for iexplore. The lower fidelity for the 2nd part of the goal
management lesson might be a result of the two lessons being delivered during one longer
project meeting instead of across two meetings. It might have been difficult to keep youth’s
attention and complete all parts of the lesson when attempted as one long meeting. Similarly,
we see higher fidelity for iexplore, the 1st part of the lesson, and lowest fidelity for istretch, the
last part of the lesson. This could be because of time constraints, or perhaps project leaders do
not feel that they are equipped to help youth take the lesson to the next level with the concept,
and instead skip it or tell youth to complete this portion at home. The fidelity for iexplore lessons
related to the 6 Cs (“Connections”, “Am I Thriving Now”) have the highest fidelity. When we have
more fidelity data we can test whether lessons with higher fidelity show the greatest change. We
predict this would be the case because youth will likely have a deeper understanding of lessons
with higher fidelity and will likely have more time to explore related thoughts and feelings. In the
future we will solicit feedback from project leaders related to why they are not completing some
of the lessons to help us better understand the impact of fidelity and interpret our findings.
Table 1. Means for each lesson section.
Mean
Lesson N iexplore ireflect istretch
Safety 22 1.82 1.82 1.55
Connections 31 2.00 1.82 1.81
Sparks 29 1.93 1.93 1.59
Reach Your Goals A 25 1.96 1.84 0.12
Reach Your Goals B 17 1.76 1.65 0.94
Flex Your Brain 19 1.90 1.90 1.70
Am I Thriving Now (The 6 Cs) 18 2.00 1.89 1.28
Celebrate! 16 1.81 1.69 -- Note: Range = 0 -2. There was no istretch for the “Celebrate!” lesson.
Another way to examine the fidelity data is to look at the percent of clubs that completed
none, some, or all of each lesson. Table 2 shows that fidelity was generally higher in the earlier
lessons, and lessons 4 (Reach Your Goals A) and 5 (Reach Your Goals B) had the lowest fidelity.
This information can assist us in reformatting the lessons or facilitation guidelines for project
leaders. Again, it is important for us to gather more qualitative data to assess why some lessons
have lower fidelity and test whether the lower fidelity is related to less change in program
components.

33 | P a g e
ANNUAL REORT FROM CA 4-H YDP 2010 - 2012
Table 2. Lesson Fidelity
% of responses
Lesson N None Some All Mean
Safety 22 9.1 24.3 66.7 1.73
Connections 31 0.0 29.0 71.0 1.88
Sparks 29 0.0 37.9 62.1 1.82
Reach Your Goals A 25 0.0 96.0 4.0 1.31
Reach Your Goals B 17 0.0 70.6 29.4 1.45
Flex Your Brain 19 0.0 26.4 73.7 1.84
Am I Thriving Now (The 6 Cs) 18 0.0 55.6 44.4 1.72
Celebrate! 16 6.3 93.8 0.0 1.17 Note: “None” indicates the project did not complete the lesson, “Some” indicates the project
did some of the lesson, and “All” indicates that the project reported completing all parts of the
lesson.
Finally, from these fidelity cards we will be able to assess dosage, or how much of the
program a youth receives. We currently do not know what intensity, frequency, or duration of
the content is ideal for youth to show increases in the components and outcomes. Gathering
information about the number of lessons a youth receives, combined with the fidelity of that
lesson, can help inform us about the ideal dosage for youth to get optimal results from program
participation.
Revise training as needed
After reviewing the project videos, fidelity cards, and interviews of youth and project
leaders the 4-H Leadership Team will adjust training to strengthen understanding and
delivery of key messages.
Revise curriculum as needed
Feedback is being sought from
youth, youth and adult project leaders,
and staff regarding what worked well
and what difficulties arose with the
curriculum. Through this feedback, 4-H
and the Thrive Foundation for Youth can
gain insight into the positive attributes and the challenges of the Thrive curriculum. The 4-H
Thrive! Leadership Team will then work with the Thrive Foundation for Youth to adjust
curriculum or content as necessary. One way we have already begun to do this is through the

34 | P a g e
ANNUAL REORT FROM CA 4-H YDP 2010 - 2012
youth and project leader interviews (see Results). We asked youth and project leaders to
provide feedback on the 4-H Thrive! curriculum, what they liked, what they thought could be
improved, and what they would tell others about the program. This information will be used
to inform future versions of the curriculum and to help us understand how we can better
support our project leaders in their 4-H Thrive! efforts.
Increase outreach and awareness
The 4-H Thrive! Leadership Team has introduced incentives for youth to complete
surveys within the Online
Record Book (ORB), such as
entering youth names into
drawings to win gift cards or
iPad minis. In addition,
statewide staff are continuing
to promote the ORB through
e-mail announcements,
newsletters, and during
workshops and conferences.
The 4-H Thrive! Leadership
Team will continue to
strategize methods to
increase youth participation
in the ORB and completing
Thrive surveys. Further, the
Leadership Team is working to
develop fact sheets for county
directors, project leaders and
youth (as well as potential
project leaders and youth) to inform these populations about what 4-H Thrive! is, the impacts
of the program, and how they can get involved.
Looking ahead to Time 3
4-H Thrive! youth have made gains, but greater gains are expected over time. That is, greater
behavioral changes are expected to occur over time as youth explore, practice, and grow in
the Thrive Theory of Change. Child and youth development does not necessarily occur in a
linear fashion (Siegler, Adolph, & Lemaire, 1996), which means that youth are likely to
become more aware of and internalize specific ways of thinking and continue to experience

35 | P a g e
ANNUAL REORT FROM CA 4-H YDP 2010 - 2012
growth across different aspects of their life over time. Therefore greater changes are likely
to be found using Time 3 data.
Years 4 and 5 Implementations Expanding the curriculum
Years 1, 2 and 3 provided many opportunities for 4-H to learn and grow. We are pleased
to be able to provide this initial evaluation of Step-Up-2-Thrive, as delivered through the 4-H
club program. Years 4 and 5 have several exciting additions to the 4-H Thrive! program. One of
these additions is the curriculum focus on Science, Engineering, and Technology (SET) in Year 4.
The goals of this focus are to:
help cultivate positive attitudes and aspirations towards SET,
improve youth engagement in SET,
provide opportunities for youth to develop SET-related skills, and
help you apply their SET learning in their community.
This curriculum is more applied and hands-on than previous years, and has generated
excitement from both youth and project leaders. In Year 5, the curriculum will focus on healthy
living. The goals of this curriculum are to:
help youth increase their physical and emotional health,
decrease risky behaviors, and
have more positive relationships and an increased social network.
We have embedded SET and healthy living lessons into the 4-H Thrive! curriculum because
we believe that this content will be more effective in producing desired outcomes when
delivered within a positive youth development framework. For example, our society is not
producing enough new scientists and there are many new, and old, programs designed to help
make science fun and exciting to youth. We believe that fun messages alone are not sufficient
to engage youth. Youth who feel they are not able to learn science, feel science is not related
to their spark, and are not able to set and accomplish goals for science-related tasks are
Benefits to the Thrive Foundation for Youth
Feedback on the best practices for delivering Step-Up-2-
Thrive concepts in group settings.
Feedback on the best practices for training adults to
effectively deliver Step-Up-2-Thrive concepts.

36 | P a g e
ANNUAL REORT FROM CA 4-H YDP 2010 - 2012
unlikely to benefit from interventions that tell them science is fun and important. We believe
that through SET curriculum combined with 4-H Thrive! we can have a greater impact then
either curriculum alone. Similarly, our society is suffering from a lack of healthy living styles
and programs aimed at changing behavior seem to have limited success. We believe that
helping youth develop sparks related to healthy living, set and achieve healthy living goals, and
understand that they can change their behavior will have greater impact than current programs
that do not include these positive youth development messages.
A randomized-controlled study
In Year 4, we are implementing a randomized-controlled trial (RCT) in afterschool
programs in four counties. Half of the programs are randomly assigned to Step Up to Leadership,
a national 4-H leadership curriculum, and half of the programs will deliver iGrow, a version of 4-
H Thrive! designed for youth ages 9-12 years. This RCT offers several benefits to examining the
effects of 4-H Thrive! on youth outcomes. The RCT allows us to control for selection effects,
meaning that differences we find between Step Up to Leadership and iGrow can be attributed to
program participation. In addition, the afterschool sample is diverse and provides us with the
opportunity to examine the effects of 4-H Thrive! outside of the 4-H population represented in
the club program and in a different delivery mode with youth are not participating in 4-H.
Through these deliveries we will be able to answer critical questions regarding the
potential of Step-Up-2-Thrive and 4-H Thrive! to positively impact youth. Specific questions that
will be addressed with data from Years 4 and 5 are:
1. Are youth who receive iGrow more able to identify a spark than youth who receive Step
Up to Leadership?
2. Do youth who receive iGrow have more of a growth mindset than youth who receive Step
Up to Leadership?
3. Do youth who receive iGrow have better goal management skills than youth who receive
Step Up to Leadership?
4. Do youth who receive iGrow have better adjustment outcomes compared to youth who
receive Step Up to Leadership?
5. Does participation in 4-H Thrive! increase youth’s interest, engagement, and confidence
in SET?
6. Does participation in 4-H Thrive! increase youth’s health knowledge and behaviors?

37 | P a g e
ANNUAL REORT FROM CA 4-H YDP 2010 - 2012
Using Data to Help Develop a Model of Thriving
The California 4-H Youth Development Program has contributed new curriculum and
activities and initial data, and we will contribute valuable randomized-controlled trial data. These
contributions can be helpful for recruiting and establishing new partnerships and demonstrating
worth to key stakeholders. These are important and California 4-H is committed to continuing to
provide these services. In addition, we feel that we can contribute to moving the field of positive
youth development forward. For example, we can contribute to building upon current models of
thriving by providing insights from patterns in data, helping translate theoretical models into
testable models, and testing competing models. Below we provide some examples of what we
have learned from our initial data.
In addition to the challenges discussed above, we will discuss a few broader issues and
suggestions related to helping us develop and inform a theory-driven, testable model. These
suggestions are broadly divided into “measurement” and “analyses.” We provide examples and
future steps for these issues.
Measurement
The challenge: One challenge we found in testing the effects of 4-H Thrive! was measurement,
particularly in relation to sparks. In developing our change model we struggled with capturing
meaningful changes in sparks. Our first suggestion in testing theoretical models of thriving is to
reflect on the constructs theorized to play a role in thriving and ensure that the measures being
used assess individual differences in that construct. To understand processes of development we
need to have reliable and valid measures that capture a range of individual differences.
Benefits to the Thrive Foundation for Youth
A randomized-controlled trial is the gold standard for program
evaluation and will allow for definite, causal conclusions about the
impact of Step-Up-2-Thrive on youth outcomes.
The Science, Engineering, and Technology focus and Healthy Living
focus will demonstrate the impact of Step-Up-2-Thrive on other
socially important outcomes, such as science ability, interest,
engagement, and confidence and knowledge of healthy behaviors.

38 | P a g e
ANNUAL REORT FROM CA 4-H YDP 2010 - 2012
Example: The concept of sparks makes sense in the theoretical model, but the current measure
and conceptualization of “sparks” might not be tapping into the intended construct put forth by
the Thrive Foundation for Youth. We found it challenging to identify change in sparks because
the primary variable is essentially a yes-no question regarding whether the youth has a spark.
Moving from no spark to having a spark may represent critical growth, but it might miss the
feelings and beliefs youth go through during this transition. In addition, it equates youth who
might have critical differences. For example, Youth A might answer yes to having a spark and say
her spark is music because it is fun to listen to music, whereas Youth B might answer yes and say
she has a spark and it is music because producing music makes her feel vibrant and alive and she
especially loves using music to make others feel good. The existing spark measures cannot
differentiate between these two youth. And, consistent with this, we found few effects related
to change in the sparks variable.
We propose that a measure of passion would capture the essence of having a spark while
also providing a way to capture individual differences in the core spark construct, and change in
these individual differences. Having a spark is the fuel for youth change in goal management,
mindset, and thriving, but the current measure of sparks might not capture individual differences
in this fuelling role. In examining the research on passion we found that Vallerand et al. (2003)
define a passion as a “strong inclination toward an activity that people like, that they find
important, and in which they invest time and energy”, and explain that passion activities get
people to wake up in the morning, fuel motivation and give meaning to peoples’ everyday lives.
These definitions are remarkably similar to the ones we provide youth for describing what is a
spark when they are unfamiliar with the term. Measuring passion in youth can potentially provide
us with more power to detect individual differences and show, through data, the potentially
powerful role of sparks (conceptualized as passion) on the Theory of Change.
Another measurement issue to consider is that Years 1-3 utilized rubrics to assess goal
management and the 6 Cs. These rubrics can be difficult to understand and use. Examination of
the GPS measure showed that, when broken down by the three components, the largest increase
was for “G” (goal setting; effect size of Time 1 to Time 2 difference = .20). This is not surprising
given that the rubric for “goal setting” is the easiest concept for youth to understand. And, the
lack of change for pursuit of strategies and shifting gears might be due to trouble understanding
and using the rubric. In Year 3, we added another measure of both goal management (Freund &
Baltes, 2002; Gestsdóttir & Lerner, 2007; Zimmerman et al., 2007) and the 6 Cs (Arnold, Nott, &
Meinhold, 2012). Analyses are currently being conducted to examine programmatic effects on
these measures.

39 | P a g e
ANNUAL REORT FROM CA 4-H YDP 2010 - 2012
Another issue related to appropriate measurement is establishing measurement
invariance (Bryne, 2012) between groups or over time. Measurement invariance indicates that
the underlying construct being measured is the same across time and groups (e.g., age, gender).
This is critical if comparisons are made because it demonstrates that the same construct is being
measured over time and across groups. We are currently examining our measures for invariance.
For example, preliminary analyses show that our measure of mindset holds strong (or scalar)
invariance across Time 1 and Time 2, indicating that the measure is tapping into the same
construct over time. These findings support the use of this measure longitudinally.
What we’ve learned and where to go from here: What we have learned to date in our evaluation
process is that the current measure we are using for sparks is not capturing individual differences,
thus creating a gap between the theoretical and testable models. We recommend using
measures of passion in future data collections. Additionally, we recommend using other
measures of goal management and thriving. Further, measurement invariance analyses with
more data points and with all measures should be conducted to establish that all our measures
are appropriate for longitudinal use.
Analyses
The challenge: Our second suggestion related to testing models of thriving is to test longitudinal
relations to estimate the order of impact of the components of thriving (e.g., using cross-lagged
analyses). Determining the order of impact will help us to understand the relationship between
variables: How they work together and which variable may lead to changes in another variable.
These findings would provide a better understanding of how the program components interact,
and would help us learn whether we need to teach youth about these components in a particular
order. Ultimately, these analyses can help us refine the model of thriving.
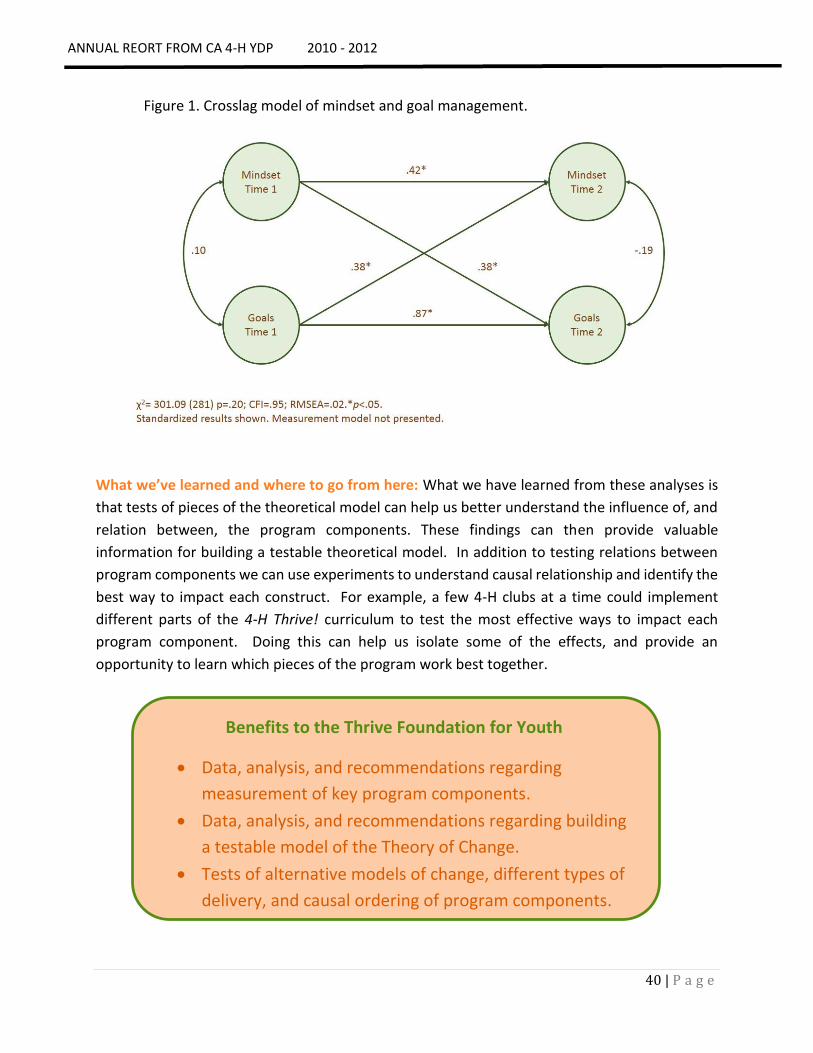
Example: Currently, we have some preliminary findings regarding order effects. For example,
mindset and goal management skills showed a reciprocal relationship, such that mindset at Time
1 was related to increases in goal management at Time 2, and goal management at Time 1 was
related to increases in growth mindset at Time 2 (see Figure 1). This suggests that fostering a
growth mindset might help to also foster better goal management skills and vice versa. This
reciprocal relationship informs us that given the influential nature of these concepts on one
another there might be an advantage to explicitly linking these lessons. It also suggests that a
theory of change might include this reciprocal relation. However, these findings are preliminary
and only provided for illustration. More data is needed before strong conclusions can be made.
40 | P a g e
ANNUAL REORT FROM CA 4-H YDP 2010 - 2012
Figure 1. Crosslag model of mindset and goal management.
What we’ve learned and where to go from here: What we have learned from these analyses is
that tests of pieces of the theoretical model can help us better understand the influence of, and
relation between, the program components. These findings can then provide valuable
information for building a testable theoretical model. In addition to testing relations between
program components we can use experiments to understand causal relationship and identify the
best way to impact each construct. For example, a few 4-H clubs at a time could implement
different parts of the 4-H Thrive! curriculum to test the most effective ways to impact each
program component. Doing this can help us isolate some of the effects, and provide an
opportunity to learn which pieces of the program work best together.
Benefits to the Thrive Foundation for Youth
Data, analysis, and recommendations regarding
measurement of key program components.
Data, analysis, and recommendations regarding building
a testable model of the Theory of Change.
Tests of alternative models of change, different types of
delivery, and causal ordering of program components.

41 | P a g e
ANNUAL REORT FROM CA 4-H YDP 2010 - 2012
These future directions will improve the integration of Thrive programming into 4-H, and
facilitate project leaders’ awareness of Thrive as a natural component of 4-H rather than a distinct
program or project to implement. We believe that the more project leaders deliver a consistent,
and fully integrated, 4-H Thrive! program the more gains that youth will show in measures of
Thriving.
Additionally, these findings help contribute to the body of knowledge about the theory of
change and how the various program components are related to each other and key adjustment
outcomes. More work is needed in this area and California 4-H looks forward to continuing to
work with the Thrive Foundation for Youth and other key partners to conduct research to better
understand the process of thriving with the goal of developing a testable model, and ultimately
providing best practices for helping youth thrive.
CONCLUSION

42 | P a g e
ANNUAL REORT FROM CA 4-H YDP 2010 - 2012
References
Arnold, M. E., Nott, B. D., & Meinhold, J. L. (2012). The Positive Youth Development Inventory (Revised). Oregon State University.
Benson, P. L., & C. Scales, P. (2009). The definition and preliminary measurement of thriving in adolescence. The Journal of Positive Psychology, 4, 85-104.
Byrne, B. M. (2012). Structural equation modeling with Mplus: Basic concepts, applications and programming. New York, NY: Taylor & Francis.
Dweck, C. S., & Leggett, E. L. (1988). A social-cognitive approach to motivation and personality.
Psychological review, 95, 256.
Freund, A. M., & Baltes, P. B. (2002). Life-management strategies of selection, optimization and
compensation: Measurement by self-report and construct validity. 82, 642-662. doi:
10.1037/0022-3514.82.4.642
Gestsdóttir, S., & Lerner, R. M. (2007). Intentional self-regulation and positive youth development in early adolescence: findings from the 4-h study of positive youth development. Developmental psychology, 43, 508.
Gestsdottir, S., & Lerner, R.M. (2008). Positive development in adolescence: The development and role
of intentional self-regulation. Human Development, 51, 202-224.
Kolb, D. A., Boyatzis, R. E., & Mainemelis, C. (2001). Experiential learning theory: Previous research and new directions. Perspectives on thinking, learning, and cognitive styles, 1, 227-247.
Lerner, R. M., Almerigi, J. B., Theokas, C., & Lerner, J. V. (2005). Positive youth development: A view of
the issues. Journal of Early Adolescence, 25, 10-16.
Lerner, R. M., Lerner, J. V., Lewin-Bizan, S., Bowers, E. P., Boyd, M. J., & Mueller, K. (2011). Positive youth
development: Processes, programs, and problematics. Journal of Youth Development, 6, 41-64.
Roth, J. L., & Brooks-Gunn, J. (2003a). What exactly is a youth development program? Answers from
research and practice. Applied Developmental Science, 7, 94-111.
Roth, J. L., & Brooks-Gunn, J. (2003b). Youth development programs: Risk, prevention, and policy.
Journal of Adolescent Health, 32, 170-182.
Siegler, R. S., Adolph, K. E., & Lemaire, P. (1996). Strategy choices across the lifespan. In L. R. Reder (Ed.),
Implicit memory and metacognition (pp. 79-121). Mahwah, NJ: Erlbaum.
Vallerand, R. J., Blanchard, C., Mageau, G. A., Koestner, R., Ratelle, C., Léonard, M., ... & Marsolais, J. (2003). Les passions de l'ame: on obsessive and harmonious passion. Journal of personality and social psychology, 85, 756.
Zimmerman, B. J. (2002). Becoming a self-regulated learner: An overview. Theory into Practice, 41, 64-
70.
Zimmerman, S. M., Phelps, E., & Lerner, R. M. (2007). Intentional self-regulation in early adolescence: Assessing the structure of selection, optimization, and compensation processes. International Journal of Developmental Science, 1, 272-299.

43 | P a g e
ANNUAL REORT FROM CA 4-H YDP 2010 - 2012
Appendix A-Measures Information
Sparks (Benson, 2008) Time 1 Time 2
Response options: 3= Definitely!, 2= I think so, 1= No. % “Definitely” % “I think so” % “Definitely” % “I think so”
1. Do you have a spark? 77.6 22.4 74.5 18.5
Response options: 2=Yes, 1=No. % “Yes” % “Yes”
1. Do you have a caring adult or peer who helps you explore and develop your spark in 4-H?
57.3 91.8
Response options: 5=A lot, 4=Quite A Bit, 3=Somewhat, 2=A Little Bit, 1=Not At All. Mean (SD) Alpha Mean (SD) Alpha
1. 4-H helped me find my spark(s). 3.26 (1.22) -- 3.09 (1.34) -- 2. 4-H program helped me get better at my spark. 3.32 (1.20) -- 3.26 (1.27) -- Response options: 5=Very Often, 4=Often, 3=Sometimes, 2=Rarely, 1=Never Mean (SD) Alpha Mean (SD) Alpha
3. In 4-H, how often do you work to get better at your spark(s)? 3.36 (1.01) -- 3.23 (1.14) --
Note: Items were analyzed individually.
Mindset (Blackwell, Trzesniewski, & Dweck, 2007) Time 1 Time 2
Response options: 5=Strongly Agree, 4=Agree, 3=Neither Agree nor Disagree, 2=Disagree, 1=Strongly Disagree. Mean (SD) Alpha Mean (SD) Alpha
1. You can learn new things but you can’t really change your basic intelligence
2. You have a certain amount of intelligence and you really can’t do much to change it.
3. You can always greatly change how intelligent you are. 4. No matter how much intelligence you have, you can always
change it quite a bit.
3.97 (.63) .76 3.91 (.74) .78
Note: An average of these items was created such that higher scores indicated more of a growth mindset.

44 | P a g e
ANNUAL REORT FROM CA 4-H YDP 2010 - 2012
Goal Management Skills (Bowers, 2011) Time 1 Time 2
Response options: 5=I work on this all the time and I’m excellent at it, 4=About half the time, I show initiative and skill at this, 3=I really want to get better at this, and I need my mentor’s help, 2=I don’t think this is important, but I’ll try if my mentor makes me, 1=I don’t do this. Mean (SD) Alpha Mean (SD) Alpha
1. Rate yourself on "choosing your destination” 2. Rate yourself on "choosing goals that help other/community" 3. Rate yourself on "breaking down long term goals" 4. Rate yourself on "identifying relations among goals" 5. Rate yourself on "sticking to a plan" 6. Rate yourself on "seizing the moment" 7. Rate yourself on "developing strategies" 8. Rate yourself on "showing persistent effort" 9. Rate yourself on "checking your progress" 10. Rate yourself on "substituting strategies” 11. Rate yourself on "seeking different help" 12. Rate yourself on "emulating strategies of others" 13. Rate yourself on "changing goals without feeling bad"
4.20 (.57) .87 4.27(.69) .91
Note: An average of these items was created such that higher scores indicated more of goal management skills.

45 | P a g e
ANNUAL REORT FROM CA 4-H YDP 2010 - 2012
Thriving (Bowers, 2011)
Response options: 5=I work on this all the time and I’m excellent at it, 4=About half the time, I show initiative and skill at this, 3=I really want to get better at this, and I need my mentor’s help, 2=I don’t think this is important, but I’ll try if my mentor makes me, 1=I don’t do this.
Time 1 Time 2
COMPETENCE (5 items) Mean (SD) Alpha Mean (SD) Alpha
1. Rate your academic competence. 2. Rate your cognitive competence. 3. Rate your social competence. 4. Rate your emotional competence. 5. Rate your healthy habits.
4.40 (.50) .68 4.48 (.48) .69
CHARACTER (3 items) Mean (SD) Alpha Mean (SD) Alpha
6. Rate your moral compass. 7. Rate your integrity. 8. Rate your equal treatment of others.
4.62 (.38) .45 4.57 (.45) .48
CONNECTION (3 items) Mean (SD) Alpha Mean (SD) Alpha
9. Rate your connection with family. 10. Rate your connection with friends & peer groups. 11. Rate your connection with community.
4.46 (.56) .64 4.42 (.48) .26
CARING (4 items) Mean (SD) Alpha Mean (SD) Alpha
12. Rate your sympathy. 13. Rate your empathy. 14. Rate your caring actions. 15. Rate your promoting of social justice.
4.26 (.68) .75 4.27 (.64) .75
CONFIDENCE (5 items) Mean (SD) Alpha Mean (SD) Alpha

46 | P a g e
ANNUAL REORT FROM CA 4-H YDP 2010 - 2012
16. Rate your overall confidence. 17. Rate your confidence in school. 18. Rate your confidence in physical appearance. 19. Rate your confidence in peer acceptance. 20. Rate your confidence in an area of interest.
4.45 (.55) .77 4.58 (.43) .66
CONTRIBUTION (4 items) Mean (SD) Alpha Mean (SD) Alpha
21. Rate your service to community. 22. Rate your leadership roles. 23. Rate your mentoring roles. 24. Rate your sense of positive purpose.
4.35 (.54) .68 4.45 (.51) .70
Thriving (24 items) Mean (SD) Alpha Mean (SD) Alpha
4.39 (.44) .85 4.45 (.41) .80
Note: Note: An average of the items for each C was created such that higher scores indicated more of that C. An overall thriving
score was created by averaging the scale scores of the 6 Cs; higher scores indicated more thriving.

47 | P a g e
ANNUAL REORT FROM CA 4-H YDP 2010 - 2012
Stress (Cohen, Kamarck, & Mermelstein, 1983) Time 1 Time 2
Response options: 5=Very Often, 4=Fairly Often, 3=Sometimes, 2=Almost Never, 1=Never. Mean (SD) Alpha Mean (SD) Alpha
1. In the last month, how often have you felt that you were unable to control the important things in your life?
2. In the last month, how often have you felt confident about your ability to handle your personal problems?
3. In the last month, how often have you felt that things were going your way?
4. In the last month, how often have you felt difficulties were piling up so high that you could not overcome them?
2.32 (.69) .64 2.29 (.76) .78
Note: Reverse code items 2 and 3. An average of these items was created such that higher scores indicated more stress.
Depression (Radloff, 1977) Time 1 Time 2
Response options: 4=Most or all of the time (5-7 days), 3=A lot of the time (3-4 days), 2=Some or a little of the time (1-2 days), 1=Rarely or none of the time (less than 1 day).
Mean (SD) Alpha Mean (SD) Alpha
1. During the past week, I was bothered by things that don’t usually bother me.
2. During the past week, I felt that I could not shake off the blues even with help from my family or friends.
3. During the past week, I had trouble keeping my mind on what I was doing.
4. During the past week, I felt that everything I did was an effort.
5. During the past week, I felt lonely.
1.64 (.53) .64 1.67 (.59) .73
Note: An average of these items was created such that higher scores indicated more depression.

48 | P a g e
ANNUAL REORT FROM CA 4-H YDP 2010 - 2012
Self-Esteem (Rosenberg, 1965) Time 1 Time 2
Response options: 5=Strongly Agree, 4=Agree, 3=Neither Agree nor Disagree, 2=Disagree, 1=Strongly Disagree
Mean (SD) Alpha Mean (SD) Alpha
1. I feel that I am a person of worth, at least equal to others. 2. I feel that I have a number of good qualities. 3. I feel I do not have much to be proud of. 4. All in all, I am inclined to feel that I am a failure.
4.33 (.60) .73 4.34 (.68) .85
Note: Reverse code items 3 and 4. An average of these items was created such that higher scores indicated more self-esteem.
Project Leader Buy-In (California 4-H) Time 1
Response options: 5=Strongly Agree, 4=Agree, 3=Neither Agree nor Disagree, 2=Disagree, 1=Strongly Disagree Mean (SD) Alpha
1. I was able to explain the underlying theory of 4-H Thrive to others
2. I believe 4-H Thrive was successful in helping youth achieve their full potential
3. 4-H Thrive was engaging for youth 4. I was able to teach 4-H Thrive well 5. 4-H Thrive fits with the values of the 4-H Youth Development
Program 6. I think 4-H Thrive is worthwhile 7. Leading 4-H Thrive was meaningful to me
4.01 (.67) .90
Note: An average of these items was created such that higher scores indicated more buy-in.

49 | P a g e
ANNUAL REORT FROM CA 4-H YDP 2010 - 2012
Project Leader Skills (Radhakrishna & Ewing, 2011) Time 1
Response options: 5=I am very good at this, 4=I am good at this, 3=I am average at this, 2=I am below average at this, 1=I am not good at this.
Mean (SD) Alpha
4.01 (.54) .86
1. Managing conflicts between youth 2. Listening to youth 3. Making sure I’m easy to approach when a youth has a problem 4. Helping youth to feel they are an important part of the 4-H
program. 5. Demonstrating activities that are designed to help youth learn
life skills, such as goal setting. 6. Encouraging youth to take on leadership roles 7. Conducting activities that are challenging to youth
4.01 (.54) .86
Note: An average of these items was created such that higher scores indicated more skill.
50 | P a g e
ANNUAL REORT FROM CA 4-H YDP 2010 - 2012
References for Appendix A:
Arnold, M. E., Nott, B. D., & Meinhold, J. L. (2012). The Positive Youth Development Inventory (Revised). Oregon State University.
Benson, P. L. (2008). Sparks: How parents can help ignite the hidden strengths of teenagers. San Francisco, CA: Jossey-Bass.
Blackwell, L., Trzesniewski, K., & Dweck, C. S. (2007). Implicit theories of intelligence predict achievement across an adolescent transition: A longitudinal study and an intervention. Child Development, 78, 246-263.
Bowers, E. (2011). The GPS Project: Developing rubrics and other tools for mentors and youth to enhance the development of intentional self-regulation and thriving. Medford, MA: Tufts University, Institute for Applied Research in Youth Development.
Cohen, S., Kamarck, T., & Mermelstein, R. (1983). A global measure of perceived stress. Journal of Health and Social Behavior, 24, 385-396.
Freund, A. M., & Baltes, P. B. (2002). Life-management strategies of selection, optimization and compensation: Measurement by self-report and construct validity. 82, 642-662. doi: 10.1037/0022-3514.82.4.642
Gestsdóttir, S., & Lerner, R. M. (2007). Intentional self-regulation and positive youth development in early adolescence: findings from the 4-h study of positive youth development. Developmental psychology, 43, 508.
Radhakrishna, R., & Ewing, J. C. (2011). Relationships between 4-H volunteer leader competencies and skills youth learn in 4-H programs. Journal of Extension, 49, 1-9.
Radloff, L. S. (1977). The CES-D scale a self-report depression scale for research in the general population. Applied psychological measurement, 1, 385-401.
Rosenberg, M. (1965). Society and the adolescent self-image. Princeton, NJ: University Press. Zimmerman, S. M., Phelps, E., & Lerner, R. M. (2007). Intentional self-regulation in early adolescence:
Assessing the structure of selection, optimization, and compensation processes. International Journal of Developmental Science, 1, 272-299.

The California 4-H Youth Development Program has partnered with the Thrive Foundation for Youth to develop a curriculum called 4-H Thrive!. The curriculum is designed to help youth identify and develop their spark or inner source of motivation, develop a mindset oriented toward learning and growth, self-reflect on the indicators of thriving (character, caring, competence, confidence, connection, and contribution), and improve their goal management skills. Previous research has demonstrated that youth who possess these skills are more likely to thrive and less likely to engage in risky behaviors. The program, being delivered across the state, includes the 4-H Thrive! curriculum and professional development for those implementing the curriculum. In addition, youth completed baseline and post-program measures of the key components of the program and measures of thriving and well-being, and project leaders completed measures on their buy-in of curriculum and skills as a volunteer.
The more youth felt that 4-H helped them find their spark the more they increased in character. And, the more youth felt that 4-H helped them get better at their spark the more they thrived. Other ways youth thrived was through increasing their growth mindset and goal management skills.
Thriving youth were also better adjusted: the more youth thrived the more their stress decreased and their self-esteem increased.
4-H Thrive! Facts
4-H Thrive! makes a difference!
35 c0unties have
implemented Thrive
curriculum
5,242 youth received Thrive messages during the 2010-11
and/or 2011-12 4-H year
529 adults received
curriculum-based leadership
training

Project leaders who believed more in the efficacy of the program and felt more skillful in working with youth had youth who increased in their belief that 4-H helped them find and develop their spark. And, the more volunteers felt skillful in working with youth the more youth developed goal management skills and thrived.
We will use these findings to improve training and volunteer buy-in, and in turn increase youth outcomes.
Project leaders make a difference!
What youth are saying about 4-H Thrive!
“Do it. It’s fun and you learn more about your spark, and being safe in the environment and reaching your goals, and
being with people who are positive and not negative.”
“It helps you find
goals for yourself,
and makes you a
better person.”
“The connections you establish with your group and the amount of
knowledge that you gain and the leadership that you get, and the self-
confidence that it makes in you overcomes any other project that I’ve
been in, any other leadership project in any aspect of my life, and it makes a stronger, more confident, better
leader.”


![THRIVE BROKERAGE BENEFIT - EasyEquitiesresources.easyequities.co.za/EasyEquities_THRIVE_Benefit... · 2020-05-04 · [THRIVE BROKERAGE BENEFIT ] THRIVE BROKERAGE BENEFIT | LAST UPDATED](https://img.pdfslide.us/doc/110x75/5f47a68b1c951a2c8e4d057e/thrive-brokerage-benefit-e-2020-05-04-thrive-brokerage-benefit-thrive-brokerage.jpg)