Embed Size (px)
Citation preview
4. Finance Performance DayDas Forum für aktuelle Finance-, Controlling- undBI-Themen6. April – Köln / 20. April – Stuttgart
Page 2
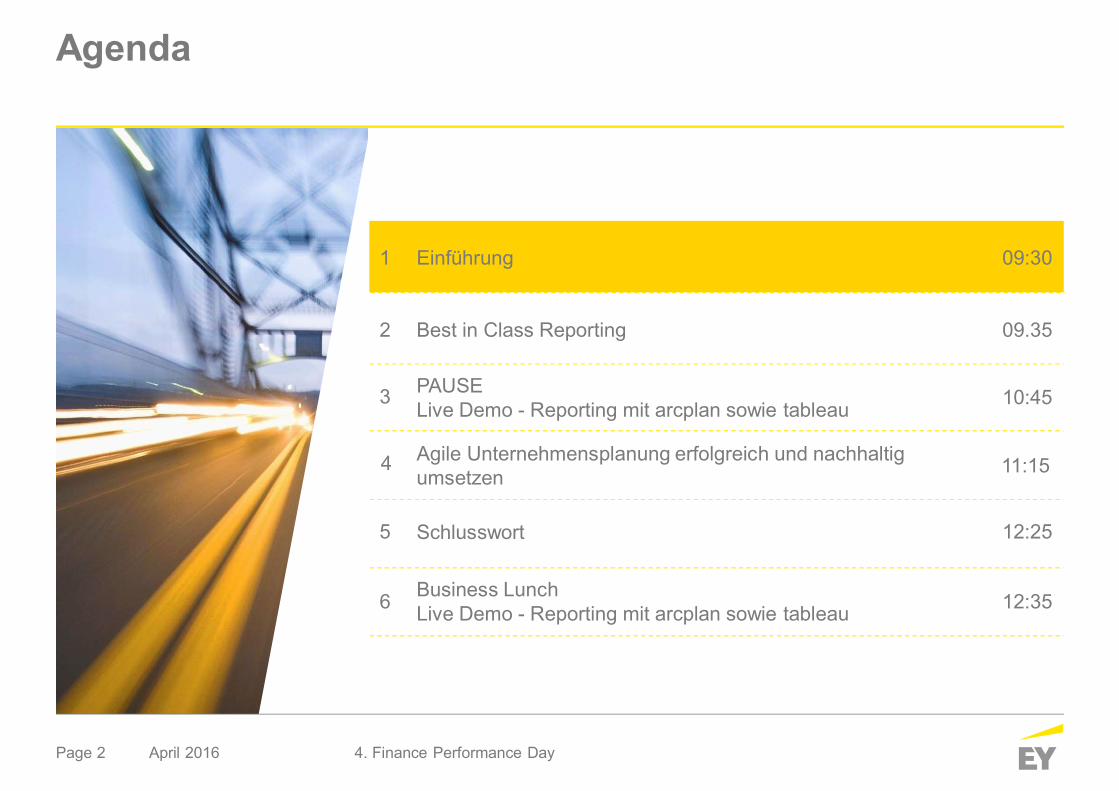
Agenda
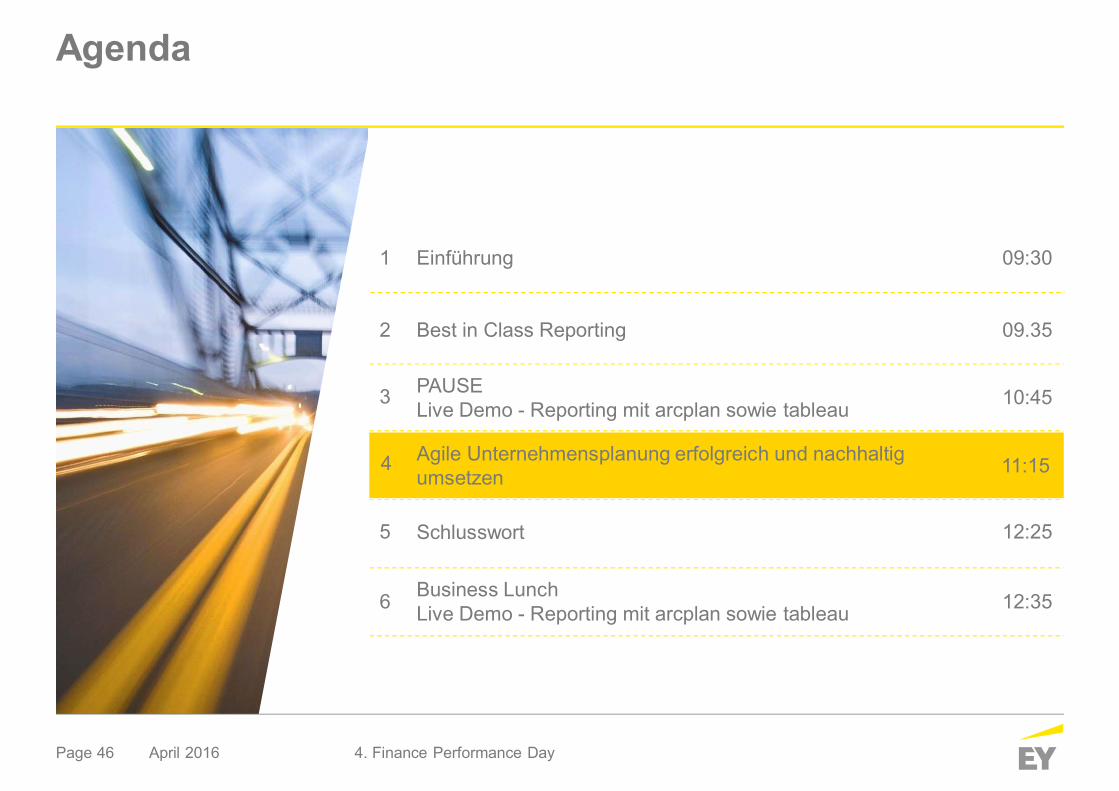
Einführung1 09:30
Agile Unternehmensplanung erfolgreich und nachhaltigumsetzen
3
11:15
Best in Class Reporting2 09.35
10:45
5 12:25
Business LunchLive Demo - Reporting mit arcplan sowie tableau6 12:35
April 2016 4. Finance Performance Day
Schlusswort
PAUSELive Demo - Reporting mit arcplan sowie tableau
4
Page 3
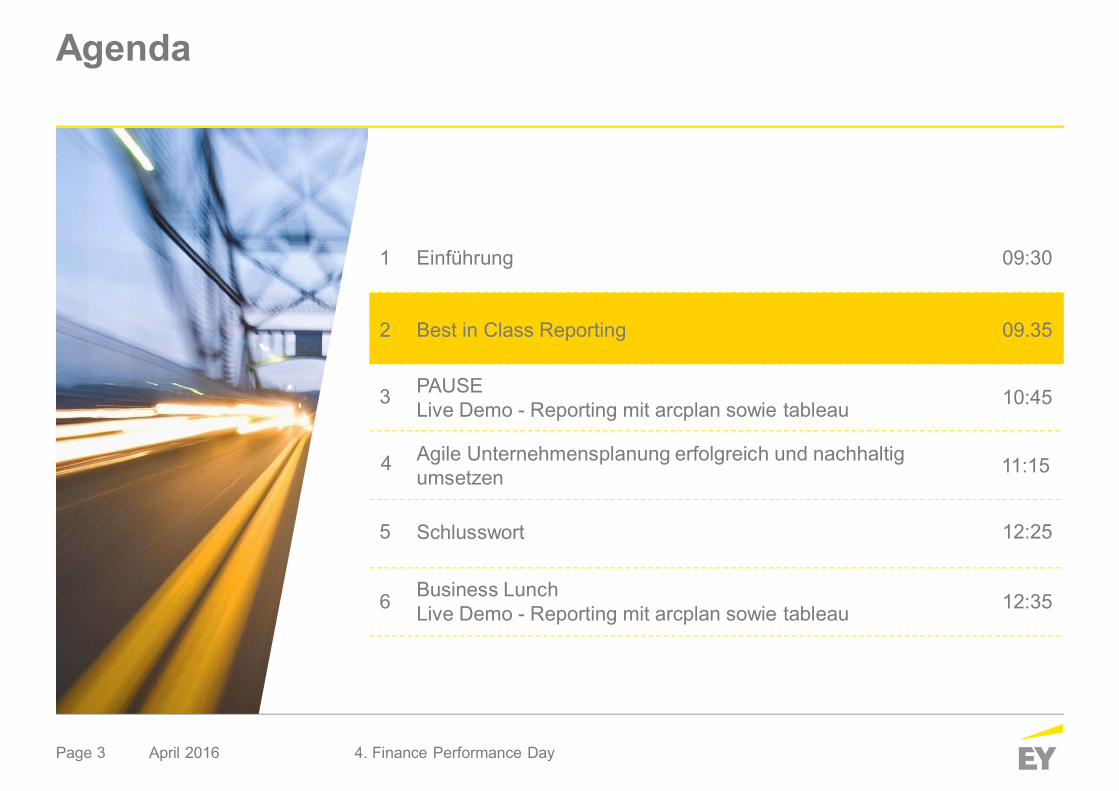
Agenda
Einführung1 09:30
Agile Unternehmensplanung erfolgreich und nachhaltigumsetzen
3
11:15
Best in Class Reporting2 09.35
10:45
5 12:25
Business LunchLive Demo - Reporting mit arcplan sowie tableau6 12:35
April 2016 4. Finance Performance Day
Schlusswort
PAUSELive Demo - Reporting mit arcplan sowie tableau
4
Best in Class Reporting
• Wie Digitalisierung das Reporting von morgen verändert• Die Potentiale kontextspezifischer Daten-Visualisierung• Effizienz durch Standardisierung der Informationsdarstellung
Page 5
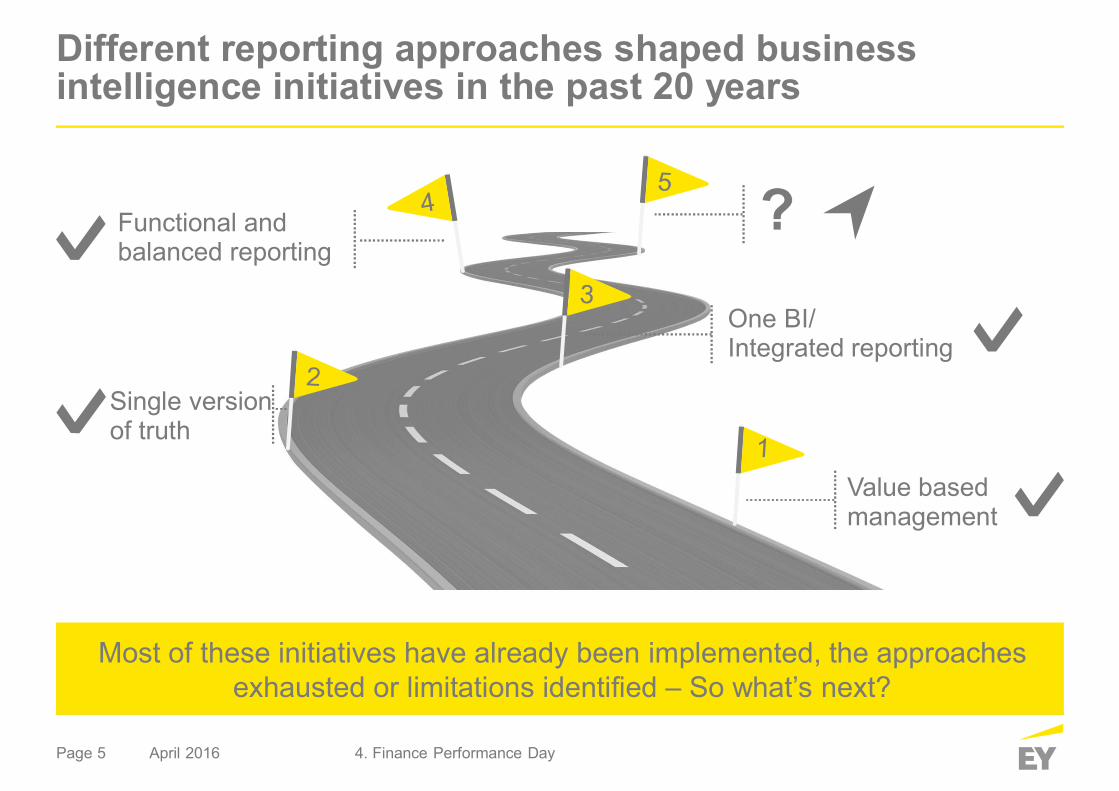
Different reporting approaches shaped businessintelligence initiatives in the past 20 years
Most of these initiatives have already been implemented, the approachesexhausted or limitations identified – So what’s next?
Functional andbalanced reporting
Single versionof truth
Value basedmanagement
One BI/Integrated reporting
?
4. Finance Performance DayApril 2016
Page 6
Financialperformance
Operationalexcellence
Strategic/riskpotentials
Businessunit
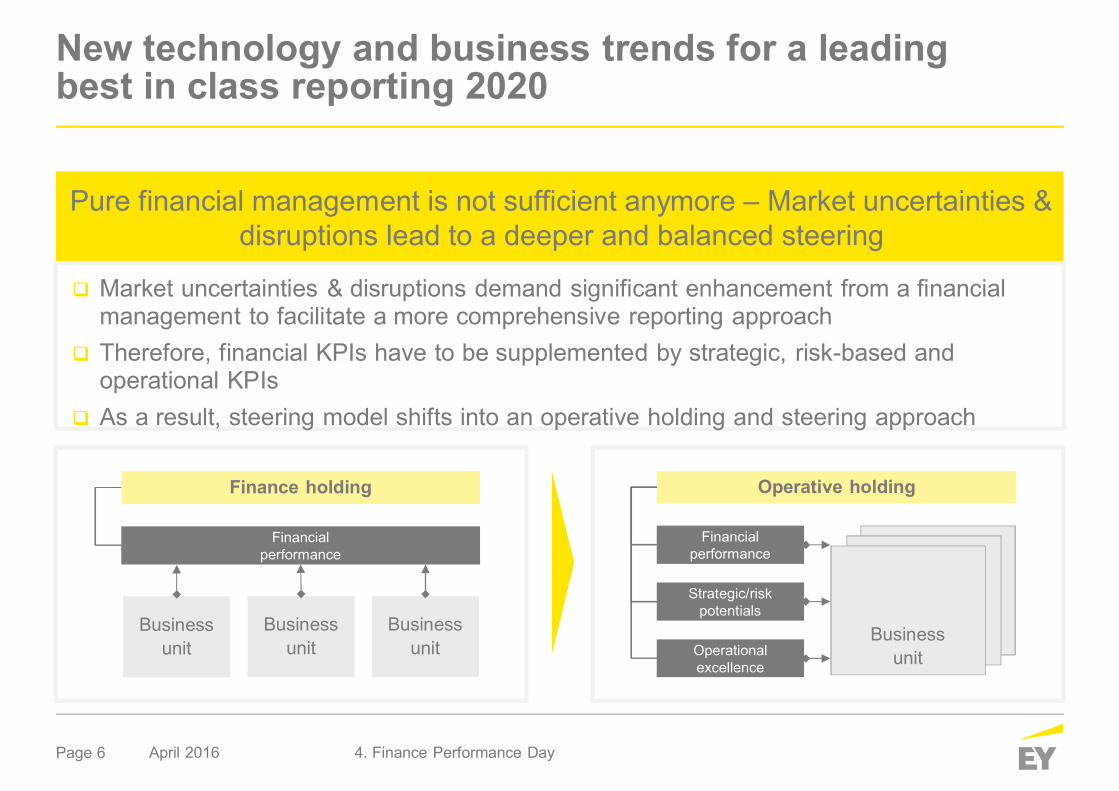
New technology and business trends for a leadingbest in class reporting 2020
Pure financial management is not sufficient anymore – Market uncertainties &disruptions lead to a deeper and balanced steering
Market uncertainties & disruptions demand significant enhancement from a financialmanagement to facilitate a more comprehensive reporting approachTherefore, financial KPIs have to be supplemented by strategic, risk-based andoperational KPIsAs a result, steering model shifts into an operative holding and steering approach
4. Finance Performance DayApril 2016
Finance holding
Financialperformance
Businessunit
Businessunit
Businessunit
Operative holding
Page 7
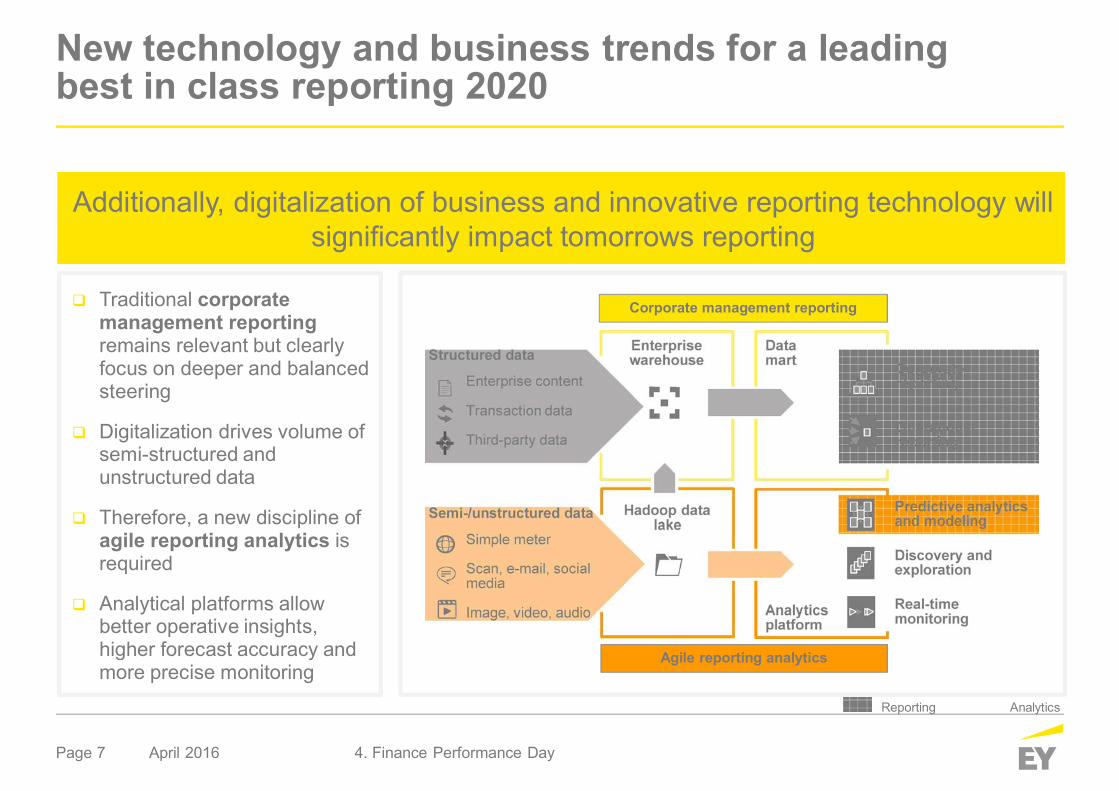
Corporate management reporting
Agile reporting analytics
New technology and business trends for a leadingbest in class reporting 2020
Reporting Analytics
Additionally, digitalization of business and innovative reporting technology willsignificantly impact tomorrows reporting
Traditional corporatemanagement reportingremains relevant but clearlyfocus on deeper and balancedsteering
Digitalization drives volume ofsemi-structured andunstructured data
Therefore, a new discipline ofagile reporting analytics isrequired
Analytical platforms allowbetter operative insights,higher forecast accuracy andmore precise monitoring
4. Finance Performance DayApril 2016
Page 8
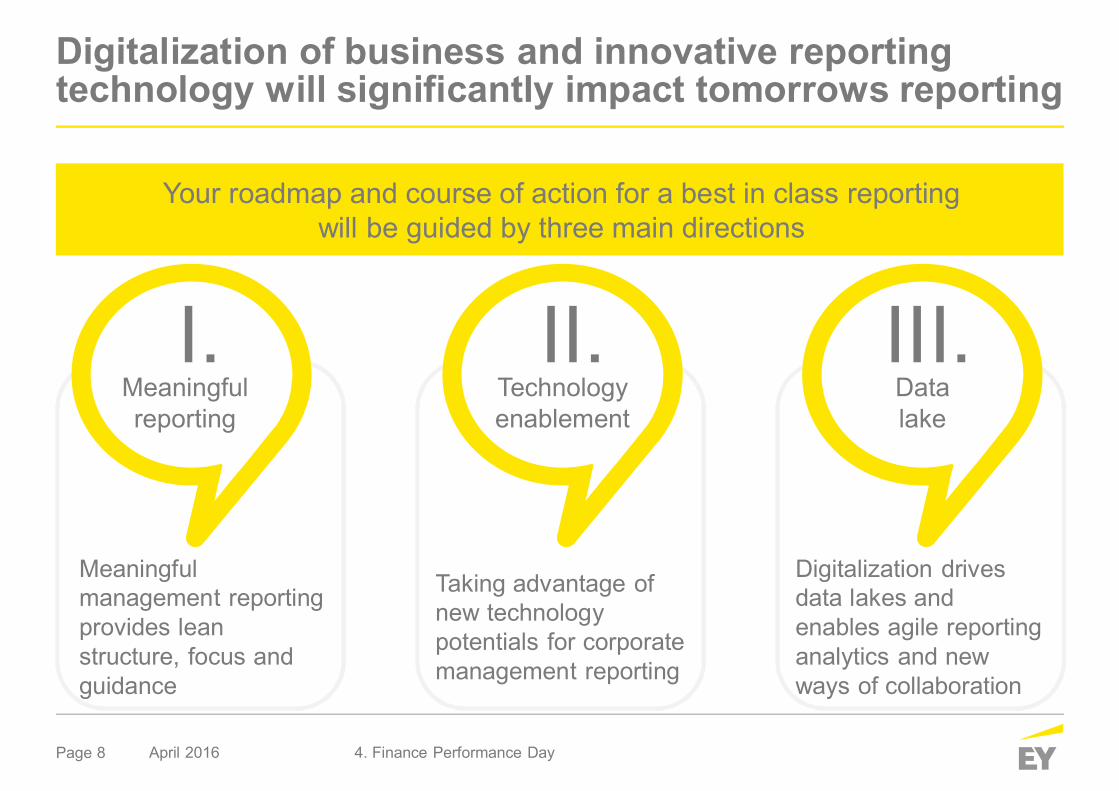
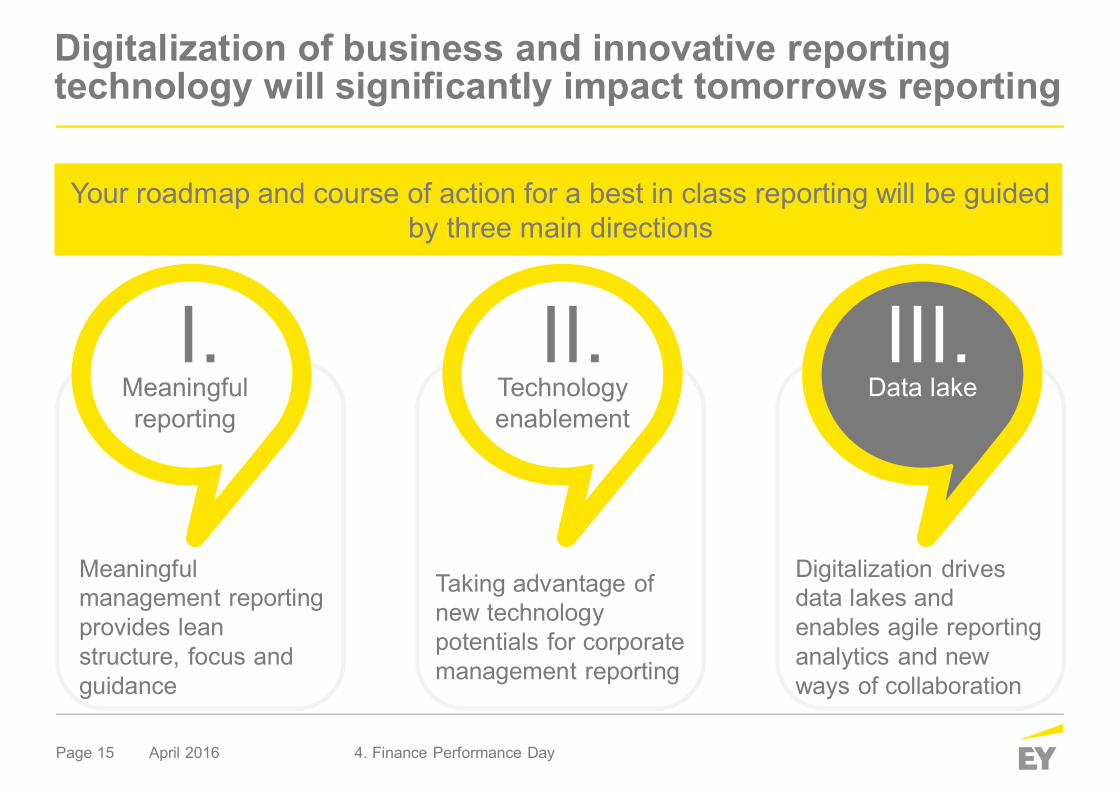
Meaningfulmanagement reportingprovides leanstructure, focus andguidance
Meaningfulreporting
Taking advantage ofnew technologypotentials for corporatemanagement reporting
Technologyenablement
Digitalization drivesdata lakes andenables agile reportinganalytics and newways of collaboration
Datalake
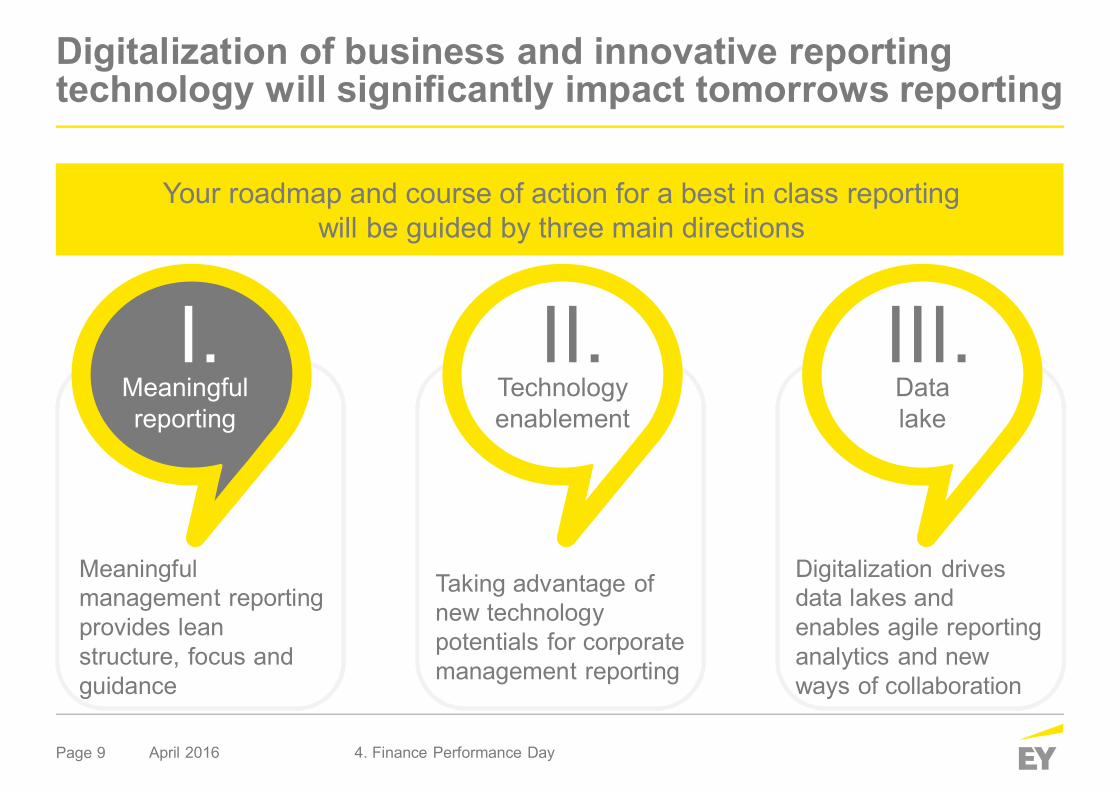
Digitalization of business and innovative reportingtechnology will significantly impact tomorrows reporting
I. II. III.
Your roadmap and course of action for a best in class reportingwill be guided by three main directions
April 2016 4. Finance Performance Day
Page 9
Meaningfulmanagement reportingprovides leanstructure, focus andguidance
Meaningfulreporting
Taking advantage ofnew technologypotentials for corporatemanagement reporting
Technologyenablement
Digitalization drivesdata lakes andenables agile reportinganalytics and newways of collaboration
Datalake
Digitalization of business and innovative reportingtechnology will significantly impact tomorrows reporting
I. II. III.
Your roadmap and course of action for a best in class reportingwill be guided by three main directions
April 2016 4. Finance Performance Day
Page 10
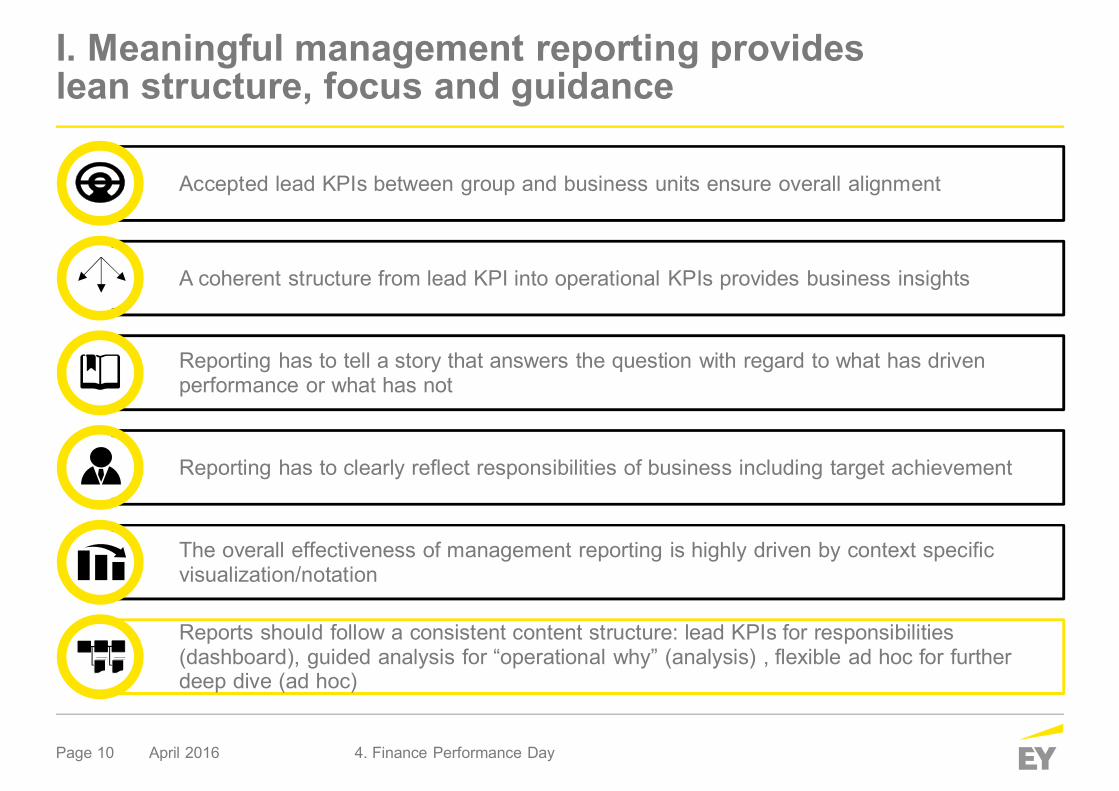
I. Meaningful management reporting provideslean structure, focus and guidance
Accepted lead KPIs between group and business units ensure overall alignment1
Reporting has to clearly reflect responsibilities of business including target achievement1
Reporting has to tell a story that answers the question with regard to what has drivenperformance or what has not3A coherent structure from lead KPI into operational KPIs provides business insights2
The overall effectiveness of management reporting is highly driven by context specificvisualization/notation2Reports should follow a consistent content structure: lead KPIs for responsibilities(dashboard), guided analysis for “operational why” (analysis) , flexible ad hoc for furtherdeep dive (ad hoc)3
4. Finance Performance DayApril 2016
Page 11
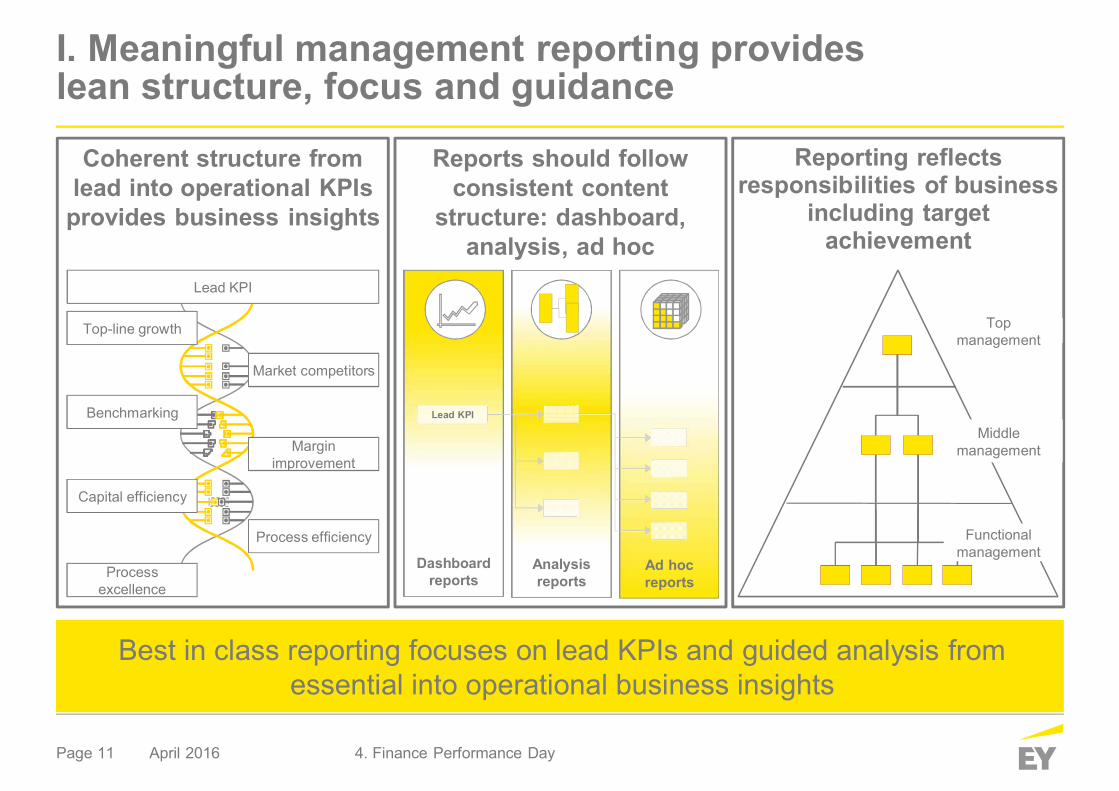
I. Meaningful management reporting provideslean structure, focus and guidance
Best in class reporting focuses on lead KPIs and guided analysis fromessential into operational business insights
Reporting reflectsresponsibilities of business
including targetachievement
Coherent structure fromlead into operational KPIs
provides business insights
Ad hocreports
Analysisreports
Dashboardreports
Lead KPI
Reports should followconsistent content
structure: dashboard,analysis, ad hoc
Top-line growth
Benchmarking
Market competitors
Marginimprovement
Capital efficiency
Process efficiency
Processexcellence
Lead KPI
4. Finance Performance DayApril 2016
Topmanagement
Middlemanagement
Functionalmanagement
Page 12
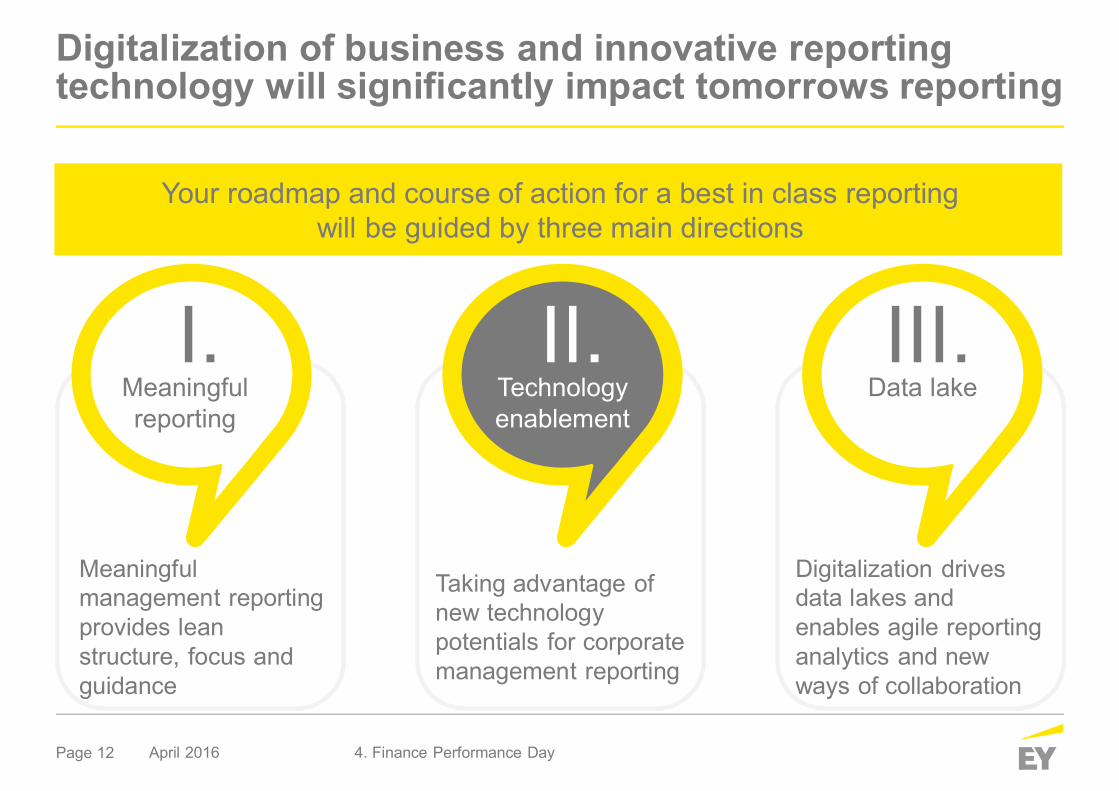
Meaningfulmanagement reportingprovides leanstructure, focus andguidance
Meaningfulreporting
Taking advantage ofnew technologypotentials for corporatemanagement reporting
Technologyenablement
Digitalization drivesdata lakes andenables agile reportinganalytics and newways of collaboration
Data lake
Digitalization of business and innovative reportingtechnology will significantly impact tomorrows reporting
I. II. III.
Your roadmap and course of action for a best in class reportingwill be guided by three main directions
April 2016 4. Finance Performance Day
Page 13
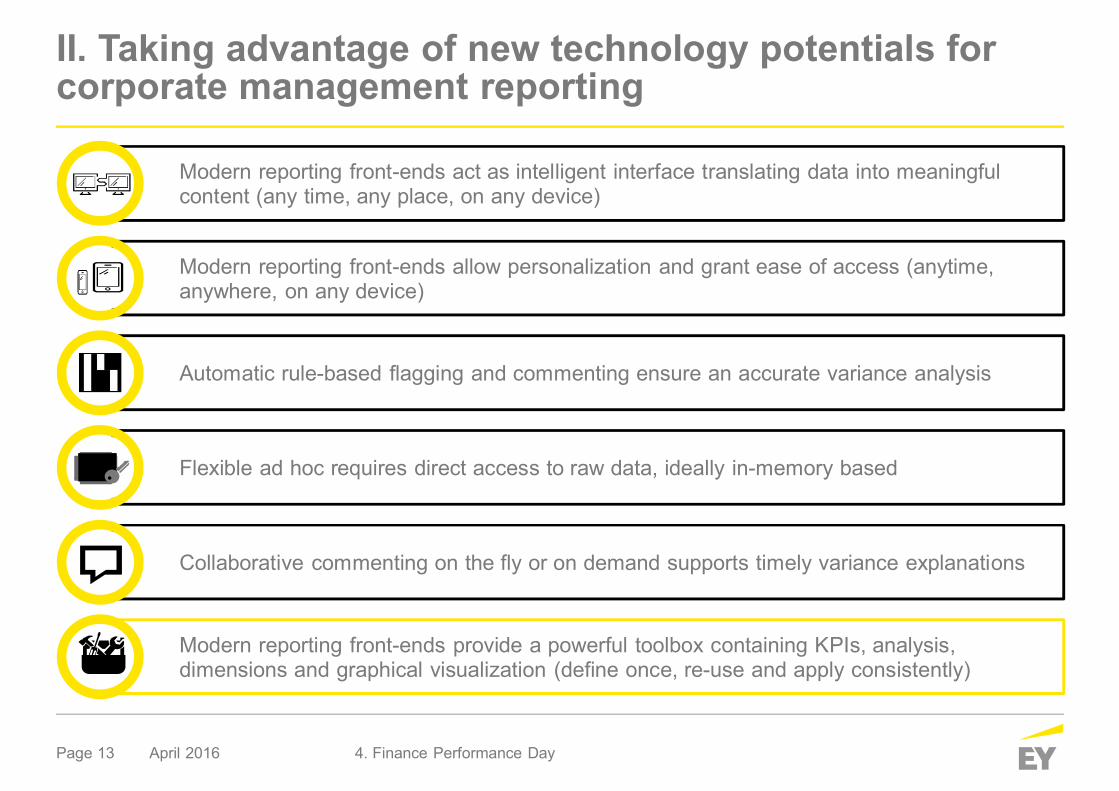
II. Taking advantage of new technology potentials forcorporate management reporting
Modern reporting front-ends act as intelligent interface translating data into meaningfulcontent (any time, any place, on any device)1
Flexible ad hoc requires direct access to raw data, ideally in-memory based1
Automatic rule-based flagging and commenting ensure an accurate variance analysis3
Modern reporting front-ends allow personalization and grant ease of access (anytime,anywhere, on any device)2
Collaborative commenting on the fly or on demand supports timely variance explanations2Modern reporting front-ends provide a powerful toolbox containing KPIs, analysis,dimensions and graphical visualization (define once, re-use and apply consistently)3
4. Finance Performance DayApril 2016
Page 14
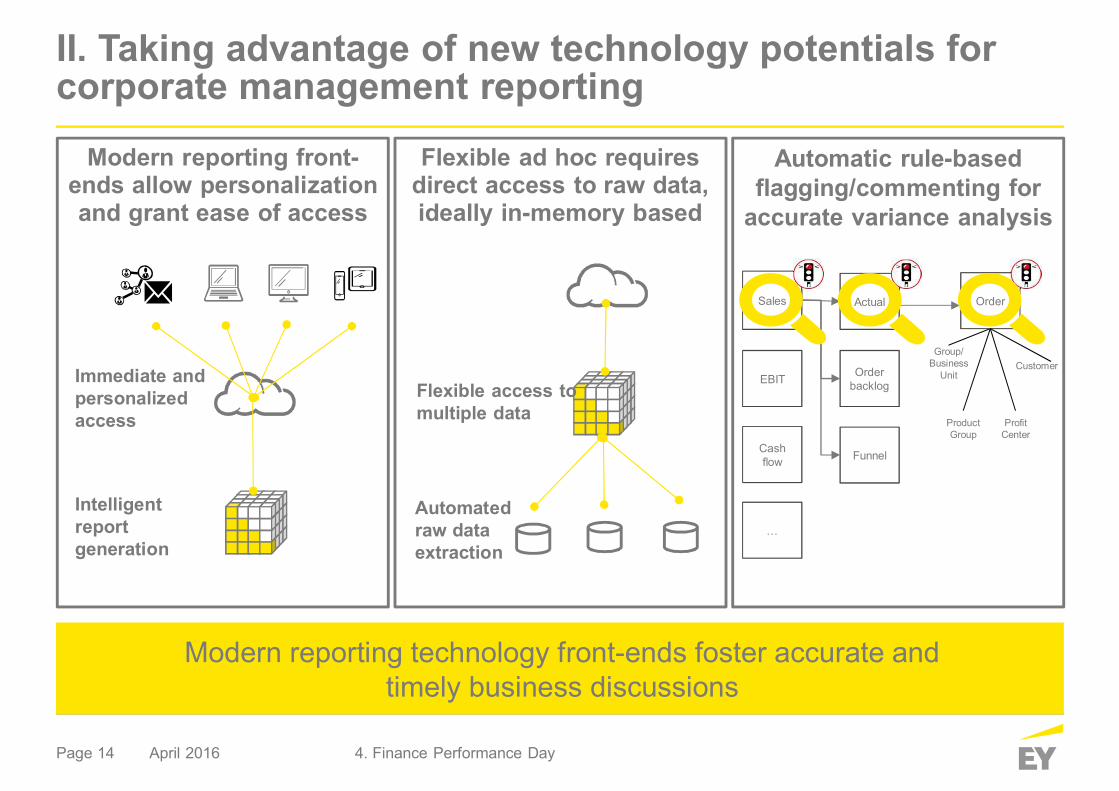
Modern reporting technology front-ends foster accurate andtimely business discussions
Automatic rule-basedflagging/commenting for
accurate variance analysis
Modern reporting front-ends allow personalizationand grant ease of access
Flexible ad hoc requiresdirect access to raw data,ideally in-memory based
II. Taking advantage of new technology potentials forcorporate management reporting
Flexible access tomultiple data
Automatedraw dataextraction
Immediate andpersonalizedaccess
Intelligentreportgeneration
Sales
EBIT
Cashflow
…
Orderbacklog
Funnel
Actual
CustomerGroup/
BusinessUnit
ProfitCenter
ProductGroup
Order
4. Finance Performance DayApril 2016
Page 15
Meaningfulmanagement reportingprovides leanstructure, focus andguidance
Meaningfulreporting
Taking advantage ofnew technologypotentials for corporatemanagement reporting
Technologyenablement
Digitalization drivesdata lakes andenables agile reportinganalytics and newways of collaboration
Data lake
Digitalization of business and innovative reportingtechnology will significantly impact tomorrows reporting
Your roadmap and course of action for a best in class reporting will be guidedby three main directions
I. II. III.
April 2016 4. Finance Performance Day
Page 16
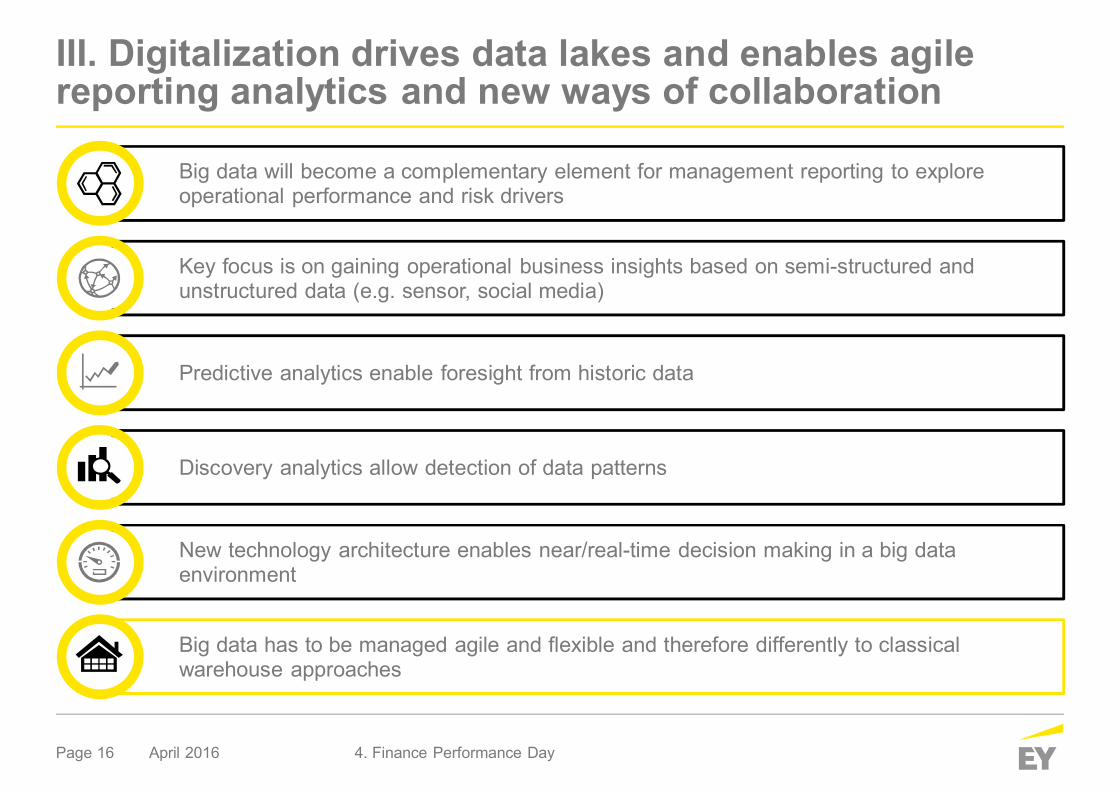
Big data will become a complementary element for management reporting to exploreoperational performance and risk drivers1
Discovery analytics allow detection of data patterns1
Predictive analytics enable foresight from historic data3
Key focus is on gaining operational business insights based on semi-structured andunstructured data (e.g. sensor, social media)2
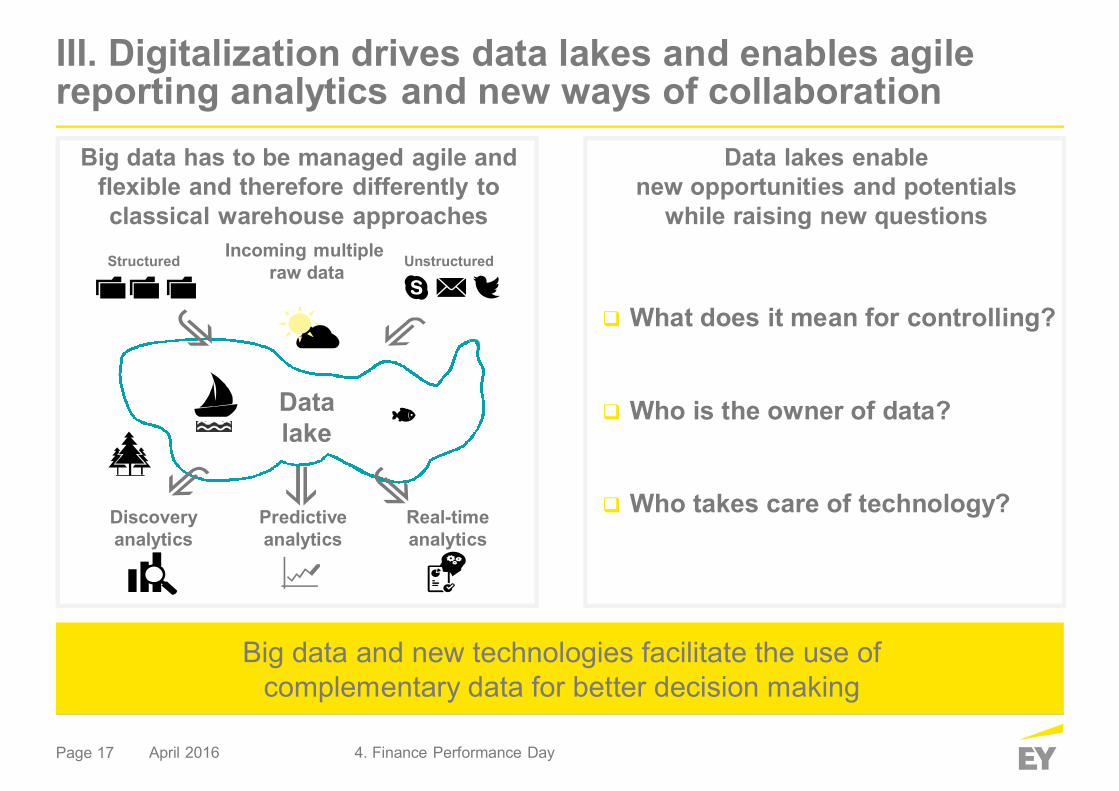
New technology architecture enables near/real-time decision making in a big dataenvironment2Big data has to be managed agile and flexible and therefore differently to classicalwarehouse approaches3
III. Digitalization drives data lakes and enables agilereporting analytics and new ways of collaboration
4. Finance Performance DayApril 2016
Page 17
Big data has to be managed agile andflexible and therefore differently toclassical warehouse approaches
III. Digitalization drives data lakes and enables agilereporting analytics and new ways of collaboration
Big data and new technologies facilitate the use ofcomplementary data for better decision making
Predictiveanalytics
Incoming multipleraw data
Datalake
Real-timeanalytics
Discoveryanalytics
Structured Unstructured
Data lakes enablenew opportunities and potentials
while raising new questions
What does it mean for controlling?
Who is the owner of data?
Who takes care of technology?
4. Finance Performance DayApril 2016
Page 18
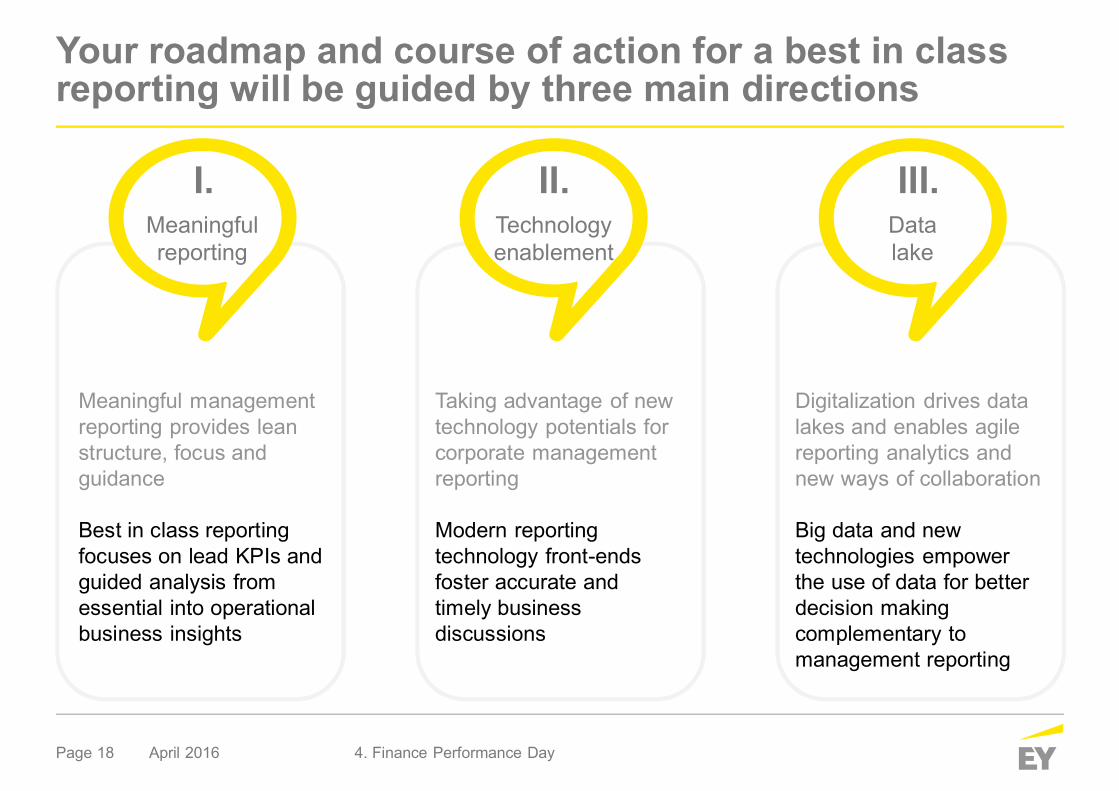
Meaningful managementreporting provides leanstructure, focus andguidance
Best in class reportingfocuses on lead KPIs andguided analysis fromessential into operationalbusiness insights
Taking advantage of newtechnology potentials forcorporate managementreporting
Modern reportingtechnology front-endsfoster accurate andtimely businessdiscussions
Digitalization drives datalakes and enables agilereporting analytics andnew ways of collaboration
Big data and newtechnologies empowerthe use of data for betterdecision makingcomplementary tomanagement reporting
Your roadmap and course of action for a best in classreporting will be guided by three main directions
Meaningfulreporting
I.Technologyenablement
II.Datalake
III.
April 2016 4. Finance Performance Day

Is your Information Design leveragingthe gain of Insights from Reporting?
Page 20
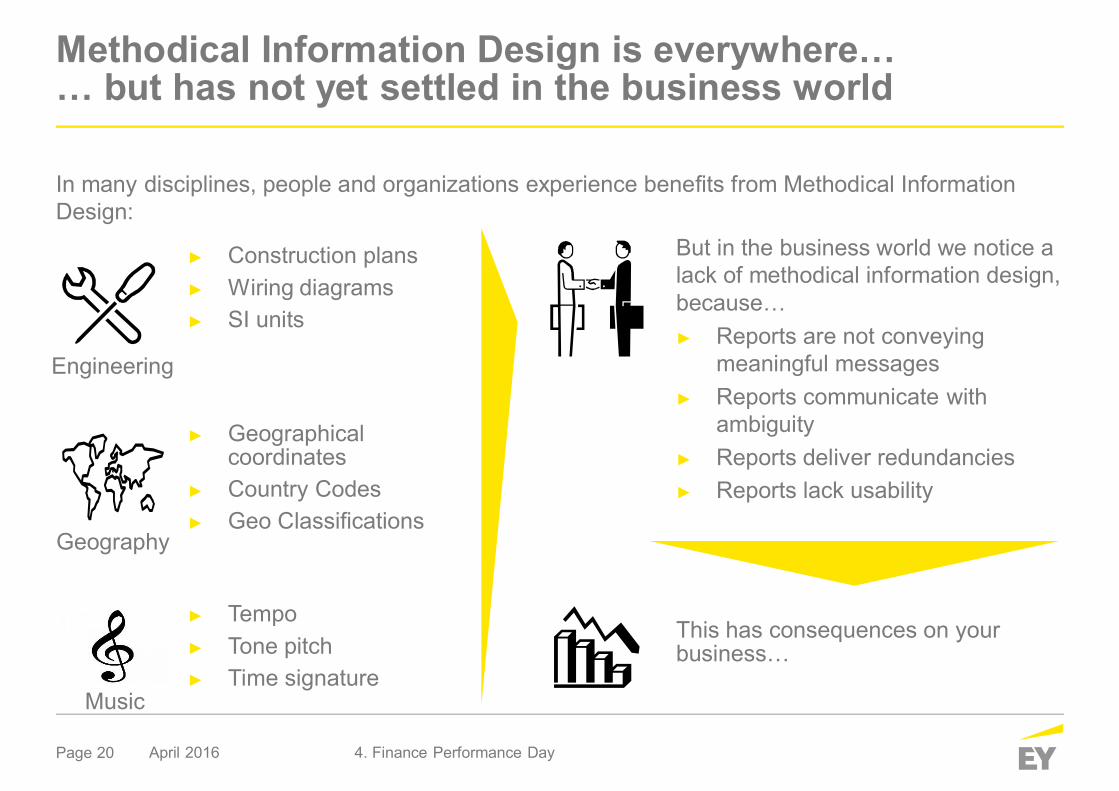
Methodical Information Design is everywhere…… but has not yet settled in the business world
April 2016 4. Finance Performance Day
But in the business world we notice alack of methodical information design,because…
Reports are not conveyingmeaningful messagesReports communicate withambiguityReports deliver redundanciesReports lack usability
In many disciplines, people and organizations experience benefits from Methodical InformationDesign:
Construction plansWiring diagramsSI units
TempoTone pitchTime signature
GeographicalcoordinatesCountry CodesGeo Classifications
This has consequences on yourbusiness…
Engineering
Geography
Music
Page 21
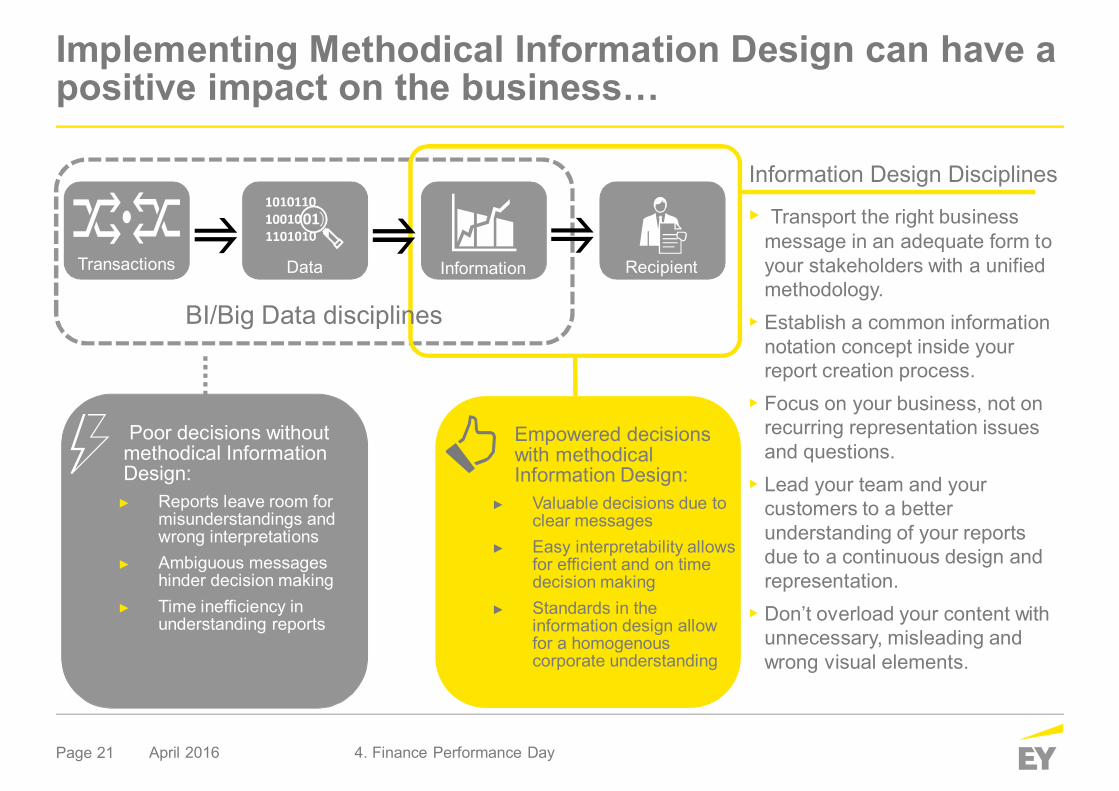
Empowered decisionswith methodicalInformation Design:
Valuable decisions due toclear messagesEasy interpretability allowsfor efficient and on timedecision makingStandards in theinformation design allowfor a homogenouscorporate understanding
Implementing Methodical Information Design can have apositive impact on the business…
April 2016 4. Finance Performance Day
Poor decisions withoutmethodical InformationDesign:
Reports leave room formisunderstandings andwrong interpretationsAmbiguous messageshinder decision makingTime inefficiency inunderstanding reports
Information Design Disciplines
• Transport the right businessmessage in an adequate form toyour stakeholders with a unifiedmethodology.
• Establish a common informationnotation concept inside yourreport creation process.
• Focus on your business, not onrecurring representation issuesand questions.
• Lead your team and yourcustomers to a betterunderstanding of your reportsdue to a continuous design andrepresentation.
• Don’t overload your content withunnecessary, misleading andwrong visual elements.
Transactions Data Information Recipient
BI/Big Data disciplines
Page 22
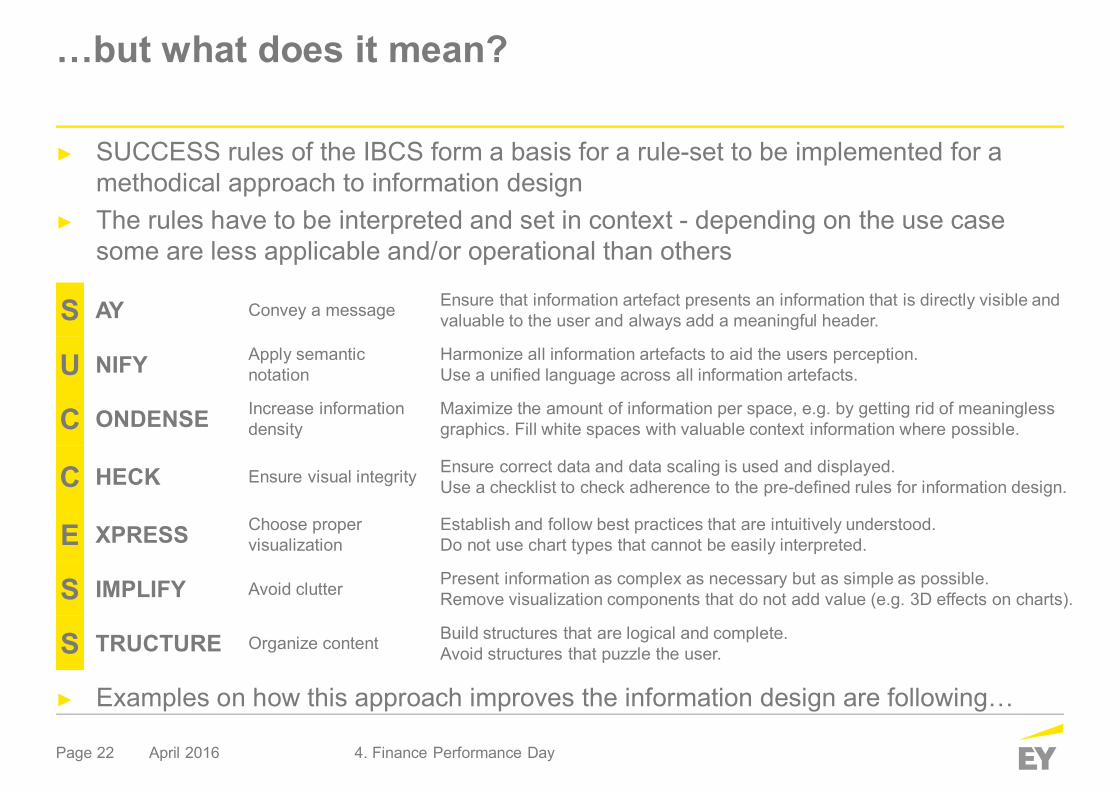
…but what does it mean?
April 2016 4. Finance Performance Day
SUCCESS rules of the IBCS form a basis for a rule-set to be implemented for amethodical approach to information designThe rules have to be interpreted and set in context - depending on the use casesome are less applicable and/or operational than others
Examples on how this approach improves the information design are following…
S AY Convey a message Ensure that information artefact presents an information that is directly visible andvaluable to the user and always add a meaningful header.
U NIFY Apply semanticnotation
Harmonize all information artefacts to aid the users perception.Use a unified language across all information artefacts.
C ONDENSE Increase informationdensity
Maximize the amount of information per space, e.g. by getting rid of meaninglessgraphics. Fill white spaces with valuable context information where possible.
C HECK Ensure visual integrity Ensure correct data and data scaling is used and displayed.Use a checklist to check adherence to the pre-defined rules for information design.
E XPRESS Choose propervisualization
Establish and follow best practices that are intuitively understood.Do not use chart types that cannot be easily interpreted.
S IMPLIFY Avoid clutter Present information as complex as necessary but as simple as possible.Remove visualization components that do not add value (e.g. 3D effects on charts).
S TRUCTURE Organize content Build structures that are logical and complete.Avoid structures that puzzle the user.
Page 23
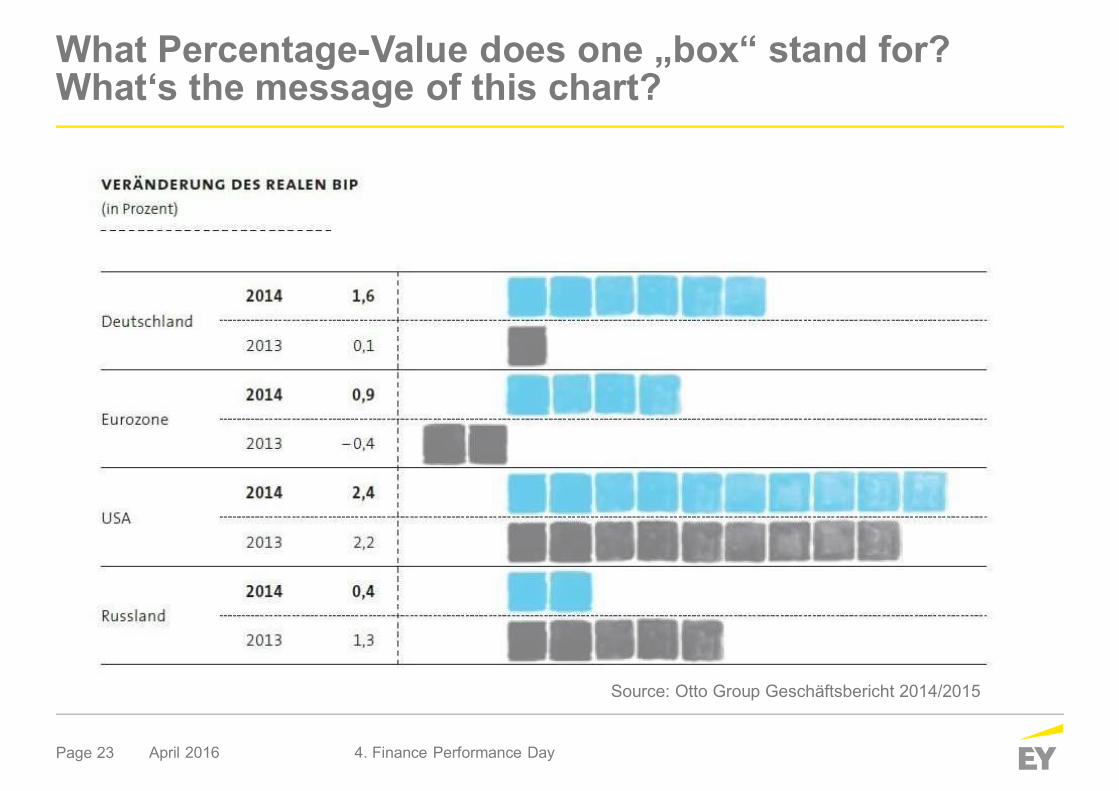
What Percentage-Value does one „box“ stand for?What‘s the message of this chart?
April 2016 4. Finance Performance Day
Source: Otto Group Geschäftsbericht 2014/2015
Page 24
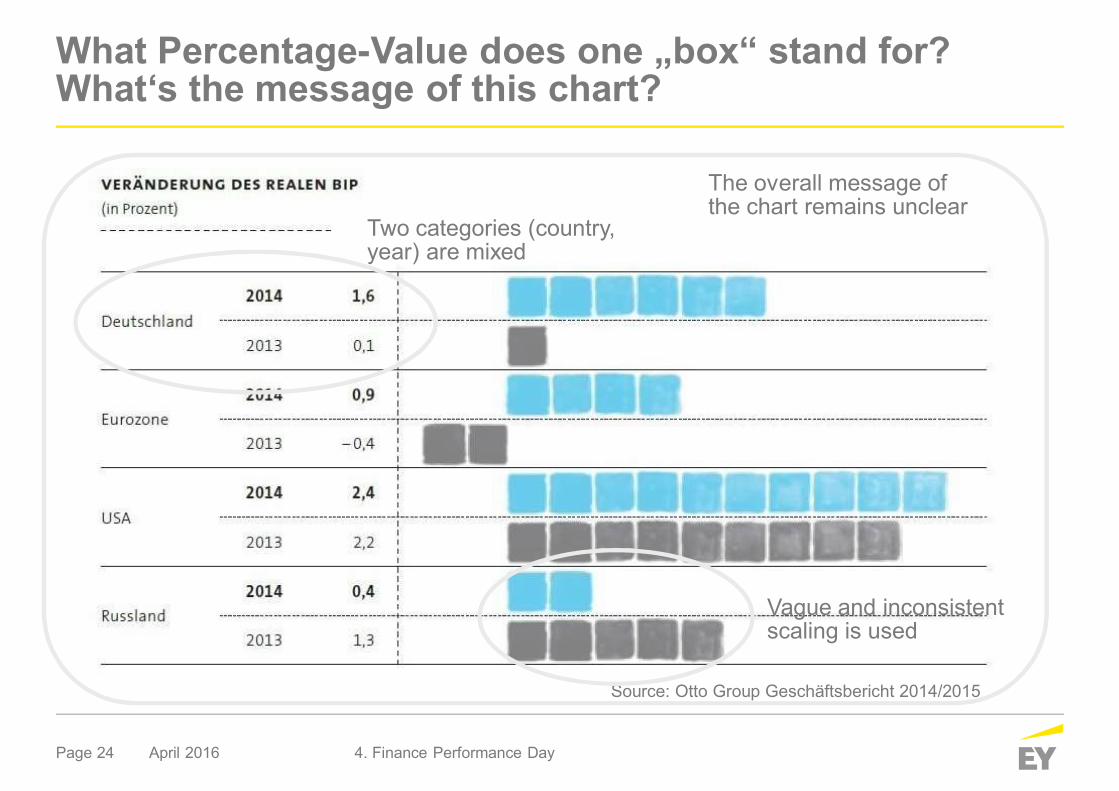
What Percentage-Value does one „box“ stand for?What‘s the message of this chart?
April 2016 4. Finance Performance Day
Source: Otto Group Geschäftsbericht 2014/2015
Two categories (country,year) are mixed
Vague and inconsistentscaling is used
The overall message ofthe chart remains unclear
Page 25
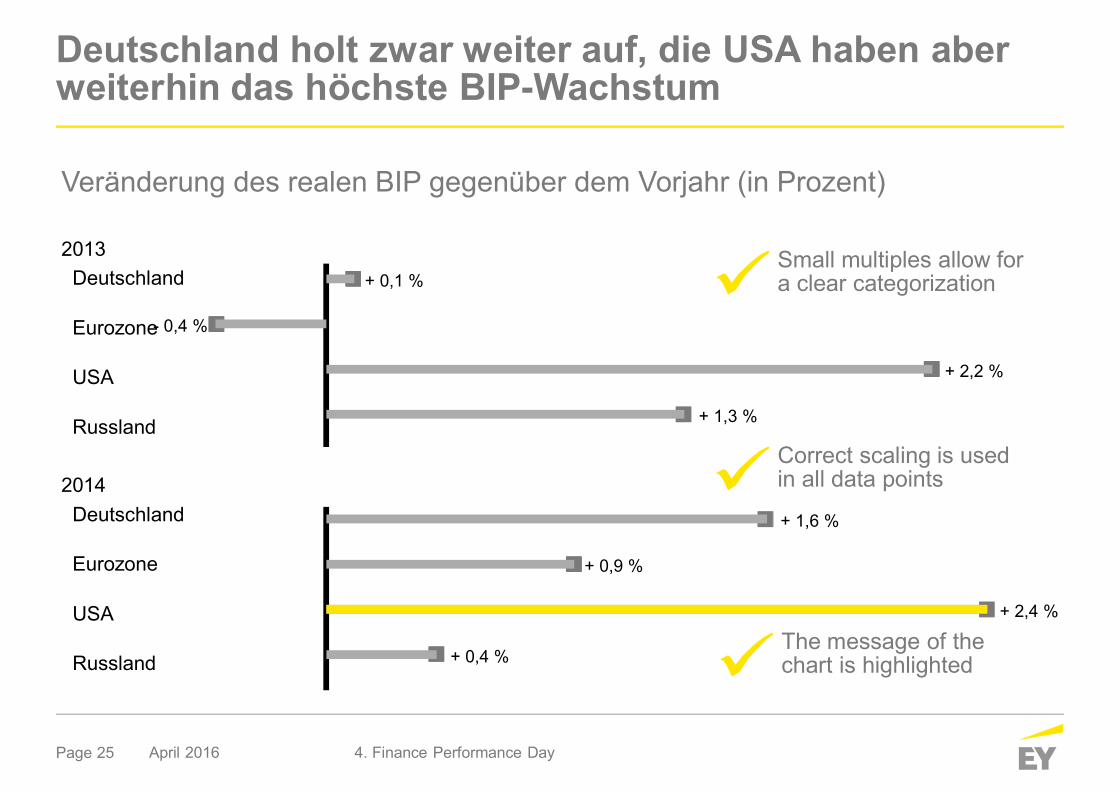
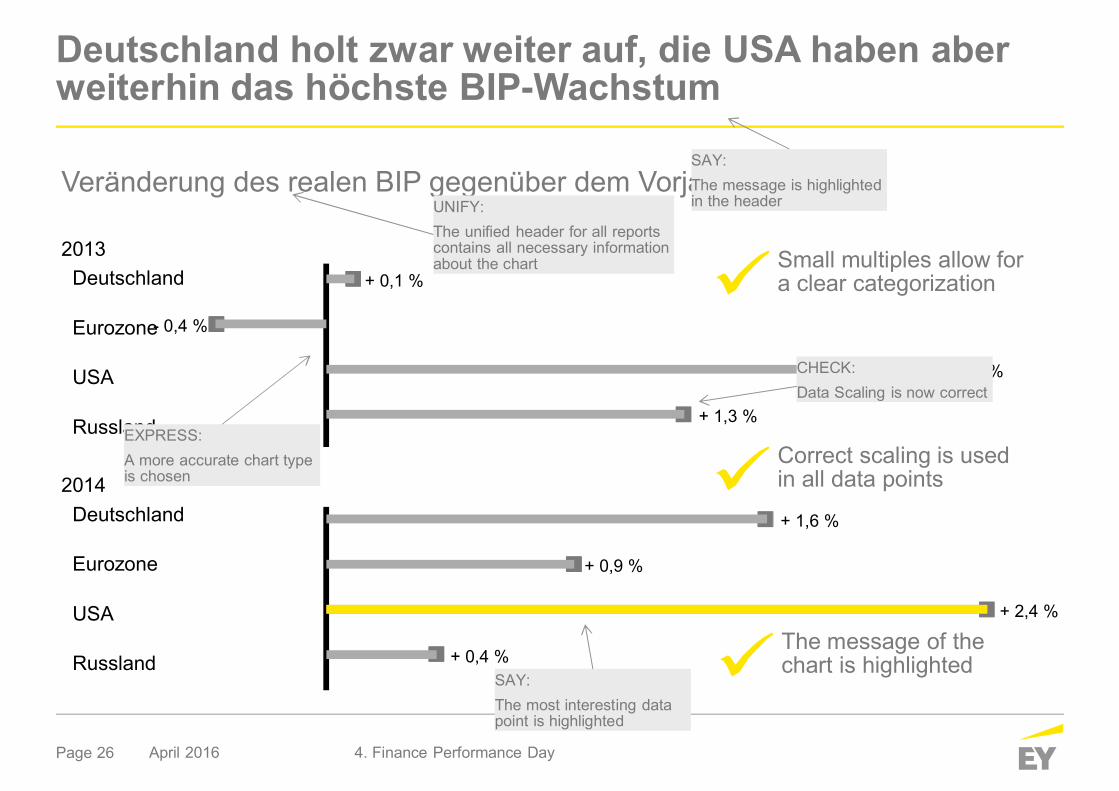
Deutschland holt zwar weiter auf, die USA haben aberweiterhin das höchste BIP-Wachstum
April 2016 4. Finance Performance Day
Small multiples allow fora clear categorization
Correct scaling is usedin all data points
The message of thechart is highlighted
2013Deutschland
Eurozone
USA
Russland
2014Deutschland
Eurozone
USA
Russland
Veränderung des realen BIP gegenüber dem Vorjahr (in Prozent)
+ 0,1 %
- 0,4 %
+ 2,2 %
+ 1,3 %
+ 1,6 %
+ 0,9 %
+ 2,4 %
+ 0,4 %
Page 26
Deutschland holt zwar weiter auf, die USA haben aberweiterhin das höchste BIP-Wachstum
April 2016 4. Finance Performance Day
Small multiples allow fora clear categorization
Correct scaling is usedin all data points
The message of thechart is highlighted
2013Deutschland
Eurozone
USA
Russland
2014Deutschland
Eurozone
USA
Russland
Veränderung des realen BIP gegenüber dem Vorjahr (in Prozent)
+ 0,1 %
- 0,4 %
+ 2,2 %
+ 1,3 %
+ 1,6 %
+ 0,9 %
+ 2,4 %
+ 0,4 %
EXPRESS:A more accurate chart typeis chosen
SAY:The message is highlightedin the header
CHECK:Data Scaling is now correct
SAY:The most interesting datapoint is highlighted
UNIFY:The unified header for all reportscontains all necessary informationabout the chart
Page 27
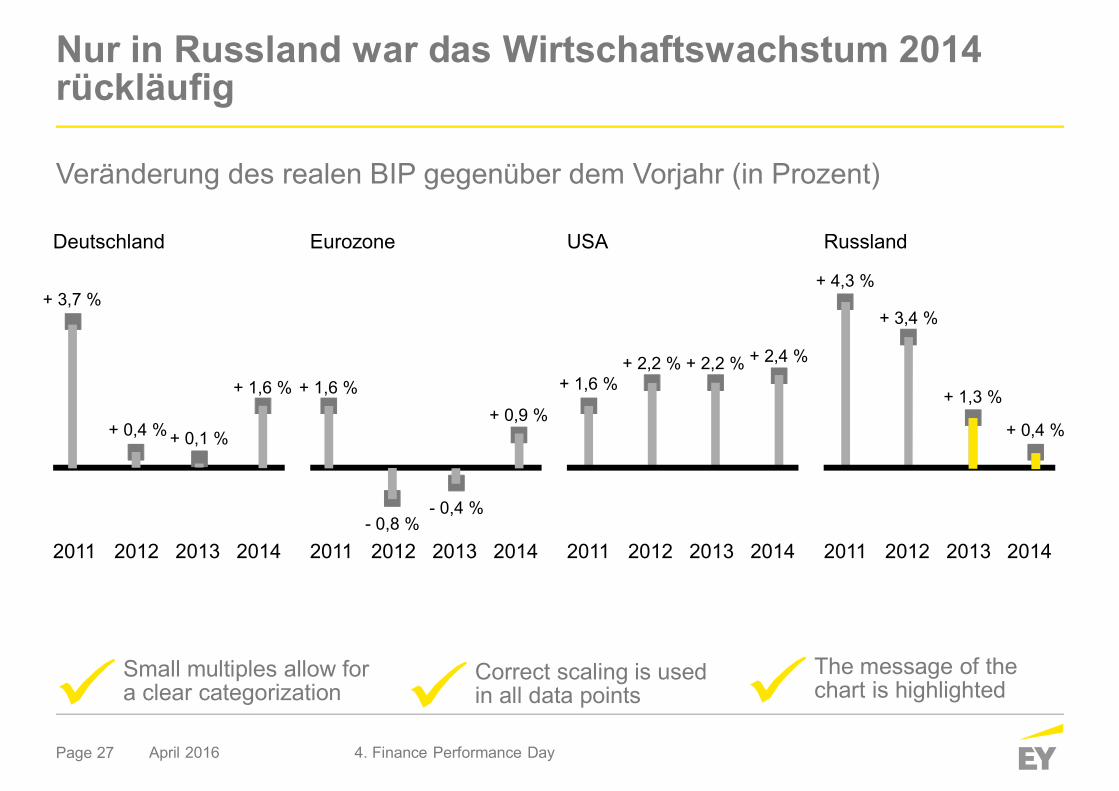
Nur in Russland war das Wirtschaftswachstum 2014rückläufig
Veränderung des realen BIP gegenüber dem Vorjahr (in Prozent)
April 2016 4. Finance Performance Day
Small multiples allow fora clear categorization
Correct scaling is usedin all data points
The message of thechart is highlighted
Deutschland
2011 2012 2013 2014
Eurozone
2011 2012 2013 2014
USA
2011 2012 2013 2014
Russland
2011 2012 2013 2014
+ 4,3 %+ 3,7 %
+ 0,4 % + 0,1 %
+ 1,6 % + 1,6 %
- 0,8 %- 0,4 %
+ 0,9 %
+ 2,4 %+ 2,2 %+ 2,2 %+ 1,6 %
+ 3,4 %
+ 1,3 %
+ 0,4 %
Page 28
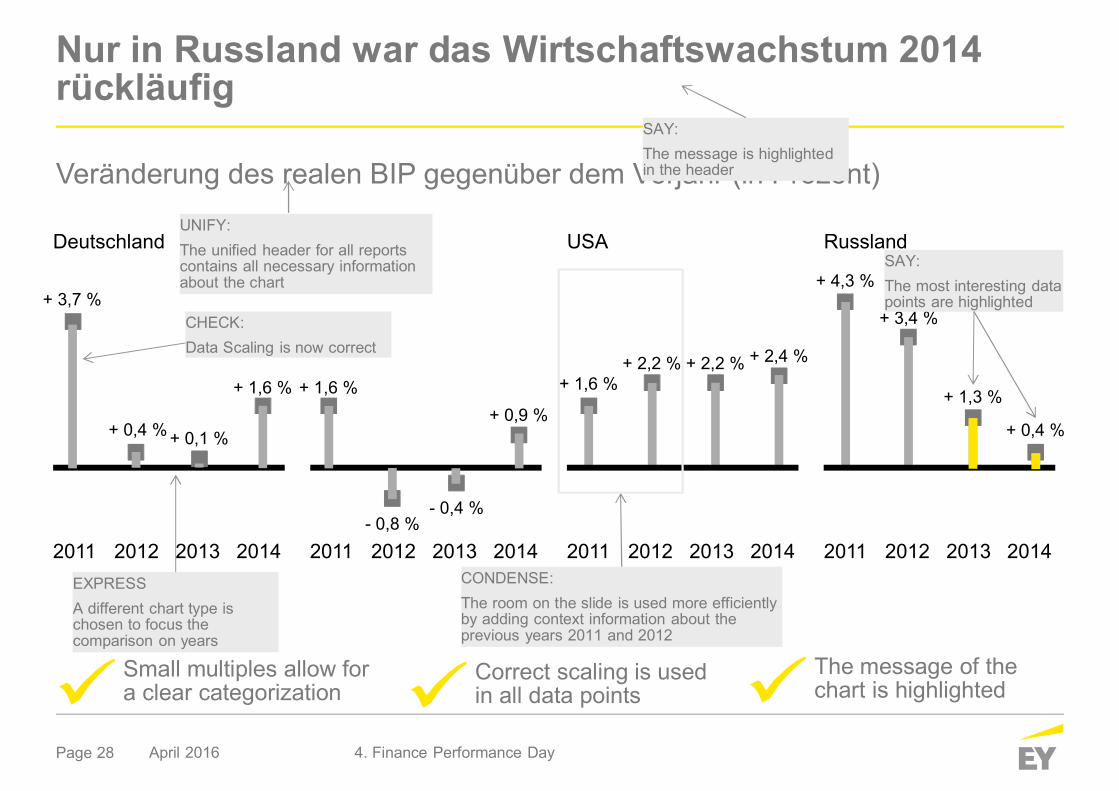
Nur in Russland war das Wirtschaftswachstum 2014rückläufig
Veränderung des realen BIP gegenüber dem Vorjahr (in Prozent)
April 2016 4. Finance Performance Day
Small multiples allow fora clear categorization
Correct scaling is usedin all data points
The message of thechart is highlighted
Deutschland
2011 2012 2013 2014
Eurozone
2011 2012 2013 2014
USA
2011 2012 2013 2014
Russland
2011 2012 2013 2014
+ 4,3 %+ 3,7 %
+ 0,4 % + 0,1 %
+ 1,6 % + 1,6 %
- 0,8 %- 0,4 %
+ 0,9 %
+ 2,4 %+ 2,2 %+ 2,2 %+ 1,6 %
+ 3,4 %
+ 1,3 %
+ 0,4 %
EXPRESSA different chart type ischosen to focus thecomparison on years
CHECK:Data Scaling is now correct
CONDENSE:The room on the slide is used more efficientlyby adding context information about theprevious years 2011 and 2012
SAY:The message is highlightedin the header
SAY:The most interesting datapoints are highlighted
UNIFY:The unified header for all reportscontains all necessary informationabout the chart
Page 29
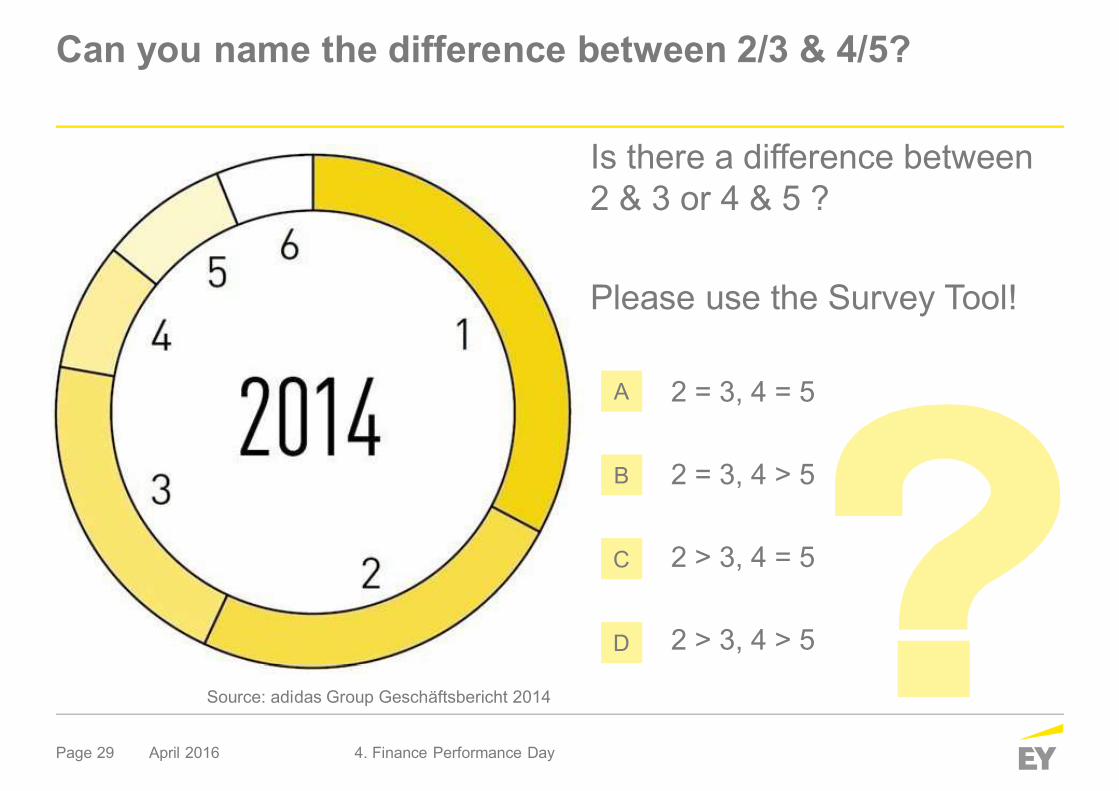
Can you name the difference between 2/3 & 4/5?
April 2016 4. Finance Performance Day
Is there a difference between2 & 3 or 4 & 5 ?
Please use the Survey Tool!
• 2 = 3, 4 = 5
• 2 = 3, 4 > 5
• 2 > 3, 4 = 5
• 2 > 3, 4 > 5
A
B
C
D
Source: adidas Group Geschäftsbericht 2014
Page 30
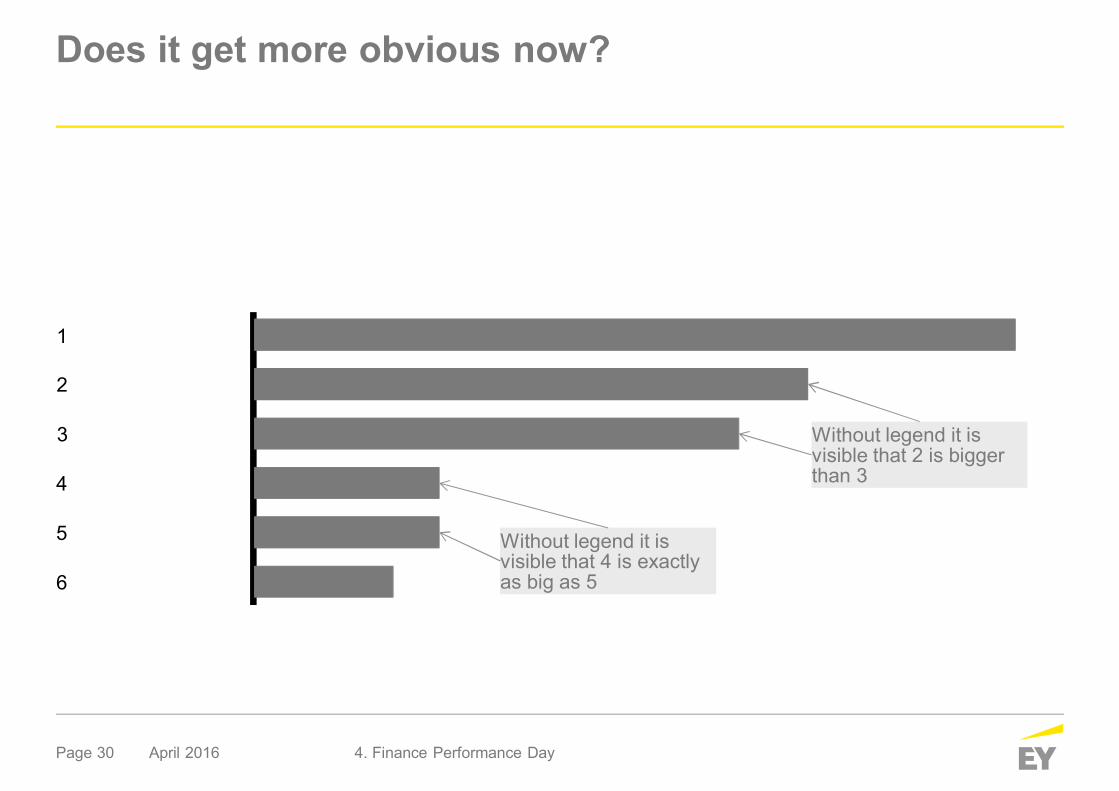
Does it get more obvious now?
April 2016 4. Finance Performance Day
1
2
3
4
5
6
Without legend it isvisible that 2 is biggerthan 3
Without legend it isvisible that 4 is exactlyas big as 5
Page 31
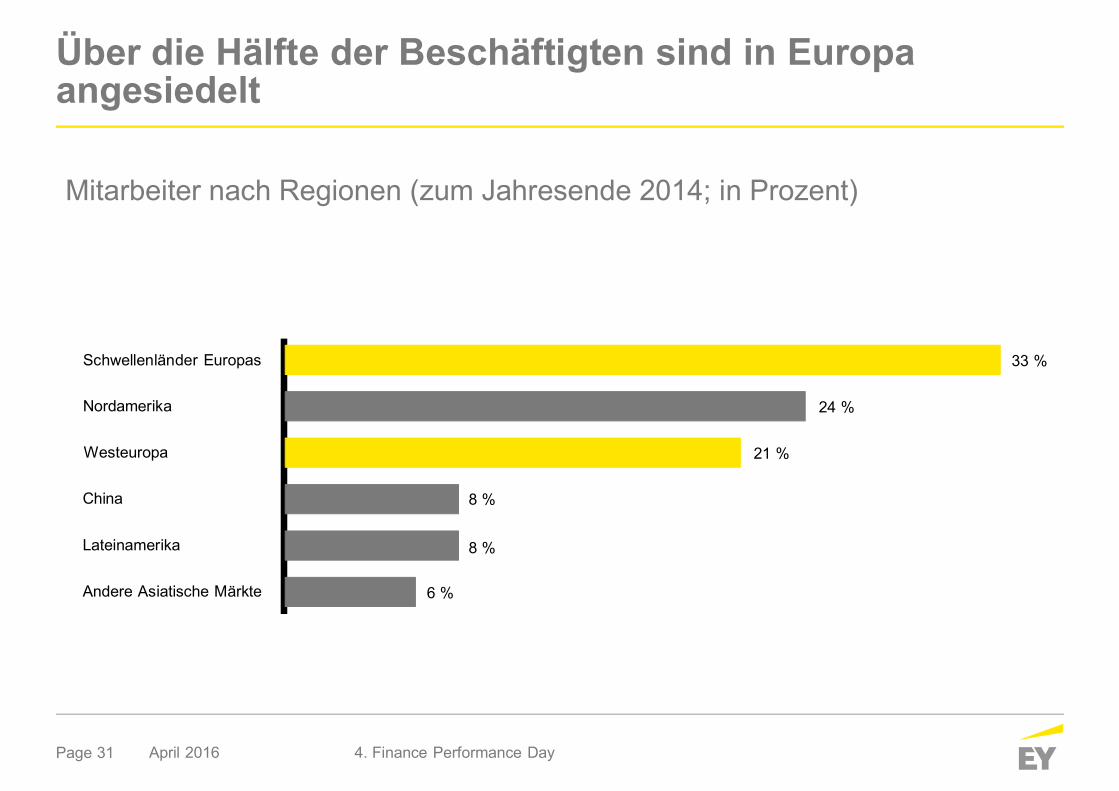
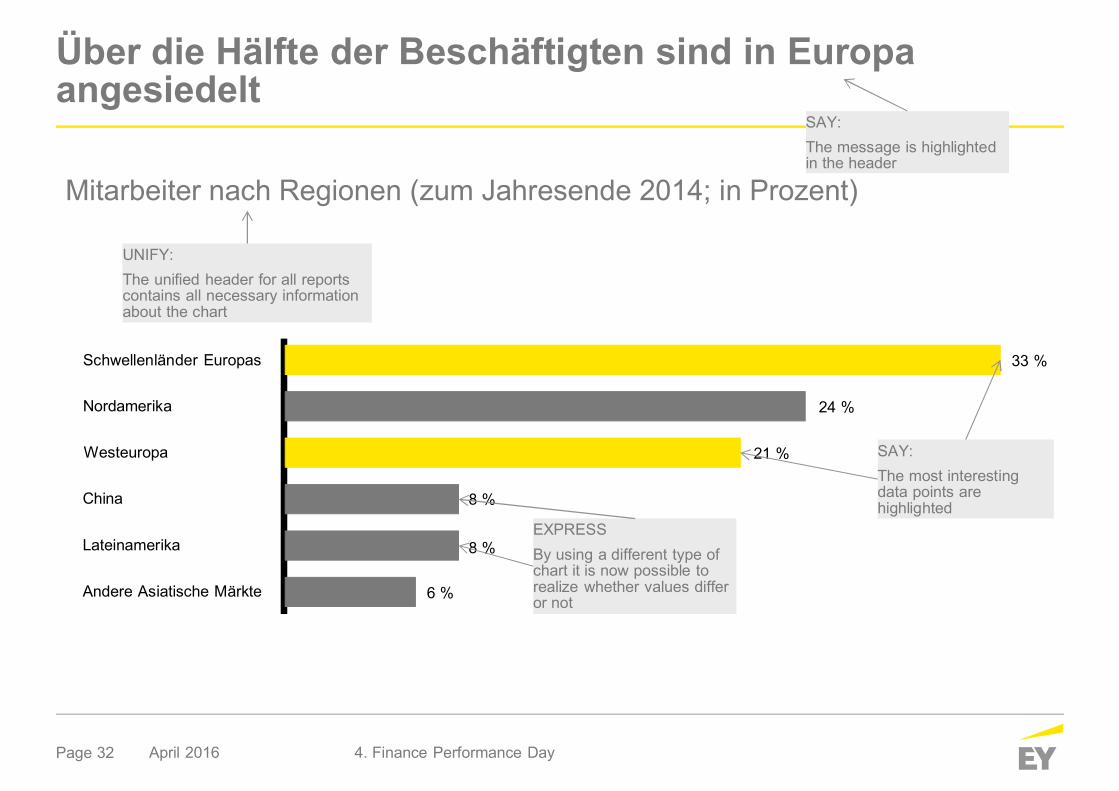
Über die Hälfte der Beschäftigten sind in Europaangesiedelt
April 2016 4. Finance Performance Day
Mitarbeiter nach Regionen (zum Jahresende 2014; in Prozent)
Schwellenländer Europas
Nordamerika
Westeuropa
China
Lateinamerika
Andere Asiatische Märkte
33 %
24 %
21 %
8 %
8 %
6 %
Page 32
Über die Hälfte der Beschäftigten sind in Europaangesiedelt
April 2016 4. Finance Performance Day
Mitarbeiter nach Regionen (zum Jahresende 2014; in Prozent)
Schwellenländer Europas
Nordamerika
Westeuropa
China
Lateinamerika
Andere Asiatische Märkte
33 %
24 %
21 %
8 %
8 %
6 %
SAY:The message is highlightedin the header
EXPRESSBy using a different type ofchart it is now possible torealize whether values differor not
SAY:The most interestingdata points arehighlighted
UNIFY:The unified header for all reportscontains all necessary informationabout the chart
Page 33
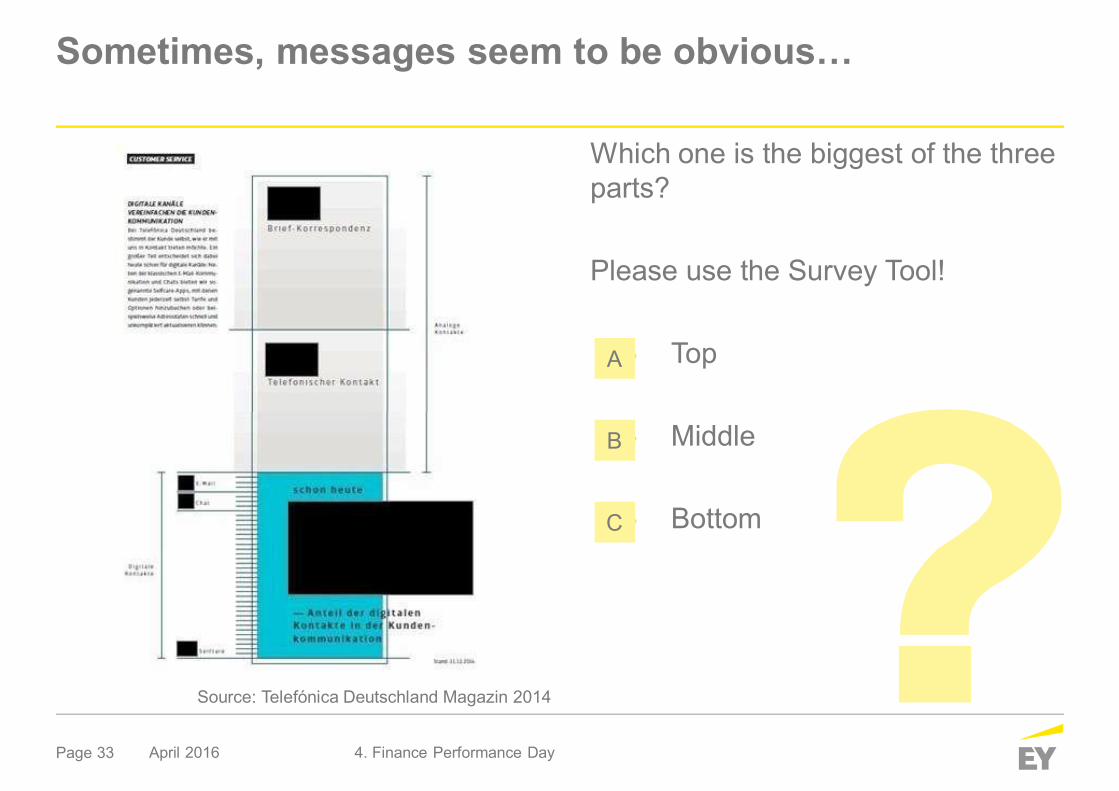
Sometimes, messages seem to be obvious…
April 2016 4. Finance Performance Day
Which one is the biggest of the threeparts?
Please use the Survey Tool!
• Top
• Middle
• Bottom
A
B
C
Source: Telefónica Deutschland Magazin 2014
Page 34
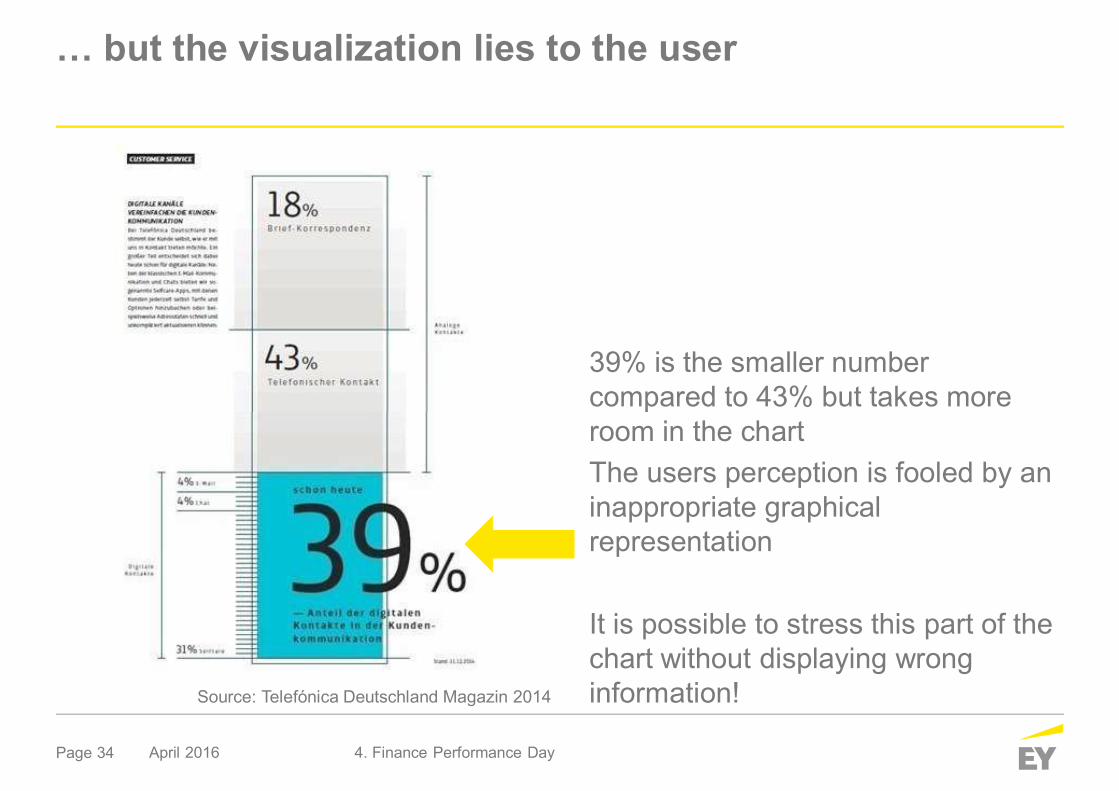
… but the visualization lies to the user
April 2016 4. Finance Performance Day
39% is the smaller numbercompared to 43% but takes moreroom in the chartThe users perception is fooled by aninappropriate graphicalrepresentation
It is possible to stress this part of thechart without displaying wronginformation!Source: Telefónica Deutschland Magazin 2014
Page 35
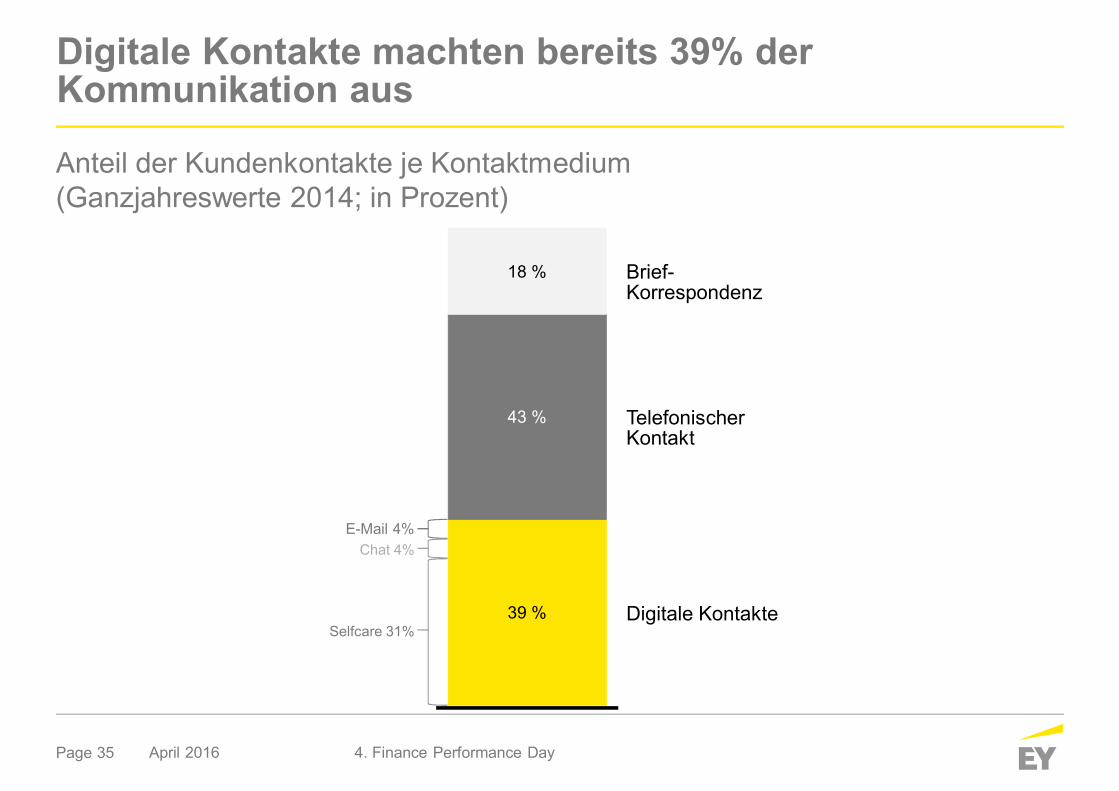
Digitale Kontakte machten bereits 39% derKommunikation aus
April 2016 4. Finance Performance Day
39 %
43 %
18 % Brief-Korrespondenz
TelefonischerKontakt
Digitale Kontakte
E-Mail 4%Chat 4%
Selfcare 31%
Anteil der Kundenkontakte je Kontaktmedium(Ganzjahreswerte 2014; in Prozent)
Page 36
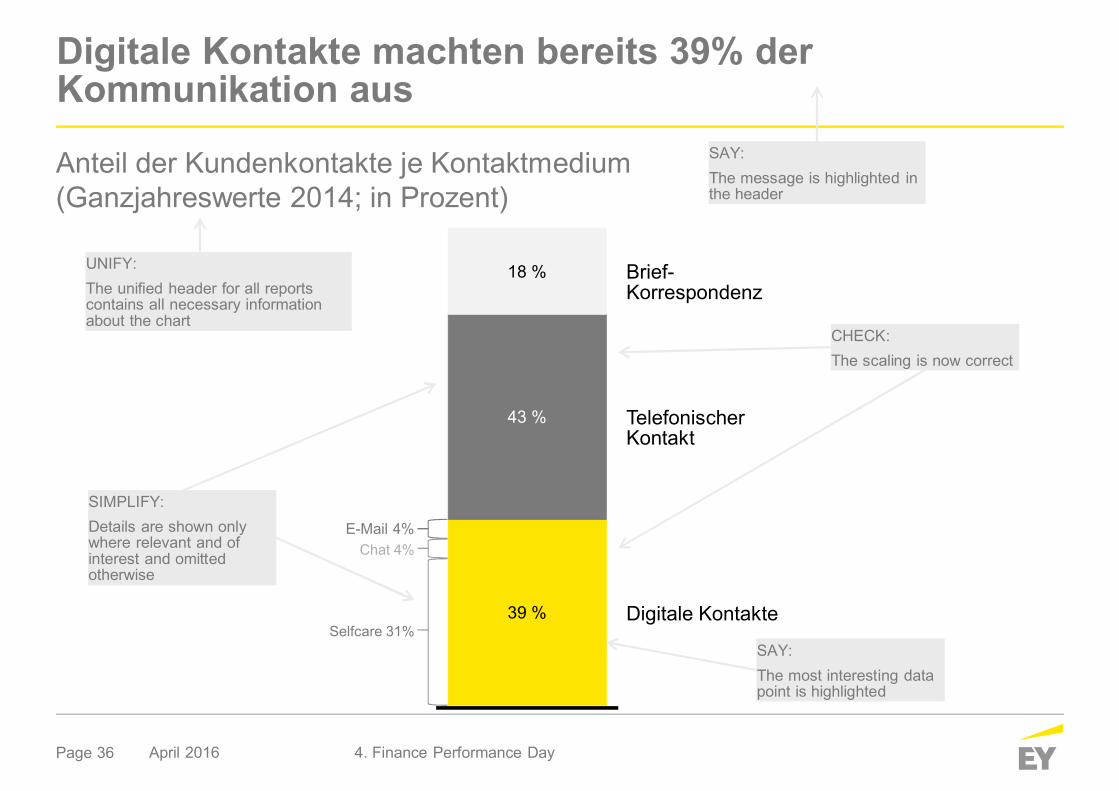
Digitale Kontakte machten bereits 39% derKommunikation aus
April 2016 4. Finance Performance Day
39 %
43 %
18 % Brief-Korrespondenz
TelefonischerKontakt
Digitale Kontakte
E-Mail 4%Chat 4%
Selfcare 31%SAY:The most interesting datapoint is highlighted
SIMPLIFY:Details are shown onlywhere relevant and ofinterest and omittedotherwise
CHECK:The scaling is now correct
SAY:The message is highlighted inthe header
Anteil der Kundenkontakte je Kontaktmedium(Ganzjahreswerte 2014; in Prozent)
UNIFY:The unified header for all reportscontains all necessary informationabout the chart
Page 37
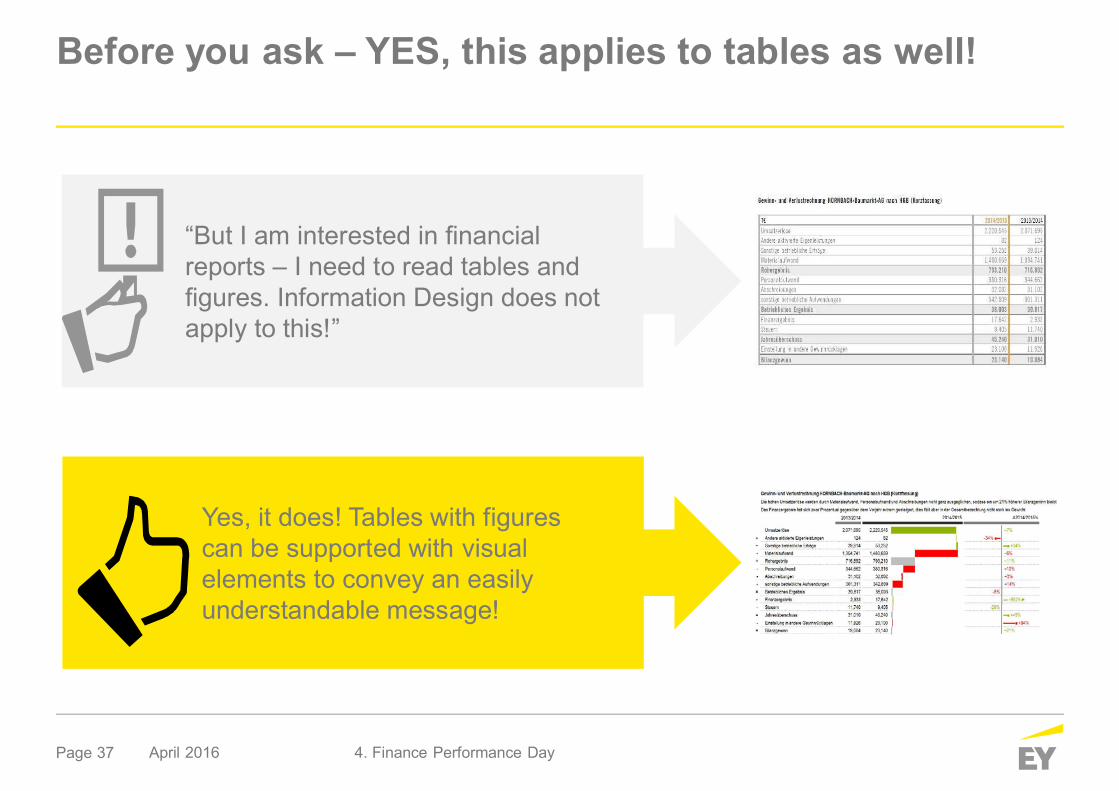
Before you ask – YES, this applies to tables as well!
April 2016 4. Finance Performance Day
“But I am interested in financialreports – I need to read tables andfigures. Information Design does notapply to this!”
Yes, it does! Tables with figurescan be supported with visualelements to convey an easilyunderstandable message!
Page 38
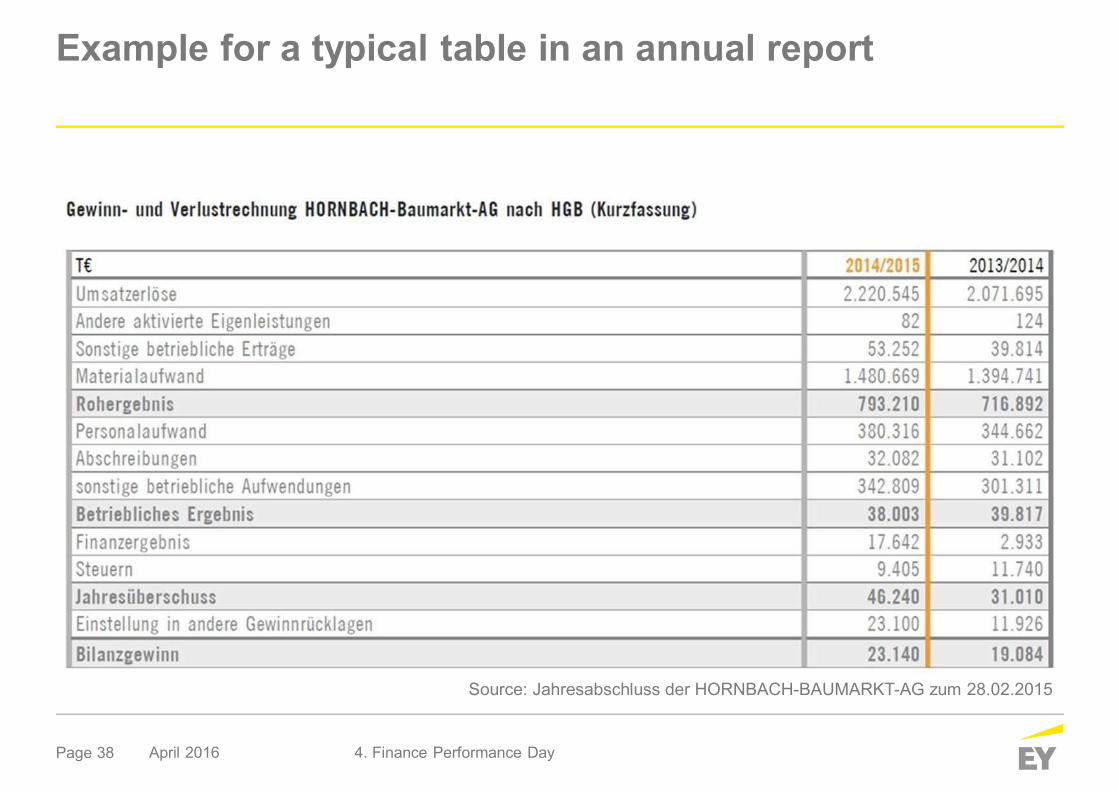
Example for a typical table in an annual report
April 2016 4. Finance Performance Day
Source: Jahresabschluss der HORNBACH-BAUMARKT-AG zum 28.02.2015
Page 39
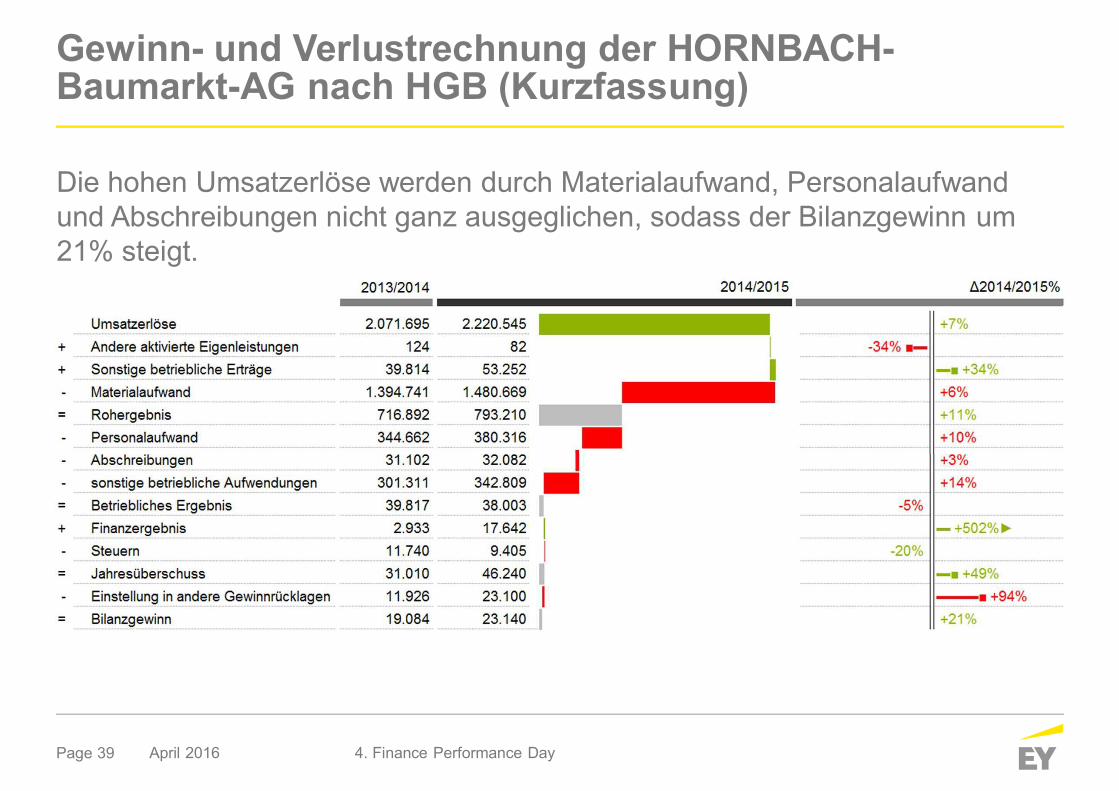
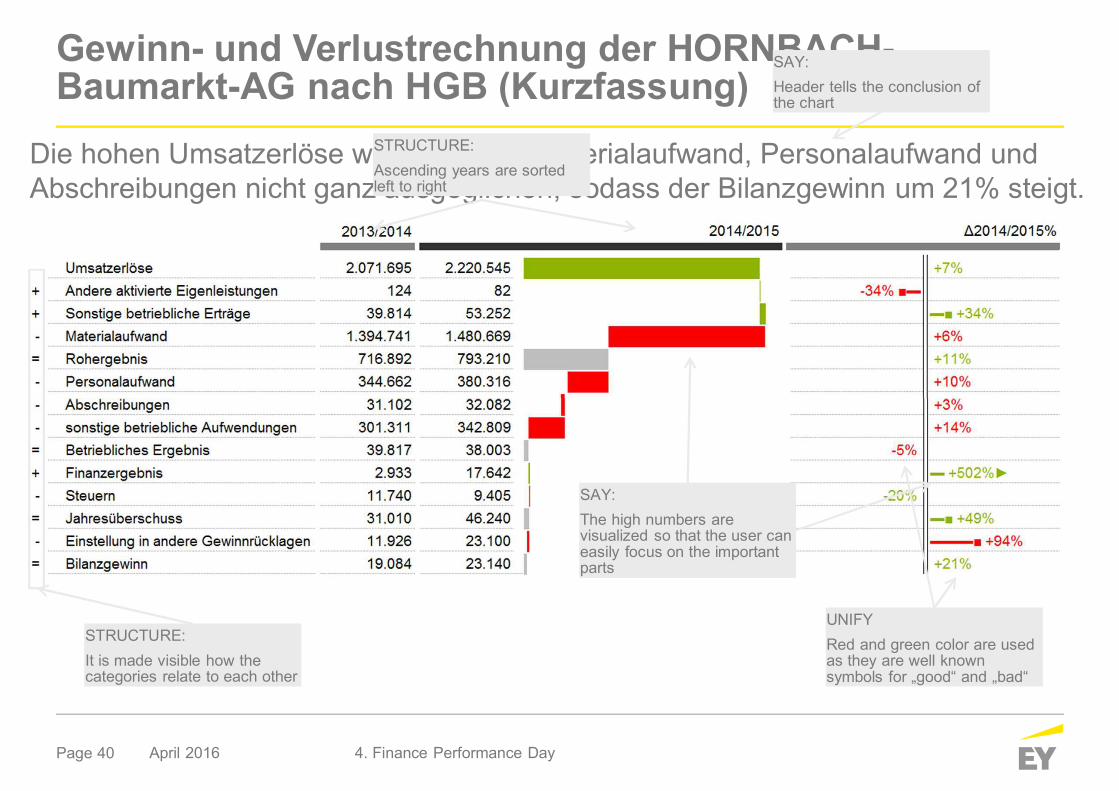
Gewinn- und Verlustrechnung der HORNBACH-Baumarkt-AG nach HGB (Kurzfassung)
April 2016 4. Finance Performance Day
Die hohen Umsatzerlöse werden durch Materialaufwand, Personalaufwandund Abschreibungen nicht ganz ausgeglichen, sodass der Bilanzgewinn um21% steigt.
Page 40
Gewinn- und Verlustrechnung der HORNBACH-Baumarkt-AG nach HGB (Kurzfassung)
April 2016 4. Finance Performance Day
Die hohen Umsatzerlöse werden durch Materialaufwand, Personalaufwand undAbschreibungen nicht ganz ausgeglichen, sodass der Bilanzgewinn um 21% steigt.
STRUCTURE:Ascending years are sortedleft to right
SAY:Header tells the conclusion ofthe chart
SAY:The high numbers arevisualized so that the user caneasily focus on the importantparts
STRUCTURE:It is made visible how thecategories relate to each other
UNIFYRed and green color are usedas they are well knownsymbols for „good“ and „bad“
Page 41
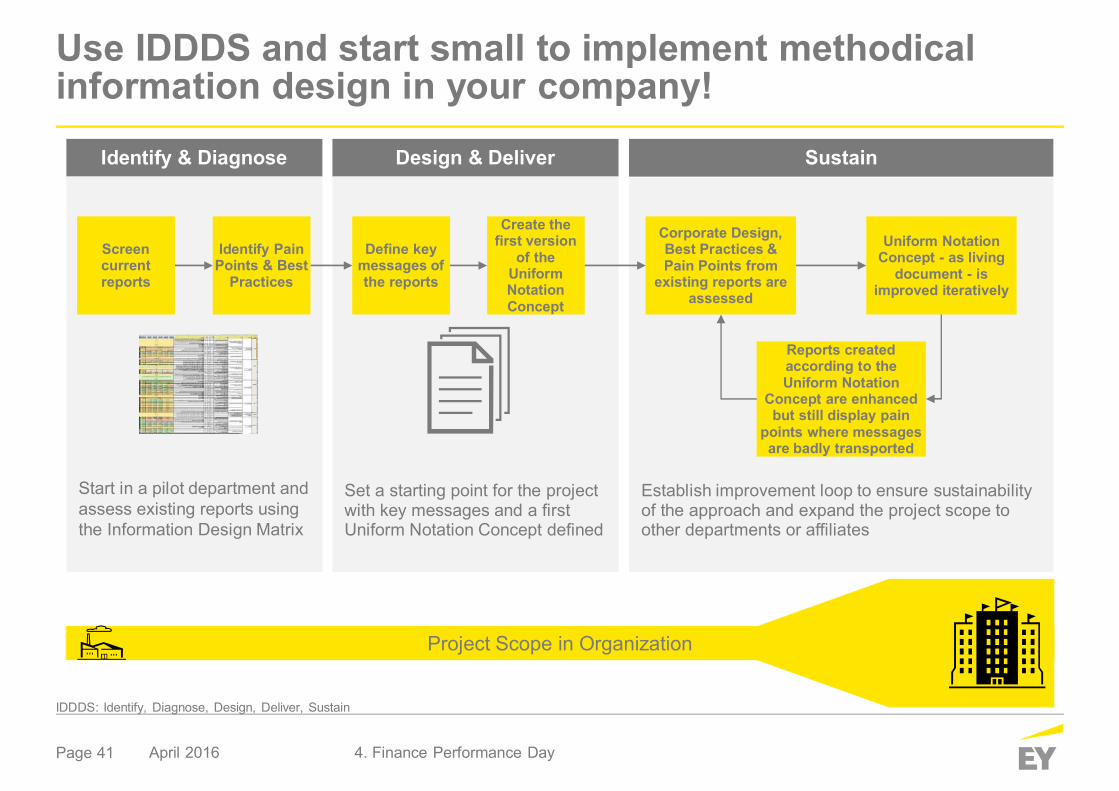
Use IDDDS and start small to implement methodicalinformation design in your company!
April 2016 4. Finance Performance Day
Identify & Diagnose Design & Deliver Sustain
Start in a pilot department andassess existing reports usingthe Information Design Matrix
Set a starting point for the projectwith key messages and a firstUniform Notation Concept defined
Establish improvement loop to ensure sustainabilityof the approach and expand the project scope toother departments or affiliates
Define keymessages ofthe reports
Create thefirst version
of theUniformNotationConcept
Identify PainPoints & Best
Practices
Screencurrentreports
Corporate Design,Best Practices &Pain Points from
existing reports areassessed
Uniform NotationConcept - as living
document - isimproved iteratively
Reports createdaccording to theUniform Notation
Concept are enhancedbut still display pain
points where messagesare badly transported
Project Scope in Organization
IDDDS: Identify, Diagnose, Design, Deliver, Sustain
Page 42 April 2016 4. Finance Performance Day
The efficiency of BI depends on interpretability of theresulting reports…
… and thus can be improved with Methodical InformationDesign
Page 43
Ihre Ansprechpartner
April 2016 4. Finance Performance Day
Oliver Becker
Partner
Ernst & Young GmbHWirtschaftsprüfungsgesellschaft
Graf-Adolf-Platz 15 40213DüsseldorfTelefon +49 211 9352 18655Mobil +49 (160) 939 [email protected]
Damir Zubobiv
Executive Director
Ernst & Young GmbHWirtschaftsprüfungsgesellschaft
Theodor-Heuss-Anlage 268165 MannheimTelefon +49 621 4208 20112Mobil +49 (160) 939 [email protected]
Page 44
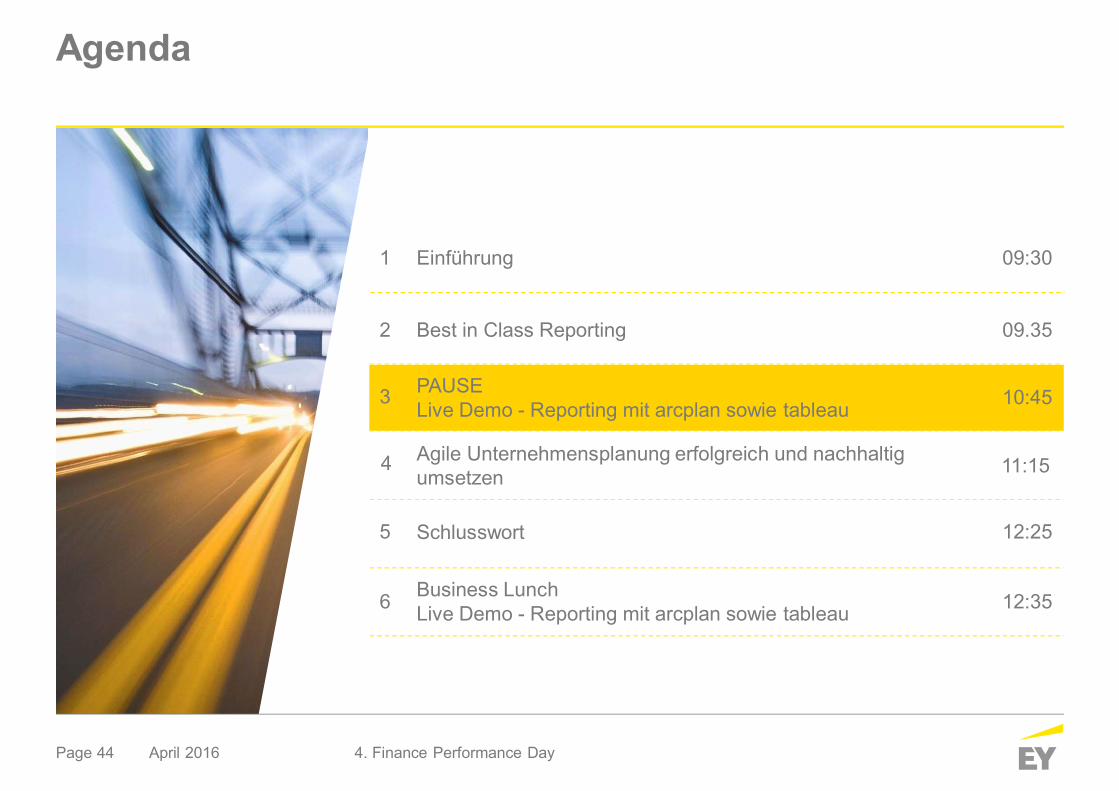
Agenda
Einführung1 09:30
Agile Unternehmensplanung erfolgreich und nachhaltigumsetzen
3
11:15
Best in Class Reporting2 09.35
10:45
5 12:25
Business LunchLive Demo - Reporting mit arcplan sowie tableau6 12:35
April 2016 4. Finance Performance Day
Schlusswort
PAUSELive Demo - Reporting mit arcplan sowie tableau
4
Page 45
Ihre Ansprechpartner
April 2016 4. Finance Performance Day
Alexandra Knestel
Manager - arcplan
Ernst & Young GmbHWirtschaftsprüfungsgesellschaft
Arnulfstraße 5980636 MünchenTelefon +49 9352 16022Mobil +49 (160) 939 [email protected]
Matthias Kopp
Senior - tableau
Ernst & Young GmbHWirtschaftsprüfungsgesellschaftStuttgart F61Flughafenstraße 6170629 StuttgartTelefon +49 711 9881 19104Mobil +49 (160) 939 [email protected]
Page 46
Agenda
Einführung1 09:30
Agile Unternehmensplanung erfolgreich und nachhaltigumsetzen
3
11:15
Best in Class Reporting2 09.35
10:45
5 12:25
Business LunchLive Demo - Reporting mit arcplan sowie tableau6 12:35
April 2016 4. Finance Performance Day
Schlusswort
PAUSELive Demo - Reporting mit arcplan sowie tableau
4
Page 47
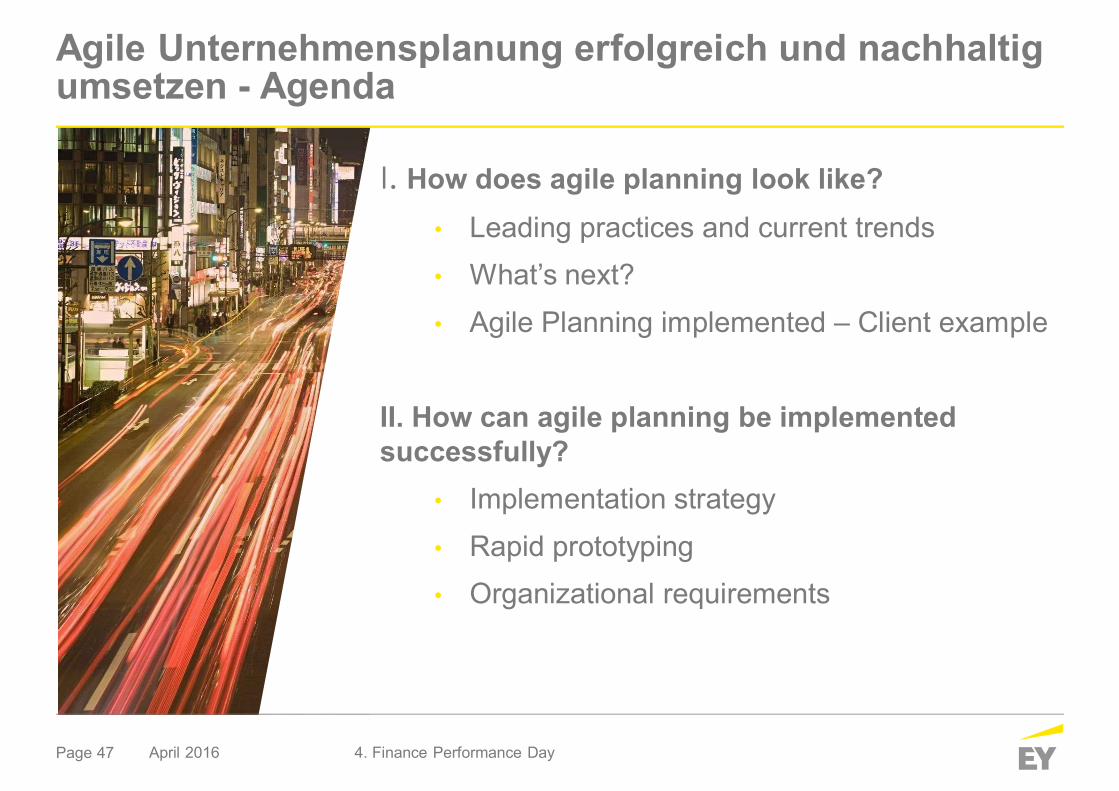
Agile Unternehmensplanung erfolgreich und nachhaltigumsetzen - Agenda
April 2016 4. Finance Performance Day
I. How does agile planning look like?• Leading practices and current trends• What’s next?• Agile Planning implemented – Client example
II. How can agile planning be implementedsuccessfully?
• Implementation strategy• Rapid prototyping• Organizational requirements
Page 48
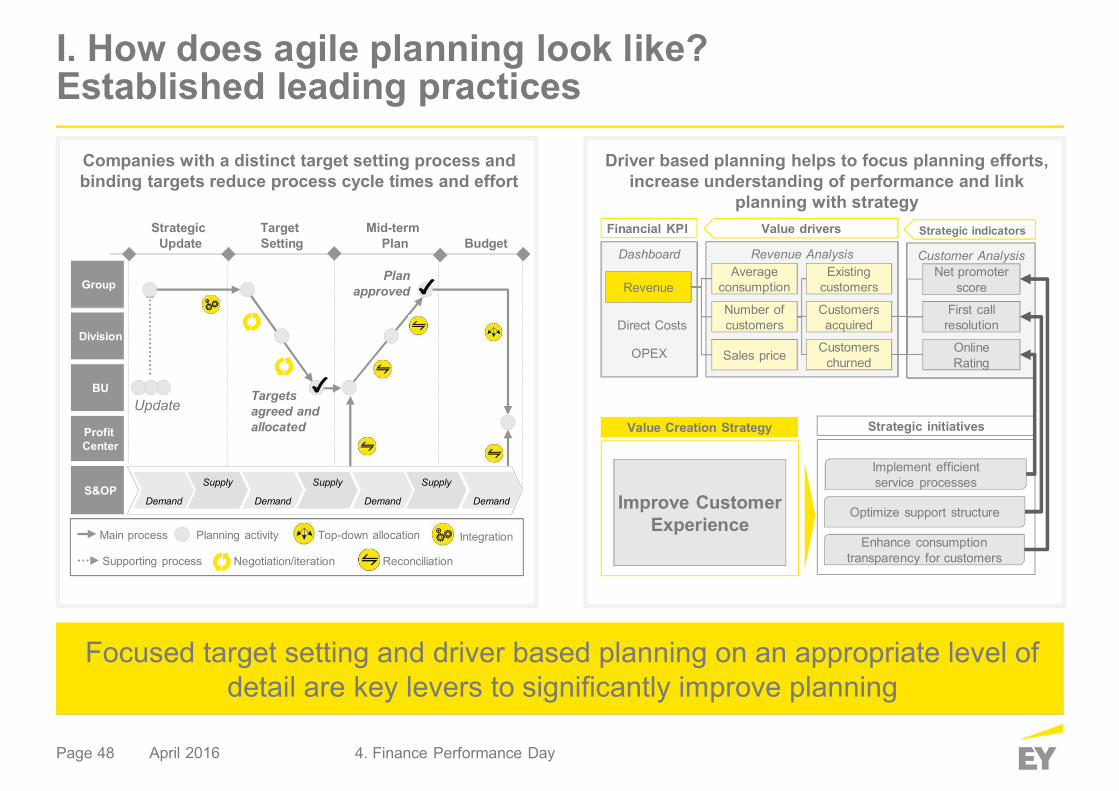
Companies with a distinct target setting process andbinding targets reduce process cycle times and effort
I. How does agile planning look like?Established leading practices
April 2016
Focused target setting and driver based planning on an appropriate level ofdetail are key levers to significantly improve planning
Driver based planning helps to focus planning efforts,increase understanding of performance and link
planning with strategy
Customer AnalysisDashboard
Revenue
Direct Costs
OPEX
Value driversFinancial KPI
Revenue AnalysisExisting
customers
Customersacquired
Customerschurned
Averageconsumption
Number ofcustomers
Sales price
Net promoterscore
First callresolution
OnlineRating
Strategic initiativesValue Creation Strategy
Improve CustomerExperience
Strategic indicators
Implement efficientservice processes
Enhance consumptiontransparency for customers
Optimize support structure
Group
Division
BU
ProfitCenter
Mid-termPlan Budget
StrategicUpdate
UpdateTargetsagreed andallocated
Supporting process
Main process
Reconciliation
Top-down allocationPlanning activity
TargetSetting
Planapproved
S&OP
Integration
Negotiation/iteration
Demand Demand
Supply
Demand
Supply Supply
Demand
4. Finance Performance Day
Page 49
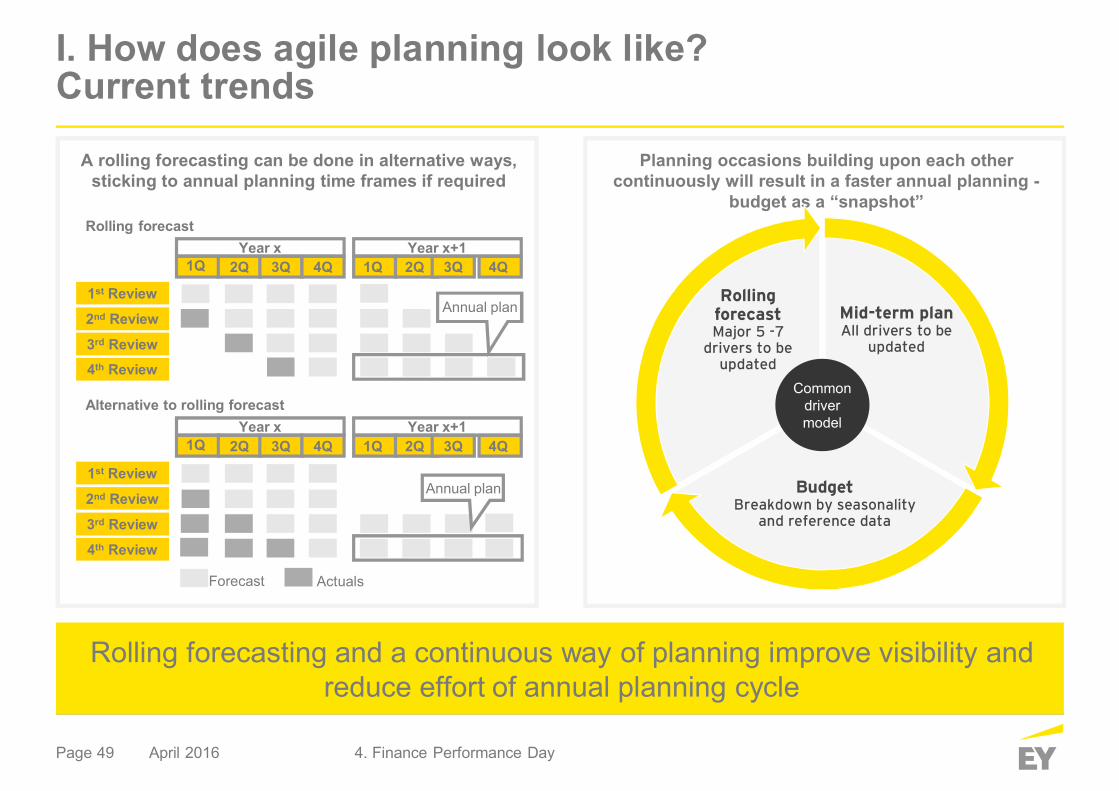
A rolling forecasting can be done in alternative ways,sticking to annual planning time frames if required
I. How does agile planning look like?Current trends
April 2016
Rolling forecasting and a continuous way of planning improve visibility andreduce effort of annual planning cycle
Planning occasions building upon each othercontinuously will result in a faster annual planning -
budget as a “snapshot”
1st Review
1Q 2Q 3Q 4Q 1Q 2Q 3Q 4QYear x Year x+1
2nd Review
3rd Review
4th Review
Annual plan
Actuals
2nd Review
1Q 2Q 3Q 4Q 1Q 2Q 3Q 4QYear x Year x+1
3rd Review
4th Review
Forecast
Alternative to rolling forecast
Rolling forecast
1st ReviewAnnual plan
Mid-term planAll drivers to be
updated
BudgetBreakdown by seasonality
and reference data
RollingforecastMajor 5 -7
drivers to beupdated
Commondrivermodel
4. Finance Performance Day
Page 50
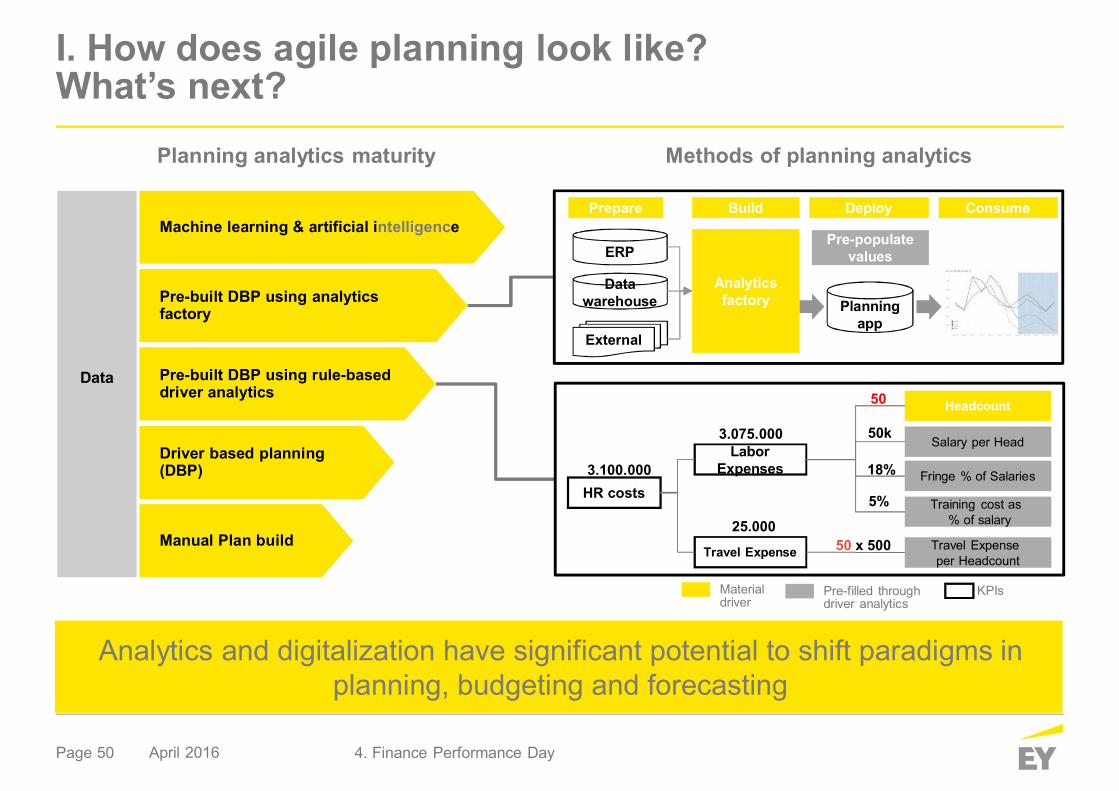
I. How does agile planning look like?What’s next?
April 2016
Pre-filled throughdriver analytics
KPIs
Data
Driver based planning(DBP)
Pre-built DBP using rule-baseddriver analytics
Manual Plan build
Machine learning & artificial intelligence
Pre-built DBP using analyticsfactory
HR costs
Headcount
Salary per Head
Travel Expense
LaborExpenses Fringe % of Salaries
Training cost as% of salary
Travel Expenseper Headcount
50
50k
18%
5%
3.075.000
50 x 50025.000
3.100.000
Prepare Build Deploy Consume
ERP
Datawarehouse
External
Analyticsfactory
Pre-populatevalues
Planningapp
Materialdriver
Planning analytics maturity Methods of planning analytics
Analytics and digitalization have significant potential to shift paradigms inplanning, budgeting and forecasting
4. Finance Performance Day
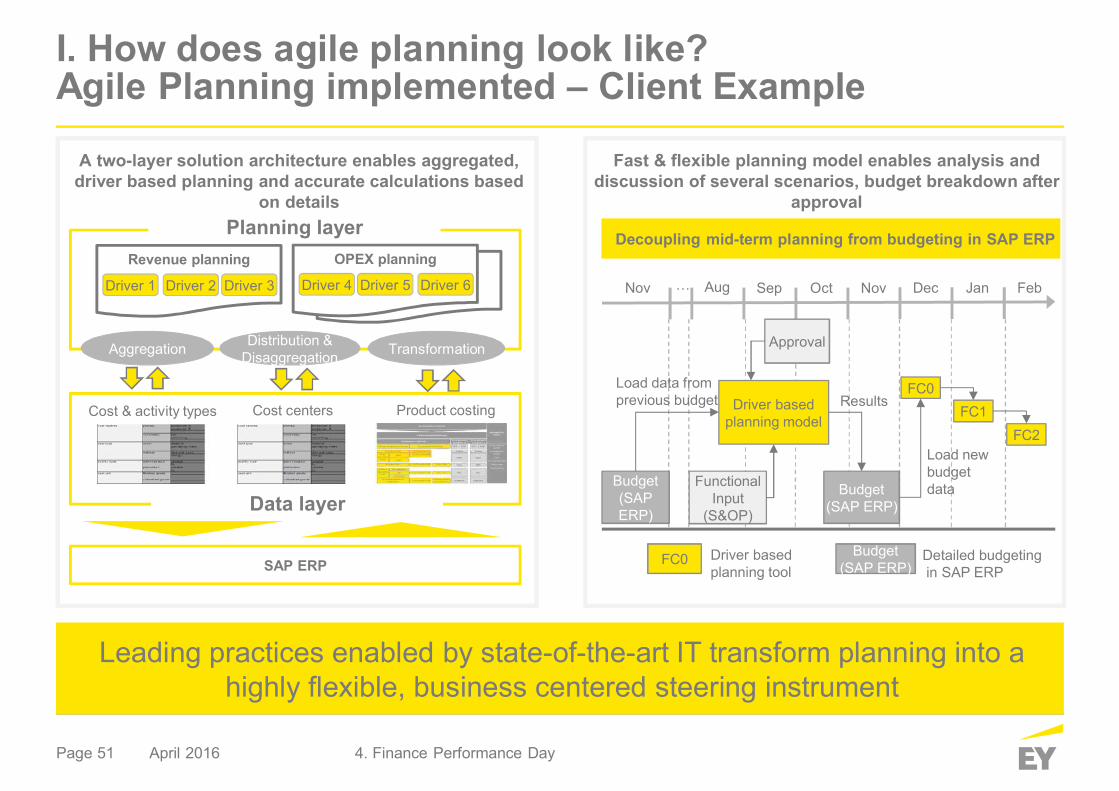
Page 51
A two-layer solution architecture enables aggregated,driver based planning and accurate calculations based
on details
Data layer
I. How does agile planning look like?Agile Planning implemented – Client Example
April 2016
Leading practices enabled by state-of-the-art IT transform planning into ahighly flexible, business centered steering instrument
Fast & flexible planning model enables analysis anddiscussion of several scenarios, budget breakdown after
approval
Aggregation Distribution &Disaggregation Transformation
Cost & activity types Cost centers
Revenue planning
Driver 1 Driver 2 Driver 3…OPEX planning
Driver 4 Driver 5 Driver 6
Product costing
Planning layer
SAP ERPBudget
(SAP ERP)FC0 Driver basedplanning tool
Detailed budgetingin SAP ERP
Aug Sep Oct Nov DecNov … Jan Feb
Budget(SAPERP)
Budget(SAP ERP)
Driver basedplanning model
FC0FC1
FC2
Load data fromprevious budget
Load newbudgetdata
Results
FunctionalInput
(S&OP)
Approval
Decoupling mid-term planning from budgeting in SAP ERP
4. Finance Performance Day
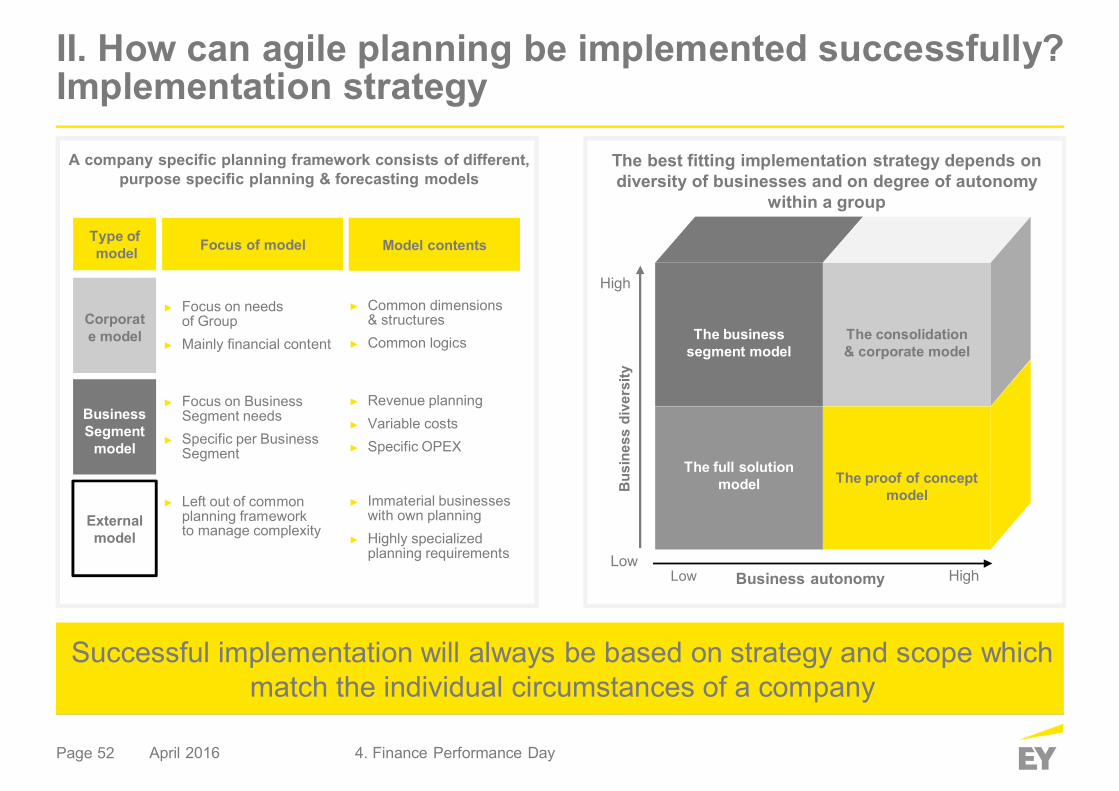
Page 52
A company specific planning framework consists of different,purpose specific planning & forecasting models
II. How can agile planning be implemented successfully?Implementation strategy
April 2016
Successful implementation will always be based on strategy and scope whichmatch the individual circumstances of a company
The best fitting implementation strategy depends ondiversity of businesses and on degree of autonomy
within a group
Corporate model
BusinessSegment
model
Externalmodel
Common dimensions& structuresCommon logics
Revenue planningVariable costsSpecific OPEX
Immaterial businesseswith own planningHighly specializedplanning requirements
Focus on needsof GroupMainly financial content
Focus on BusinessSegment needsSpecific per BusinessSegment
Left out of commonplanning frameworkto manage complexity
Type ofmodel Focus of model Model contents
The businesssegment model
The consolidation& corporate model
The full solutionmodel The proof of concept
model
HighLowLow
High
Business autonomy
4. Finance Performance Day
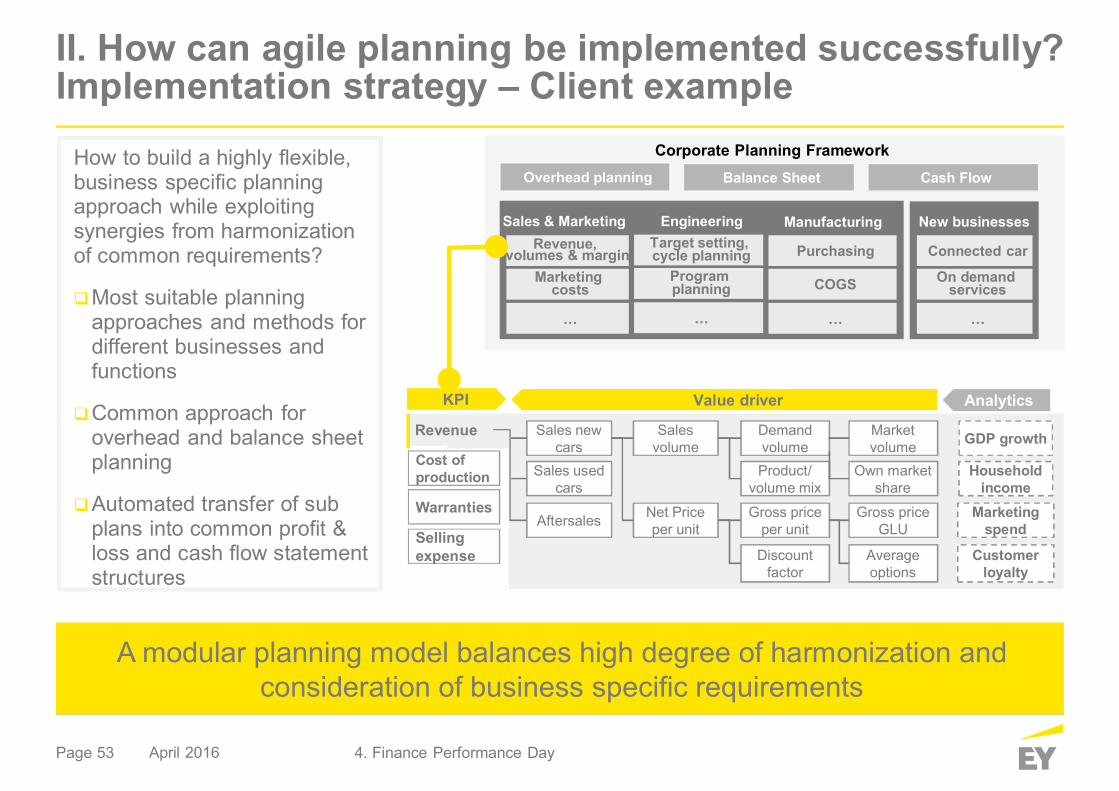
Page 53
II. How can agile planning be implemented successfully?Implementation strategy – Client example
April 2016
How to build a highly flexible,business specific planningapproach while exploitingsynergies from harmonizationof common requirements?
Most suitable planningapproaches and methods fordifferent businesses andfunctions
Common approach foroverhead and balance sheetplanning
Automated transfer of subplans into common profit &loss and cash flow statementstructures
Overhead planning Balance Sheet Cash Flow
Corporate Planning Framework
Sellingexpense
Revenue
Cost ofproduction
Warranties
Value driver
Salesvolume
Net Priceper unit
Marketvolume
Own marketshare
GDP growth
Householdincome
Marketingspend
DemandvolumeProduct/
volume mix
Gross priceGLU
Averageoptions
Gross priceper unit
Discountfactor
Customerloyalty
Sales newcars
Sales usedcars
Aftersales
KPI Analytics
Sales & Marketing Engineering Manufacturing New businessesRevenue,
volumes & marginMarketing
costs
…
Target setting,cycle planning
Programplanning
…
Purchasing
COGS
…
Connected car
On demandservices
…
A modular planning model balances high degree of harmonization andconsideration of business specific requirements
4. Finance Performance Day
Page 54
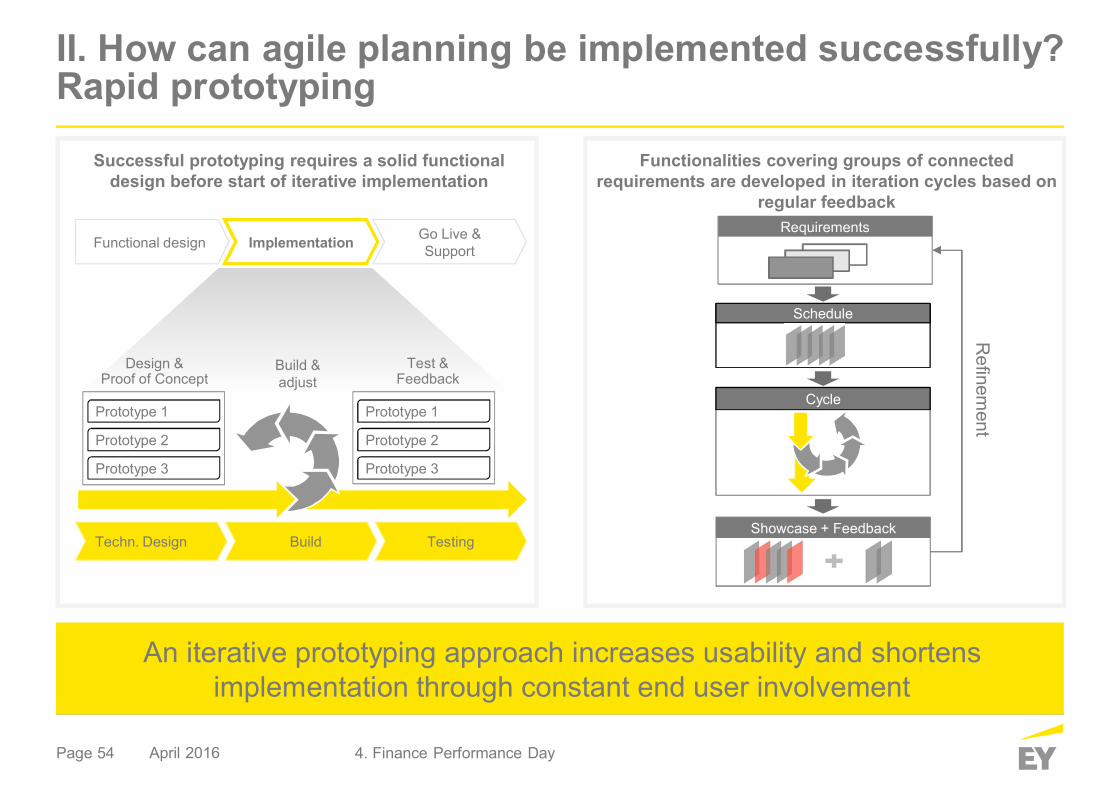
Successful prototyping requires a solid functionaldesign before start of iterative implementation
II. How can agile planning be implemented successfully?Rapid prototyping
April 2016
An iterative prototyping approach increases usability and shortensimplementation through constant end user involvement
Functionalities covering groups of connectedrequirements are developed in iteration cycles based on
regular feedback
Techn. Design TestingBuild
Prototype 1
Design &Proof of Concept
Test &Feedback
Prototype 2
Prototype 3
Prototype 1
Prototype 2
Prototype 3
Build &adjust
Functional design Implementation Go Live &Support
Requirements
Cycle
Schedule
Showcase + Feedback
4. Finance Performance Day
Page 55
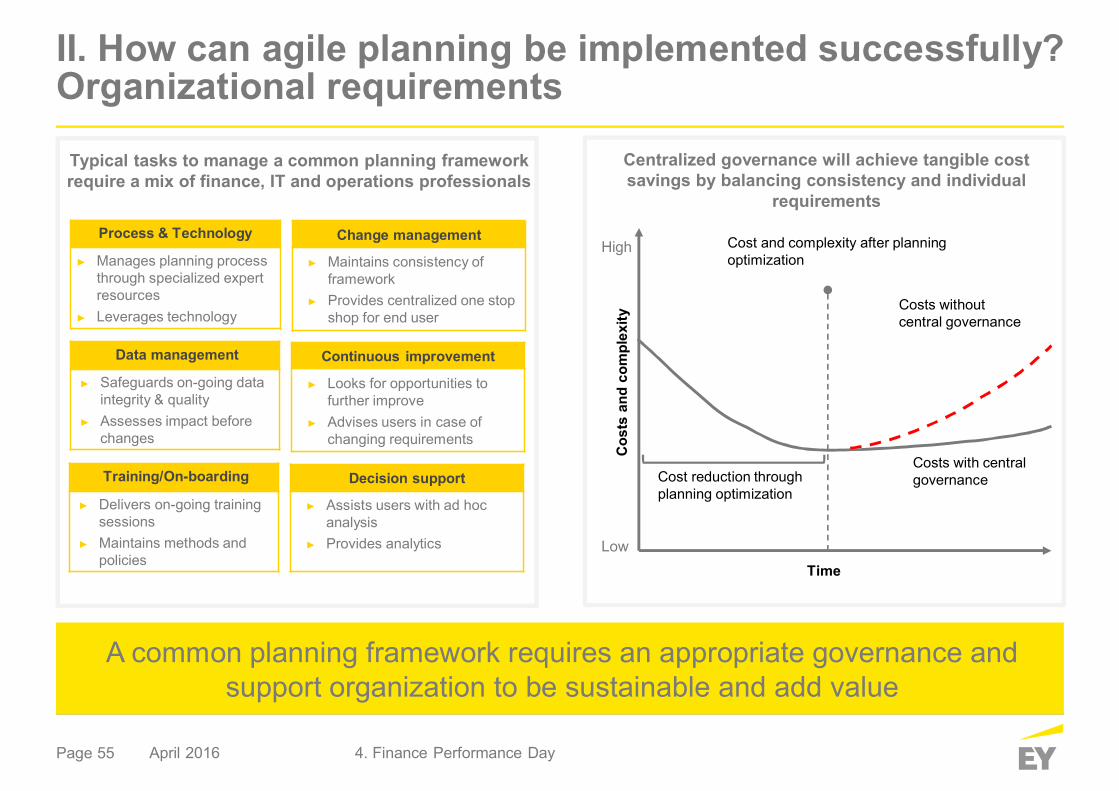
Typical tasks to manage a common planning frameworkrequire a mix of finance, IT and operations professionals
II. How can agile planning be implemented successfully?Organizational requirements
April 2016
A common planning framework requires an appropriate governance andsupport organization to be sustainable and add value
Centralized governance will achieve tangible costsavings by balancing consistency and individual
requirements
Cost reduction throughplanning optimization
Cost and complexity after planningoptimization
Costs withoutcentral governance
Costs with centralgovernance
Low
High
Time
Process & Technology
Manages planning processthrough specialized expertresourcesLeverages technology
Change management
Maintains consistency offrameworkProvides centralized one stopshop for end user
Data management
Safeguards on-going dataintegrity & qualityAssesses impact beforechanges
Continuous improvement
Looks for opportunities tofurther improveAdvises users in case ofchanging requirements
Training/On-boarding
Delivers on-going trainingsessionsMaintains methods andpolicies
Decision support
Assists users with ad hocanalysisProvides analytics
4. Finance Performance Day
Page 56
Ihre Ansprechpartner
April 2016 4. Finance Performance Day
Csaba Orban
Partner
Ernst & Young GmbHWirtschaftsprüfungsgesellschaft
Mergenthalerallee 3-565760 EschbornTelefon +49 6196 996 20275Mobil +49 (160) 939 [email protected]
Page 57
Agenda
Einführung1 09:30
Agile Unternehmensplanung erfolgreich und nachhaltigumsetzen
3
11:15
Best in Class Reporting2 09.35
10:45
5 12:25
Business LunchLive Demo - Reporting mit arcplan sowie tableau6 12:35
April 2016 4. Finance Performance Day
Schlusswort
PAUSELive Demo - Reporting mit arcplan sowie tableau
4
Page 58
Hinweise zu dieser Präsentation
Die im Rahmen dieser Präsentation zur Verfügung gestellten Informationen können naturgemäß wederallumfassend noch auf die speziellen Bedürfnisse eines bestimmten Einzelfalls zugeschnitten sein. Siebegründen keine Beratung, keine andere Form rechtsverbindlicher Auskünfte oder ein rechtsverbindlichesAngebot unsererseits.Diese Präsentation beruht auf dem Rechtsstand zum Zeitpunkt des Datums dieser Präsentation und gibt unsereInterpretation der relevanten gesetzlichen Bestimmungen und die hierzu ergangene Rechtsprechung wieder.Im Zeitablauf treten Änderungen bei Gesetzen, der Interpretation von Rechtsquellen sowie in derRechtsprechung ein. Derartige Änderungen können eine Fortschreibung dieser Präsentation erforderlich machen.Wir weisen ausdrücklich darauf hin, dass wir ohne gesonderten Auftrag nicht verpflichtet sind, diese Präsentationaufgrund einer Änderung der zugrunde liegenden Fakten bzw. Annahmen oder Änderungen in der Gesetzgebungoder Rechtsprechung zu überprüfen und gegebenenfalls fortzuschreiben.Wir übernehmen keine Gewährleistung oder Garantie für Richtigkeit oder Vollständigkeit der Inhalte dieserPräsentation. Soweit gesetzlich zulässig, übernehmen wir keine Haftung für ein Tun oder Unterlassen, das Sieallein auf Informationen aus dieser Präsentation gestützt haben. Dies gilt auch dann, wenn diese Informationenungenau oder unrichtig gewesen sein sollten.
April 2016 4. Finance Performance Day