Embed Size (px)
Citation preview
4 D-71 82256 WfAlHNER RADAR STUDIfi~(U) 14A %CHIJ$ £15 NS OF "ECH4 vYX M_ TON LINCOLN iAB D M E BRE A 31 "N 86
U NLS A-D-85-1-JOL-1 0/A/P-7/1 F19628-85-i-M42UNCLASSIFIED/2 M
- -!
I-l.0_
Fl3,6
Nis
L4
ji, j255 Q
C4
a
As_
1UUCALI ER UOMIATWu PAR
17DOT/VAI.JPMAI/13 Irc ______
51 Mauch 1961Weather Ruer stes WftWO W
David . Brsefla
ILUin ww- smu ad In .WA WE
Muummbmoma Iasitsm of TeebaegyUmoela Lobwraar IV. 0=01116muP.O. les 73 1T#A6lY-SIfM
Iaeingtoo6 KA 961734673Isa mit~mit %=a mu- w- I m Suamawa Teebstlea Sumar
Dearmewt of Trenpareaul I October Ins -531 March 1116Fede"a Aviaiste. AdmialemratmSysonme 3.me owd Davepst Service k MuVaesses6 DC 3591
The wwrS reported is this deimnt wee ps fura at Usesia Leberatey, a eowt far research operatedby Mainacbmamma lositutse of Teclmohp, iue Air Fore Castimet F19US.61.C4M.
FAA4smded Doppler weather radar activities dorlag the peried I Osheer IMW to.1 Mauch ION am'
Mwa FL41 Doppler weather Wada too bed ind mselmed mosawat systen -dee dew from manews
theiuderiterm aid ember wbe phemm is the Memophin, Tenessee, was inmmUlo Nov @baver. Dunes
th aysho himsdt I Ib ei-a I l dam.m said lwds eaeis at 1 eamminaws toa hom sCAeau
rim.FL re. a d assume m won alganis puked mb smm dAtetos '1d pamlpedlm@ Wer athsyeamar re-a pbm inamw a Ns eabem. no pla m wease emA Ime mi reburaesmsy sid Marc al s
aid nwmm "Me " 6wifem mq n do" I 00 the - inaerswa -waw
0 - 611 A~b13
Wark wesso si dNS mm.?d -f FU dew mi -h noeiwno oisw orswP Rsi
WK sprlom TO &dwsmofokwlboVlo d soenti desslo ad osibl p-1- o
ABSTRACT
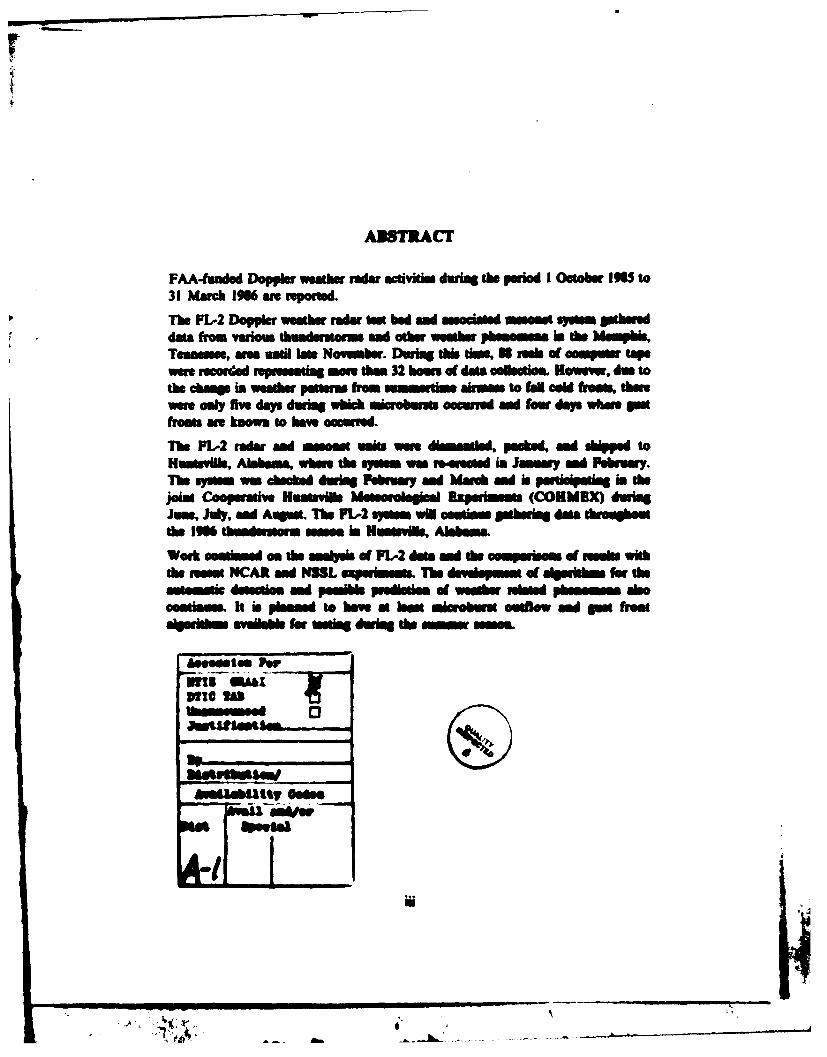
FAA4feuded Doppler weather radar activities durning the period I Oftor IM6 to31 March ION6 ane repofihd.
The P1-2 Doppler weather radar t bed ad amnouietd mmosat eying. Pilutddata from various thaatnuemd oher weather Phenomenon inthe Moephis,Teameseme, ame untdl late November. Durling this dae, N resk G( ompuer tapewere fecofded reproeneohl sm then 32 home ot data .eoemime Howevor, due tothe change is Weather Iatter from inm~mirmmm to fan cold fr.ow themewet only fv days during which witobum m esomred ad four days where putfrom"s an kam to have NOccur-d
The P1-2 radar ad augmost uaits weediesmatled, pooked, and ehipped toHuatsvills, Alehm., where the syatemm w krced Jamey .ini February.7he system wasn chocked during Februay an March and is potlsipatlng in the
jostCopraiv Naevll M WOroce xetmt (CORUM duringJaw July, and Assume. The 7142 ymes. will seatle.. athetiq data thrououetthe ISM thudetorm seso in Nu--- m- lk~ Alebeome
Work ostimed em the eeelyaie of 71-2 dmatand the somperimom of uuolhe withthe ment NCARt and N35L ezpunlmfs The develepinOf 81401111101for theastemstic desmemot and possible Ip-edudem- of wesmtabuletd phosesems elm.coed..... It is plemand to hae at In" misrebuue- outflw and pmt frostaS*rltm avlal~ for wsena duting the -omue smmus
&0~100e Per
ape"
-NO-,
TASLE OF CONTENTS
Abstract iList of Ilustrations viiList of Tables viii
INTRODUCTIONI
11. TEST-BED DEVELOPMENT 3A. Radom 3I. Antenna 3C. Antena Pedestal 3D. Transmitter/ Receiver 4E. Signa Processor 4
I. Overview 42. Signal Processor Status 5
F. Data Acquisition and Analysis (DAA) Processor 3I. Overview S2. Hlardware Status 73. Software Status a
G. Radar,, Antena Controller 121I Antenna Controller 122. Radar Control - PE3210 13
H. Main Minicomputer- PE3260 141. Installation of PE3262 Computer Is2. Upgradeoo Genisco Displasy Syeem Is3. Installation of 62904*p Tap Recorders 16
I. Test-Bed Emhasnuents isI. Apollo Displays is2. Increase PRF ad Sesn BaonsIs3. Diagnosic and Calibation Routines 194. Pulse laterfiereng Desector 19S. New Signal Processor Simulaor 19
Ill. SII E PLANNING AND OPERATIONS 21A. Mempais Site Plann 21
1. Lincola Radar Sise 212. University of North Dakota (UND) Sise 213. Mesoe Sites 21
B. Memaphis Operations 211. Lincoln Radar I'd - mas 212. UND Radar Meas-emnt 233. Mese Operations 234. LLWSAS Operatio= 24
v
C. Ruamvilh Operation 241. Cooperatie Hmuvf Meteroloa Experienets (COHMEX) 242. FL-2 Ma__mows 253. Ma tot Operation 264. LLWSAS Operation 27S. UND Operation 276. Additioul Weaetr DIta 277. Outw Mumumu 288. Additioal Support 28
IV. EXPERIMENTAL DATA REDUCTION AND ALGORITHMDEVELOPMENT 31A. lakia-Elmor (P. E.) Compute Sysems 313. SUN Workusaion 31C. Radar Data Alyse 32D. Mooe/ LLWSAS Da Amlyus 34E. Lo,,-Aktiud, Wad-Sew (LAWS) De etgom Alrihdm Dalopme, 35F. Turhmuleae Deueios fApith. Deveopment 390. Cowr Environmen Pefomnasce 43
I. Hilh Pba FUer Perfdom 432. Chou Map Editor 44
H. Gros Front Dostion Alporidm 461. Ranp/ Velocity Uuotiidg 47J. Storm Trackiss amd Extrapoblaioa 48
V. USE OF WEATHER RADAR DATA WITHIN THE CENTRALWEATHER PROCE3SO 51A. Federal Mmrwobe Handbook Suppert 51I. Radar Working Oroup Support 52
VI. PLANNING FOR TDWR OPERATIONAL DEMONSTRATIONS 57
Releromae 61hUisaphy 61
Olmry 63
____________I__IIIi
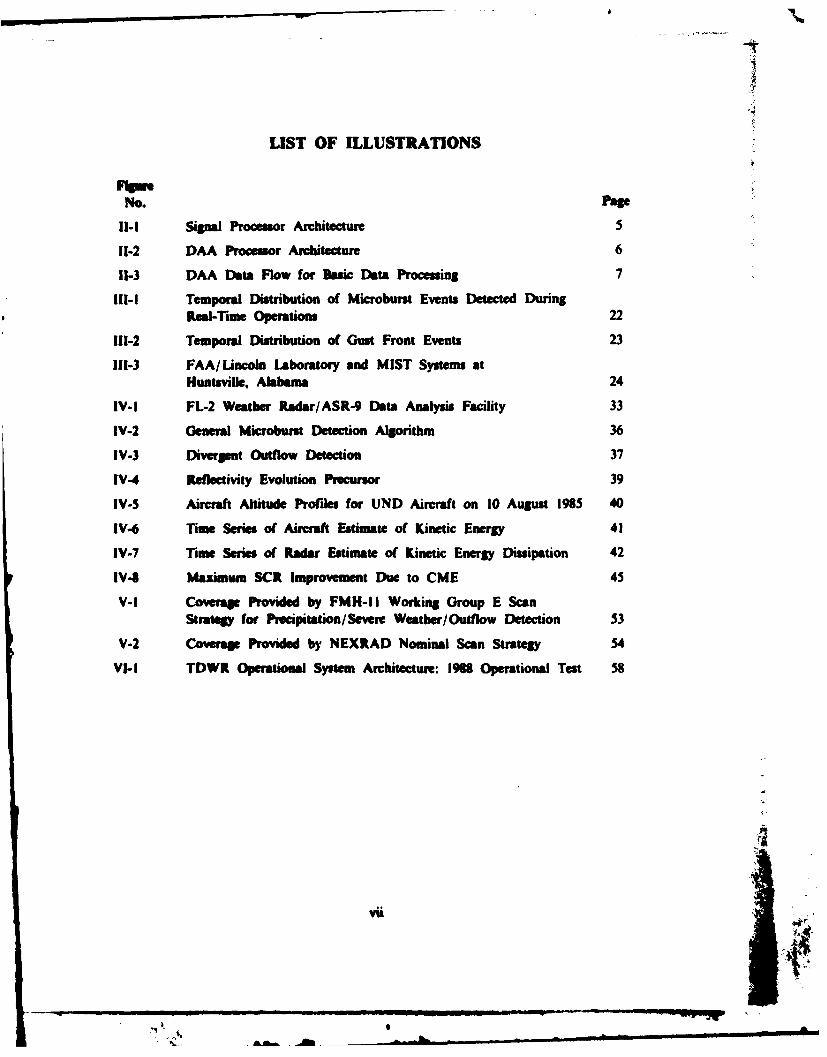
LIST OF ILLUSTRATIONS
F-NO. Page
11-1 Signal Processor Architecture 5
11-2 DAA Processor Architecture 6
11-3 DAA Data Flow for Bhsic Data Processing 7
111-1 Temporal Distribution of Microbunst Events Detected DuringReal-Thame operations 22
111-2 Temporal Distribution of Gust Front Events 23
111-3 FAA/Uncoin Laboratory and MIST System atIluntsvriile, Alabam 24
IV-I FL-2 Weather Radar/ASR-9 Data Analysis Facility 33
IV-2 Genera Microburst Detection Algorithm 36
IV-3 Divergent Outflow Detection 37
IV-4 Reflectivity Evolution Precursor 39
IV-5 Aircraft Altitude Profiles for UND Aircraft on 10 August 1985 40
IV-6 Time Series of Aircraft Estimate of Kinetic Energy 41
IV-7 Time Series of Radar Estimate of Kinetic Energy Dissipation 42
1V48 Maximum SCR Improvemnent Due to CME 45
V-1 Coverage Provided by FMH-11I Working Group E ScanSiratVg for Precipitation/ Severe Weather/Outflow Detection 53
V-2 Coverage Provided by NEXRAI) Nominal Scan Strategy 34
VI-l TDWR Operational System Architecture: 1968 Operational Test 58
vii
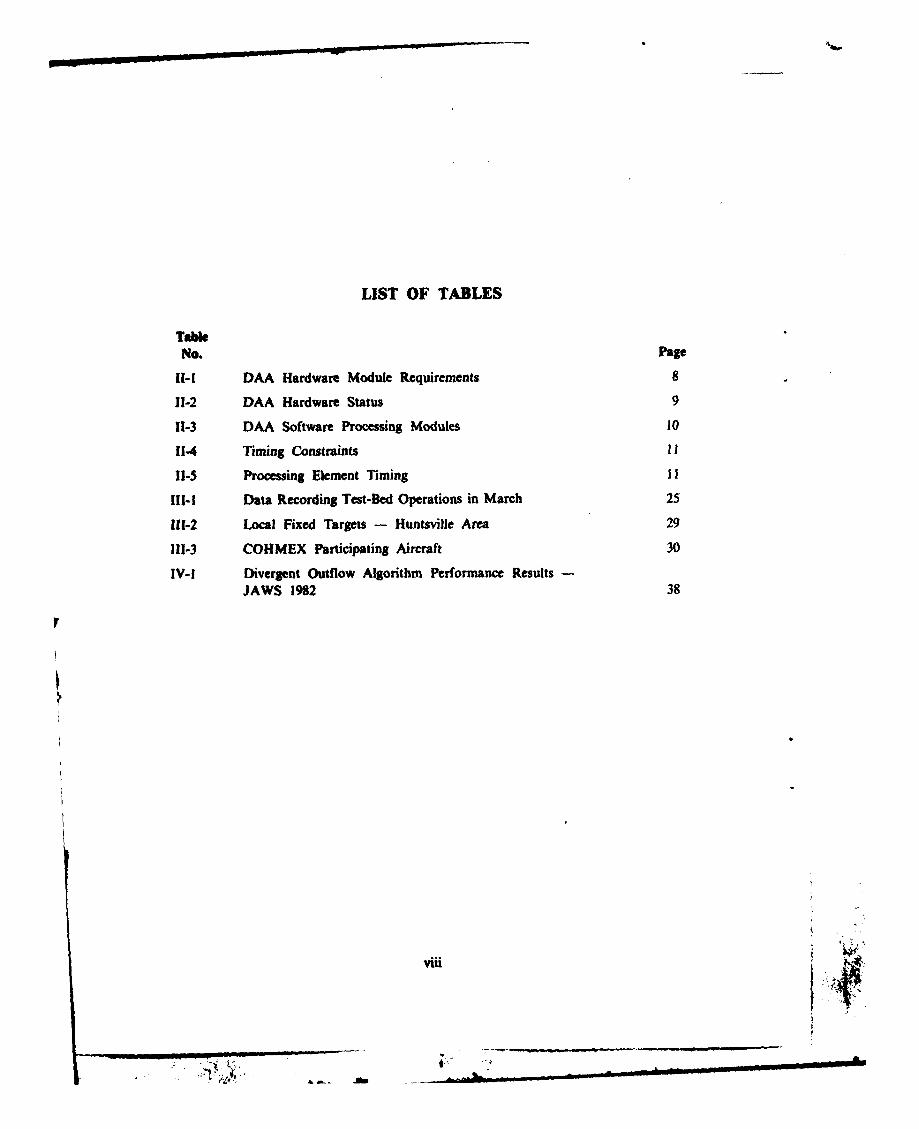
LIST OF TABLES
TaeNo. Page
fl-I DAA Hardware Module Requirements 8
11-2 DAA Hardware Status 9
11-3 DAA Software Processing Modules 10
11-4 Timing Constraints 11
11-5 Processing Element Timing 1I
111-1 Data Recording Test-Bed Operations in March 25
111-2 Local Fixed Targets - Huntsville Area 29
111-3 COHMEX Participating Aircraft 30
IV-l Divergent Outflow Algorithm Performance ResultsJAWS 1982 38
viii
I.
-' A
I ..
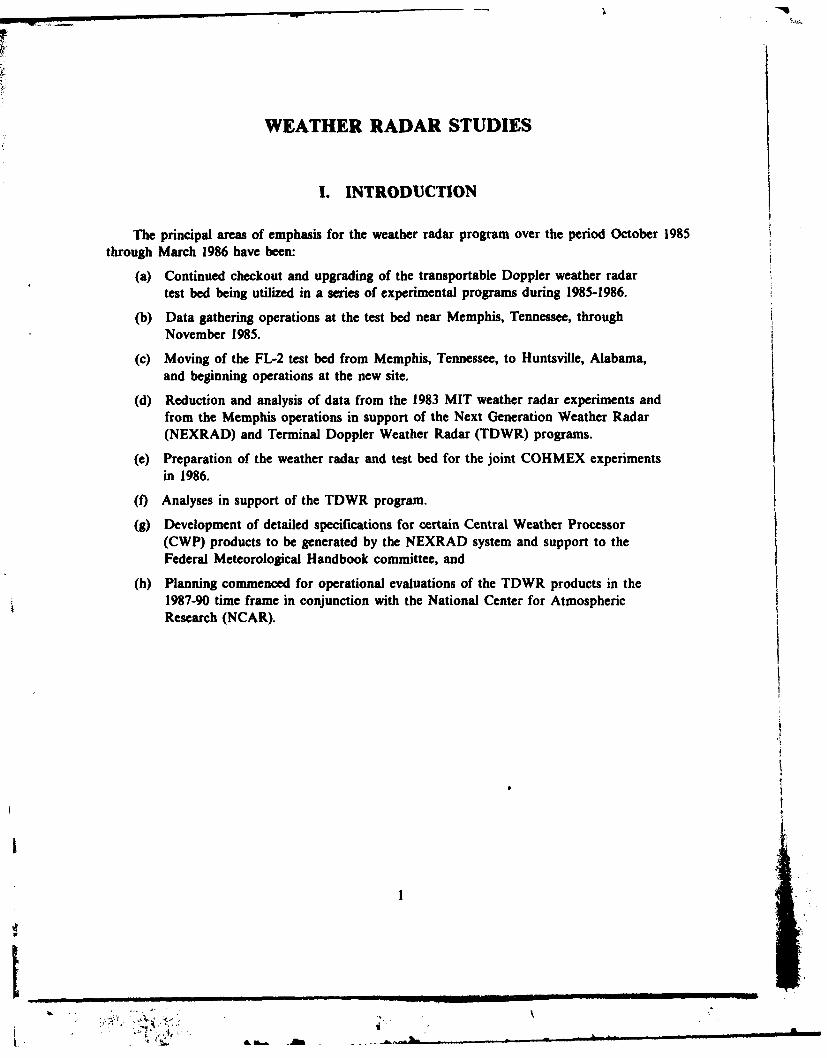
WEATHER RADAR STUDIES
I. INTRODUCTION
The principal areas of emphasis for the weather radar program over the period October 1985through March 1986 have been:
(a) Continued checkout and upgrading of the transportable Doppler weather radartest bed being utilized in a series of experimental programs during 1985-1986.
(b) Data gathering operations at the test bed near Memphis, Tennessee, throughNovember 1985.
(c) Moving of the FL-2 test bed from Memphis, Tennessee, to Huntsville, Alabama,and beginning operations at the new site.
(d) Reduction and analysis of data from the 1983 MIT weather radar experiments andfrom the Memphis operations in support of the Next Generation Weather Radar(NEXRAD) and Terminal Doppler Weather Radar (TDWR) programs.
(e) Preparation of the weather radar and test bed for the joint COHMEX experiments
in 1986.
(f) Analyses in support of the TDWR program.
(g) Development of detailed specifications for certain Central Weather Processor(CWP) products to be generated by the NEXRAD system and support to theFederal Meteorological Handbook committee, and
(h) Planning commenced for operational evaluations of the TDWR products in the1987-90 time frame in conjunction with the National Center for AtmosphericResearch (NCAR).
A -
Ii_ I _ _ I _. .1- , II -
•
I
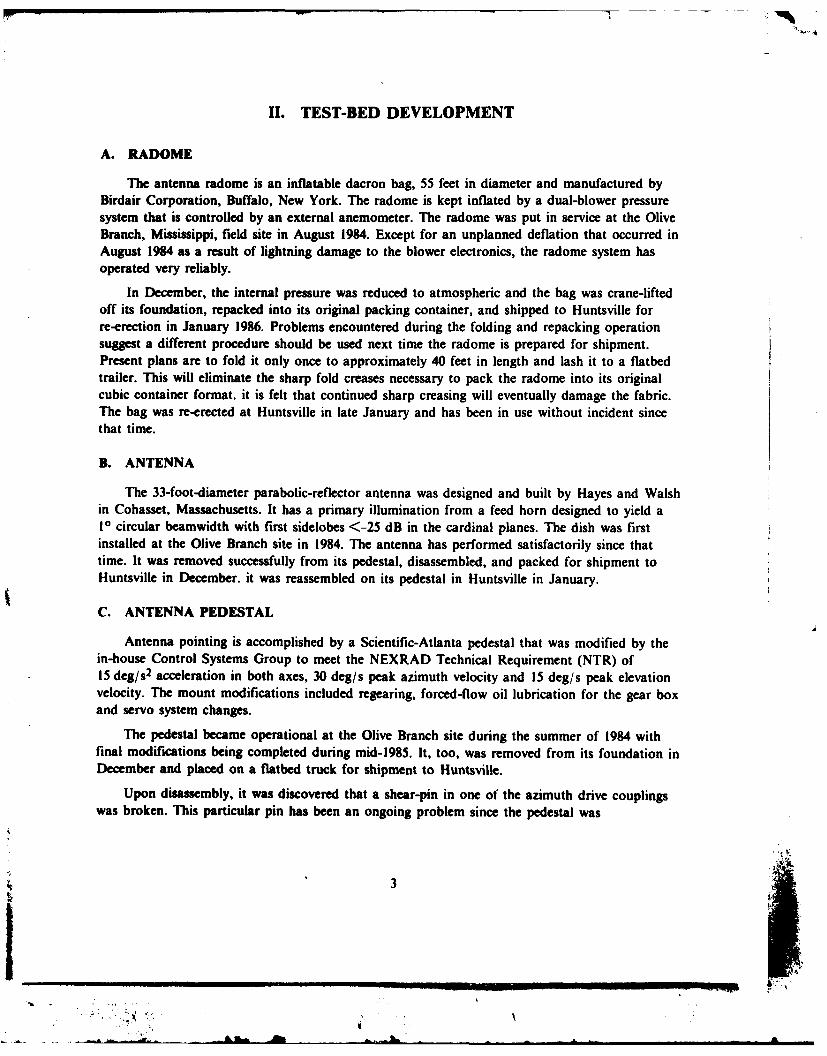
II. TEST-BED DEVELOPMENT
A. RADOME
The antenna radome is an inflatable dacron bag, 55 feet in diameter and manufactured byBirdair Corporation, Buffalo, New York. The radome is kept inflated by a dual-blower pressuresystem that is controlled by an external anemometer. The radome was put in service at the OliveBranch, Mississippi, field site in August 1984. Except for an unplanned deflation that occurred inAugust 1984 as a result of lightning damage to the blower electronics, the radome system hasoperated very reliably.
In December, the internal pressure was reduced to atmospheric and the bag was crane-liftedoff its foundation, repacked into its original packing container, and shipped to Huntsville forre-erection in January 1986. Problems encountered during the folding and repacking operationsuggest a different procedure should be used next time the radome is prepared for shipment.Present plans are to fold it only once to approximately 40 feet in length and lash it to a flatbedtrailer. This will eliminate the sharp fold creases necessary to pack the radome into its originalcubic container format. it is felt that continued sharp creasing will eventually damage the fabric.The bag was re-erected at Huntsville in late January and has been in use without incident sincethat time.
B. ANTENNA
The 33-foot-diameter parabolic-reflector antenna was designed and built by Hayes and Walshin Cohasset, Massachusetts. It has a primary illumination from a feed horn designed to yield aI circular beamwidth with first sidelobes <-25 dB in the cardinal planes. The dish was firstinstalled at the Olive Branch site in 1984. The antenna has performed satisfactorily since thattime. It was removed successfully from its pedestal, disassembled, and packed for shipment toHuntsville in December. it was reassembled on its pedestal in Huntsville in January.
C. ANTENNA PEDESTAL
Antenna pointing is accomplished by a Scientific-Atlanta pedestal that was modified by thein-house Control Systems Group to meet the NEXRAD Technical Requirement (NTR) of15 deg/s 2 acceleration in both axes, 30 deg/s peak azimuth velocity and 15 deg/s peak elevationvelocity. The mount modifications included regearing, forced-flow oil lubrication for the gear boxand servo system changes.
The pedestal became operational at the Olive Branch site during the summer of 1984 withfinal modifications being completed during mid-1985. It, too, was removed from its foundation inDecember and placed on a flatbed truck for shipment to Huntsville.
Upon disassembly, it was discovered that a shear-pin in one of the azimuth drive couplingswas broken. This particular pin has been an ongoing problem since the pedestal was
3
........... ...... I I '
manufactured some eight years ago. In an attempt to help the problem, the coupler was invertedbefore installation to provide for more shaft insertion depth. This did not solve the problem andthe entire pedestal has been instrumented with strain gauges to aid in further analyzing the fault.
D. TRANSMITTER/RECEIVER
The test bed uses a production line ASR-8 transmitter, on loan from the U.S. Navy, with aLincoln-developed "instantaneous' automatic gain control (AGC) receiver. Additional filtering wasadded to the modulator, in order for the transmitter to meet the objective of an integratedinstability residue of less than -50 dB. This equipment was dismantled at Memphis, reassembledat Huntsville in January, and has been operating without incident ever since. In order to reducecontamination of first-trip weather returns by multiple-trip returns, the receiver COHO wasphase-shifted pseudo-randomly on a pulse-by-pulse basis. Unphased COHO, used in the systemtiming circuitry, became a problem when stray components leaked into the receiver and becamemixed with phase-shifted COHO. The result is a pseudo-random dc shift at the input of the A/Dconverters and the appearance of stray frequency components in the transmitter residue spectrum.All efforts to cure this problem have been unsuccessful so far and the phase-switching of theCOHO is not presently a part of real-time operation.
E. SIGNAL PROCESSOR
1. Overview
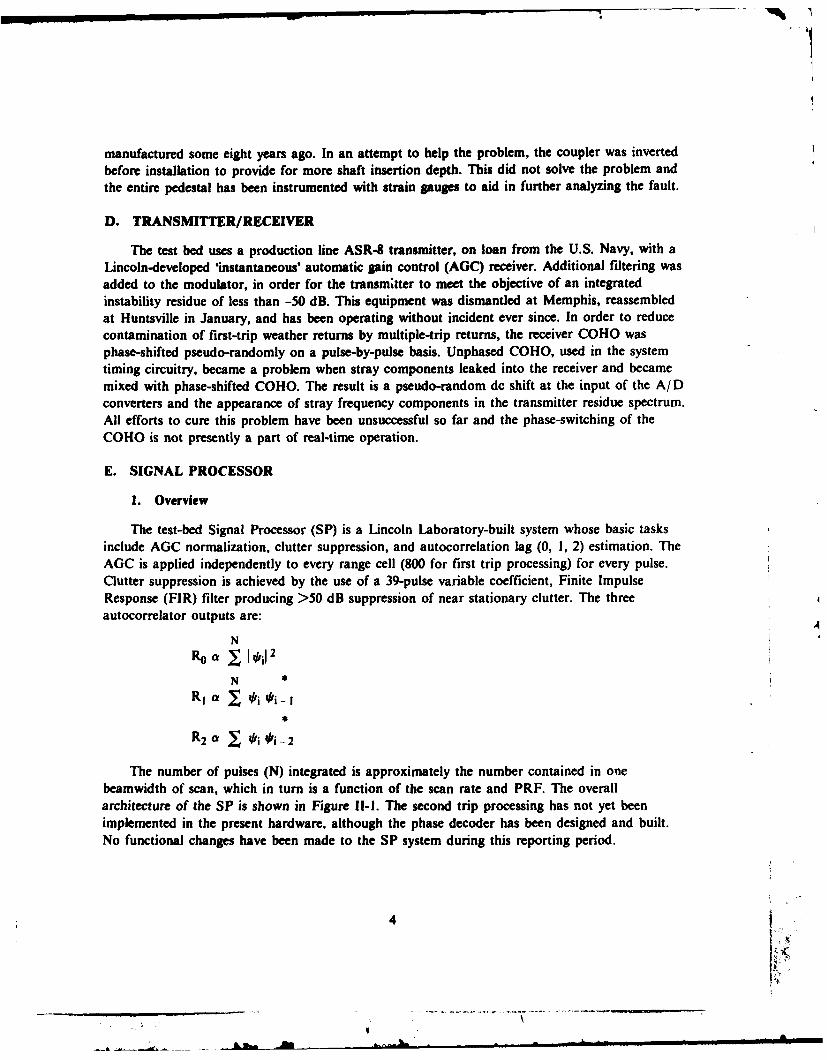
The test-bed Signal Processor (SP) is a Lincoln Laboratory-built system whose basic tasksinclude AGC normalization, clutter suppression, and autocorrelation lag (0, 1, 2) estimation. TheAGC is applied independently to every range cell (800 for first trip processing) for every pulse.Clutter suppression is achieved by the use of a 39-pulse variable coefficient, Finite ImpulseResponse (FIR) filter producing >50 dB suppression of near stationary clutter. The threeautocorrelator outputs are:
N
N *
R2 a i 0i- 2
The number of pulses (N) integrated is approximately the number contained in onebeamwidth of scan, which in turn is a function of the scan rate and PRF. The overallarchitecture of the SP is shown in Figure 11-1. The second trip processing has not yet beenimplemented in the present hardware, although the phase decoder has been designed and built.No functional changes have been made to the SP system during this reporting period.
4
- \;
3 "
FROM AC FIRAUTOCORRELATIOR IRADAR NORMALIZER (is rp
IDAA
I I
TIESEISPHASE AUTOCORRELATIOR I'DATA BUFFER DECODER (Second Trip)
ri I
I' I
TO HOST COMPUTER
Figure 11-1. Signal processor architecture.
Other tasks carried out in the SP include a Pulse Interference Detector (PID), a radar-returnsignal simulator to produce known inputs to the SP, a Single Gate Processor (SGP) sampler fordiagnostic purposes and a phase decoder to provide for decorrelating unwanted second-trip radarreturns. A Time-Series Buffer that will allow recording selected data in real time is planned inthe near future.
2. Signal Processor StatusA second SP has been constructed and integrated with the development Data Acquisition
and Analysis (DAA) processor at the Lexington facility. This unit now provides a facility to
check out SP problems and modifications at Lexington. The processor is identical at the test-bedunit, but only has two of the four FIR filter boards implemented. Eventually a full set (4) offilter boards will be constructed.
F. DATA ACQUISITION AND ANALYSIS (DAA) PROCESSOR
1. Overview
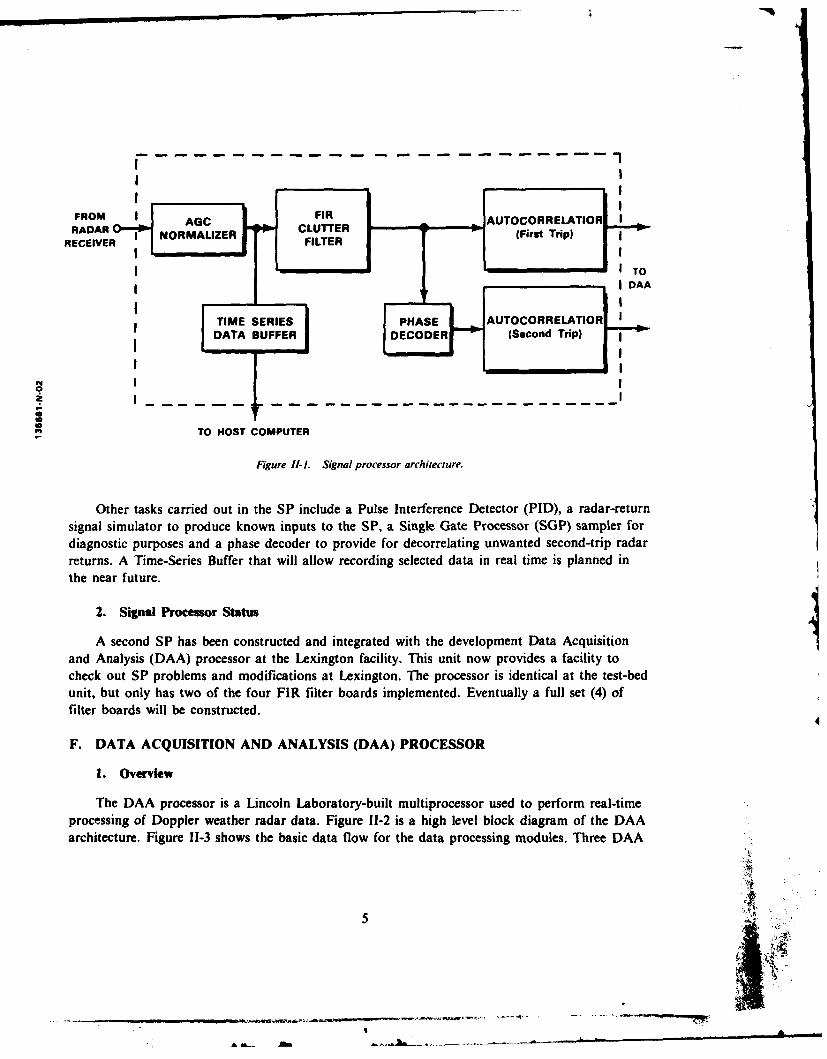
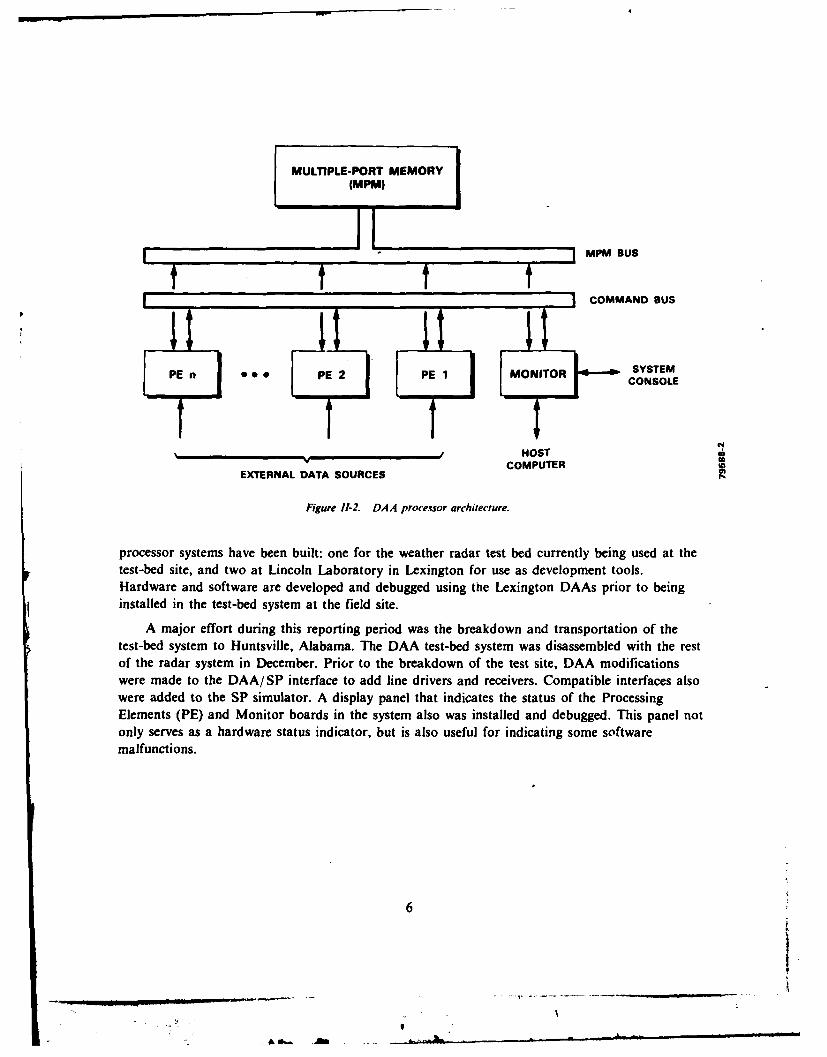
The DAA processor is a Lincoln Laboratory-built multiprocessor used to perform real-timeprocessing of Doppler weather radar data. Figure 11-2 is a high level block diagram of the DAAarchitecture. Figure 11-3 shows the basic data flow for the data processing modules. Three DAA
5 !'ik
5 , ,r
MULTIPLE-PORT MEMORY(MPPA)
I
11. MPM Bus
COMMAND BUS
PEn0 PE 2' PE 1 MONITOR SYSTEM
PE CONSOLE
HOSTCOMPUTE
EXTERNAL DATA SOURCES COMUTE
Figure 11-2. DAA processor architecture.
processor systems have been built: one for the weather radar test bed currently being used at thetest-bed site, and two at Lincoln Laboratory in Lexington for use as development tools.Hardware and software are developed and debugged using the Lexington DAAs prior to beinginstalled in the test-bed system at the field site.
A major effort during this reporting period was the breakdown and transportation of thetest-bed system to Huntsville, Alabama. The DAA test-bed system was disassembled with the restof the radar system in December. Prior to the breakdown of the test site, DAA modificationswere made to the DAA/SP interface to add line drivers arnd receivers. Compatible interfaces alsowere added to the SP simulator. A display panel that indicates the status of the ProcessingElements (PE) and Monitor boards in the system also was installed and debugged. This panel notonly serves as a hardware status indicator, but is also useful for indicating some softwaremalfunctions.
6
CELAGTO-
PROCESSOR -- " OMPUTATION
LFACTORS-TO-CMOMENTCOMPUTATION
CUTR CENTRALMPIGCOMPUTER
(PE3262)
BASIC
RESAMPLING
CONTROLLER, PROCESSING
-, DISPL.AYOAA PROCESSOR IL
Figure 11-3. DAA data flow for basic data processing.
2. Hardware Status
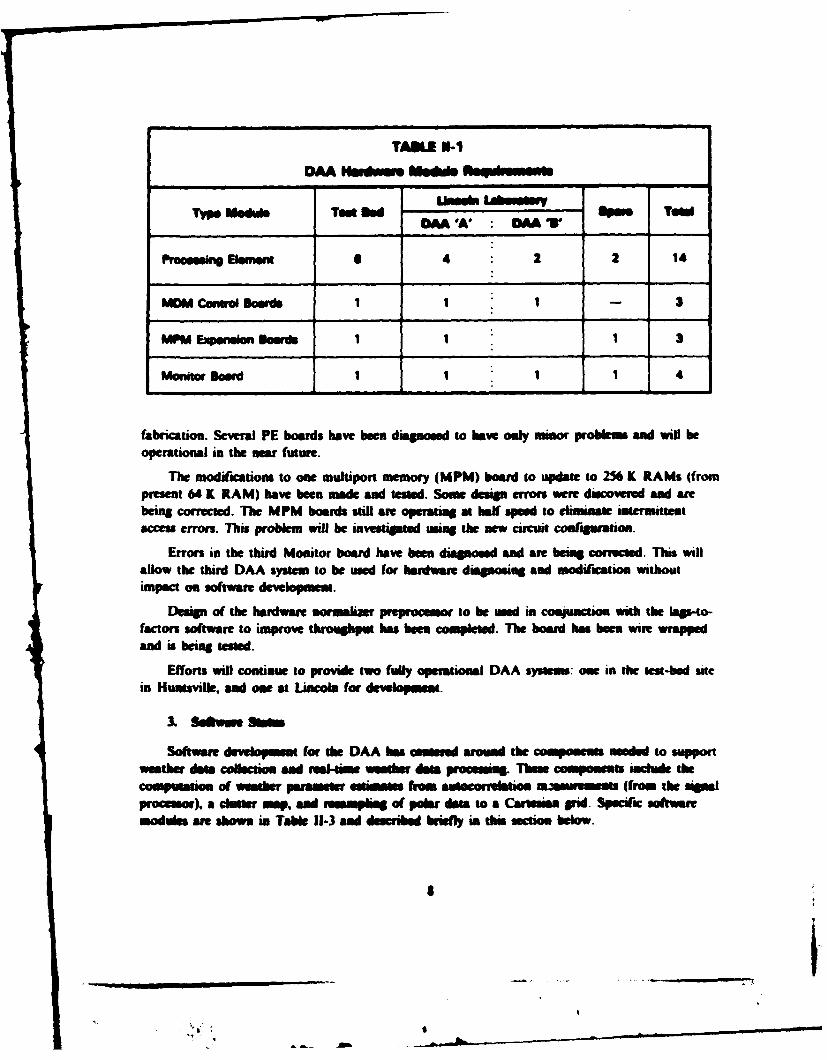
The DAA system at the test site in Huntsville has been completely installed and is fullyoperational with two PE installed. To fulfill the requirements of the system for first trip weatherprocessing, Table 11-I gives the numbers of each type of DAA hardware module that will beneeded.
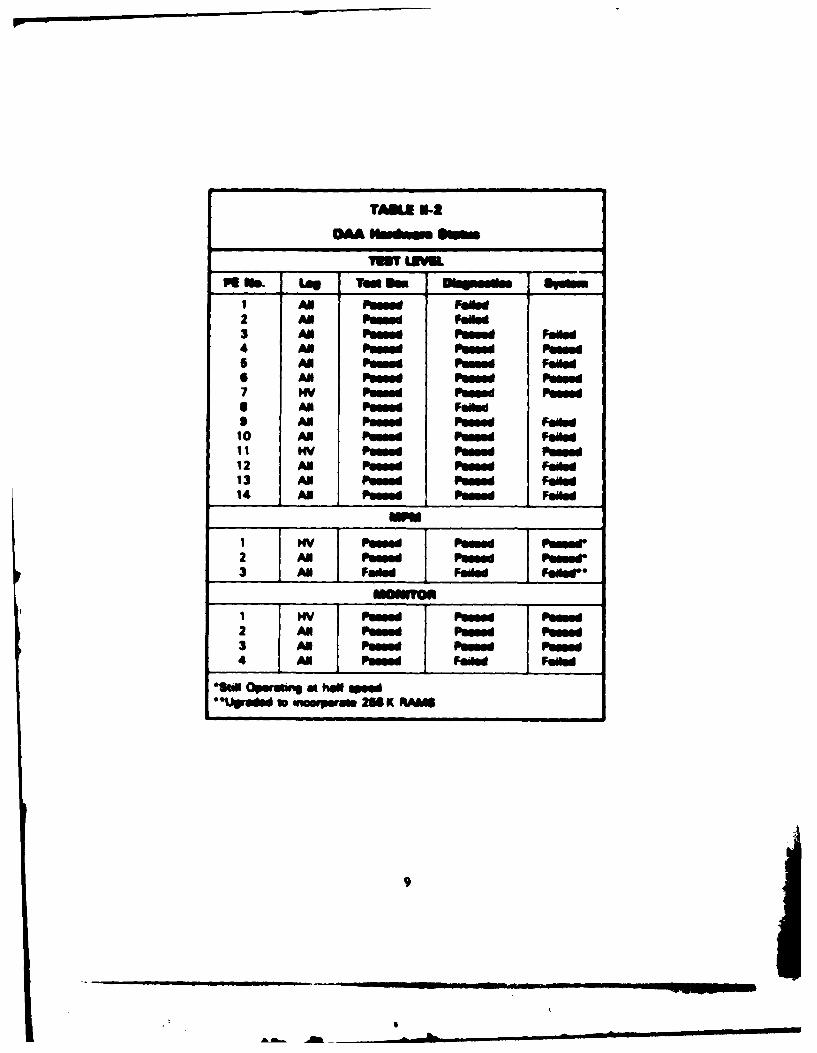
Table 11-2 shows the current status of the DAA hardware modules.
Efforts during this period have been directed towards diagnosing and repairing faulty DAAboards so that the test site system and one Lincoln development system will be able to run thefull system software requiring six PE boards each.
One of the problems with four of the PE boards has been diagnose to be intermittenterrors due to cross talk on the boards caused by the 'picture frame' wiring used. Changing thiswiring is a major effort, therefore a decision has been made to build four new PE boards. Theorder for the new boards has been placed, and work will commence in the near future on
7
Ii
TAKLE N-1
Tvpe odul Too lled DAA 'A' AA S* PG O
PiressalnElamnt 6 4 2 2 14
MOMCntrl Boards I - 3
MPM EigionSIOnlU 1or 1 1 3
Monitor Board 1 111 4
fabrication. Several PE boards have been diagnod to have only umor problem and will beoperational in the ar future.
The modification to one multiport memnory (MPM) board to update to 256 K RAMs (fromnpresent 64 K RAM) have been mae and sesued. Some design errors wer discovered and arebeing corrected. The MPM boards stilt arm operating at half speed to eliminale untermanentacces errors. Tin problem will be investigated sing the new cawwt coaligiwatioe.
Errors in the third Monitor board have been diagnosed and are bring corrected. Thus willallow the third DAA systemn to be used for hardware dignog and miodification withoutimpact on software develoet.
Design of the hardware normaliw preprocessor to be sed in cosjunction, with the lap-o-factors software to improve throughput has been completed. The board has been wire wrappedand is being tested.
Efforts will continue to provide two fully operational DAA system: one in the test-bed satein Huntsville, and one at Lincoln for development.
& Be4uie 0 -lm
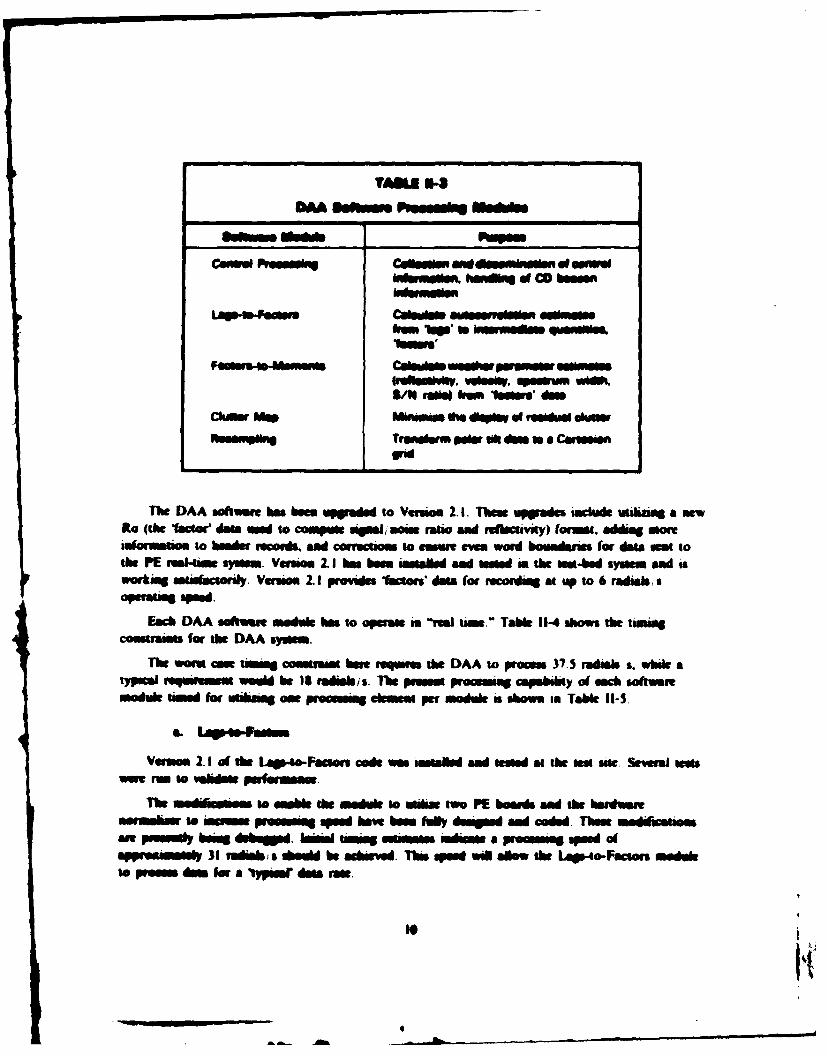
Software developmsent for the DAA has - tmud around the comtposents nedid to supportweather data collection and reakime weather dais p 1, Sug Thms components incude the
comutaionof a winh paramete estimates from ci- -meoto am"______ (from the signalprocemsor). a cluter maop, ad resoampi"a( o polar data to a Cartesian grid. Specifi softwareodles ane shown in, Table 151-3 ail 'ecIbe briefly in this section below.
TAi S-
_ _ _ UT LUWL
ps mw Lqw Tomn am DWq..G. Se
2 AN Pftd F ie3 As P""i Faming F4 AN Poo"d Fueed Fussd5 AN Fussed Fussd Fule4 AN Fusse FPond FPondI mY Fmed FueNe Fussda AN Peami Faie0 AN Fumed PON"e Faed10 AN Pftfd Fumed Fulle11 mv Fued Fumed Fumed12 AN Peand Fussed13 AN Fumed Fusmi Faed14 -AN Fusmi Fmd Faed
1 V IFused Fussed t Femor2 Al Fed Fsmd Fum.V3 AN Fadled Faed" Feled
1v ran Fumd umd Fuond2 AN Fusesi Fumed Fuemm3 AN Fussed Fussed PNSesd4 AN Fussd Faded Fulled
09"l Operaftn a hao @Poo""Up*"e ID noepere 26 MK PAWS
ALAI -Au
TAMS n-bAA s~mftmemm"~
s~m MW -CeW Rguh C8119800 and Momimaden Wotmm
Immen. h of CO bemeenworn-~
FOOM Sw Chmi .mw
-fei. -ds. " - wieh.S/M -O boo ls@Ws em
ChdI Meru MWWimm 00 dWIW o roi"a demer
Truam' peft d dat s a Commnen
The DAA saftwot as es, been p to Vesion 2.1. 1The uppae. inchmid. miatiag a newft. (the factr dmatamm to couW aim, ourn nowao amd rnemey) formist. addims aoreaformtamoe to hImmder mu-cordA. mad corrections to emrnae ew word boundaries for data noa tothe PE rel-same syimm. Verses I. he he.. Ism mih ndw s d m the ma-be symm aewwt*a mtulacsonl. Vexuion 2.1 prowd factouudat for rocordift at uap to 6 radial, z
Each DAA sadt..,. ..odul he. to operam a ygai tame." Tab*e 11-4 ahows the tamaPcom-asets for the DAA symmm.
The wamor - s* consmran here requsr the DAA to proam 37.5 ramI.,s. whale atypka equ-i ra wouldi he 18 rtle/s. Thse puusam procesmua capaobay of smch softaim.modul Ume for wahmq oae prosm* lms per mo al show. in Talk 11-,
Ves 2.1 of the Upo-ftaors code a wallhd aml ased at the ma sm.e Sewa mats-ee rum to vabim purfe m- .
Thme undimuom to oumbl the module so atae two PE bow&d and the hardum,.wmhnto pruve m me-- g - heo w ave hfl amued ad coded These moddicaeom
ain p mody beime dvebjd- hMmi tamW* saem Wine a Ieemmue- sped atnewlm y 31 - is duld he -cl d. Ths spee will aihuw the LUwto-Fimcsom modle
to pI dma sr a 'uYP~ir da- ran,
Amok*
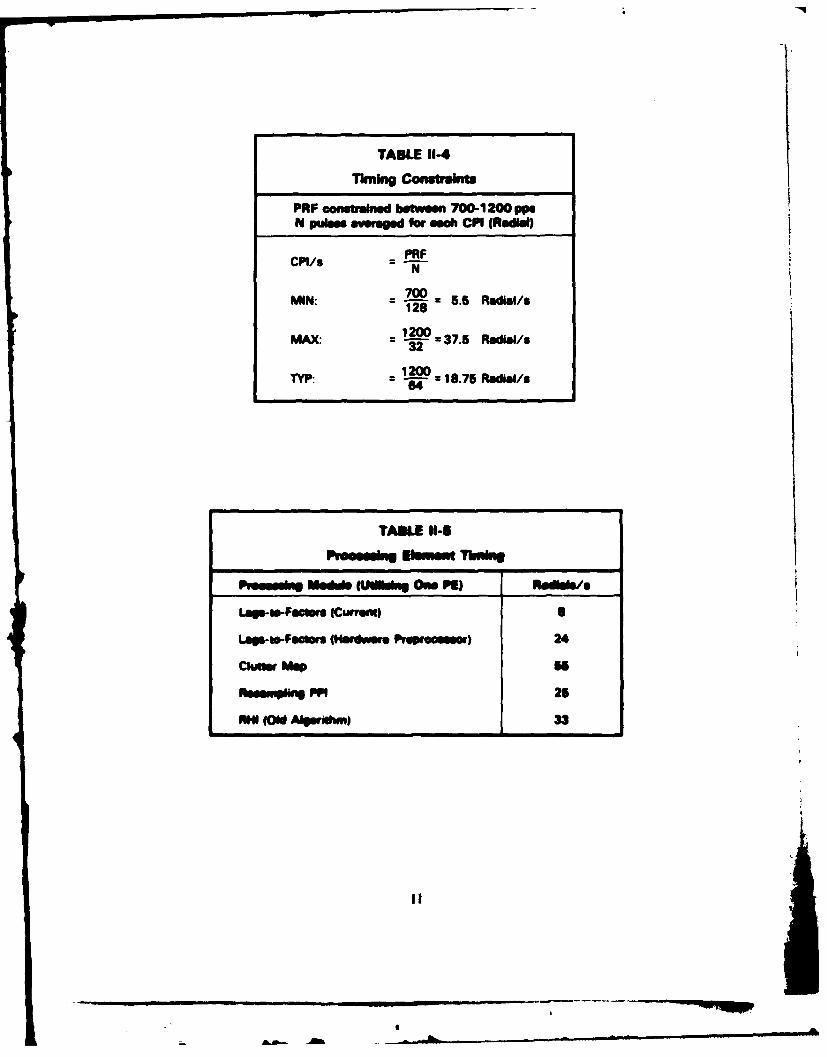
TABLE 11-4
Timing Constraints
PRF ooutstslnd betwom 700-1200 ppmN pulses- wge for each CMI (Radia)
=PRFCMI/sN
MON: = 1825.6 Radia/s
MAX: = 120 37.5 Radial/s32
TYP: = 20 18.75 RadIa/s
TAN" 11-5
Pmoo@W" Modub NOW"~m 0... PC) el/
LagswFacumr (Nsraiur Pfgprooom) 24
Clumsy MapI
Rhsuuipli ig PMI 25
ROO I Algsnmhml 33
b. FCtIN,4o-Momms
The Factors-to-Moments module has been fully designed and coded. Several test progsamshave been written to allow testing of the module in a stand-alone environment. The code ispresently being debugged. After full testing in a stand-alone environment, the code will beintegrated with the Lags-to-Factors module.
e. Cl ttr Map
The Clutter Map module has been stable with an ability to process data at the rate of55 radials/s.
Modifications to include additions to header messages are being implemented.
d. Resampling
The PPI module of the resampling code has been operating successfully with an indicatedprocessing rate of 25 radials/s. A new algorithm for computing the 4/3 Earth approximation hasbeen designed, tested, and debugged. Timing estimates have not yet been verified. Themodifications to incorporate the new resampling algorithm to speed up processing rates havebeen designed and are being debugged. These changes for both the 4/3 Earth approximation andthe new resampling algorithm to should enable the RHI resampling to achieve the sameprocessing rates as the PPI.
e. Control rocesdg
A new version of the 3210 radar control program that provides complete compatibility withVersion 2.1 of the DAA software has been installed and tested in the test bed and is operatingsatisfactorily.
The DAA control processing has been modified to include time tags for each 'Beacons'messae report. These changes cannot be fully tested until the hardware has been installed and isfunctioning correctly.
Efforts will continue to provide software modules that can perform in real time. Initialinvestigtiom indicates that with all modifications in pis-, all of the software modules should beabLe to provide processing capabilities for at least 'typical' processing speeds.
G. MADAR/ANTINNA CONTROLLER
I. Am Cw
The principal ojective of ansenna control software is to achieve as fast an update ofwuber - as the mount and servo symm can handle within the Imitations ofaOW syslem bandwidt. The antenna control software for the Scientific Atlanta
12 4
mount was compleely redesigd includig thw sofiwus to encmpn aem was patterns as wellas cumps in dhe dynamic repam e of the mount and the mrvo amplirr -r *ities. 7Usoftware developm et hias required dow imasrawo beman the weather radar project softwaredevalopmet personnel and the Limoa Control Syms Egiesering Oroup personnel whorde'-d and implementd the moun Smlo servo control sylm.
The Pedestal Control Program . fully operational. Work this reporting period focused on:
(a) aim algorithm review,
(b) a coding review,
(c) an attempt to shorten the time required to compile the program.
A4pwf Nn Jpw: - An algorithm review of the Pedtal Control Program was conductedby means of a presentation to a steering -committee made up of all concerned group leaders,system and software personnel. It was generally agreed that the softwarei handling the hardwareproperly.
C.e* Revw: - Printouts of all source and documentation files associated with the current(Rev. 3) Pedestal Control Program were provided to a Code Review committee.
C p eia a - Compiling the Pedestal Control Program on the PE3210 takes only3-4 minutes using the Cl-velopment Compiler, but 2 hours, 35 minutes, using the OptimizingCompiler. -he same compilation takes only I hour, 17 minutes, on the PE3260 and will takeonly 38 minutes on the PE32110. In order to take advantage of the faster PE3260 for runningFORTRAN VII 0 compilations, all Pedestal Control Program source files have been duplicatedon the PE3260. The resulting oboct file was transferred to the PE3210 via tape.
2. Radar Corol - Ff,210
A new radar simulator was installed at the test bed. Unlike the previous simulator, the newsimulator resides in the signal processor and can he accesd directly through sotware from thePE3210. Choosing to process simulated radar data instead of actual radar data will no longerrequire a change of cables. The new simulator is capable of storing up to 256 pulses each of 1,Q, and AGC normalization values. Each pulse can contain up to 1024 range pes.
The new radar simulator will enable a comprehensive set of radar system tests anddiagnostics to be developed. A group of tests have been identified and incorporated into a testplan that currently is being implemented. Several of the issues that are to be addressed are:
(a) Memory element and diagnostic testing: verify correct operations of theread/write memory elements existing within the signal processor and radarsimulator.
(b) Data processing hardware testing: the new simulator will enable test caediagnostics to verify hardware performance. Executing identical algorithmsconcurrently in software and hardware will enable weak links within thesystem to be isolated.
13
04
_ _ _ -- i,- -11 .- I
(C) RamI-el symste evaluation: a mom general set 0f system diagnostics willinvolve loading simlatd dae into the coumplets RTS and evaluating the endreults that apper on the display amoulors.
hem One has been Xcompleted and is currently in use at Lincoln Laboratory. Thie latter twoitmsew an bein addrund. Much of the neat period will be devoted to developing and
intgrain the seftvare sumemary to Out individual hardwar elements throughout the real-timesymbeem. Work will involve loading the simulator and reading output data from the signalprocessor and the DAA.
H.MAIN MINICOPUTIER P9flS
H.The Re-lime Control Program (RTCP) executes in the main PE3262 minicomputer in the
tes bed system. The principal function presnty performed by this system are listed below:
(a) Operator Control of:
(1) radar scan sequence,
(2) recording and playback of raw data received from the DAA, and
(3) zooming and panning of the three-moment weather data displays.
(b) Display of.
(1) Cartesian radar map images of weather reflectivity, velocity, andturbulence (the weather spectral momnts), and
(2) system status and diagnostic messages.
(c) Processing of DAA raw data for weather product displays:
(1) factors-moments computation, and
(2) polar-to-Cartesian coordinate transformation and resampling.
The two functions in (c) above are interim tasks that eventually will be performed by theDAA.
The RTCP also can be executed in the Annex 2 (AN-2) 3250 minicomputer located atLincoln Laboratory in Lexington, Massachusetts. A development version of the DAA and aradar simulastor also is mainitained in the AN-2 computer, allowing software development forboth the DAA and the RTCP to be carried out in parallel with data collection operations at thefiel site.
An analysis of the RTCP and its operation, revealed a number )f shortcomings in terms ofcompute capaciy and progrm capability:
(a) The recording capacity of the IO00bpi tape recorders was inadequate forrecording dewa at wan rats greater than about 1S deg/s.
144f
Lj
(b) The data collection task of the present RTCP would not support increased
recording data rates on a faster recorder.
(c) The display task of the RTCP would not keep up with faster scan rates.
(d) The operator control task needed additional control functions and a moreflexible status display.
(e) With the above items corrected, the PE3252 will barely keep up with theexisting tasks and have no room for future real-time algorithm execution.
To alleviate these problems, it was decided to initiate the following:
(a) Upgrade the computing capability at the test-bed site by purchasing a PE3280MPS system with 16 MB of memory.
(b) Expand the memory capacity of the AN-2 computer at Lexington to itsmaximum capacity of 16 MB of memory.
(c) Increase the data recording capacity at the test bed by purchasing6250-bpi/ 125-IPS tape drives.
(d) Redesign the data collection and display task in the RTCP.
Progess was made toward these ends during this reporting period.
1. mtadmtion of PE3262 Computer
The problem of inadequate computing capacity was alleviated by the replacement of theexisting PE3262 computer with one APU at FL-2 by an interim system consisting of anotherPE3262 computer with three APUs and 16 MB of memory. This installation was completed atHuntsville in early February, shortly after completion of the move of the FL-2 radar site fromMemphis.
This is an interim installation until the new Model 3280 computer that has been orderedfrom Concurrent becomes available. Nevertheless, that interim system will provide nearly doublethe processing capacity and double the memory of the previous system. These increases incapacity are essential for implementation of further upgrades to the RTCP.
Unfortunately, installation of the companion field upgrade and memory expansion for theAN-2 RTCP development computer at Lexington has been delayed until the early part of thesecond quarter of 1966.
2. Uppn& of Geshe.w Diby Sysien
All of the problem associated with the operation of the Genisco color display subsystemthat were described in the last status report were resolved successfully by a rewrite of the displaygenration software. This rewrite was completed in February and the new software was installed
15]
I.I.. ... .. S1P M N N N
- "'~ -A__
at the FL-2 site in early March. Installation of this upgrade significantly improved the
performance of the display system as follows:
(a) All three color monitors now are updated simultaneously rather than
sequentially.
(b) The screen update time was reduced from a maximum of 30 seconds to1.7 seconds.
(c) The new software uses less CPU time but somewhat more memory than the
previous display software.
3. lntadletion of 6250-bpi Tape Recorders
The 6250-bpi/ 125-IPS tape recorders that were described earlier were successfully installed at
FL-2 in mid-March. As a result, we are now able to record nearly four times as much data on
one tape reel as was previously possible with the 1600-bpi drives. This is a significantimprovement because it reduces both the physical volume of recorded data and the amount of
tape handling required by the operators by about a factor of four.
Unfortunately, the new tape recorders did not provide any immediate increase in recording
data rate capability. At present, the rate at which data can be recorded on tape is limited by the
DAA, in the case of Factors data, and by buffering limitations in the RTCP Recording Task.However, the new tape recorders will be capable of handling the maximum data rates that can be
generated by the radar once the required upgrades to both the DAA and the RTCP have been
completed.
A redesign of the RTCP data recording task was completed at the end of March and codingand testing are expected to be completed sometime next quarter. Work also was started on
designing a new interactive antenna scan control facility that will be integrated with the RTCP
and enable the System Operator to update antenna scan parameters and scan sequences on-linein real time.
Hardware and software for the Apollos has been acquired and installed in this respect. Atpresent, however, complementary software for the PE is still under development at the Internet
Systems Corporation in Sunrise, Florida. Final acceptance of this software is anticipated shortly.
Software for the P.E.s, utilizing Internet-supplied low-level communications routines is beingwritten both for the purposes of acceptance testing for the Internet product and to provide afoundation for future operational software.
The focus of specific software development for the Apollo computers is divided into three
main areas:
Fhst, use the color workstation to provide a powerful display capability for the Dopplerradar products. In particular, the display is to be highly interactive, flexible, user-friendly, andcustomizable/programmable. It should be able to plot radar products such as reflectivity,
16
.. .. .. _ r' . m ~ mmmm i mmm Ibm mmmlm mmlmmmllm mm m m "4
velocity, spectrum width, etc., aircraft beacon 'tracks,' map information such as runways orcounty boundaries, and radar range rings. Further, choices about update frequency, the colors
employed, the information to be displayed, and the position and size of the displayed images are
to be decided by the operators 'on-the-fly.'
To accomplish this goal requires that a variety of display, communication, and datamanipulation functions be present. In addition to the display functions mentioned above, amechanism for automatically transferring radar information from the P.E. computer(s) to theApollo., a mechanism for maintaining and querying an 'index' of available information andcommand options, a command structure or 'shell' to integrate the various functions, andadditional support functions such as disk maintenance and data compaction/decompaction allmust be developed.
Second, use another color workstation at a remote site (such as an aircraft control tower) tosimulate TDWR workstation products and functions. This would be an extension of the displaycapability described above.
Tkd, use the black and white station as a 'radar control station' where scan patterns couldbe defined, displayed, and modified interactively. The radar products display is considered to bethe most important of the two. No work specific to the radar control area is likely to beundertaken for some time, although the display and communications functions developed for theproducts display station should be directly applicable.
During this quarter, the following items were accomplished:
(a) Prototype versions of the P.E./Apollo file transfer mechanisms were coded
and tested with satisfactory results.
(b) Tests of the low-level interprocess communications between the P.E. and
Apollos were completed.
(c) The algorithms that the workstation processes will use have been psuedo-coded and prototype interprocess communications have been designed.
(d) Design of the P.E. processes that will support workstation operations is wellalong.
The following capabilities will need to be in place by the end of May in order to support theFLOWS COHMEX program during June and July:
(a) Automatic transfer of selected radar images and selected other products fromthe P.E. to the Apollo.
(b) A rudimentary form of data base to respond to queries by the display processregarding information that has been transferred and is available.
(c) A rudimentary ability to query the above mentioned data base server.
(d) A rudimentary ability to display information.
17
I. TEST-BED ENHANCEMENTS
A number of modifications were made to the test bed during the first part of this reportingperiod. Most of these had to do with correcting known 'bugs' in the system or finding andrepairing intermittent type problems. Several problems of the latter type were corrected in boththe SP and the DAA.
Work continued on the three enhancements described in the last report: the Apollodisplay/control workstations, increasing the PRF and scan rates, and streamlining the diagnosticand calibration procedures at the test bed. In addition, two more items were added to the list offuture enhancements.
(a) a pulse interference cancellation circuit, and
(b) a full capability simulator for system checkout and algorithm testing.
I. Apollo Displays
A small network of Apollo workstations is being integrated into the FL-2 test bed for thepurpose of product display and radar control. The network consists of Motorola 68010 baseddevices: one with an integral bit-mapped color monitor, one with an integral bit-mappedmonochromatic monitor, and one monitorless device that will function as a server for massstorage and communications. Current plans call for the color and monochromatic workstations'CPUs to be upgraded to faster, more powerful, Motorola 68020/68881 chip sets.
A substantial amount of effort was devoted to the development of a high-speedcommunications facility between the token-ring network interconnecting the Apollo devices -denoted DOMAIN - and the PE3262 superminicomputer. This communications facility will beeffected via a Transmission Control Protocol/ Internet Protocol (TCP/IP) protocol set runningover an Ethernet Local Area (LAN) Network. As the types of data to be passed be. seen theApollos and the P.E. include both weather imagery and status requests, a means must beprovided for stream-type (status data) data transfer as well as the transfer of large data blocks(weather imagery).
2. Increase PRF and Scan Rates
The first two steps of the three-step process to obtain higher PRF and scan rates describedin the last report were completed before the test bed left Memphis. The Lags-to-Factorsrecording and processing in the DAA were verified before the radar was dismantled for shipmentto Huntsville, Alabama. The dual density 1600/6250-bpi nine-track tape drives were ordered anddelivered to the the Huntsville site. There is no longer a basic recording speed limitation due tothe tape drives. When the RTCP and DAA speedup is completed, recording will be possible atspeeds up to 25 rad/s.
- 18
3. Diagnostic and Calibration Routines
No progress has been made on this task during this recording period due to the effortrequired to dismantle and move the radar to Huntsville. A staff member has been assigned to thetask of Data Quality, which will include new diagnostic and calibration routines.
4. Pulse Interference Detector
A circuit was built that will detect and eliminate from both recorded and displayed datalarge interference pulses from nearby radars operating within the FL-2 RF bandwidth. Thiscircuit compares the amplitude of the receiver output from each range gate with receiver outputfrom the corresponding range gate from the preceding pulse. If the ratio exceeds a presetthreshold, the particular range cell is set to zero. An analysis indicated that zero will not corruptthe velocity information and is therefore a good choice. Analyses of the PID impact on cluttersuppression are continuing.
5. New Signal Processor Simulator
A new RF simulator circuit that provides realistic I and Q data inputs for system testing wascompleted, tested, and software to operate it was written. A preliminary set of test signals hasbeen completed and the simulator is operational. Ongoing work will include a larger library ofsignals to provide a greater spectrum of diagnostic tests.
Other enhancements of the existing RTCP that remain to be completed are:
(a) A redesign and rewrite of the operator interface task to provide moreflexibility of control and a more comprehensive status display.
(b) Revision of the scan control strategy to allow dynamic modification andscheduling of radar antenna scan patterns.
(c) Integration of the following algorithms into the RTCP:
(1) Automatic Gust Front Detection,
(2) Automatic Microburst Detection,
(3) Correlation Storm Tracking and Extrapolation.
19
Il
!11. SITE PLANNING AND OPERATIONS
A. MEMPHIS SITE PLANNING
1. Lincoln Radar Site
Preparations were completed and the FL-2 radar was disassembled at the Olive Branch fieldsite. The radar system was packed along with the inflatable radome and sent to Huntsville,Alabama, for re-erection there. Packaging of the teflon-coated fiberglass radome into its originalcontainer was a difficult problem because of its heavy weight and slippery surface. The next timethe radome is moved, it is planned to strap it down to a flatbed truck. This will eliminate theneed to put sharp creases in the radome material and greatly reduce the amount of laborinvolved.
The Olive Branch site structures and pads were removed by a contractor so that the site canrevert to agricultural use.
2. University of North Dakota (UND) Site
The UND site in Mississippi was dismantled in October and the radar tower transported toHuntsville. This radar was re-erected approximately 15 miles northwest of the FL-2 site in April.
3. Mesonet Sites
All stations were dismantled and packed for shipment to Huntsville. All sets at Huntsvilleare presently in operation.
B. MEMPHIS OPERATIONS
1. Lincoln Radar Measurements
The FI-2 radar was operational through 27 November, collecting 88 tapes on 12 differentdays totaling 32 hours and 16 minutes. October and November provided fewer wind-shear eventsthan previous months. A total of eight microbursts and six gust fronts were logged during realtime. All of the events occurred on thunderstorm days except for three microbursts on17 November. On this day, activity developed in response to overrunning as a warm front trackedacross the region. There was no convection apparent with this system, and the echo tops wereless than 26 kft. Also, the highest reflectivities were prevalent below the 'bright band' (freezinglayer).
One of the outflow events on this day occurred just west of the FL-2 site. A peak gust of9 m/s out of the west over a 5-min period was experienced. This was in agreement with theDoppler field, which portrayed low-level velocities of 10 m/s. The environmental flow before andafter the event was calm. Unfortunately, there was no mesonet data collected to verify themicrobursts on the 17th.
21
a
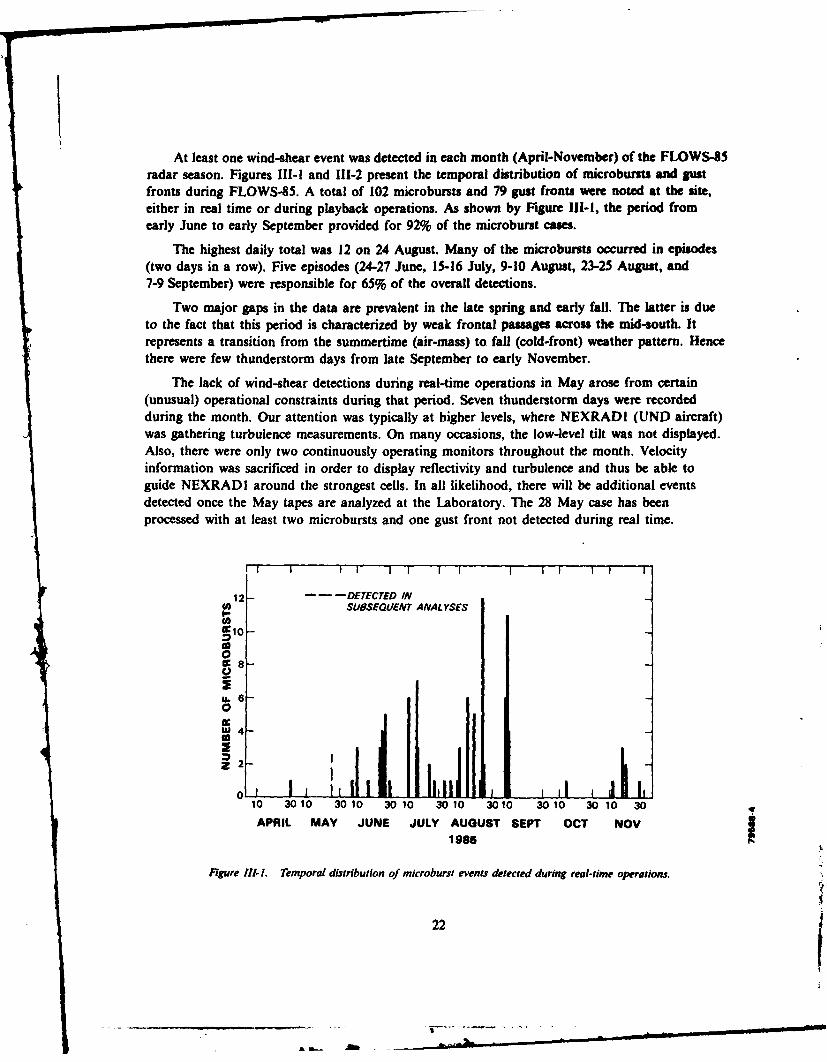
At least one wind-shear event was detected in each month (April-November) of the FLOWS-85radar season. Figures III-1 and 111-2 present the temporal distribution of microbursts and gustfronts during FLOWS-85. A total of 102 microbursts and 79 gust fronts were noted at the site,either in real time or during playback operations. As shown by Figure 111-1, the period fromearly June to early September provided for 92% of the microburst cases.
The highest daily total was 12 on 24 August. Many of the microbursts occurred in episodes(two days in a row). Five episodes (24-27 June, 15-16 July, 9-10 August, 23-25 August, and7-9 September) were responsible for 65% of the overall detections.
Two major gaps in the data are prevalent in the late spring and early fall. The latter is dueto the fact that this period is characterized by weak frontal passages across the mid-south. Itrepresents a transition from the summertime (air-mass) to fall (cold-front) weather pattern. Hencethere were few thunderstorm days from late September to early November.
The lack of wind-shear detections during real-time operations in May arose from certain(unusual) operational constraints during that period. Seven thunderstorm days were recordedduring the month. Our attention was typically at higher levels, where NEXRADI (UND aircraft)was gathering turbulence measurements. On many occasions, the low-level tilt was not displayed.Also, there were only two continuously operating monitors throughout the month. Velocityinformation was sacrificed in order to display reflectivity and turbulence and thus be able toguide NEXRADI around the strongest cells. In all likelihood, there will be additional eventsdetected once the May tapes are analyzed at the Laboratory. The 28 May case has beenprocessed with at least two microbursts and one gust front not detected during real time.
I'"I I I I I I I I I I 'I
12- -- -DETECTED INSUBSEoUENT ANALYSES
10-
o0
0
W4-
10 3010 3010 30 10 3010 3010 3010 30 10 30
APRIL MAY JUNE JULY AUGUST SEPT OCT NOVj
,Fgure 11-1I. Temporal distribution of microburst events detected during real-time operations,
22
Amt
*6
0S5-
i4 oU.
I 3--0
2 1
010 3010 30 10 3010 3010 30 10 30 10 30 10 30
APRIL MAY JUNE JULY AUGUST SEPT OCT NOV
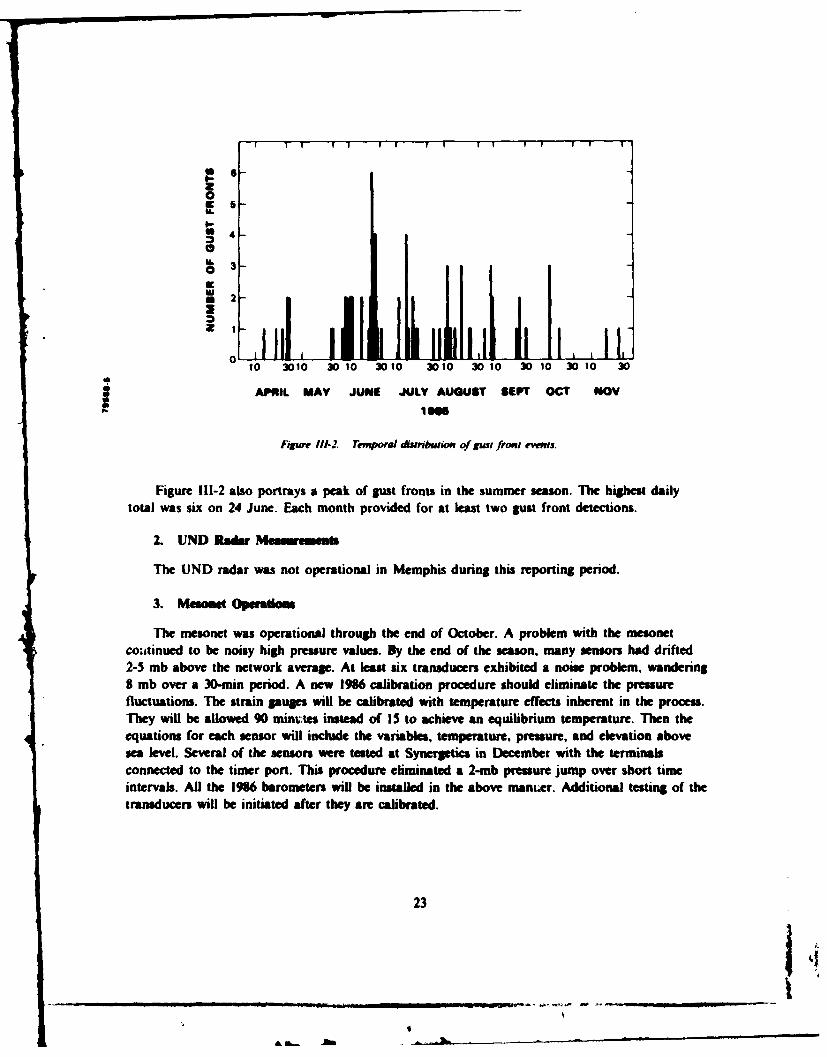
Figue 111-2. Temporal duisubumiOn of gust froni tvws.
Figure 111-2 also portrays a peak of gust fronts in the summer season. The highest daily
total was six on 24 June. Each month provided for at least two gust front detections.
2. UND Radar 1119
The UND radar was not operational in Memphis during this reporting period.
3. Mem Operalom
The mesonet was operational through the end of October. A problem with the mesonetcoutinued to be noisy high pressure values. By the end of the season, many sensors had drifted2-5 mb above the network average. At least six transducers exhibited a noise problem. wandering8 mb over a 30-min period. A new 1966 calibration procedure should eliminate the pressurefluctuations. The strain pups will be calibrated with temperature effects inherent in the process.They will be allowed 90 mintes instead of 15 to achieve an equilibrium temperature. Then theequations for each sensor will include the variables, temperature, pressure, and elevation abovesea level. Several of the sensors were tested at Synergetic. in December with the terminalsconnected to the timer port. This procedure eliminated a 2-mb pressure jump over short timeintervals. All the 1986 barometers will be installed in the above mantr. Additional testing of thetransducers will be initiated after they are calibrated.
23
l~~~~~ ML- AmI, , I. _]l - --
4. LLWSAS Opwamm
Sift peruomM CORand to mouser and cheap LLWSAS Wap on a mskl hauis. Thanvm lassm of data. The LLWSAS sysm we opumioal for th esatir perid and obsered
several wad-shie even"s after die mumo"e as no MWg operaiomal.
C. NUNTSVI~l OPERATIONU
I. - w DP IINIVII - e -i fp~af (COKMM)
Ther will be three umjor1 raM IOdDN pro1a oin as uuaneouslY in dhe Huntsville avudurning Judie and July. Tluise an: (1) FAAI Liacoln Laboratory Operational Weathier Stmdes(FLOWS) (2) Microburt and Sewn c7Tuaderstorus (MIST). and (3) Satlie. Puecipitation. andCloud Experiment (SPACE). Whil each of dim has its own gah sand priorities, there will becoordination between diem from tim to timer tlat wall make win of all the resoroc of dieindividual expenus to provide as cmrhniea data set as possible for some stormsituations. by pooling tie resouroc and focusing on specific storm. we all wilU benefit f romhaving more complecte information than any One program could provide alone.
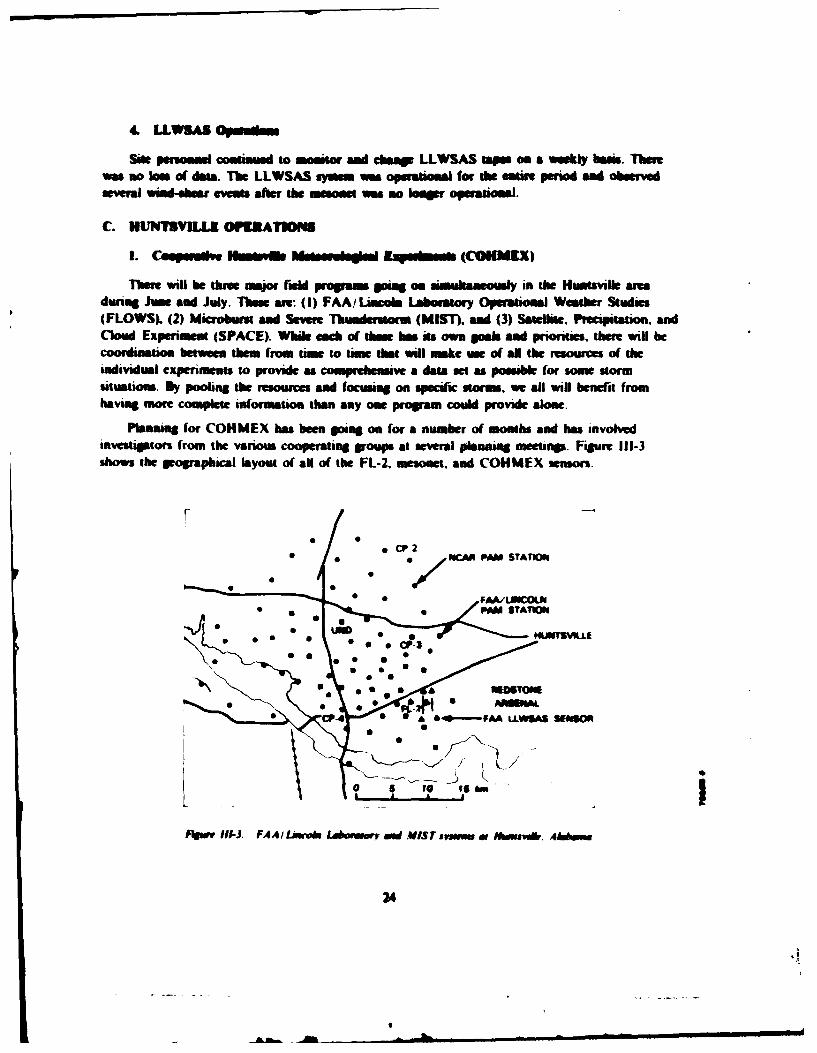
Planning for CON MEX has been going on for a number of months and has involvedinvestiptors from the variouas cooperating groupsn at several planing -meetump. Figure 111-3shows the geographical layout of all of the FL-2. mesonet, and COHMEX sensors.
hi LLWS 5L60
-i ' L
0
In addieo to ph="t for one cobboalimmmi diet wil sale plem waih MIST sod SPACE.we love bus. pbmws our -V do" commw 84o1es. We a~ad hove smard our domcollecton wish the FL-2 ainanmd whh the musmmot umm. Data amum ope ea lymAMmnhb mod carnatly a sshdukd so coomm -kbro the ead of Sopember IMS. Eamphmdutiag the IM~ ruld smm om a aulammod cme t m iher a Terwmal Doplr Wguhw Radar(TDWR) m=ae or a a NEXRAD mode.
We ame ammamptit to ple the dbmm-inm p asuckb a y that thelusepensoeml -o knew in my Sivm siumis whot operation wea to be penformud. This ameudies
wigea the penwal decison with MOMe to how. wham sOd when io ma the ria. me"l asAelssa p- ci -11aeman smm sbsmm hedi apatisomal gook. Tobins of cm
apeedicatiom have bee. nou to the oft for mrby opeinaom pemd These will be modifidor added to as aomary durning the COuNe of the experinm.
L. FL-1 N -
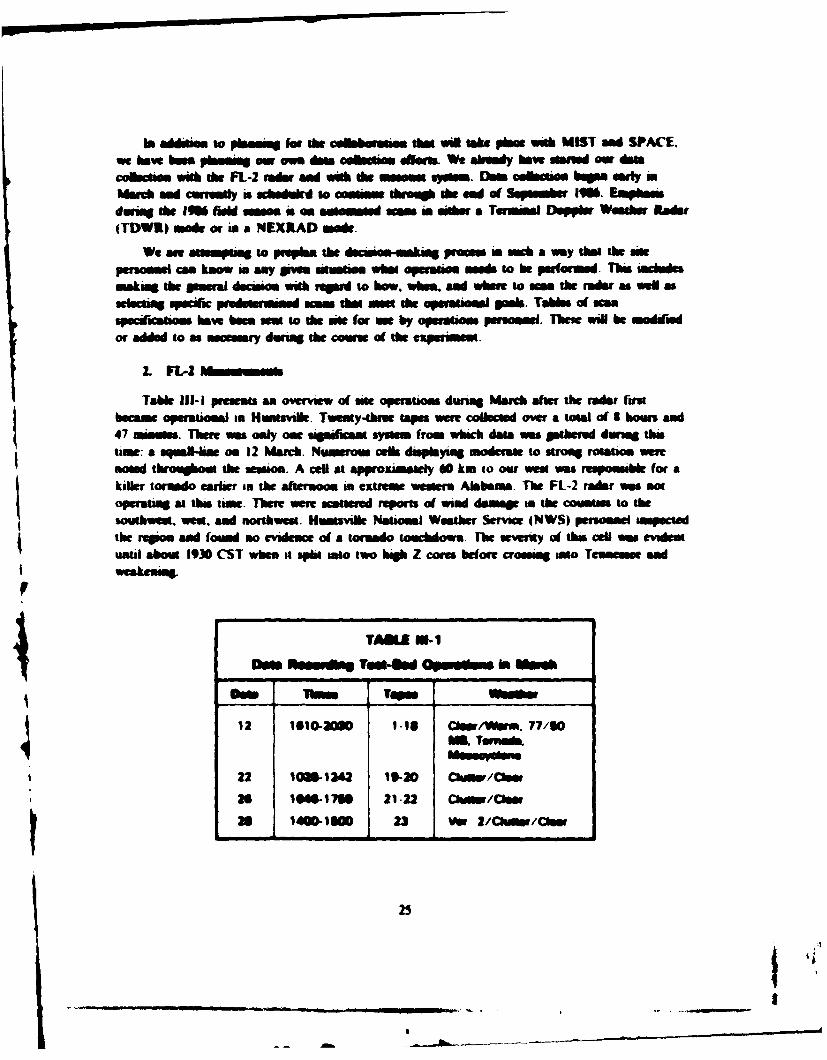
Tale~ lii "Oe"e am ownww of litte opeissous d"mulf Match Ofur the radar ItrsbecaI opersabomal to Hmusvdk. Tweasy-hroe topes wait collecled over a totad of I hows mad
47 ma-u- 1. Thenwa only oam s~ignfcm sytm fromo which date as .pthered dnring thistime: a squall-lm on 12 March. Nuinrom cells displaying modemse to strong rotation wmn"od 1"0"ou the wmcm A ocalla approsamasl 0 km to our *ws mrepomnibir forakiller tormado esther in the afterimoo am eatreme wesmn Alabama. The FL-2 radar wa noop 0ati at "he same. Then m e muered reports of mad daomp in the countes to the
southwvest. went, sd nrthwest. Humvi*l National Weather Servmc JNWS) pensose sampeictedthe region ad found no evdenm of a tornado, touchdow. the wwy of thes cil was evideauntl iliout 1930 CST when is spht ito, two bh Z coae before crosein auo leameme soid
TAM Wl-
00 ftmvdi Test-fd Omfes in om
ma rneft
22 10S-1242 19-20 ~/k
26 101WIMS 21-22 Camia/Ckm
as 140D-13 23 ve 2/Chmw/ckm
low
The smou me,. of temst en this day a depoted a the Meg at 3013 CST.1 ah Nmupsinad an ainuthal she a d rn/mjs over 4 des. It pebl coul a)GNmhv bms. h
enm~u -)Pa huogn a It - m sto dthe eamedt domqp Arab. Aleaw At a ramp of47 kok i is milbly donu the radiar col hove ina w i --md, vorte ilpaui in inal timn.Als. tbmel im0 e s A te wobm FL-2 blmking wee (IS dupes iher sil o atheb ASR10) at tbmH0owe Me nd thus a coepleft we Memoy is -- ailabl. lio*Wer numerous Rham,-asi of R~b depicsed an ovrhaMM. vault. weakseeb tosneb. am am updraft idowndomft core
a aeeimbsm with tbm eel. ThU Mn at Uwutille import sumw tbm am anol reporled adma "a* of Is a" Csmed fromi this sterm.
This ) s wam soewhat inique. smm it produced a mocrobuarst sher of 25 m/ s intheam am s Onbm ndo. The couplet spacing of I kmn psuud6 a radial ohea of 25 rn/s atIMI CST. SewW al of RHIS threulo thi steam depiceed cowergenee, /updraft on ibmrforward flank and dmpmdwdaem tbm femw flank.
The FLOWS unseam becmme fully instrumnned nea the end of March. The hardware wasinsgallhu dams tbm firs two weeks oftheb month while the last two weeks were dedicated to
iamumetaum ceckutThere was only on maailcant weather system on which we getheredradar dia without am operatoomal m AesA overvw of caibration work and majpor changesto the sysies an pMUtd in the followig pmraphis
Moist of the U0 imnueuts vequsrd tesmn and calibration mter the 1965 smason. Thetmmpeausue bsuadgt season were shipped to Vaesal for calibratio sine they bad driftdwopicanuty while in the f~i in Memphis. Tennessee Moss o( the wind speed and winddwureim sombrumu awe equipped with we beaiap. Howewr many of the units requiredadditoal adrustiena at the site prio to beng installad in the field. The barometers wrcalibraledin ia th MAR paumt chamber during January. New Daeta Collection Platform (DCP)equins m e, cded andl tstedo aotshe ise. A mapor chang shis year as that only 29 data valuesout of U will he uransaiwdso thed GOES saweli. Theme always has been one bad minute eachU0-usa block. sane the DCP shuts doa while it a transamtg We wil goo additional data foreach statin sweh as tbm pews supply Voage. MChI umasIMure piesaue transucertemperaturet. and Soler panel voltuP. New - -0 -we msns were installedl within thestyrofo af sn ext to the banomener to allow for a correlatomn between temperature andp tss- e cms. A mew wiringl prosooe batwa the pressure nor and DCP should providelen varhbty To"e st Syttergstac a Chi-ebe rewealsod a reduction of up to 2 mbs offluctuion was attaaie by this procaeAure
The IN1 beromete chbraoao vre-uwe shouldf providle for more reliable presure readingsEach ast of monsr was allowedl a seak time of 16 ina tso achieve a thermal equilibriumt Thiswil chmame wtmOP -yai pmsu- fluctuations expeaienced in 1983. The use o( a wade presuveramp wil mami additional caiboatmem of the ow bed a mowed to a choomiclly diffrenlocle P0uhraoY nosuola mdlicese doo a sta'omp correhitie betee puuoue input ad voltage
output was obtain d. Each ensor was tested at the site in February with an average error of7 ubs from the site microerorap. This is not ideal, but is betlef than the 19-mb deviation atthe beining of 1965. An addiional calibration constant will be determined for each station and
I cue in the software ia early April.
Data was pthered at the end of March to ascrtain if the software and hardware changeshad provided for mor reliable presre readings. Initial analysis revealed that only one sensorvaried by mom than 0.6 of( millibar over an hour. The span unit at the site will be installed inp of the questionable unit. There then will be no spare units in case further complicationsoccur this year.
The spatial distribution of mesonet sites is much the same as las year with the sensorsgenerally found to the south, west, northwest, and north of the radar. An averase station spacingof 3-5 km will allow the pound instruments to resolve even the smallest outflow. There areseveral gaps in the network that are designated as NCAR's PAM stations during COHMEX.Geographic grid coordinates, elevations, and sea-level factors already have been determined foreach station. The FL-2 site is equipped with a mesonet, anemometer (for the radome), and anLLWSAS within several hundred feet. Wind events in this area can be captured with goodresolution.
4. LLWSAS Operaldm
The Huntsville LLWSAS system became completely operational at the end of the reportingperiod with the addition of a sixth sensor. However, we were able to obtain several weeks ofdata with only five instruments fully operational. Site personnel change tapes weekly at theairport Control Tower. A digital readout of each station's wind speed and direction will bemonitored on a display in the FL-2 operations room. This will provide scientists with a detailedpicture of surface data in the airport area.
S. UND Operade
The UND C-bend weather radar became fully operational on I I June 1966. This sensor willparticipate in COHMEX operations and then remain in Huntsville to support FLOWS46 untilSeptember when it will be moved back to North Dakota for participation in its winter weatherprogram.
6. Addiemal Weede Dab
Weather charts and upper-air soundings were available to project scientists early in March.The soundings for four nearby stations i.e., Jackson, Mississippi; Nashville, Tennessee;Cvnurville, Alabama; and Athens, Georgia, are obtained each morning from WSl. Ther will beadditional soundings within the study am available at special times. The raw data along with theploned soundings an archived to ast in postevent analysi. Also, daily surface maps and radarsummries can be obtained from WSI in cae the DIFAX charts are unavailable.
27
-mom
A new procedure to obtan daily weather maps was initiated this year. The maps ameaval via a sauullite link from an AM Micro Earth Station installed on the roof of the FL-2operations traier. This system worked properly untl a series of pow outages at the ite in md-March caused the receiver to malfunction and be unable to acquire the appropriate signals. Anew unit was shipped from Alden the following day and has operated since without failure.
In order to receive an RRWDS line, site personnel must dial the desired station. There areno continuous hn dedicated to ths purpose yet. Whenever a storm tracks into the area, theaPP NWS radar must be displayed in order to obtain detailed information on intensityand movement. The RRWDS recorder starts as soon as the data is updated. A LAVOURASunit is being installed such that we can continually monitor the Huntsville NWS radar. This willprovide researchers a complete weather picture in the area for focusing on a narrow sector scan.
7. Climsw Aemie
During this quarter, the FL-2 radar was reassembled in Huntsville. Alabama. and initiallycalibrated. Following this operation, several subjective and objective clutter measurements weremade. The clutter measurements consisted of documenting saturation locations, tabulating radartarets of opportunity, and recording test scans.
The power reflected from a local mountain, Rainbow Mountain, was great enough tosaturate the AGC attenuator. The maximum return from the mountain was seen between 30 and50 degrees from North, at a rang of I I km. The peak reflectivity was noted from the real-timedisplays as being between 80 and 83 dBz. Greater accuracy of the peak reflectivity will beobtained from the test scans when the recorded tape is analyzed.
Five large fixed targets of opportunity were reported initially. Thes consisted of two watertowers and three microwave towers. They are listed in Table 111-2. The reflectivity of the radartargets will be determined from a clutter tape that was recorded in late March and contains thesetarets.
A total of two clutter tapes were recorded at the test site in March. This data will be usedto initially characterize the clutter environment around Huntsville. Clutter measurements will berecorded at regular interval during the 1906 operations.
L Adiiesial Ippest
A strong motvation for FLOWS participation in the COHMEX expenment is theavailability of data from many additional meserological sensors in the area. In this section. wediscuss briefly the use of mstrumened aircraft during CON MEX as well as a distnbuted ground-basd liGhtsi Mnor sytem knowns as the LLP Lightning Network. which is operated byNASA.
24
I I I IIIII i •_ I
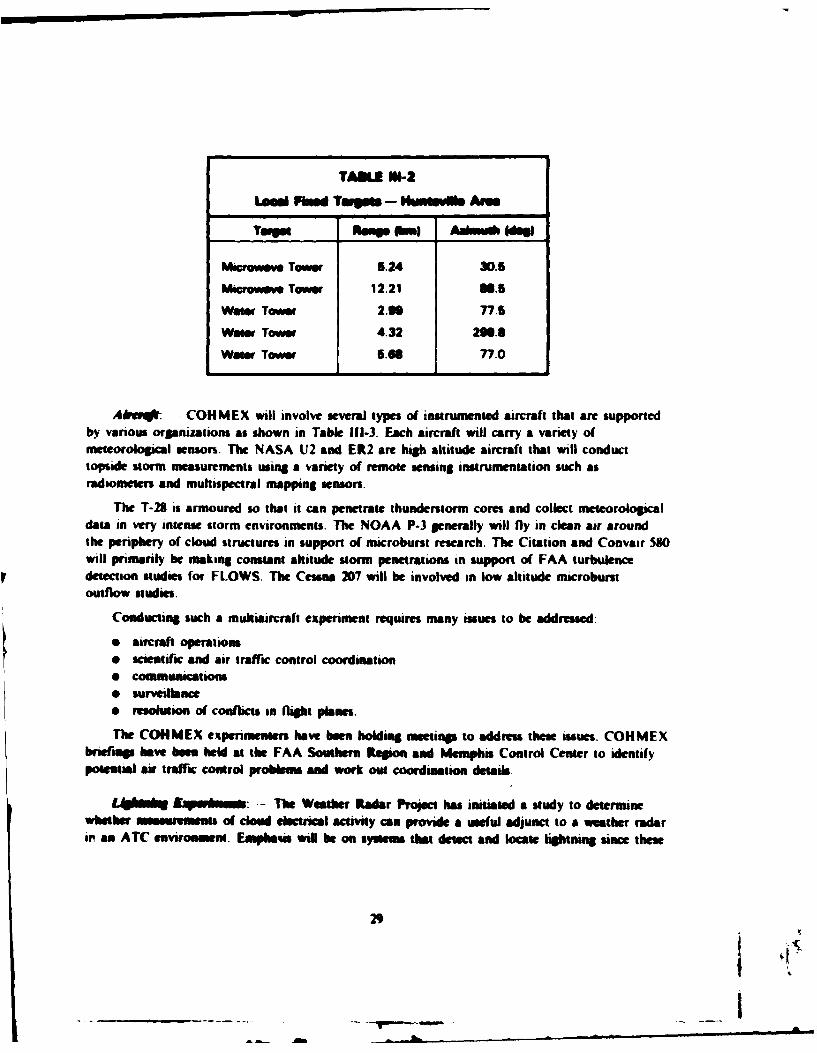
TAKLE 0-2
LMM. Plos TWgsW - HuMWU~ Am
Tergas Range 01M) Anu 40190
Mcroae- Tower 5.24 30.5Microwave Tower 12.21 U.SWater Tower 2.99 77.6WaOWe Tower 4.32 299.6WaOWe Tower G.66 77.0
Abwqt -COHMEX will involve several types of instrumented aircraft that are supportedby various organizations, as shown in Table 111-3. Each aircraft will carry a variety ofieteorological sensors. The NASA U2 and ER? are high altitude aircraft that will conduct
topside storm measurements using a variety of remote sensing instrumentation such asradmomen and multispectral mapping sensors.
The T-25 is armoured so that it can penetrate thunderstorm cores and collect meteorologicaldata in very intense storm environments. The NOAA P-3 generally will fly in clean air aroundthe periphery of cloud structures in support of microburst research. The Citation and Convair 550will primarily be mnaking constant altitude storm penetrations in support of FAA turbulencedetection studies for FLOWS. The Cessna 207 will be involved in low altitude microburstoutflow studies.
Conducing such a multaarcraft experiment reqinres many issues to be addresd
" aircraft operations"scientific and air traffic control coordination
TeCOsMEe xpgnmnsei hav benhlig etn o address thew isue. COBMEX
brifigs have baen held at the FAA Southern Resion and Memphis Control Center to identifypotnia air traffic control problems and work out coordination details
L~ £~W~: -- The Weathe Radar Projec has initiated a study to determinewhether in-of cloud chctrical activity can provide a useful adjunct to a weather radarin an ATC environt Empharis wigl be on systm that detect and locate lightnig since thewe
2,
I L_ _ _ _ _ _ _ _ _ _ _ _ _ _ _ _ _ _ _l i m b
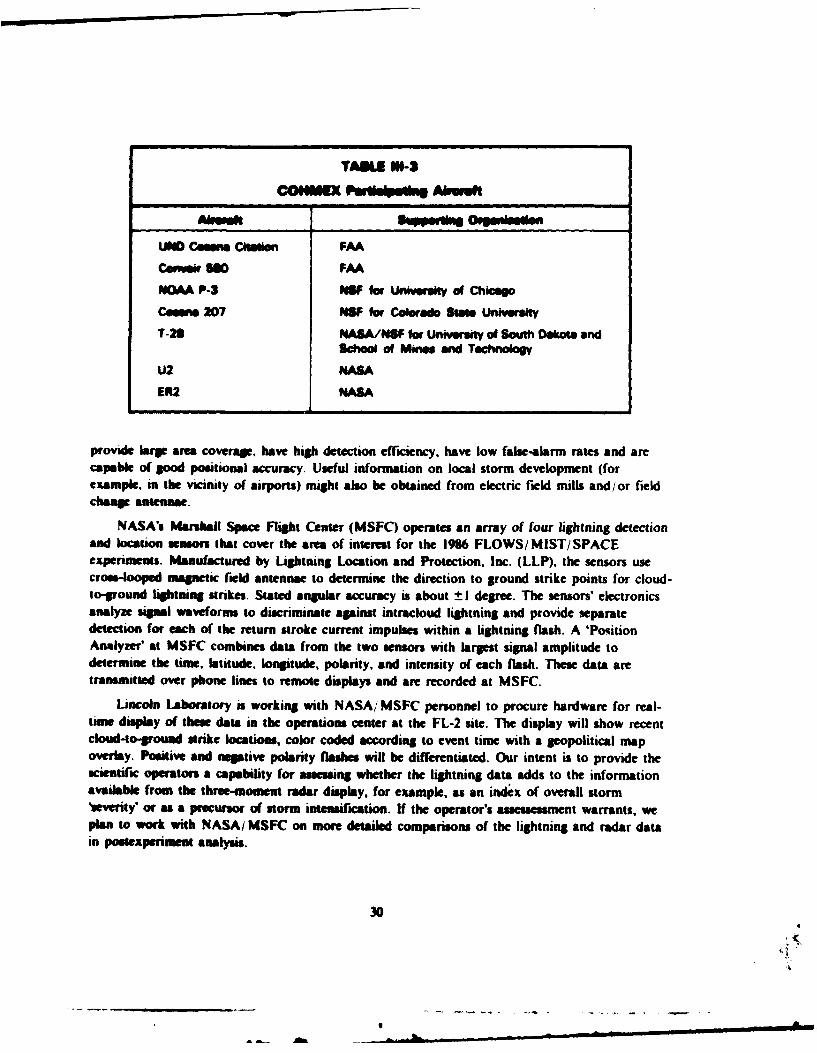
TAKNE NW-3ypmvu ee-sumf-ONI -oepe Akaf
UND CAmOM CtAtion FAA
CeWAr I0O FAANOAA P-3 NSF for University of ChicagoCoame 207 NSF for Colorado St. UniversitT-21 NASA/NSF for University of South Dakota and
School of ?Ines and TechnologyU2 NASAER2 NASA
provide larg arm coverage. have high detection efficiency, have low false-alarm rates and arecapable of good positional accuracy. Useful information on local storm development (forexample, in the vicinity of airports) might also be obtained from electric field mills and/or fieldchange antennae.
NASA's Marshall Space Flight Center (MSFC) operates an array of four lightning detectionand location sensors that cover the area of interest for the 1986 FLOWS/MIST/SPACEexperiments. Maaufactured by Lightning Location and Protection, Inc. (LLP), the sensors usecross-looped magnetic field antennae to determine the direction to ground strike points for cloud-to-round lightning strikes. Stated angular accuracy is about ±_ degree. The sensors' electronicsanalyze signal waveforms to discriminate apinst intracloud lightning and provide separatedetection for each of the return stroke current impulses within a lightning flash. A 'PositionAnelyzer" at MSFC combines data from the two sensors with largest signal amplitude todetermine the time, latitude, longitude, polarity, and intensity of each flash. These data aretransmitted over phone lines to remote displays and are recorded at MSFC.
Lincoln Laboratory is working with NASA/MSFC personnel to procure hardware for real-time display of thes data in the operations center at the FL-2 site. The display will show recentcloud-to-grouvd strike locations, color coded according to event time with a geopolitical mapoverlay. Positive and neptive polarity flashes will be differentiated. Our intent is to provide thescientific operators a capability for aessing whether the lightning data adds to the informationavailable from the three-moment radar display, for example, as an index of overall storm
everity' or as a precursor of storm intensification. If the operator's assessessment warrants, wepla to work with NASA/ MSFC on more detailed comparisons of the lightning and radar datain posexperiment analysis.
30
ARM,
e .- I I I n
IV. EXPERIMENTAL DATA REDUCTIONAND ALGORITHM DEVELOPMENT
A. PERKIN-ELMER (P.E.) COMPUTER SYSTEMS
The PE3260 and PE3240 computer systems experienced heavy use during this reportingperiod. While the machines exhibited signs of overloading on occasion, hardware problems werenot a limiting factor. In fact, the recent trend toward improved reliability has continued, andhardware problems, serious or otherwise, have become relatively infrequent.
The V-building PE3260 (moved from Memphis after shutdown of the Memphis site) wasupgraded with an additional 8 megabytes of main memory, bringing the total to 16 megabytes.The additional memory and the single Auxiliary Processing Unit (APU) have been instrumentalin increasing system throughput.
Three STC 6250-bit-per-inch (bpi) 9-track tape drives were delivered during the quarter. Onewas integrated with the V-building PE3260, while two were integrated with the Annex-Il PE3240.These additional tape drives serve two useful functions: to help reduce the tape drive bottleneckin the data processing effort, and to permit translation of future radar data tapes from FL-2 thatwill be recorded at high density.
The PE3240 formerly in V-building (displaced by the Memphis PE3260) was intendedoriginally for 'batch' processing operations. However, a temporary lack of peripheral equipmenthas postponed plans for use of that system. Two Fujitsu Eagle disk drives (474 megabytes each)were ordered during the quarter. One disk will be integrated with the 'batch' PE3240, the otherwith the V-building PE3260.
It was hoped that the Annex II PE3240 might be upgraded to a full 16 megabytes of mainmemory, which would greatly facilitate real-time system software development efforts. However,it was determined finally that such an upgrade would require the purchase of an extra cabinetand memory chassis, as well as an additional memory controller board. The cost effectiveness ofsuch an upgrade is uncertain, especially when compared to the option of an upgrade to a PE3250CPU and cabinet, which would support the 16 megabytes of memory in stock form. After issuingan RFI (Request for Information) and receiving a quote pertaining to the two options, a PE3250upgrade was ordered.
3. SUN WORKSTATIONS
It has been apparent for some time that the P.E. systems were seriously inhibiting algorithmdevelopment and data analysis due to:
(a) poor software development facilities,(b) inadequate file sharing, and(c) insufficient computation capability (relative to the number of time share users).
31
-As
,Am- r
A study of the options currently available found that a network of engineering workstationswould provide the most cost-effective, near-term solution. Such workstations offer substantialcomputational capabilities - typically half those of a PE3240 and generally augmentable to twicethose of a PE3240. The workstations possess integral, bit-mapped graphics displays that are well-suited to the display and manipulation of the sorts of weather imagery with which the projectworks. Furthermore, these workstations incorporate a wide range of software tools andprogramming aids that are specifically intended to assist software development efforts such asthose of the project. Finally, these workstations promote the effective sharing of computationaland peripheral resources through the use of highly transparent LANs.
Intensive discussions with major vendors and the issuance of an RFI resulted in a decisionto purchase a network of engineering workstations from SUN Microsystems, Inc. The selectednetwork consists of 15 monochromatic workstations, 4 hybrid workstations -possessing bothcolor and monochromatic monitors, two servers, approximately 1.9 gigabytes of disk storage andother peripherals. The workstations and servers are all based on the Motorola 68020/68881 chipset. Four workstations, two monochrome and two hybrid, have been designated as publicworkstations; all others will be devoted to individual group members.
The workstation network is expected to aid productivity substantially in the data analysisand algorithm development areas. The workstation network will be connected to the LexingtonP.E.s and Apollo workstations via an Ethernet LAN as depicted in Figure IV-1.
Components of the data analysis SUN workstation network began to arrive in late February.By the end of March, most of the components had arrived and several of the workstations wereoperating as 'stand-alone' devices. Cabling and ancillary equipment required to implement thenetwork have been installed. The total network should become operational with the arrival andinstallation of the disk/ tape servers. As most of the workstations were purchased without diskdrives, the disk servers are prerequisites for the operation of most of the other devices on thenetwork.
The operating system supplied with the SUN workstations is the BSD4.2 dialect of UNIX.This operating system is substantially different from the Perkin-Elmer 05/32 operating systemthat has been in use by the weather project to date. An arrangement was made with SUN'sLexington Field Office to provide a six-day course covering BSD4.2 UNIX, as well as topicsspecific to the SUN workstations. The first two sessions of this course were held in late March.It is expected that this course will greatly facilitate the speed with which the SUNs are integratedinto the project's data analysis effort.
C. RADAR DATA ANALYSIS
Radar data analysis got started in a more organized manner during this period. The initialstep was to prioritize all of the data to be processed according to several criteria. These criteriaincluded the number of microbursts on a given day, the locations of these microbursts relative tothe mesonet and relative to the optimum dual-Doppler areas, the number of data tapes collected
32
An*
IEN (M.a,":'in
DELN (A)I- I DELNI (82)
WORKSTATIONS WORKSTATIONS
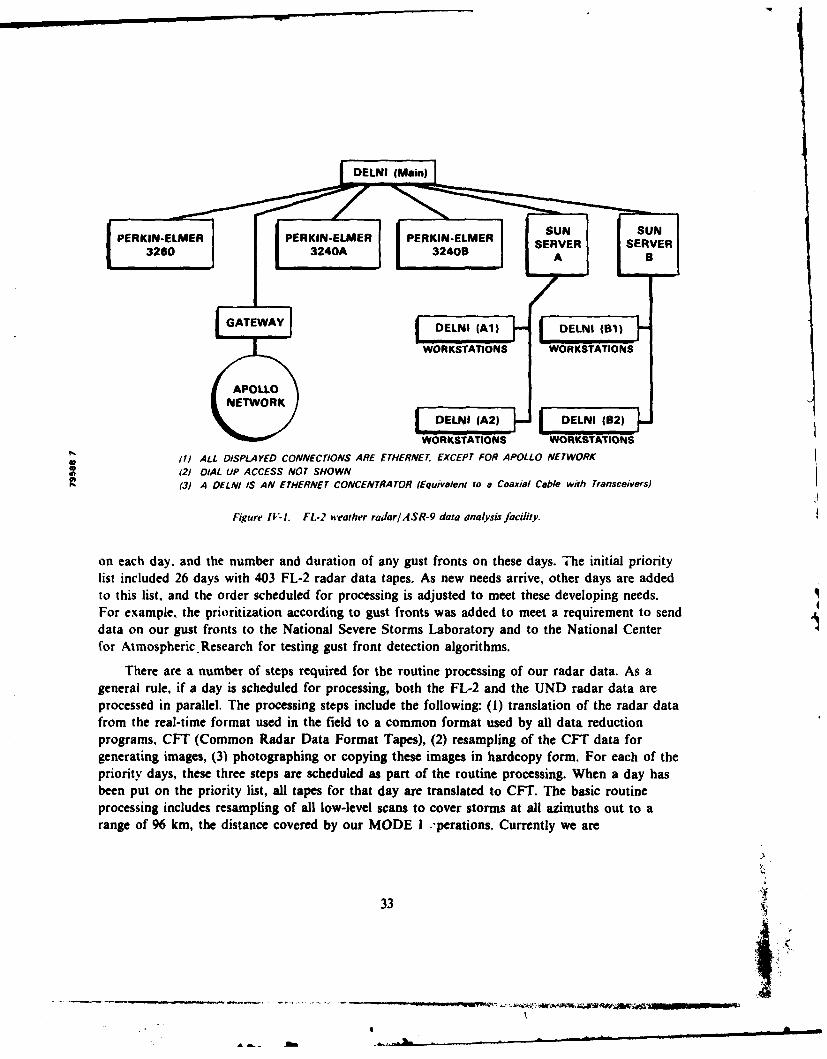
S(11 ALL DISPLAYED CONNECTIONS ARE ETHERNET. EXCEPT FOR APOLLO NETWORK*(21 DIAL UP ACCESS NOT SHOWN
(3) A DELNI IS AN ETHERNET CONCENTRATOR (Equivalent to a Coaxial Cable with Transceivers)
Figure IV-I. FL-2 weather radar/ASR-9 data analysis facility.
on each day. and the number and duration of any gust fronts on these days. The initial prioritylist included 26 days with 403 FL-2 radar data tapes. As new needs arrive, other days are addedto this list, and the order scheduled for processing is adjusted to meet these developing needs.For example, the prioritization according to gust fronts was added to meet a requirement to senddata on our gust fronts to the National Severe Storms Laboratory and to the National Centerfor Atmospheric. Research for testing gust front detection algorithms.
There are a number of steps required for the routine processing of our radar data. As ageneral rule, if a day is scheduled for processing, both the FL-2 and the UND radar data areprocessed in parallel. The processing steps include the following: (1) translation of the radar datafrom the real-time format used in the field to a common format used by all data reductionprograms, CFT (Common Radar Data Format Tapes), (2) resampling of the CFT data forgenerating images, (3) photographing or copying these images in hardcopy form. For each of thepriority days, these three steps are scheduled as part of the routine processing. When a day hasbeen put on the priority list, all tapes for that day are translated to CFT. The basic routineprocessing includes resampling of all low-level scans to cover storms at all azimuths out to arange of 96 km, the distance covered by our MODE I J-perations. Currently we are
33
Jon
photographing these using a Dunn color camera on 35-mm film or using the ink jet plotter. Thepurpose of this base-level processing is to provide a quick-look capability that can be used todetermine where more detailed processing is needed.
After the initial processing had been started, we examined the output data to determine ifthere were any problems in the translation process. Two problems were found that requiredchanges in the translator: one involved a range error of 460 m found in the FL-2 data; thesecond was that the method used to determine signal-to-noise ratio was judged inadequate.
A signal-to-noise estimator based on all three autocorrelation lags was used. The procedurewas changed to the conventional signal-to-noise estimator that uses only the zeroth lag to givemore meaningful results. While the results of the translations using the old translator were notnoticeably flawed for most purposes, the earlier data were retranslated to eliminate any possibleerrors.
During the period there was a concerted effort to determine the radar-detectablecharacteristics of microbursts in the 1985 data from Memphis. The purpose of this analysis wasto provide guidance to contractors proposing to build TDWRs for the FAA. The results of theseanalyses suggest that microbursts in the Memphis area usually were associated with mature butnonsevere thunderstorms that produced moderately heavy rainfalls. The outflows associated withthese microbursts were generally less than 1000 m thick and often had leading edges (gust fronts)that were moderately turbulent.
D. MESONET/LLWSAS DATA ANALYSIS
The wind data, which had been continuously collected by the mesonet and LLWSASnetworks during 1985, will be compared with Doppler radar data that was collected duringthunderstorm activity. The results will be used to (1) confirm Low Altitude Wind Shear (LAWS)and other possible hazardous weather events detected by the radar, and (2) provide an indicationof possible undetected wind-shear events. The additional meteorological data collected by thenetwork will be used to diagnose the relationship between temperature, pressure, relativehumidity, rainfall, and winds during these events and thus to gain a better understanding of thecauses and circumstances of low altitude wind shear.
A software package consisting of various programs to process and analyze mesonet andLLWSAS data has been further refined and implemented. The data from both mesonet(30 stations) and LLWSAS (6 stations) is translated into a Common Instrument Data Format(CIDF). By the end of March, translation of both mesonet and LLWSAS data into the CIDFformat had been completed for all of the data collected in Memphis during 1985.
Having translated mesonet and LLWSAS data, we have begun the search for microbursts.An algorithm formulated by Ted Fujita for detecting microbursts at the surface, using onlymesonet and LLWSAS data, has been implemented using the 1985 data set as input. Thisalgorithm has been run on the data from February through mid-October 1985. Plots containingmeteorological information on these detected microbursts are being generated and analyzed. This
34
I
process will provide a means to determine the validity of these microbursts. This analysisprocedure has progressed through the data up to August 1985.
It has become evident that the Fujita microburst algorithm (which uses only single station
time series to detect microbursts) produces a large false alarm rate. To alleviate this problem, a
more sophisticated microburst detecting algorithm (Triangular Divergent Microburst Algorithm)that considers the spatial distribution of winds at several stations for a given instant of time is
being implemented to work coincident with the Fujita algorithm. This newer algorithm, which
was used by Wes Wilson on the NCAR mesonet data, has been coded into a software package.Testing of this algorithm has begun.
A plotting program that was designed to aid the meteorologist in analyzing the FLOWSmesonet data has been further improved by expanding its present cababilities. This programinitially was written for the purpose of plotting wind speed and direction over the entire mesonetarea. In late 1985, this program was given the additional capability to plot rainfall rates, and,during the first quarter of 1986, several other meteorological parameters were added to theplotting routine. These parameters are: filtered pressure, equivalent potential temperature, relativehumidity, average and peak wind speed, and direction.
E. LOW-ALTITUDE WIND-SHEAR (LAWS) DETECTIONALGORITHM DEVELOPMENT
The low-altitude wind-shear (LAWS) detection algorithm development effort is aimed atproducing an automatic procedure for recognizing hazardous wind-shear events from Dopplerweather radar measurements. Preliminary real-time algorithm testing will take place during the
1986 experiment at Huntsville, with a major real-time operational demonstration scheduled to beheld in Denver, Colorado, during 1987/1988.
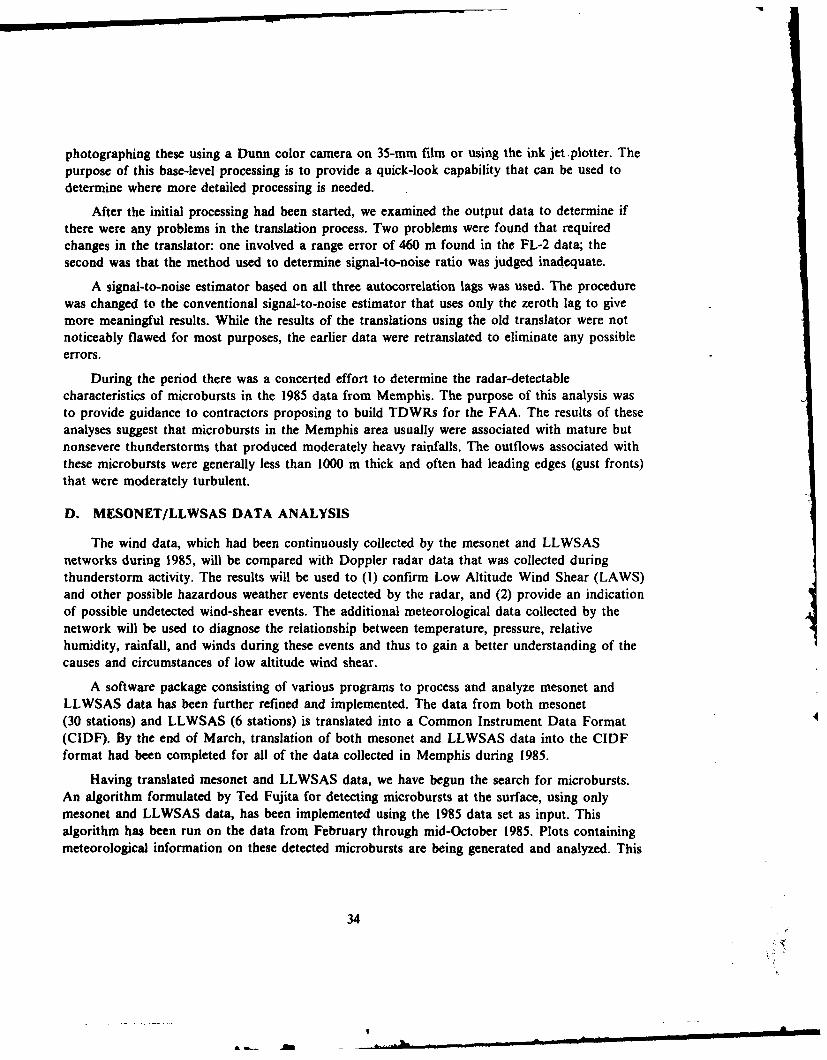
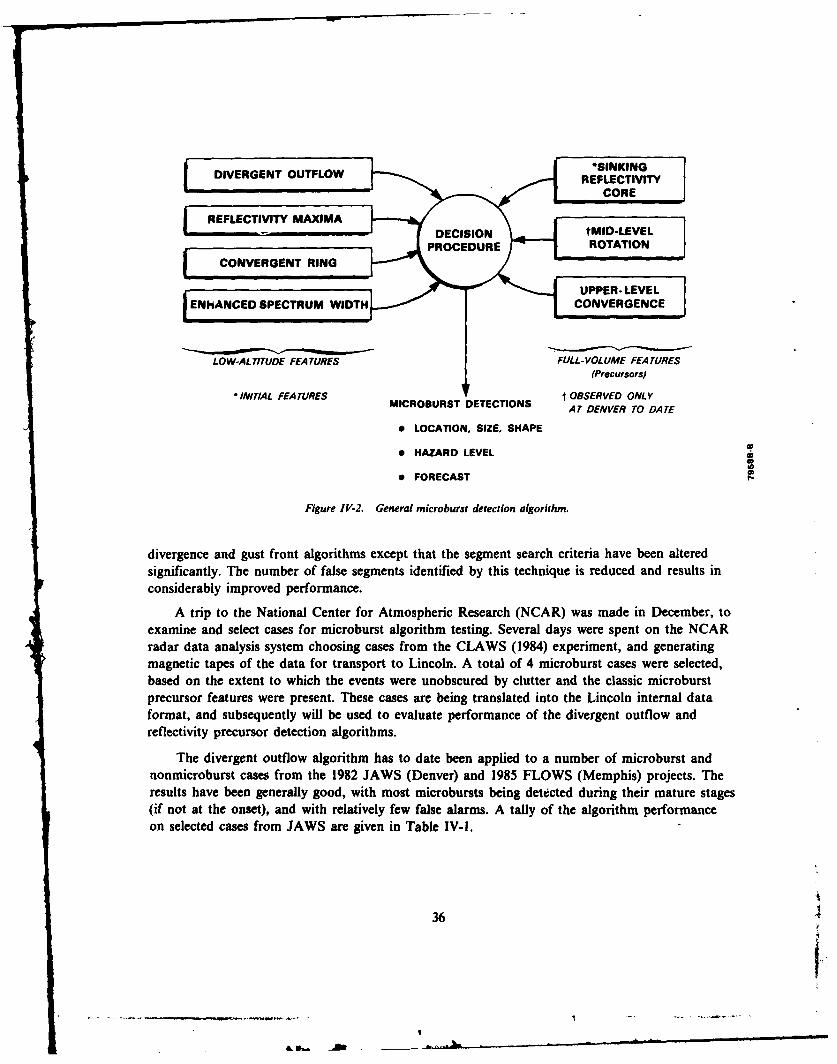
Figure IV-2 illustrates the general approach taken to the detection problem. In thisapproach, several feature extraction algorithms examine the radar observables attempting tolocate specific signatures that are characteristic of microbursts. The extracted features then arecombined to form final decisions on the absence or presence of hazards. The low-altitude features(divergent outflow, reflectivity maxima, etc.) are available in both on- and off-airport sitingscenarios, and are directly linked to the actual hazard to aviation. The upper altitude features(rotation, convergence, sinking core) are only available when the radar is sited away from theregion to be protected, and serve more as precursors to the outflow event than as an actualindicator.
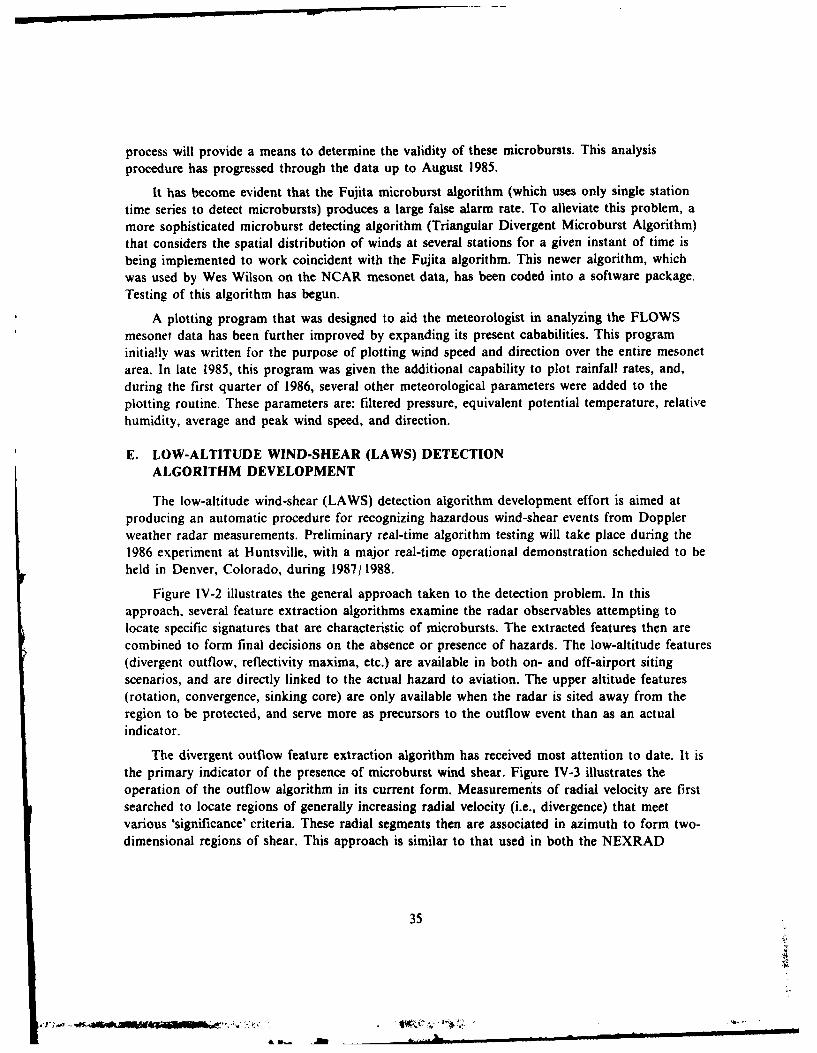
The divergent outflow feature extraction algorithm has received most attention to date. It isthe primary indicator of the presence of microburst wind shear. Figure IV-3 illustrates theoperation of the outflow algorithm in its current form. Measurements of radial velocity are firstsearched to locate regions of generally increasing radial velocity (i.e., divergence) that meetvarious 'significance' criteria. These radial segments then are associated in azimuth to form two-dimensional regions of shear. This approach is similar to that used in both the NEXRAD
35
- -,"4
a..- in
S DIVERGENT OUTFLOW *,, I SINKING
REFLECTIVITYFI
RELCINITY EA RES DEISO OBS -EVEL
PROCEDURE ROTATIONCONVERGENT RING
ZUPPER-LEVEL[ENHANCED SPECTRUM WIDTH CONVERGENCE
LOW-ALTITUDE FEATURES FULL-VOLUME FEATURES
(Precursors)
* INITIAL FEATURES "t OBSERVED ONLYMICROBURST DETECTIONS ATDNETOAE
0 LOCATION. SIZE, SHAPE
HAZARD LEVEL
FORECAST
Figure iV-2. General microburst detection algorithm.
divergence and gust front algorithms except that the segment search criteria have been alteredsignificantly. The number of false segments identified by this technique is reduced and results inconsiderably improved performance.
A trip to the National Center for Atmospheric Research (NCAR) was made in December, toexamine and select cases for microburst algorithm testing. Several days were spent on the NCARradar data analysis system choosing cases from the CLAWS (1984) experiment, and generatingmagnetic tapes of the data for transport to Lincoln. A total of 4 microburst cases were selected,based on the extent to which the events were unobscured by clutter and the classic microburstprecursor features were present. These cases are being translated into the Lincoln internal dataformat, and subsequently will be used to evaluate performance of the divergent outflow andreflectivity precursor detection algorithms.
The divergent outflow algorithm has to date been applied to a number of microburst andnonmicroburst cases from the 1982 JAWS (Denver) and 1985 FLOWS (Memphis) projects. Theresults have been generally good, with most microbursts being detected during their mature stages(if not at the onset), and with relatively few false alarms. A tally of the algorithm performanceon selected cases from JAWS are given in Table IV-l.
36
II
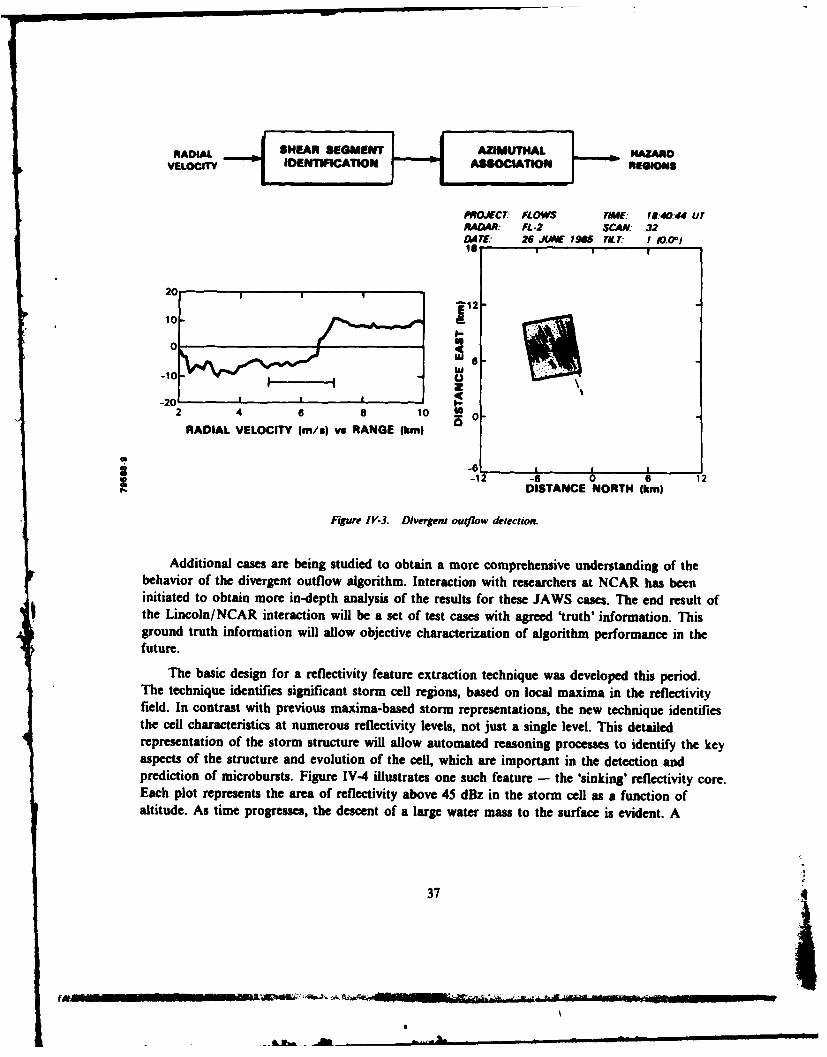
RADIAL $HA SEGMENTAIMTA HAZARDVELOCITY IDENTIFICATION ASCAINRGOI
PROJECT- FLOWS TIME 18.4044 UTRADAR: FL-2 SCAN: 32DAT : 26 J 1M5 TrIL ( 0.o)
12-
20
-10 6wt
24 6 e 10 2 0
RADIAL VELOCITY Im/s) vs RANGE (kin)
-12 -6 0 6 12DISTANCE NORTH (km)
Figure IV-3. Divergent outflow detection.
Additional cases are being studied to obtain a more comprehensive understanding of thebehavior of the divergent outflow algorithm. Interaction with researchers at NCAR has beeninitiated to obtain more in-depth analysis of the results for these JAWS cases. The end result ofthe Lincoln/NCAR interaction will be a set of test cases with agreed 'truth' information. Thisground truth information will allow objective characterization of algorithm performance in thefuture.
The basic design for a reflectivity feature extraction technique was developed this period.The technique identifies significant storm cell regions, based on local maxima in the reflectivityfield. In contrast with previous maxima-based storm representations, the new technique identifiesthe cell characteristics at numerous reflectivity levels, not just a single level. This detailedrepresentation of the storm structure will allow automated reasoning processes to identify the keyaspects of the structure and evolution of the cell, which are important in the detection andprediction of microbursts. Figure IV-4 illustrates one such feature - the 'sinking' reflectivity core.Each plot represents the area of reflectivity above 45 dBz in the storm cell as a function ofaltitude. As time progresses, the descent of a large water mass to the surface is evident. A
37 i_
f d l _- -' -" _ . . . - :,l m : ' -: * . . . . ..-: ' .. . .. _ , . . .. . -A. ...fnt
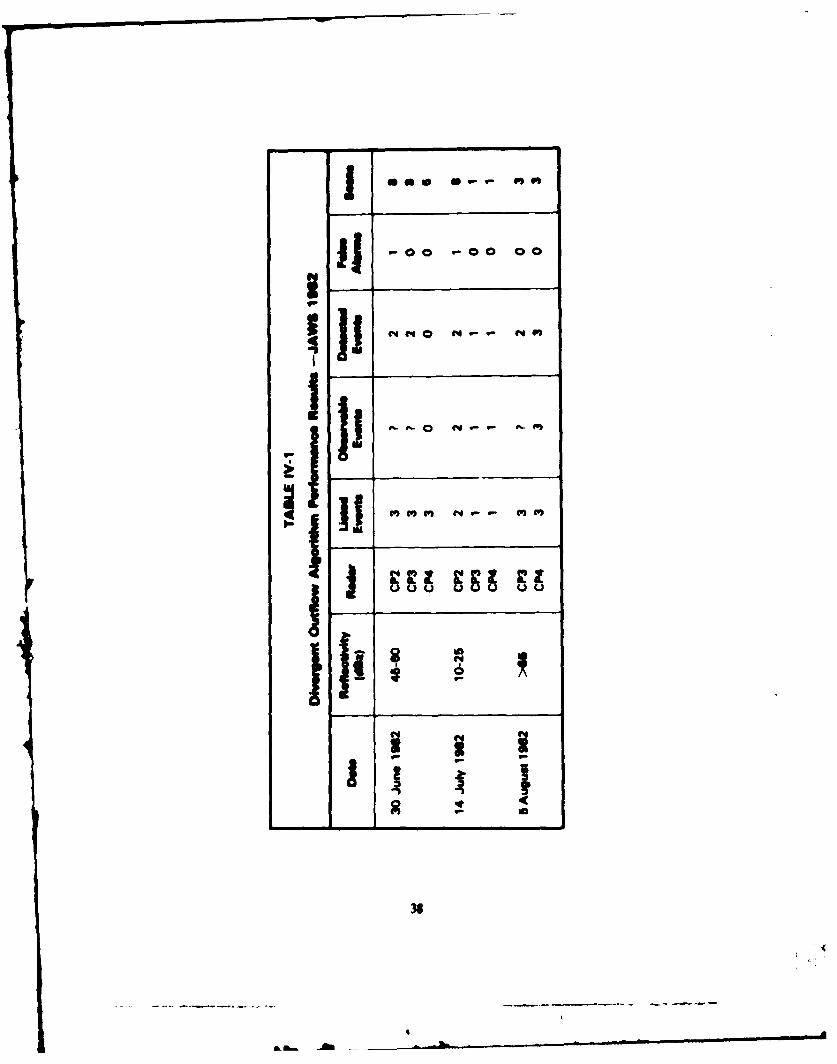
- i - .
-00 c
c I
ii oi '~ i~-0 Cd~-4
il _____
I' s38
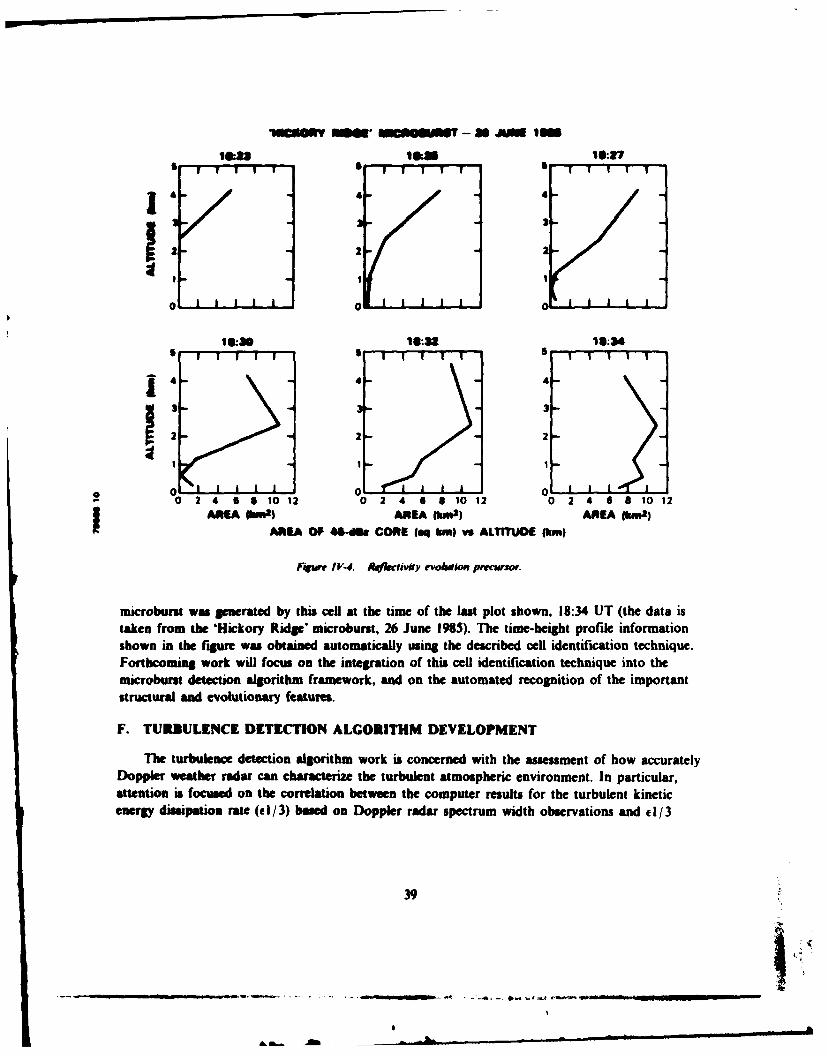
11=01V m " UIgSuST - N JUN Im
law 165 IOL-27
2
,0. 11 i 10 1111 I1 0
MS30 1111:32 13:34
J4 4- 41 1a 0:)3- 3-" 3-
o 00 2 4 6110 12 0 2 4 6 8 10 12 0 2 4 6 8 10 12
AREA 0M02 AREA Puk2) AREA phnm)
ANEA OF 45-dma CORE (lq haml vs ALTITUDE fkn)
FAup" IV-4. Reflectiiy evoalwio precrsor.
microburst was generated by this cell at the time of the last plot shown, 18:34 UT (the data istaken from the 'Hickory Ridge' microburst, 26 June 1915). The time-height profile informationshown in the figure was obtained automatically using the described cell identification technique.Forthcoming work will focus on the integration of this cell identification technique into themicroburut detection algorithm framework, and on the automated recognition of the importantstructural and evolutionary features.
F. TURBULENCE DETECTION ALGORITHM DEVELOPMENT
The turbulence detection algorithm work is concerned with the assessment of how accuratelyDoppler weather radar can characterize the turbulent atmospheric environment. In particular,attention is focused on the correlation between the computer results for the turbulent kineticenergy dissipation rate (el/3) based on Doppler radar spectrum width observations and c1/3
39
|~
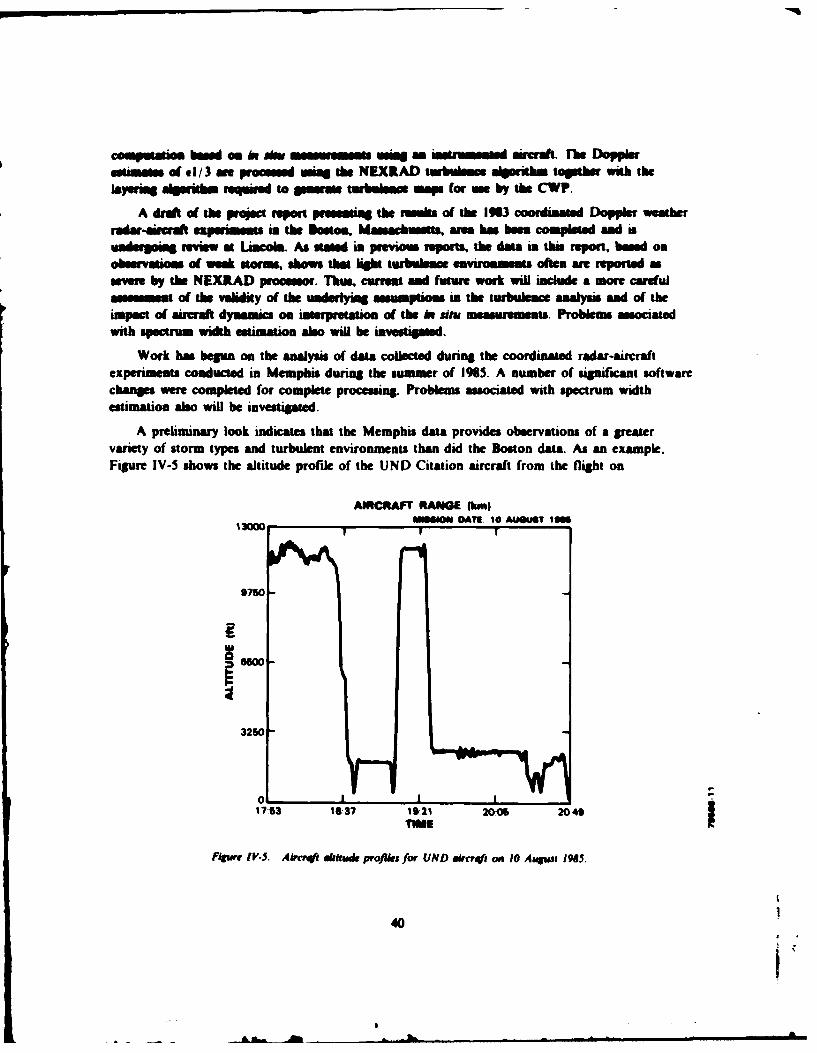
computao based as in Aw inureus unig am imivse ii aircraft. lbs Dopplerutmmof 1/ 3me presumed iig theNEXIADttumbule- uleseithat togeter with the
layeuing aWishomireqed to * - -1 turbeilem.. mige for usne by the C WP.
A draft of the project report preentig the resnls of the 1963 coordinated Doppler weatherradar-armnk expeiments In the ketoma, IMauachats am has bae completed and a
-.dmgsma reie at Limola. As tsd in previous reports. the data in this epoi , based onobeervatio of weak utorw shows that Ught turbulence saviroaneat often are reported assevere by the NEXRAD processo . Thus, curreat and future work will isiciude a more careful
ateementof the vabfdty of the uaderlyin assumptiois a the turbulence analysis and of theimpact of aircraft dynamics on interpretation of the in adsu Iwasu-Imets. Problem associatedwith spectruma width estimation also will be investigatd.
Work has begun on the analysis of data colected during the coordinated radar-aircraftexperiments conducted in Memphis during the summer of 1985. A number of significant softwarechanges were completed for complete processing. Problem associated with spectrum widthestimation also will be investigated.
A preliminary look indicates that the Memphis data provides observations of a greatervariety of storm types and turbulent environments than did the Boston data. As an example.Figure lV-5 shows the altitude profile of the UNI) Citation aircraft from the flight on
AIRCRAFT RANGE (1m)OMeoM DATI. 10 AUGUST IeS
9750
32W50
01
17163 13:37 1911 20,05 2049
Figure II'-S. Alrcvi IEEIud profiles for UND uircrqft on 10 Aaqwa 1983.
40
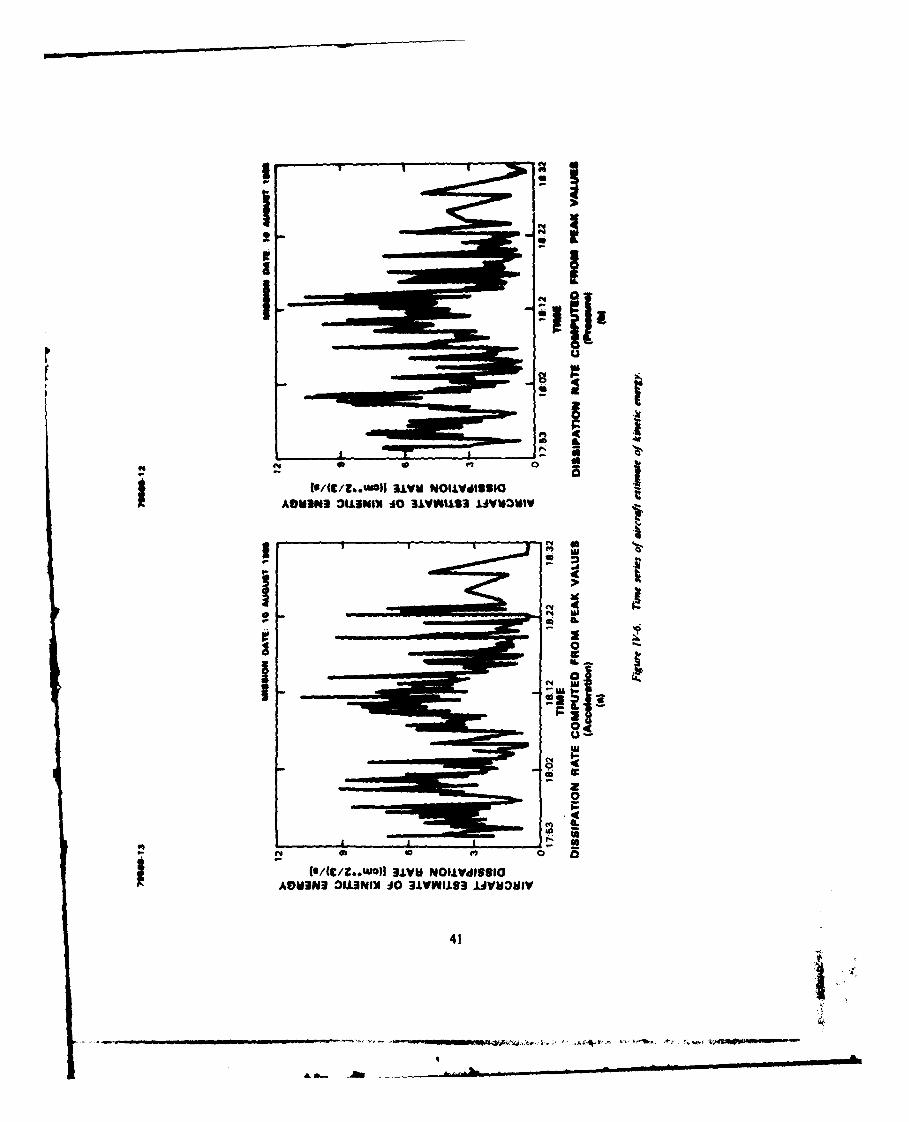
I SCC.al3imwuaslI DB3O NN4 3VS1 VOI
1 0 j
414
Al.-
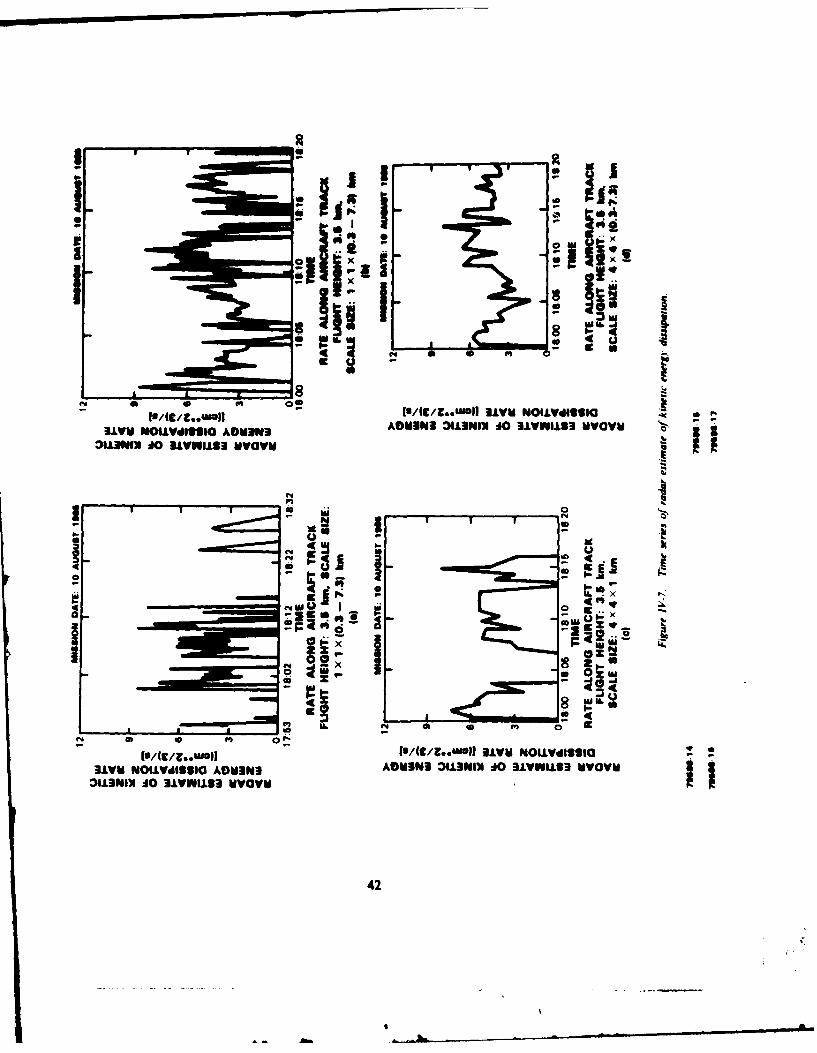
USC9.81 31UNOV18
3JLVV ~ ~ twujPs~ Ae53AVN LNN4 1VL2 V
SAM
X~'zL
- I4a sI/.ul 1mNudsl
Ua o~dsl D30AVN U I O3VI2 VV0113I~l 0 31WU93VVG*
42g
10 August 1965. Compmau* the four coumta' alitude sepat, it is clear that the turbulenceeavironment, n indicated by the ability of the airraft to maintain constant altitude, wassignifcandy differem for the d nt segmem. Temporal variations are also evident, forexample, by comparing the two wagmts at 12,000 feet. Figure tV-6 shows the time series ofcomputer #1/3 values amociated with the fir flight segment at 12,000 feet. Figure IV-6a is basedon the acceleration structure function while Figure IV4b is based on the pressure structurefunction. As in the Boston data, there is reasonable agreement between these two computationalprocedures. In contrast to the Boston data, this particular segment indicates much greater shortterm variability in the turbulence and an overall increase in the intensity of turbulence.Figure IV-7a shows the corresponding plot of radar-based 01/3 computations using a I-km-thicklayer with a horizontal resolution of I km X I km. The radar results show less variability due tothe volume averaging. Unlike the Boston 1983 data, the radar does not vastly overestimate theturbulence intensity.
The remaining figures show the effects of increasing the layering volume vertically andhorizontally. In Figure IV-7b, the vertical extent of the layer is from 0.3 km to 7.3 km. Verticallayering, in this example. does not significantly chage the turbulence levels from those inFigure IV-7a. The horizontal layering over a 4 km X 4 km region in Figures IV-7c and d tendsto smooth the series and extends the indicated periods of higher level turbulence.
It is inappropriate to draw conclusions regarding layering effects at this time. As data fromthe 22 Memphis flights are analyzed, the impact of layering on defining turbulent regionboundaries will become clearer.
G. CLUTTER ENVIRONMENT PERFORMANCE
Effort during this past quarter was focused in two areas. The first was to assess theoperational effectiveness of a high pas digital filter in reducing clutter power. The second was anattempt to characterize the analytical performance of a spatial clutter filter that operates on theresidual clutter from the high pass filter.
I. Higb Pass Fir Purfernmee
The high pass filter used in the FL-2 radar system was implemented as a time series finiteimpulse response (FIR) filter. The filter was designed with a stop bandwidth of 1.5 m/sand a notch depth of 50 dB. This clutter filter was shown to meet the NEXRAD TechnicalRequirement of >0 dB signal-to-clutter ratio (SCR) improvement for point clutter. It has beenshown that the SCR of a moving target simulator signal improved by 50 dB at the Olive Branch,Mississippi, test site when the FIR filter was inserted. The moving target simulator was mountedon a tall radio tower during this test. However, a statistical analysis of data measured with andwithout the FIR filter over a large area around the Memphis FL-2 site did not seem to reflectthe same 50 dD improvement.
43
S, M6--
The practical impact of the statistical test reults are unclear due to many problems that biasthe clutter suppression results downward and must be addressed individually before a statisticaltest can be used accurately to test the operational performance of a clutter filter. The following isa list of problems found in the Memphis clutter data analysis:
(a) low clutter-to-noise ratio (CNR) levels in area used for the test,(b) sensitivity to clutter limited by clear air returns, and(c) pulse interference from other S-band radars.
The Olive Branch test site was a benign site in that the clutter levels were, on average, 20 dBlower than representative clutter environments at other airport sites. Because of this, the cluttersuppression may have been limited by the CNR. In many areas, the clutter was within 20 or 30 dBof the receiver sensitivity. Therefore, the clutter suppression was limited to 20 or 30 dB. TheHuntsville test site has shown much higher clutter returns in certain hilly areas and thereforeshould provide a better clutter data set.
Interference from another S-band radar also was experienced. This pulse interference showedup in the sidelobes as well as the mnainlobe of our radar. These unwanted signals were unaffectedby the FIR filter and serve to reduce the apparent clutter suppression. A pulse interferencedetector currently is being installed and tested.
Finally, returns from moist, warm air were prevalent in the southern areas. Reflections fromsuch precipitation-free wind fields help detect low-level wind shear. On the other hand, thesereturns impacted the clutter suppression analysis by reducing the dynamic range of clutter,thereby reducing the apparent SCR improvement. This is entirely a clutter analysis problem, andwill be alleviated somewhat by making clutter measurements on days with minimal clear airreturn during the next season.
2. Cludter Map Editor
The second focus of the clutter environment assessment this quarter concerned the analyticalperformance of a spatial clutter filter. This filter edits the measurements resulting from the highpass filter. Clutter residue measurements during an optically clear day are stored and used toprovide spatially variable thresholds during weather data collection operations. After a rangesample is taken during normal operations, it is filtered (with the FIR filter), then compared tothe corresponding stored clutter residue magnitude. If the sample level is comparable to theclutter residue level, then the sample is deleted.
The explicit assumption made for this editing process is that the spatial extent of theweather phenomena to be detected is such that a number of data points in a given (compact)spatial region can be deleted without substantially degrading algorithm performance. Studies willbe carried out in the near future to determine the sensitivity of the microburst and gust frontalgorithms to missing data. The storm tracking and reflectivity/ turbulence layering algorithmsutilize data that has been resampled to a Cartesian grid.
44
AMI
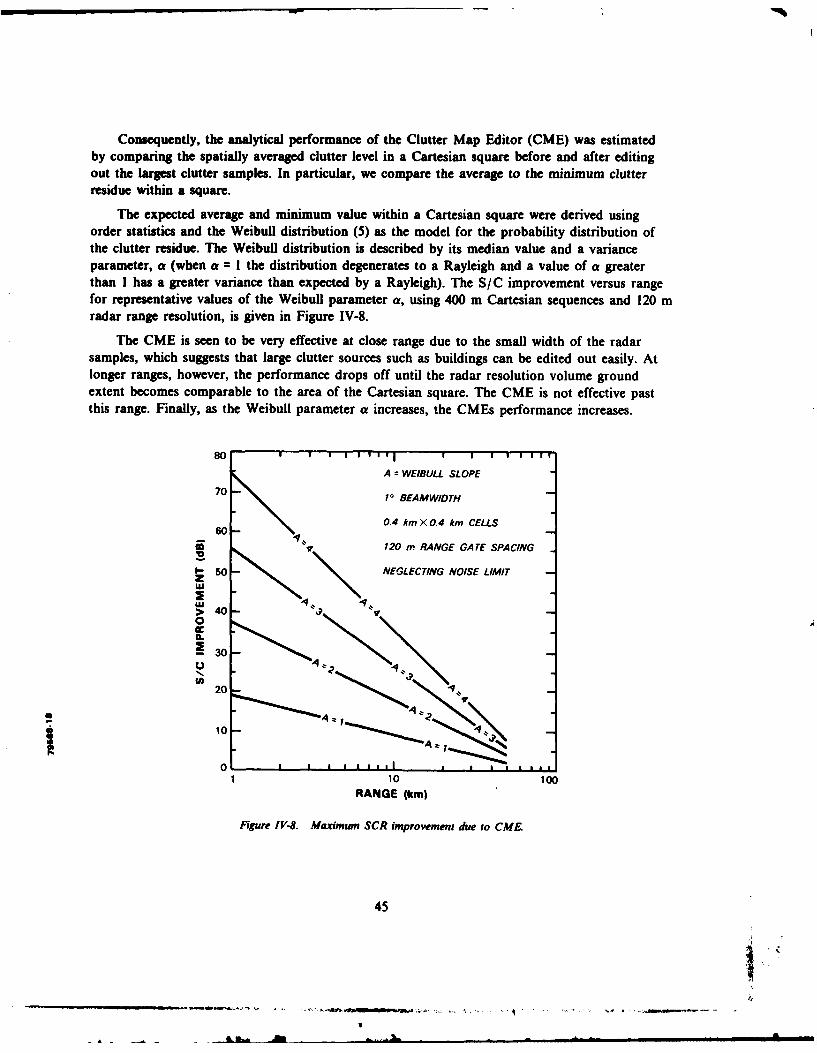
Consequently, the analytical performance of the Clutter Map Editor (CME) was estimatedby comparing the spatially averaged clutter level in a Cartesian square before and after editingout the largest clutter samples. In particular, we compare the average to the minimum clutterresidue within a square.
The expected average and minimum value within a Cartesian square were derived usingorder statistics and the Weibull distribution (5) as the model for the probability distribution ofthe clutter residue. The Weibull distribution is described by its median value and a varianceparameter, a (when a = I the distribution degenerates to a Rayleigh and a value of a greaterthan I has a greater variance than expected by a Rayleigh). The S/C improvement versus rangefor representative values of the Weibull parameter a, using 400 m Cartesian sequences and 120 mradar range resolution, is given in Figure IV-8.
The CME is seen to be very effective at close range due to the small width of the radarsamples, which suggests that large clutter sources such as buildings can be edited out easily. Atlonger ranges, however, the performance drops off until the radar resolution volume groundextent becomes comparable to the area of the Cartesian square. The CME is not effective pastthis range. Finally, as the Weibull parameter a increases, the CMEs performance increases.
80 * 1 1 1 V I I 1.
A WEIBULL SLOPE
70 -I BEAMWIDTH
0.4 km X 0.4 km CELLS60
V 120 m RANGE GATE SPACING
1- 50 NEGLECTING NOISE LIMITzW
>40 "0
30-
20-
10-
0 I I I I 11£
1 10 100RANGE (km)
Figure IV-8. Maximum SCR improvement due to CME.
45
A4
- ae ~ a . .. . ~ ,.. - -.. t.,- . -
!1
The extent to which the improvements shown in Figure IV-8 can be achieved in practice willdepend on:
(a) the actual distribution function of clutter residue,(b) the spatial correlation between residue levels, and(c) hardware factors (e.g., sensitivity and dynamic range).
Considerable effort went into developing software to help analyze clutter data statistically.fhe new software was grouped into three packages. The first package formed a simplisticinterface to the CFT software. The second package consists of a basic set of statistical toolsincluding programs to group, distribute, and provide histogram data. The final package was agraphics package. This package plotted standardized analysis graphs and extended the NCARplotting package by allowing Weibull scaling. These packages were formed to speed thedevelopment of specialized data analysis programs during the next data collection season (i.e.,mid 1986).
A study of radar data from an operational ASR-8 radar at the Memphis airportcomnmeniced. This data was intended to be used as a test case to assess analytically the effect of J,the ('ME. Initial analysis suggested that much of the clutter surrounding the city of Memphiscould not be improved by a CME. However, a few inconsistencies have been found in this firststudy, and a more in-depth analysis will be done.
Data reduction and analysis will be the focus of the next reporting period. With the test-bedradar in Huntsville, operational clutter data will be recorded on a regular weekly basis. This datawill be used to develop conceptionally a CME strategy followed by a practical development inthe future reporting periods. During our clutter study, we also will investigate the followingissues:
(a) magnitude of sidelobe clutter,(b) performance of high pass clutter filters,(c) saturation levels of clutter,(d) necessary resolution of the clutter map,(e) elevation requirements of the clutter map, and the(f) temporal stability of Huntsville area clutter as well as continuing analysis
of the ASR data.
H. GUST FRONT DETECTION ALGORITHM
The gust front detection algorithm development effort is aimed at producing an automaticprocedure for recognizing thunderstorm gust fronts and their associated wind shift events fromDoppler weather radar measurements. The current focus is on the development of an algorithmthat can be tested on the real-time system in Huntsville, Alabama, du.-ing the summer of 1986.The algorithm to be implemented is a modified version of the gust front detection algorithmdeveloped at the NSSL in Norman, Oklahoma2.
46
The algorithm attempts to identify gust fronts by first locating areas of radial convergence(radial shear segments) from the base radar data (polar format). Segments that demonstrate alarge value of peak shear and that are spatially close in the azimuthal direction are combinedinto a feature. The center of the feature then is computed. Features that lie on different tilts andthat exhibit reasonable overlap are combined into a gust front. The feature containing the largestnumber of radial shear segments is used to represent the gust front. The gust front then isapproximated with a least squares curve fitted to the peak shear values associated with the radialsegments (Cartesian coordinate system). The gust fronts then are tracked using a second orderpolynomial in the Cartesian plane. The tracking routine makes it possible to predict futurelocations of the gust front.
The algorithm has been encoded and currently is being tested by analyzing FLOWS datacollected in Memphis during 1985. The algorithm is being developed concurrently at the NSSLand MIT Lincoln Laboratory, and considerable comparison of results will be necessary to ensurea standardized outcome. This will be accomplished through the sharing of data between NSSLand Lincoln Laboratory along with subsequent comparison of results.
The next phase of the project will involve the implementation of a wind shift predictionalgorithm to run in conjunction with the gust front detection algorithm. The algorithm currentlybeing considered is the sectorized uniform wind algorithm also being developed by NSSL 3. Theresults of this algorithm will be used by terminal aircraft controllers to aid in the runwaymanagement decision process. It is expected that the wind shift algorithm can be implementedbefore real-time testing begins.
The work for the next period will focus on processing the FLOWS data currently available,along with evaluation of the results. At the same time, the sectorized uniform wind algorithmwill be implemented and tested. Both algorithms will be modified as necessary, based on analysisresults. When it has been determined that the algorithms are generating satisfactory results, areal-time implementation will be installed on the system located in Huntsville, Alabama.
I. RANGE/VELOCITY UNFOLDING
In the event that the FAA TDWR system will operate at C-Band, some form of velocityde-aliasing capability must be incorporated into that system. There are two general classes ofvelocity de-aliasing schemes. The first class, designated as 'relative de-aliasing', attempts toproduce a de-aliased velocity field that locally matches the 'true' Doppler velocity field to withinsome additive constant. These schemes typically are implemented as software that enforces theconditions of radial and azimuthal continuity on an aliased tilt of velocity data. The second class,designated as 'absolute de-aliasing', attempts to reproduce exactly the 'true' Doppler velocity fieldthrough the use of multiple Pulse Repetition Times (PRTs) in the Doppler waveform andmodified Doppler moment estimation algorithms (typically implemented in firmware).
Relative de-aliased velocity fields are sufficient for subsequent processing by algorithmssearching for shears (e.g., radial shear algorithms and divergent outflow algorithms), as these
47
V
algorithms actually examine the first derivative of the velocity field (relative de-aliasing locallypreserves the derivative of the velocity field). Absolute de-aliasing may be required, however, byalgorithms that attempt to estimate wind direction and speed, such as the proposed gust front/wind shift algorithm.
The primary challenge for the operational use of a multiple PRT waveform is that of cluttersuppression. To date, weather project investigations in this area have concentrated on the use ofa staggered PRT waveform in which the PRT alternates from pulse-to-pulse. During thereporting period, the performance of batch PRT waveforms - in which the PRT is alternatedover blocks of equispaced samples (two blocks per azimuth) - was investigated. Specifically, theperformance of the following clutter suppression scheme was investigated. A data window isapplied to each equispaced block of samples, the block is transformed into the frequency domain,the coefficients about zero frequency/ velocity are zeroed, and the data then is transformed backinto the time domain as an autocorrelation function for the pulse-pair estimation algorithm.Analytical expressions, free of radar dependent values, were developed to characterize the efficacyof various data windows in this respect.
Our preliminary conclusion is that this is a possible scheme, but that meeting a 50-dBsuppression requirement will require the generation of a sophisticated data window and also mayrequire an effective passband edge higher than 3 m/s for antenna scanning rates in excess of10 deg/s.
A presentation was made to representatives from Sperry and Raytheon that detailed Lincolnresearch and recommendations on the issues of velocity de-aliasing and range obscuration.
J. STORM TRACKING AND EXTRAPOLATION
Reflectivity tracking and extrapolation efforts were concentrated upon two aspects of theLincoln implementation of the Storm Extrapolation Map (SEM): (1) the addition of functionalmodules suggested by performance evaluations conducted during the previous quarter, and (2) thedevelopment of an improved user interface.
The SEM algorithm evaluated during the previous quarter generated extrapolations in timeof radar reflectivity regions by ingesting the LAYER COMPOSITE REFLECTIVITY product(0-24 kft) and tracking information from either the STORM POSITION FORECAST orCROSS-CORRELATION TRACKING (CCT) algorithm. The SEM combines these data tocreate extrapolated maps through the following four operations:
(a) Storm Identification, in which an input reflectivity field is segmented intocontiguous regions of reflectivity above a specified threshold (e.g., 30 dBz);
(b) Centroid to Storm Identification, in which volumetric, mass-weighted centroidsfrom the STORM CENTROIDS algorithm are associated with the regionsidentified in (a);
48
(c) Velocity to Centroid Association, in which tracking information from the selectedtracker is associated with the centroid/storm pairs identified in (b); and
(d) Storm Displacement, in which an extrapolated map is created by adjusting thevelocity-tagged storms identified in (c) for the user-specified extrapolation timeinterval.
For an arbitrary number of extrapolations forward from a given time, steps a-c need only beperformed once; step 4 is performed for each extrapolation.
Extensive testing of the SEM operating in concert with the CCT indicated that the 4-kmresolution of the LAYER COMPOSITE REFLECTIVITY product, while desirable for the CCT,was too coarse to support a functional extrapolation capability over the extrapolation timeintervals of interest (10-30 min). The manifestation of this in the output of the SEM is thatstorms would be adjusted to their approximate correct positions in most cases, but would possesspositioning errors of one 4-km pixel (excluding cases with intervening convective growth anddecay). With regard to the four operations detailed above, the implication is that the CCTtracker information was reliable and steps a-c of the SEM were executed correctly, but thespatial quantization implicit in the LAYER COMPOSITE REFLECTIVITY product preventedaccurate positioning of the extrapolated storms.
Since the SEM product is intended only as a planning tool for ATC users, a 4-kmresolution for the SEM product is reasonable; and a scheme was developed in which the SEMinternally performs its translations at a resolution higher than 4 kin, followed by a threshold-based resampling to a 4-km resolution. The intent of this scheme is to provide an SEM productthat will approximate most closely the true LAYERED COMPOSITE REFLECTIVITY at theextrapolation time. This enhancement, designated 'High-Resolution Translation', has beenimplemented and will be evaluated during the first quarter of 1986.
An improved user interface is under development for the SEM. The new interface willprovide menu-based interactions with the SEM for the user. The improved interface will be ofuse both for off-line algorithm development and for the real-time implementation of the SEM atthe FL-2 test bed.
Professor Robert Crane's (Dartmouth) subcontracted study is under way. He has been askedto evaluate the feasibility of automatic algorithms for the identification of regions undergoingconvective growth and decay. An interim report on his results will be provided to Lincoln inearly 1986.
49
a_ An
V. USE OF WEATHER RADAR DATA WITHIN THECENTRAL WEATHER PROCESSOR
The CWP will be the principal system for the distribution of real-time en route hazardousweather information derived from NEXRAD radars to ATC users such as controllers and pilots.Lincoln has worked with the CWP program office for the past few years to:
(a) assess and refine NEXRAD algorithms/products and operational use better tomeet the ATC user needs,
(b) define the NEXRAD processing requirements for the CWP, and
(c) obtain feedback from operational ATC users [especially the Central WeatherService Unit (CWSU) meteorologists] on the operational utility andmeteorological validity of the products for real-time use by nonmeteorologists.
This support will be sharply reduced in the current fiscal year due to the loss of FY86funding by the CWP program to finish the tasks that were largely completed at the end of FY85and to initiate discussion on the nature of an FY87 CWP program in the spring of 1986.
A. FEDERAL METEOROLOGICAL HANDBOOK SUPPORT
The eleventh volume of the Federal Meteorological Handbook (FMH-I 1) is being preparedto provide the operational guidelines for the operation of the NEXRAD System. The task ofwriting this document has been delegated to five 'Working Groups' - each of which hasresponsibility for certain portions of FMH-I I and is comprised of representatives from theagencies developing NEXRAD as well as technical advisors from the NEXRAD InterimOperational Test Facility (IOTF) and institutions such as Lincoln Laboratory. A representativefrom Lincoln Laboratory is serving on Working Group E (WGE), which has been tasked to writethe sections of FMH-I I specifying operational modes, scanning strategies, product mixes, productshedding priorities, and mode selection/deselection criteria.
The second FMH-I I coordination meeting was held in November. At that time, the WGEdocument was reworked extensively in order to insure consistency among the FMH-I 1, theNEXRAD Technical Requirements (NTR), and the individual contractor's designs to themaximum extent possible. In order to verify this consistency, WGE has prepared analysesregarding scanning strategy interactions with Doppler moment estimates, RDA data rates, RPGcomputational requirements, RPG storage requirements, and meteorological surveillancerequirements. The current WGE recommended operational modes and scanning strategies, withtheir primary objectives, are as follows:
Clear Air Mode:
(a) Preconvection Scan - 5 tilts in 10 minutes (5/10)- earliest detection of precipitation- wind profiling to four 4 km AGL
51
(b) Wind Profiling Scan-9/ 10- wind profiling to 10 km to supplement soundings- montoring of precipitation onset
Precipitation Mode:
(a) Precipitation/Severe Weather Scan (P/SWS)-14/5- volumetric scanning with high update rate and reduced accuracy
for volumetric estimates additional
(b) Outflow Detection - P/SWS-15/6- P/SWS with an additional low-level tilt at scan's temporal midpoint
so as to provide a three-minute update rate at surface
(c) High Resolution - P/SWS-17/6- provides nearly contiguous coverage with monotonic elevation sequence
for accurate volumetric estimates
(d) Synoptic Scan - P/SWS-9/6- nominal scan strategy described in NTR- has certain operational deficiencies due to the sizable gaps in the
elevation coverage
Figures V-I and V-2 compare the coverage provided by the P/SWS-15/6 and P/SWS-9/6strategies. The practical impact of the sizable horizontal and vertical gaps with the 9/6 strategyfor the detection of operationally significant aviation weather hazards needs to be determined inthe very near future. However, it appears that such studies will not be carried out by WGE orthe NEXRAD program office. Lincoln is currently not in position to carry out such studiesduring FY86.
No changes in the WGE document are incorporated at this point. The next FMH-I I meetingis scheduled for late April 1986. The current WGE membership is: Peter Ahnert (NationalWeather Service), Major Gary Sickler (US Air Force), Frank Amodeo (MITRE), Marc Goldburg(Lincoln).
B. RADAR WORKING GROUP SUPPORT
Lincoln personnel attended meetings of the CWP Radar Working Group (RWG) in Octoberand November of 1985 and January 1986. This group's work now is focusing on the mosaickingof NEXRAD products from a number of NEXRADs within the CWP as opposed to:
(a) validation of the basic accuracy of the CWP products generated by a singleNEXRAD, and/or
(b) assessing the utility of CWP products for real-time nonmeteorologist users,
due to a reduction in the scope of the CWP program. Lincoln's contribution to the RWG had
52
a A
ALTITUDE ADOVE (kml we RANGE ALONG #m') SURFACE - 4/3 EARTH14 ELUATOU. 8AIN a 1 .0 DU4IM14/U PaCIOTH/UVUA VATMMU WAN 04WWWNMS. Muiw. AMIS/4 OUMflO DETWCIIO. PUICINTAI100/SEIVU WaATNS SWAN IP~s@Wtt MOMis
22
20
Is
14-
12
10-
4
2
00
0 20 40 00 SO 100 120 140 100 150 200 220 240 20 23
flgur V-1. Cowrqve provdiedby FAIH-I1I Working Group Exam strutegy for peepusaimwI setwrr wiraiwrl
53
AMI
ALTMTOE AMOW OmI we RAMM ALONG Obm) SUPACE - 4/3 MAMT
7
4-
3
2
0 10 20 20 40 SO So 70 so so 100
Flewe V-2. Cowvqeo provdwui b~v NEXRAD omnm wrra
54
been principally in these areas that now are being de-emphasized, consequently we anticipate a
reduction in the level of Lincoln participation in the RWG.
The two current RWG topics that Lincoln is investigating are:
(a) the operational utility of reflectivity base product data from a single lowelevation tilt versus the high resolution composite reflectivity for CWSUassessment of data from a single NEXRAD, and
(b) the validity and operational utility of the NEXRAD turbulence product.
We plan to provide additional information on both of these topics to the RWG in the nextreporting period.
55
VI. PLANNING FOR TDWR OPERATIONAL DEMONSTRATIONS
The FAA has requested that Lincoln and NCAR (with algorithm support from T. Fujitaand NSSL) develop a joint program leading to an operational demonstration of the TDWRsystem concept including providing real-time TDWR products to ATC users (Tower andTRACON controllers and supervisors) in the 1987-90 time frame. Figure VI-I shows the plannedroles and responsibilities for hardware and products during operational evaluation. The upgradedFL-2 system will be used in a strawman automatic TDWR scan strategy and automatically inreal time to:
(a) detect microbursts and provide estimates of their outflow spatial extent andseverity,
(b) locate gust fronts and provide 20-minute estimates of arrival of the corresponding
wind shift at the airport,
(c) generate volume estimates of high reflectivity and turbulence regions, and
(d) provide extrapolated storm position estimates in the initial demonstration*.
The detection algorithm outputs and corresponding controller products (e.g., a rectanglebounding the microburst divergent shear region such as shown in Figure IV-3) along with the(polar) base product data will be provided to an NCAR-developed rapid display system (RDS) aswell as to a Lincoln Apollo workstation. A radar meteorologist at the RDS will:
(a) judge the meteorological corrections of the automatic algorithm detections(providing a product override if need be), and
(b) provide additional advanced products (e.g., locations of potential convectiveinitiation) that do not yet have automatic detection algorithms.
Further review of the product outputs will occur at the airport control tower based on visualobservations, pilot reports (PIREPS), and the low-level wind-shear alert (LLWSAS) system. Thecurrent plan is to hold the initial demonstration at Stapleton International Airport, Denver,Colorado, so as to take advantage of the scientific and operational community knowledge basedeveloped during the JAWS (2) and CLAWS (4) programs.
Many details of the operational demonstrations need to be specified. This will occur in aseries of Lincoln/ NCAR/ FAA meetings during the remainder of FY86.
A key area of initial focus is the development of adequate data sets for algorithmdevelopment and performance assessment. A two-day meeting was held at Lincoln in October1985 to review the current status of the gust front and microburst algorithms and to discuss the
* The turbulence and storm position estimates are of lower priority than the other products.Subsequent demonstrations will utilize advanced products such as point predictions of microburstoccurrence and regions where convection will commence in the near future.
57
I.-n-.. e t t
*~.
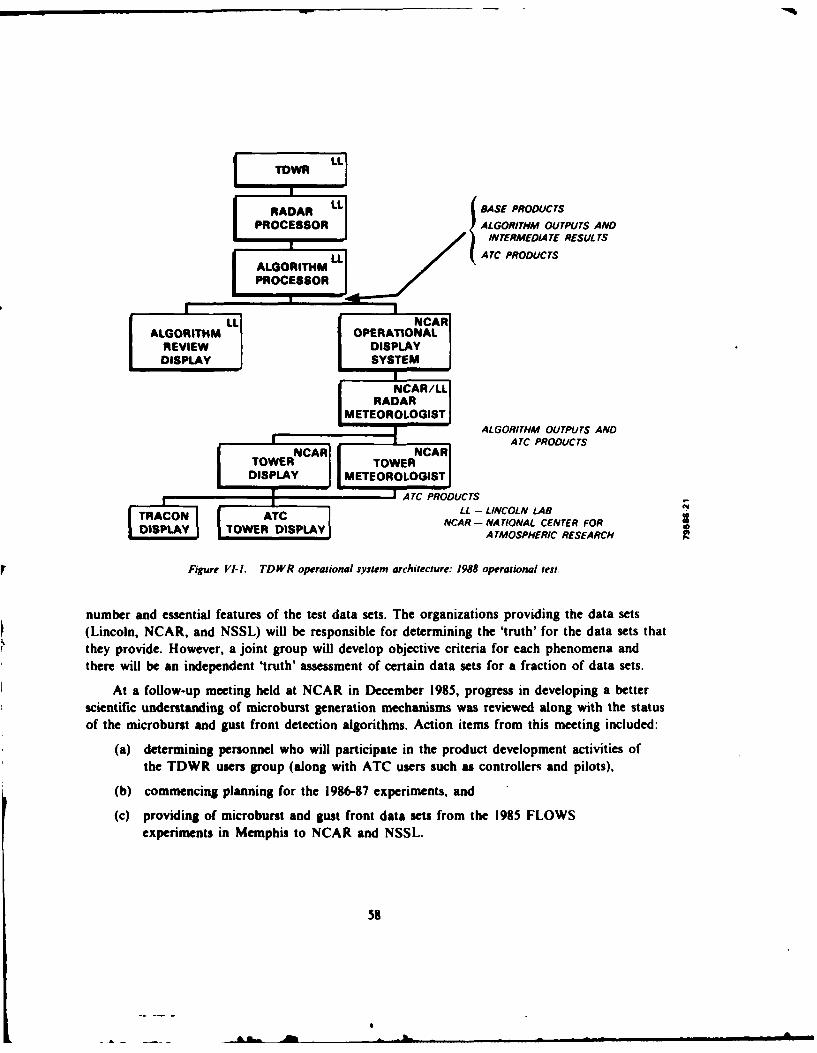
TDWR
RADAR LL BASE PRODUCTSPROCESSOR ALGORITHM OUTPUTS AND
INTERMEDIATE RESULTS
ALGORITHM L A TC PRODUCTS
LL! NCAR
ALGORITHM OPERATIONALDISPLAYREVIEW DISPLAY
DISPLAY SYSTEM
NCAR/LLRADAR
METEOROLOGISTALGORITHM OUTPUTS AND
ATC PRODUCTSDISPLA V METEOROLOGISTI
A TC PRODUCTS
I TRACN ATCLL - LINCOLN LABDISPLA NCAR - NATIONAL CENTER FOR
2ESPAY TOWER DISPLAY] ATMOSPHERIC RESEARCH
Figure VI-I. TDWR operational system architecture: 1988 operational test.
number and essential features of the test data sets. The organizations providing the data sets(Lincoln, NCAR, and NSSL) will be responsible for determining the 'truth' for the data sets thatthey provide. However, a joint group will develop objective criteria for each phenomena andthere will be an independent 'truth' assessment of certain data sets for a fraction of data sets.
At a follow-up meeting held at NCAR in December 1985, progress in developing a betterscientific understanding of microburst generation mechanisms was reviewed along with the statusof the microburst and gust front detection algorithms. Action items from this meeting included:
(a) determining personnel who will participate in the product development activities of
the TDWR users group (along with ATC users such as controllers and pilots),
(b) commencing planning for the 1986-87 experiments, and
(c) providing of microburst and gust front data sets from the 1985 FLOWSexperiments in Memphis to NCAR and NSSL.
58
Subsequent meetings in Washington and Denver in March 1986 were held to commence thework program. The Lincoln and NCAR researchers concerned with wind-shear detectiondeveloped a plan for exchange storm data sets and analyses. A memorandum of understanding(MOM) between the Lincoln and NCAR groups will be developed in the next period and sent tothe FAA for review.
59
REFERENCES
I. Quarterly Technical Summary, Weather Radar Studies, Lincoln Laboratory,MIT (30 September 1985), DOT/ FAA/ PM-86/6.
2. H. Uyeda and D.S. Zrnic, "Automatic Detection of Gust Fronts." NationalSevere Storms Laboratory, Norman, Oklahoma, Final ReportDOT/ FAA/PM-85/1 (1985)
3. S.D. Smith, -Sectorized Uniform Wind Algorithm," Technical Report,National Severe Storms Laboratory, Norman, Oklahoma (October 1985).
BIBLIOGRAPY
I. R. Rinehart and M. Isaminger, "Radar Characteristics of Microbursts in theMid South," 23rd Conference on Radar Meterology, Snowmass, Colorado,1986.
2, A.J. Bedard and T.J. Lefebvre, "The JAWS Project, Surface Measurementsof Gust Fronts and Microbursts During the JAWS Project: Statistical Resultsand Implications for Wind Shear Detection, Prediction, and Modeling,"National Center for Atmospheric Research (August 1986).
3. Quarterly Technical Summary, Weather Radar Studies, Lincoln Laboratory,MIT (31 March 1985), pg. 7, AD-A161622.
4. L. Stevenson, "The Stapleton Microburst Advisory Service Project, AnOperational Viewpoint," Transportation System Center, Cambridge,Massachusetts (September 1985), DOT/FAA! PM-85/21.
5. R.R. Booth, "The Weibull Distribution Applied to the Ground ClutterBackscatter Coefficient," Report No. RE-TR-69-15, U.S. Army MissileCommand (12 June 1969).
61
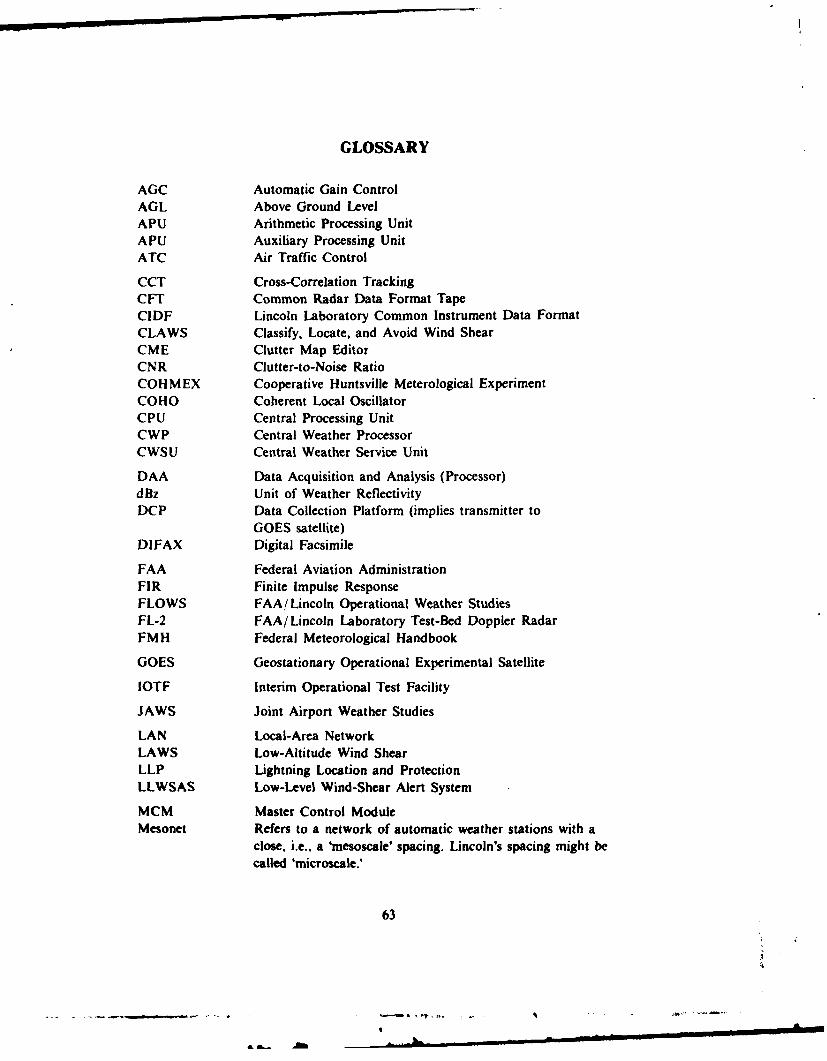
GLOSSARY
AGC Automatic Gain ControlAGL Above Ground LevelAPU Arithmetic Processing UnitAPU Auxiliary Processing UnitATC Air Traffic Control
CCT Cross-Correlation TrackingCFT Common Radar Data Format TapeCIDF Lincoln Laboratory Common Instrument Data FormatCLAWS Classify, Locate, and Avoid Wind ShearCME Clutter Map EditorCNR Clutter-to-Noise RatioCOHMEX Cooperative Huntsville Meterological ExperimentCOHO Coherent Local OscillatorCPU Central Processing UnitCWP Central Weather ProcessorCWSU Central Weather Service Unit
DAA Data Acquisition and Analysis (Processor)dBz Unit of Weather ReflectivityDCP Data Collection Platform (implies transmitter to
GOES satellite)DIFAX Digital Facsimile
FAA Federal Aviation AdministrationFIR Finite Impulse ResponseFLOWS FAA/Lincoln Operational Weather StudiesFL-2 FAA/Lincoln Laboratory Test-Bed Doppler RadarFMH Federal Meteorological Handbook
GOES Geostationary Operational Experimental Satellite
IOTF Interim Operational Test Facility
JAWS Joint Airport Weather Studies
LAN Local-Area NetworkLAWS Low-Altitude Wind ShearLLP Lightning Location and ProtectionLLWSAS Low-Level Wind-Shear Alert System
MCM Master Control ModuleMesonet Refers to a network of automatic weather stations with a
close, i.e., a 'mesoscale' spacing. Lincoln's spacing might becalled 'microscale.'
63
A.-
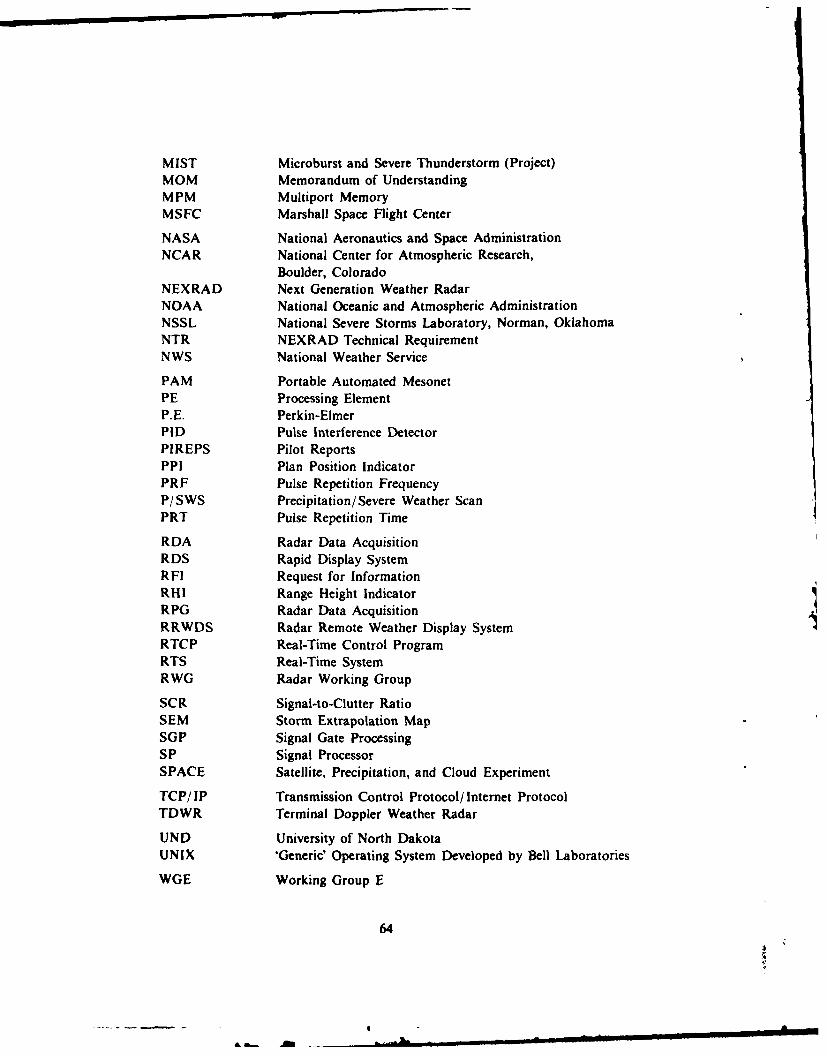
MIST Microburst and Severe Thunderstorm (Project)MOM Memorandum of UnderstandingMPM Multiport MemoryMSFC Marshall Space Flight Center
NASA National Aeronautics and Space AdministrationNCAR National Center for Atmospheric Research,
Boulder, ColoradoNEXRAD Next Generation Weather RadarNOAA National Oceanic and Atmospheric AdministrationNSSL National Severe Storms Laboratory, Norman, OklahomaNTR NEXRAD Technical RequirementNWS National Weather Service
PAM Portable Automated MesonetPE Processing ElementP.E. Perkin-ElmerPID Pulse Interference DetectorPIREPS Pilot ReportsPPI Plan Position IndicatorPRF Pulse Repetition FrequencyP/SWS Precipitation/Severe Weather ScanPRT Pulse Repetition Time
RDA Radar Data AcquisitionRDS Rapid Display SystemRFI Request for InformationRHI Range Height IndicatorRPG Radar Data AcquisitionRRWDS Radar Remote Weather Display SystemRTCP Real-Time Control ProgramRTS Real-Time SystemRWG Radar Working Group
SCR Signal-to-Clutter RatioSEM Storm Extrapolation MapSGP Signal Gate ProcessingSP Signal ProcessorSPACE Satellite, Precipitation, and Cloud Experiment
TCP/IP Transmission Control Protocol/ Internet ProtocolTDWR Terminal Doppler Weather Radar
UND University of North DakotaUNIX 'Generic' Operating System Developed by Bell Laboratories
WGE Working Group E
64$j
.V
,a

ATE
7- MED