Embed Size (px)
Citation preview
SEELS Page 4-1
4. Classroom Context by Phyllis Levine, Camille Marder, Mary Wagner, Jose Blackorby, Michael Chorost, and Anne-Marie Guzman
The landmark federal legislation, The No Child Left Behind Act of 2001 (NCLB)
places an increased emphasis on educational accountability for results and
improving achievement for all students, particularly for disenfranchised students,
including those with disabilities. Individual student differences pose a variety of
challenges to improving academic achievement for students receiving special
education services, especially in language arts. For example, learning disabilities
are frequently most evident in language arts classes. Students with emotional
disturbances may have difficulty in language arts as well, but for different
reasons. Each type of disability may require a different type of instruction or
support.
Other factors that influence schools’ efforts to improve outcomes are
embedded in the context of the classroom itself, including such things as the
number of students and the experience of teachers. This chapter describes
several dimensions of the classrooms where elementary and middle school
students with disabilities receive language arts instruction. It addresses the
numbers of students and instructional staff, student reading abilities, and the
educational qualifications of teachers.
Students and Instructional Staff in Language Arts Classrooms
The relationships between class size and student outcomes have received
considerable attention in recent years. Proponents of smaller classes contend that
they allow teachers to be more effective in reaching students, particularly in the
early grades. A notable national effort is now directed toward reducing the
teacher-student ratio, in part as a response to the growing focus on mandatory
academic standards, and several states have passed legislation to reduce class
sizes.
Lower teacher-student ratios may be particularly important for students with
disabilities if they create an environment that promotes students’ engagement and
inclusion or that allows teachers to tailor instruction more effectively to the needs
of diverse learners (Achilles & Finn, 2000; Finn et al., 2001; Harris & Graham,
1996; Slavin, 1990).
The quality of instruction within a classroom also may be influenced by how
functional abilities are distributed across the students. A large class can be
particularly challenging when the class includes students with a broad range of
special learning needs.
Nationally, the sizes of the language arts classes of students with disabilities
vary greatly across classroom settings and among students with different
disability categories (Exhibit 4-1).
Chapter 4 – Classroom Context
Page 4-2 SEELS
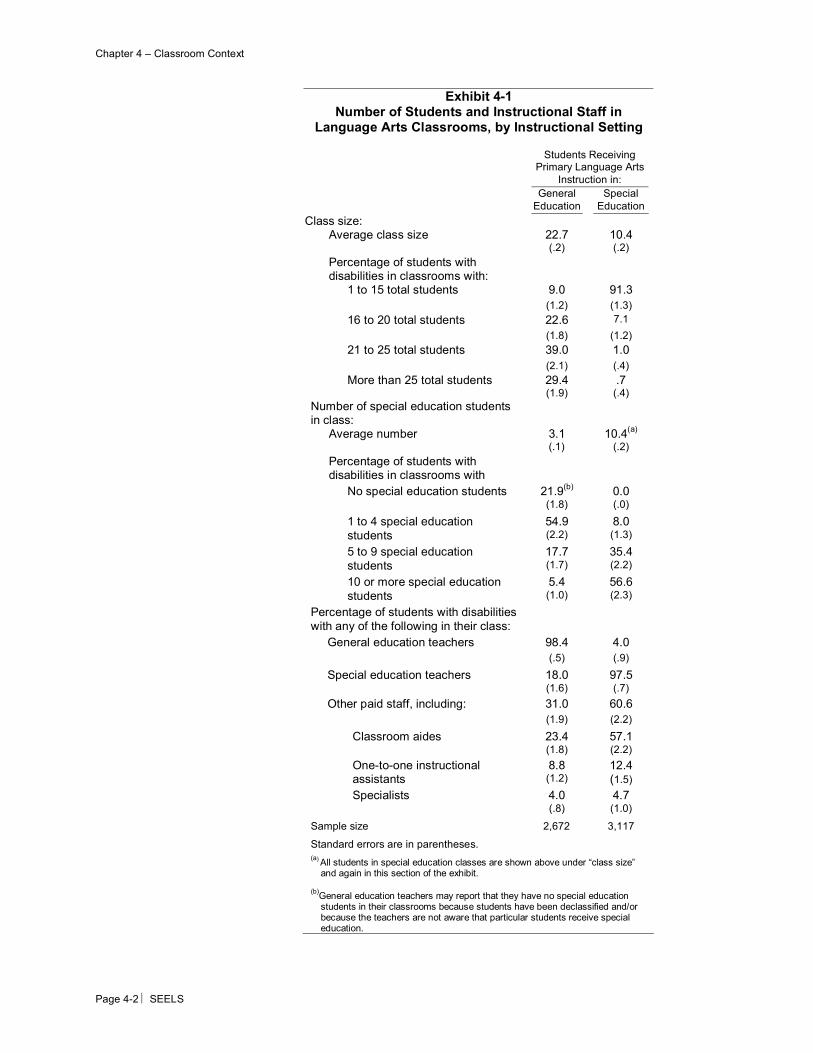
Exhibit 4-1 Number of Students and Instructional Staff in
Language Arts Classrooms, by Instructional Setting
Students Receiving Primary Language Arts
Instruction in: General
Education Special
Education
Class size:
Average class size 22.7 10.4 (.2) (.2)
Percentage of students with disabilities in classrooms with:
1 to 15 total students 9.0 91.3 (1.2) (1.3)
16 to 20 total students 22.6 7.1
(1.8) (1.2)
21 to 25 total students 39.0 1.0
(2.1) (.4)
More than 25 total students 29.4 .7 (1.9) (.4)
Number of special education students in class:
Average number 3.1 10.4(a)
(.1) (.2)
Percentage of students with disabilities in classrooms with
No special education students 21.9(b) 0.0 (1.8) (.0)
1 to 4 special education students
54.9 (2.2)
8.0 (1.3)
5 to 9 special education students
17.7 (1.7)
35.4 (2.2)
10 or more special education students
5.4 (1.0)
56.6 (2.3)
Percentage of students with disabilities with any of the following in their class:
General education teachers 98.4 4.0 (.5) (.9)
Special education teachers 18.0 97.5 (1.6) (.7)
Other paid staff, including: 31.0 60.6 (1.9) (2.2)
Classroom aides 23.4 57.1 (1.8) (2.2)
One-to-one instructional assistants
8.8 (1.2)
12.4 (1.5)
Specialists 4.0 4.7 (.8) (1.0)
Sample size 2,672 3,117
Standard errors are in parentheses. (a) All students in special education classes are shown above under “class size”
and again in this section of the exhibit.
(b)General education teachers may report that they have no special education students in their classrooms because students have been declassified and/or because the teachers are not aware that particular students receive special education.
Chapter 4 – Classroom Context
SEELS Page 4-3
• Students with disabilities whose primary language arts placement
is general education attend classes with an average of 23 students.
Approximately one in five are in classrooms with 15 or fewer
students; more than two in five are in classrooms with more than
20 students.
• Students with disabilities whose primary language arts placement
is general education attend general education classes in which two
other students, on average, receive some form of special education,
according to teacher reports.1 Approximately one in five students
(22%) have teachers who are not aware that any students in their
classroom receive special education services. Almost one in four
are in classrooms with at least five students who receive some
form of special education—18% are in classes with five to nine
such students, and 5% are in classes with 10 or more such students.
• Students with disabilities whose primary language arts placement
is special education attend classes with an average of 10 students,
all of whom receive some form of special education.
Approximately one in 12 are in classrooms with fewer than five
students; more than half are in classrooms with at least 10 students.
• Almost all students with disabilities in general education language
arts classes (98%) have a general education teacher in their
classroom, whereas almost all (97%) students in special education
language arts classes have a special education teacher present in
the classroom.
• Approximately one in five students with disabilities in general
education classes (18%) have a special education teacher, as well
as a general education teacher, present in the classroom.
• Thirty-one percent of students with disabilities in general
education language arts classes and 61% of students with
disabilities in special education language arts classes have one or
more paid staff besides teachers in the classroom.
• For the most part, in both general and special education settings,
paid staff other than teachers in the classroom serve as classroom
aides. About one in four students with disabilities in general
education language arts classes (23%) and more than half of
students with disabilities in special education language arts classes
(57%) have at least one aide in the classroom.
1 This number appears to be an understatement of the number of students who receive
some form of special education. Teachers’ reports are most likely the result of some students being declassified and teachers not being aware that others receive special education, particularly when they receive services outside of the teacher’s classroom. The latter possibility should be borne in mind when interpreting these findings.
Chapter 4 – Classroom Context
Page 4-4 SEELS
• Approximately one in 10 (9%) students with disabilities in general
education language arts classes, and about one in eight students in
special education language arts classes (12%) have one or more
one-to-one instructional assistants in the classroom.
• Few students in either setting have other types of specialists in the
classroom.
Students and Instructional Staff in Classrooms: Disability Category Differences
• For students attending general education language arts classes, neither total
class size nor the number of students teachers report are receiving special
education differs across the disability categories (Exhibit 4.2).
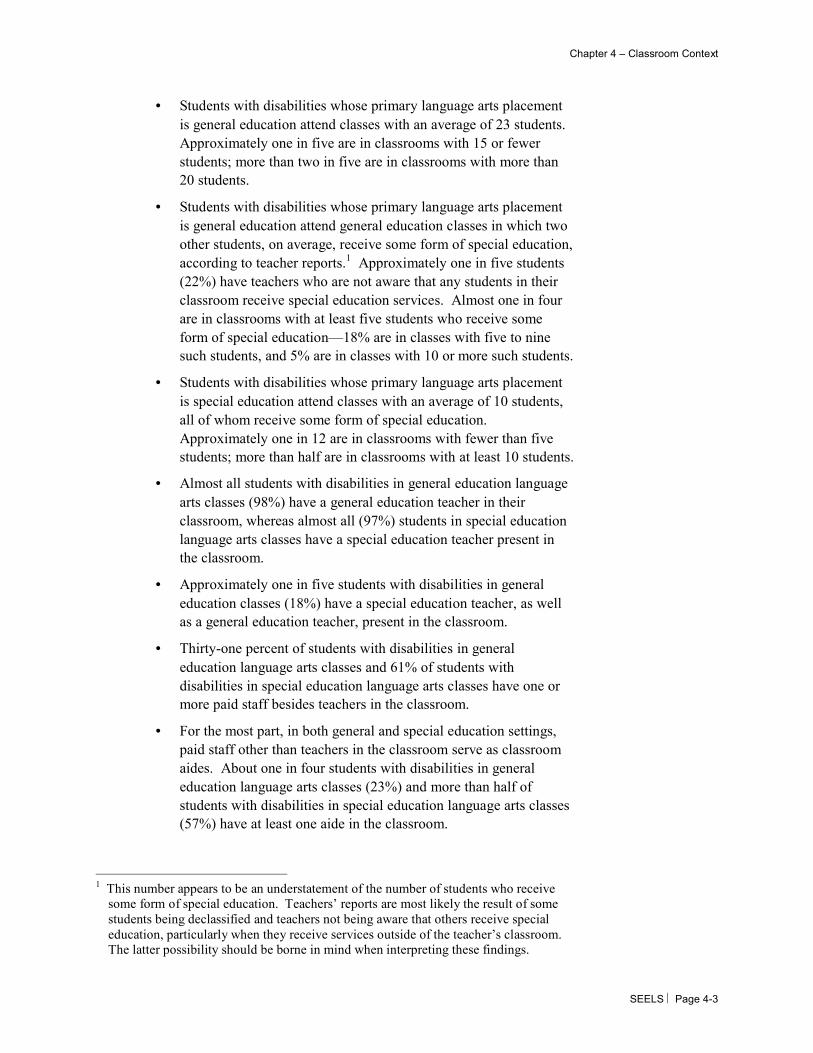
• Regardless of their disability, on average, students in special education
language arts classes have between eight and 11 students in their classroom.
The only difference in class sizes between any two groups is that students
Represents special education students
Multiple disabilities
Traumatic brain injury
Autism
Other Health impairment
Orthopedic impairment
Visual impairment
Hearing impairment
Emotional disturbance
Mental retardation
Speech impairment
Learning disability
Average number of students in classrooms
General Education
Special Education
17.8
17.8
20.7
19.5
20.4
20.2
20.3
19.2
20.3
19.6
3.0
4.5
3.1
3.5
3.0
2.3
3.0
2.6
3.4
2.2
4.3
21.3
9.5
9.1
8.2
10.2
10.1
7.97.3
9.8
10.4
10.4
10.7
20.8
22.323.8
23.0
23.4
23.6
23.222.9
22.6
22.5
23.9
Multiple disabilities
Traumatic brain injury
Autism
Other Health impairment
Orthopedic impairment
Visual impairment
Hearing impairment
Emotional disturbance
Mental retardation
Speech impairment
Learning disability
Exhibit 4-2 Average Number of Students in Language Arts
Classes, by Instructional Setting and Disability Category
Chapter 4 – Classroom Context
SEELS Page 4-5
with hearing impairments attend smaller classes than students with learning
disabilities or mental retardation (7.4 students on average vs. 10.7 and 10.5
students on average).
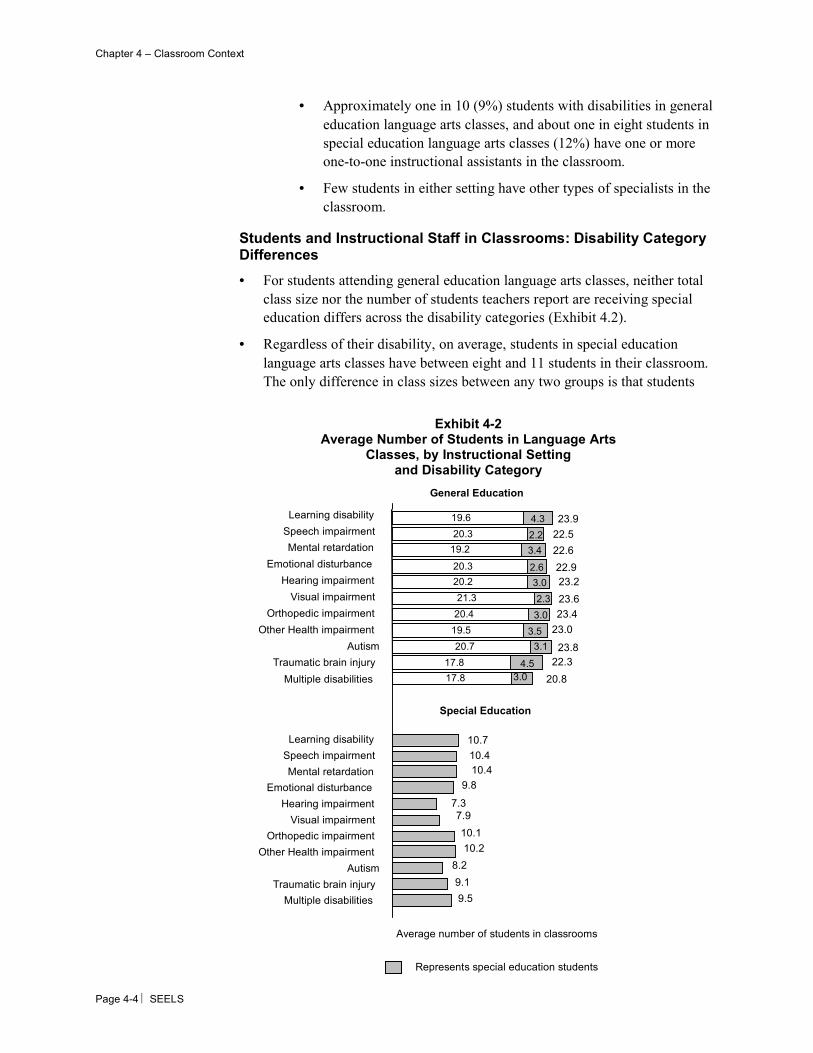
• The percentage of students with most disabilities in general education
language arts classroom who have a special education teacher in their
classroom ranges from 10% for students with speech impairments to
approximately 20% for students with emotional disturbances, orthopedic
impairments, other health impairments, or multiple disabilities, and to
approximately 25% for learning disabilities, mental retardation, or autism
(Exhibit 4-3). The implication of these findings is that general education
teachers have primary responsibility for educating these children while they
are in their classrooms.
• In sharp distinction to the other disability categories, approximately 50% of
children with traumatic brain injuries in general education classrooms have
special education teachers in their classrooms.
• The percentage of students with most types of disabilities in general
education language arts classes who have a paid staff member other than a
teacher in their classrooms ranges from 29% to 42%. Youth with emotional
disturbances are the least likely to have a paid staff member other than a
teacher in their classrooms (25%), and youth with autism or multiple
disabilities are the most likely (66% and 77%, respectively).
Exhibit 4-3 Staffing in Language Arts Classrooms,
by Instructional Setting and Disability Category
Percentage of students with type of staff in their classroom:
Learning Disability
Speech/ Language
Impair-ment
Mental Retar-dation
Emotional Distur-bance
Hearing Impair-ment
Visual Impair-ment
Ortho-pedic
Impair-ment
Other Health Impair-ment Autism
TraumaticBrain Injury
Multiple Dis-
abilities
General education
Special education teacher 27.5 (3.4)
10.3 (1.9)
25.6(6.0)
20.0 (3.8)
13.4(3.2)
13.8(3.1)
19.2 (3.4)
19.7 (3.8)
25.0(5.3)
50.6 (9.7)
19.5 (10.1)
A classroom aide, one-to-one instructional assistant, or other specialist 30.7 29.9 36.9 24.9 37.3 29.4 41.7 31.9 65.9 36.4 77.4
(3.5) (2.9) (6.6) (4.1) (4.6) (4.1) (4.3) (4.4) (5.9) (9.4) (10.7) Special education
General education teacher 3.9 (1.5)
3.6 (3.0)
3.3 (1.2)
4.2 (1.6)
5.6 (2.2)
13.5(5.2)
5.2 (2.2)
7.6 (2.8)
2.4 (1.2)
3.2 (2.7)
4.1 (1.7)
A classroom aide, one-to-one instructional assistant, or other specialist 47.0 70.3 74.7 74.4 65.7 72.7 79.4 64.7 86.0 65.3 85.8
(3.9) (7.5) (2.8) (3.6) (3.8) (5.4) (3.9) (5.1) (2.7) (7.2) (3.1) Sample size
General education 348 485 99 206 280 304 329 274 201 77 53 Special education 329 75 474 294 408 181 246 208 401 134 341
Standard errors are in parentheses.
Chapter 4 – Classroom Context
Page 4-6 SEELS
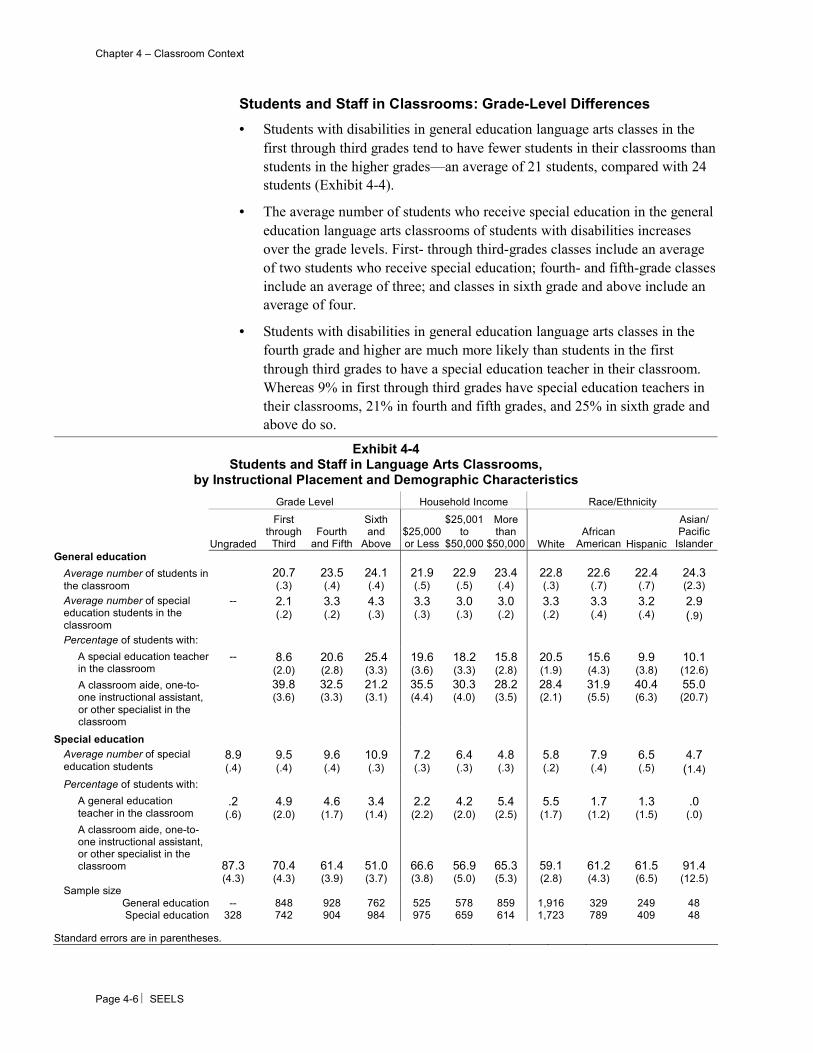
Students and Staff in Classrooms: Grade-Level Differences
• Students with disabilities in general education language arts classes in the
first through third grades tend to have fewer students in their classrooms than
students in the higher grades—an average of 21 students, compared with 24
students (Exhibit 4-4).
• The average number of students who receive special education in the general
education language arts classrooms of students with disabilities increases
over the grade levels. First- through third-grades classes include an average
of two students who receive special education; fourth- and fifth-grade classes
include an average of three; and classes in sixth grade and above include an
average of four.
• Students with disabilities in general education language arts classes in the
fourth grade and higher are much more likely than students in the first
through third grades to have a special education teacher in their classroom.
Whereas 9% in first through third grades have special education teachers in
their classrooms, 21% in fourth and fifth grades, and 25% in sixth grade and
above do so.
Exhibit 4-4 Students and Staff in Language Arts Classrooms,
by Instructional Placement and Demographic Characteristics
Grade Level Household Income Race/Ethnicity
Ungraded
First through
Third Fourth
and Fifth
Sixth and
Above $25,000 or Less
$25,001 to
$50,000
More than
$50,000 White African
American Hispanic
Asian/ Pacific
IslanderGeneral education
Average number of students in the classroom
20.7 (.3)
23.5(.4)
24.1 (.4)
21.9(.5)
22.9(.5)
23.4 (.4)
22.8 (.3)
22.6 (.7)
22.4 (.7)
24.3 (2.3)
Average number of special education students in the classroom
-- 2.1 (.2)
3.3 (.2)
4.3 (.3)
3.3 (.3)
3.0 (.3)
3.0 (.2)
3.3 (.2)
3.3 (.4)
3.2 (.4)
2.9 (.9)
Percentage of students with:
A special education teacher in the classroom
-- 8.6 (2.0)
20.6(2.8)
25.4 (3.3)
19.6(3.6)
18.2(3.3)
15.8 (2.8)
20.5 (1.9)
15.6 (4.3)
9.9 (3.8)
10.1 (12.6)
39.8 32.5 21.2 35.5 30.3 28.2 28.4 31.9 40.4 55.0 A classroom aide, one-to-one instructional assistant, or other specialist in the classroom
(3.6)
(3.3)
(3.1)
(4.4)
(4.0)
(3.5)
(2.1)
(5.5)
(6.3)
(20.7)
Special education
Average number of special education students
8.9 (.4)
9.5 (.4)
9.6 (.4)
10.9 (.3)
7.2 (.3)
6.4 (.3)
4.8 (.3)
5.8 (.2)
7.9 (.4)
6.5 (.5)
4.7 (1.4)
Percentage of students with: A general education teacher in the classroom
.2 (.6)
4.9 (2.0)
4.6 (1.7)
3.4 (1.4)
2.2 (2.2)
4.2 (2.0)
5.4 (2.5)
5.5 (1.7)
1.7 (1.2)
1.3 (1.5)
.0 (.0)
A classroom aide, one-to-one instructional assistant, or other specialist in the classroom 87.3 70.4 61.4 51.0 66.6 56.9 65.3 59.1 61.2 61.5 91.4 (4.3) (4.3) (3.9) (3.7) (3.8) (5.0) (5.3) (2.8) (4.3) (6.5) (12.5)
Sample size General education -- 848 928 762 525 578 859 1,916 329 249 48 Special education 328 742 904 984 975 659 614 1,723 789 409 48
Standard errors are in parentheses.
Chapter 4 – Classroom Context
SEELS Page 4-7
• Students with disabilities in general education language arts classes in the
first through fifth grades are more likely than students in the sixth grade and
above to have a classroom aide, one-to-one instructional assistant, or other
specialist in their classroom. More than 30% of students in the first through
fifth grades have such staff members in their classrooms, compared with
21% of students in the sixth grade and above.
• Students in special education language arts classes in the first through fifth
grades have an average of 10 students in their classrooms, whereas students
in the same type of classes in the sixth grade and above have an average of
11 students in their classrooms.
• For students in special education language arts classrooms, the grade levels
do not differ in the likelihood of having a general education teacher in the
classroom; however, the likelihood of having a paid staff member other than
a teacher decreases in higher grades. In the first through third grades, 70% of
students have such staff members, whereas in the sixth grade and above, 51%
do so. The students most likely to have such staff members are students in
ungraded classes; 87% have a paid staff member other than a teacher in their
classrooms.
Students and Staff in the Classrooms: Demographic Differences
• For students with disabilities in general education classes, class size increases
with income (22 students in classes with household incomes of $25,000 or
less, compared with 23 students in classes with income above $50,000);
however, the average number of special education students remains about the
same.
• In special education settings, class size decreases with income (seven
students in classes with household incomes of $25,000 or less compared with
five students in classes with incomes above $50,000.)
• Students from the three household income groups do not differ in terms of
the staff in their classrooms.
• The only difference among students with disabilities of the various
races/ethnicities in general education language arts classes is that Hispanic
students are less likely than white students to have a special education
teacher in the classroom. Whereas 20% of white students have such teachers
in their classrooms, 10% of Hispanic students do.
• Among students with disabilities in special education language arts classes,
the only difference among the various races/ethnicities is that Asian/Pacific
Islander students are more likely than white students to have a classroom
aide, one-to-one instruction assistant, or other specialist in the classroom.
Whereas 60% of white students have such teachers in their classrooms, 91%
of Asian/Pacific Islander students do.
Chapter 4 – Classroom Context
Page 4-8 SEELS
Reading Performance of Students in Language Arts Classrooms
A key component of classroom context is the diversity of ability levels
represented among students in the class. A broad mix of students’ abilities in a
given class can require educators to use different types of instructional
approaches to accommodate diverse student needs.
Reading ability is a fundamental aspect of students’ overall skill set and
paramount for school success. However, students with disabilities typically lag
behind their peers in the language arts, especially in reading (Barr, 1986;
Blackorby et al., 2004; Elbaum et al., 1999; Gersten & Dimino, 1989). SEELS
teachers were asked to report the reading levels of students in their class.
Teachers estimated the proportion of students in their language arts class who
performed “much above average”, “somewhat above average”, “average”,
“somewhat below average”, or “much below average”.
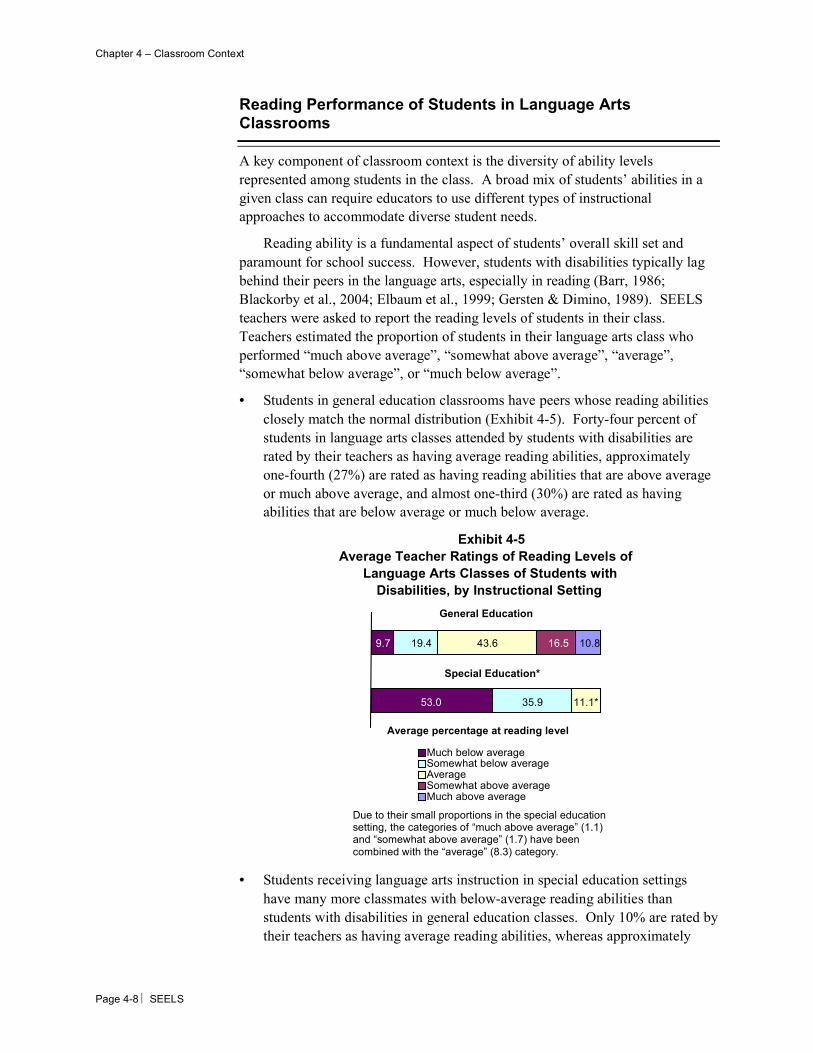
• Students in general education classrooms have peers whose reading abilities
closely match the normal distribution (Exhibit 4-5). Forty-four percent of
students in language arts classes attended by students with disabilities are
rated by their teachers as having average reading abilities, approximately
one-fourth (27%) are rated as having reading abilities that are above average
or much above average, and almost one-third (30%) are rated as having
abilities that are below average or much below average.
• Students receiving language arts instruction in special education settings
have many more classmates with below-average reading abilities than
students with disabilities in general education classes. Only 10% are rated by
their teachers as having average reading abilities, whereas approximately
General Education
53.0
9.7
35.9
19.4
11.1*
43.6 16.5 10.8
Much below average Somewhat below average AverageSomewhat above average Much above average
Average percentage at reading level
Special Education*
Exhibit 4-5
Average Teacher Ratings of Reading Levels of Language Arts Classes of Students with
Disabilities, by Instructional Setting
Due to their small proportions in the special education setting, the categories of “much above average” (1.1) and “somewhat above average” (1.7) have been combined with the “average” (8.3) category.
Chapter 4 – Classroom Context
SEELS Page 4-9
one-third (35%) are rated as having below-average reading abilities, and
approximately half (53%) are rated as having abilities that are much below
average. None are rated as having above-average abilities.
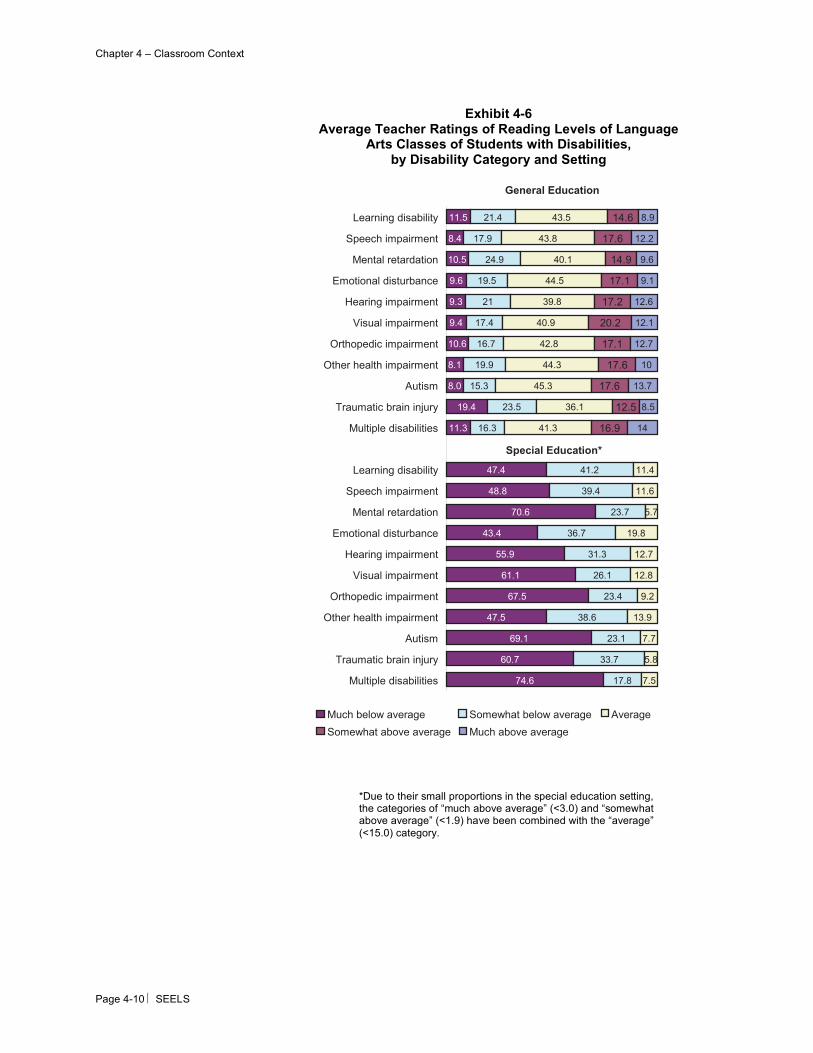
Classroom Reading Ability Level: Disability Category Differences
• In general education classes, students with different disabilities vary
relatively little in terms of the reading abilities of their language arts classes.
On average, between 65% and 77% of the reading levels of these students’
classmates are rated by teachers as average or above average (Exhibit 4-6).
An exception is students with traumatic brain injuries; on average, 57% of
their classmates’ reading levels are rated as average or above average.
• Students in special education classes are rated as having markedly lower
reading abilities. Few students in any disability category have any
classmates whose reading levels are rated as above average. However, there
is a considerable range in the percentages of students’ classmates with
average reading abilities. For example, whereas approximately one in 17
students in the classrooms of students with mental retardation are rated as
having average reading levels, approximately one in 10 students in the
classrooms of students with orthopedic impairments or learning disabilities
and one in five students in the classrooms of students with emotional
disturbance are rated as having these levels.
Chapter 4 – Classroom Context
Page 4-10 SEELS
*Due to their small proportions in the special education setting, the categories of “much above average” (<3.0) and “somewhat above average” (<1.9) have been combined with the “average” (<15.0) category.
Exhibit 4-6
Average Teacher Ratings of Reading Levels of Language Arts Classes of Students with Disabilities,
by Disability Category and Setting
74.6
60.7
69.1
47.5
67.5
61.1
55.9
43.4
70.6
48.8
47.4
11.3
19.4
8.0
8.1
10.6
9.4
9.3
9.6
10.5
8.4
11.5
17.8
33.7
23.1
38.6
23.4
26.1
31.3
36.7
23.7
39.4
41.2
16.3
23.5
15.3
19.9
16.7
17.4
21
19.5
24.9
17.9
21.4
7.5
5.8
7.7
13.9
9.2
12.8
12.7
19.8
5.7
11.6
11.4
41.3
36.1
45.3
44.3
42.8
40.9
39.8
44.5
40.1
43.8
43.5
16.9
12.5
17.6
17.6
17.1
20.2
17.2
17.1
14.9
17.6
14.6
14
8.5
13.7
10
12.7
12.1
12.6
9.1
9.6
12.2
8.9
Multiple disabilities
Traumatic brain injury
Autism
Other health impairment
Orthopedic impairment
Visual impairment
Hearing impairment
Emotional disturbance
Mental retardation
Speech impairment
Learning disability
Multiple disabilities
Traumatic brain injury
Autism
Other health impairment
Orthopedic impairment
Visual impairment
Hearing impairment
Emotional disturbance
Mental retardation
Speech impairment
Learning disability
Much below average Somewhat below average Average
Somewhat above average Much above average
General Education
Special Education*
Chapter 4 – Classroom Context
SEELS Page 4-11
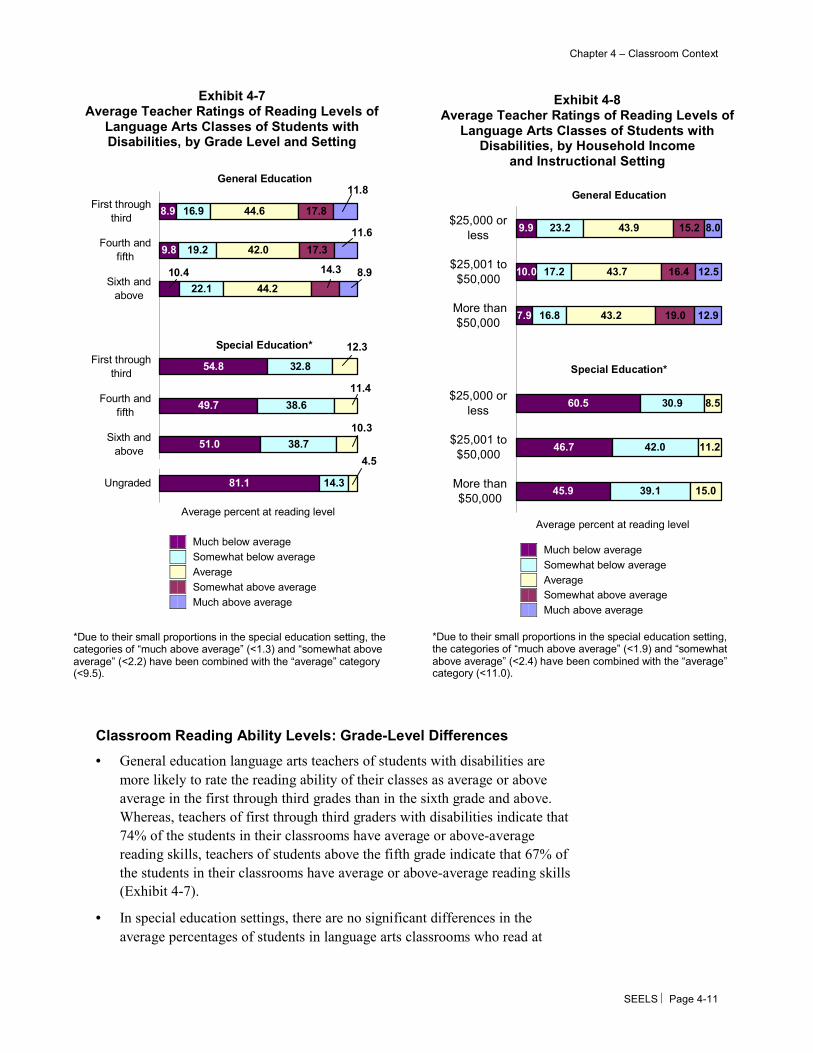
Classroom Reading Ability Levels: Grade-Level Differences
• General education language arts teachers of students with disabilities are
more likely to rate the reading ability of their classes as average or above
average in the first through third grades than in the sixth grade and above.
Whereas, teachers of first through third graders with disabilities indicate that
74% of the students in their classrooms have average or above-average
reading skills, teachers of students above the fifth grade indicate that 67% of
the students in their classrooms have average or above-average reading skills
(Exhibit 4-7).
• In special education settings, there are no significant differences in the
average percentages of students in language arts classrooms who read at
Exhibit 4-8 Average Teacher Ratings of Reading Levels of
Language Arts Classes of Students with Disabilities, by Household Income
and Instructional Setting
45.9
46.7
60.5
7.9
10.0
9.9
39.1
42.0
30.9
16.8
17.2
23.2
15.0
11.2
8.5
43.2
43.7
43.9
19.0
16.4
15.2
12.9
12.5
8.0
More than$50,000
$25,001 to$50,000
$25,000 orless
More than$50,000
$25,001 to$50,000
$25,000 orless
General Education
Special Education*
Average percent at reading level
*Due to their small proportions in the special education setting, the categories of “much above average” (<1.9) and “somewhat above average” (<2.4) have been combined with the “average” category (<11.0).
Exhibit 4-7 Average Teacher Ratings of Reading Levels of
Language Arts Classes of Students with Disabilities, by Grade Level and Setting
81.1
51.0
49.7
54.8
9.8
8.9
14.3
38.7
38.6
32.8
22.1
19.2
16.9
44.2
42.0
44.6
17.3
17.8
10.4
4.5
10.3
11.4
12.3
14.3 8.9
11.6
11.8
Ungraded
Sixth andabove
Fourth andfifth
First throughthird
Sixth andabove
Fourth andfifth
First throughthird
Average percent at reading level
Special Education*
General Education
*Due to their small proportions in the special education setting, the categories of “much above average” (<1.3) and “somewhat above average” (<2.2) have been combined with the “average” category (<9.5).
Much below average
Somewhat below average
Average
Somewhat above average
Much above average
Much below average
Somewhat below average
Average
Somewhat above average
Much above average
Chapter 4 – Classroom Context
Page 4-12 SEELS
various levels across the grade levels; however, ungraded classes tend to
have lower levels of ability than classes at any grade level.
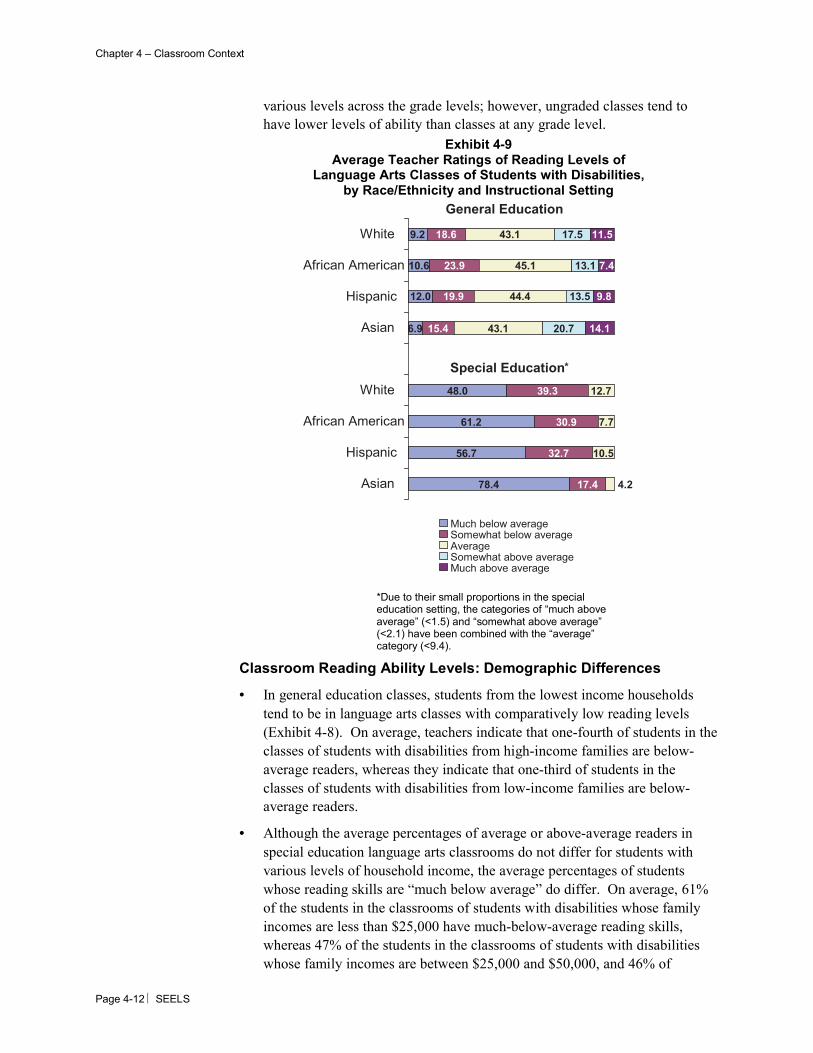
Exhibit 4-9 Average Teacher Ratings of Reading Levels of
Language Arts Classes of Students with Disabilities, by Race/Ethnicity and Instructional Setting
Classroom Reading Ability Levels: Demographic Differences
• In general education classes, students from the lowest income households
tend to be in language arts classes with comparatively low reading levels
(Exhibit 4-8). On average, teachers indicate that one-fourth of students in the
classes of students with disabilities from high-income families are below-
average readers, whereas they indicate that one-third of students in the
classes of students with disabilities from low-income families are below-
average readers.
• Although the average percentages of average or above-average readers in
special education language arts classrooms do not differ for students with
various levels of household income, the average percentages of students
whose reading skills are “much below average” do differ. On average, 61%
of the students in the classrooms of students with disabilities whose family
incomes are less than $25,000 have much-below-average reading skills,
whereas 47% of the students in the classrooms of students with disabilities
whose family incomes are between $25,000 and $50,000, and 46% of
*Due to their small proportions in the special education setting, the categories of “much above average” (<1.5) and “somewhat above average” (<2.1) have been combined with the “average” category (<9.4).
*
Chapter 4 – Classroom Context
SEELS Page 4-13
students in the classrooms of students with disabilities whose family incomes
exceed $50,000 have much-below-average reading skills.
• In general education settings, African-American students are more likely
than white students to have more below-average readers in their classrooms
(Exhibit 4-9)—on average 38% of the students in the classroom, compared
with 28% of the students.
• Among students receiving instruction in special education settings, compared
with white students, African-American and Asian/Pacific Islander students
have more classmates whose reading ability is assessed as much below
average (63% and 78%, respectively, vs. 48%).
Teacher Profiles: Type of Certificate, Preparation Program, and Level of Education
NCLB emphasizes the need to have qualified teachers in every classroom who
are appropriately prepared to teach students with diverse needs. Teacher
preparation programs are seeking to respond to the legislative imperatives,
particularly with regard to raising performance standards for new teachers
(Carlson et al., 2002). Studies have shown that teachers who have fulfilled
stringent preparation requirements and acquired appropriate credentials are more
effective in the classroom, compared with teachers who do not have teaching
certificates or who hold an emergency credential, with regard to such things as
curriculum planning, individualizing instruction for students with diverse needs,
and developing creative instructional practices that benefit the class (Brownell &
Pajares, 1999; Darling-Hammond, 2000a). The lack of universal standardized
credentials and inconsistent certification requirements across states creates
confusion, as well as immense variation in teacher quality (Darling-Hammond,
2000a, 2000b).
In this section, the certification and educational backgrounds of teachers who
provide language arts instruction to students with disabilities are described.
Teacher Certification Across Instructional Settings
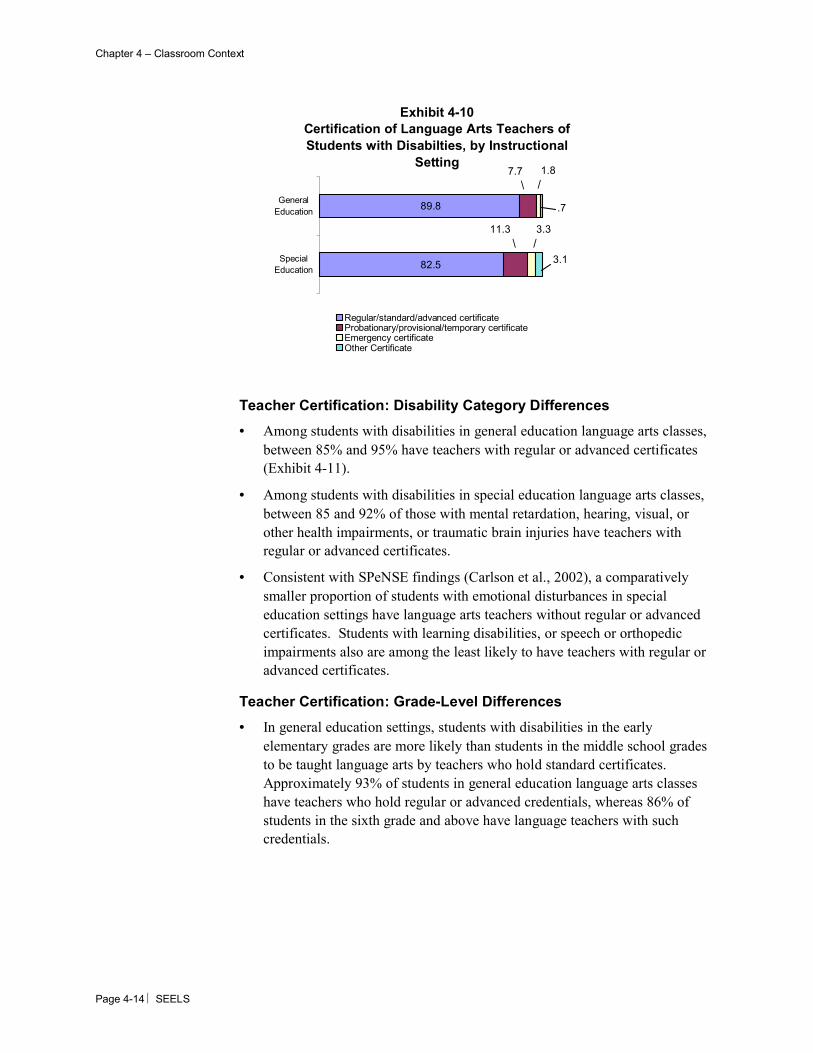
• Regardless of their language arts setting, the large majority of students with
disabilities have teachers who hold a typical teaching certification (i.e.,
regular, standard, or advanced; Exhibit 4-10). However, students in general
education languages arts settings are somewhat more likely than students in
special education language arts settings to have fully credentialed teachers.
• The pattern of certification for language arts teachers of students with
disabilities in special education settings generally mirrors that of national
estimates from the Study of Personnel Needs in Special Education2
(SPeNSE; Carlson et al., 2002).
2 The OSEP-sponsored Study of Personnel Needs in Special Education (SPeNSE) provides in-
depth information on the characteristics of teachers and staff who serve students with disabilities. Information is available at www.spense.org.
Chapter 4 – Classroom Context
Page 4-14 SEELS
Exhibit 4-10Certification of Language Arts Teachers of Students with Disabilties, by Instructional
Setting
SpecialEducation
GeneralEducation
Regular/standard/advanced certificateProbationary/provisional/temporary certificateEmergency certificateOther Certificate
89.8
82.5
7.7
\ 1.8
/
.7
11.3
\ 3.3
/ 3.1
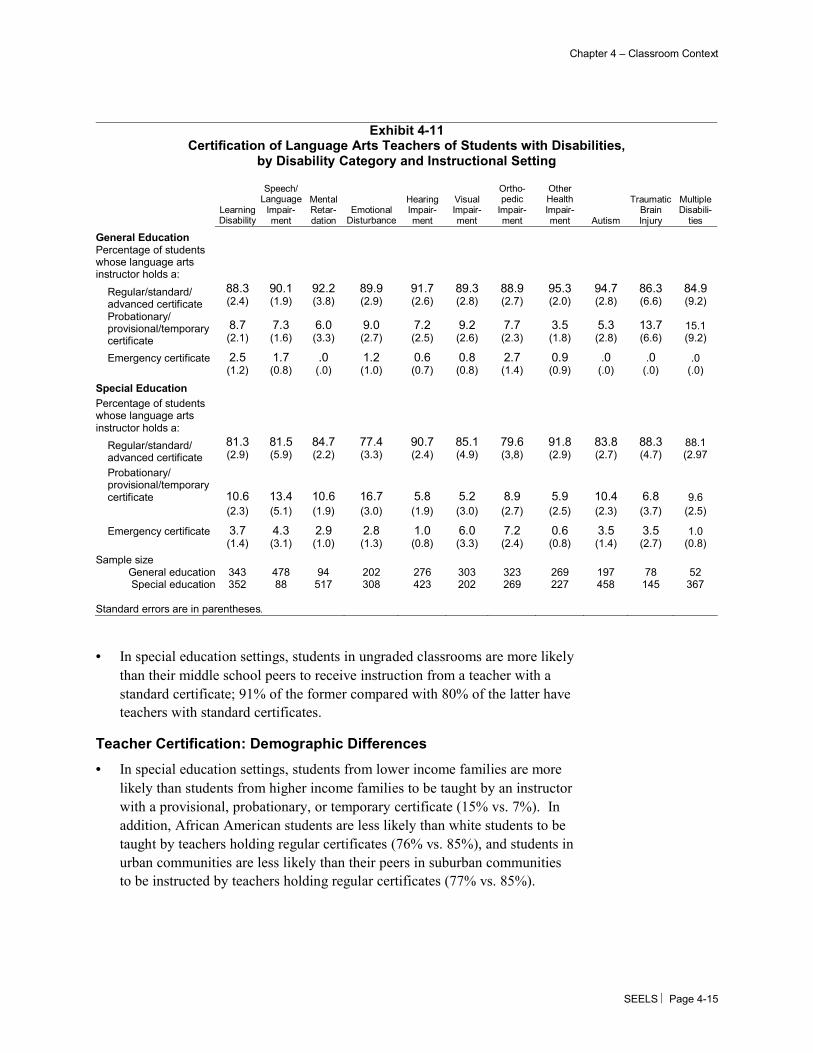
Teacher Certification: Disability Category Differences
• Among students with disabilities in general education language arts classes,
between 85% and 95% have teachers with regular or advanced certificates
(Exhibit 4-11).
• Among students with disabilities in special education language arts classes,
between 85 and 92% of those with mental retardation, hearing, visual, or
other health impairments, or traumatic brain injuries have teachers with
regular or advanced certificates.
• Consistent with SPeNSE findings (Carlson et al., 2002), a comparatively
smaller proportion of students with emotional disturbances in special
education settings have language arts teachers without regular or advanced
certificates. Students with learning disabilities, or speech or orthopedic
impairments also are among the least likely to have teachers with regular or
advanced certificates.
Teacher Certification: Grade-Level Differences
• In general education settings, students with disabilities in the early
elementary grades are more likely than students in the middle school grades
to be taught language arts by teachers who hold standard certificates.
Approximately 93% of students in general education language arts classes
have teachers who hold regular or advanced credentials, whereas 86% of
students in the sixth grade and above have language teachers with such
credentials.
Chapter 4 – Classroom Context
SEELS Page 4-15
Exhibit 4-11 Certification of Language Arts Teachers of Students with Disabilities,
by Disability Category and Instructional Setting
Learning Disability
Speech/ Language
Impair-ment
Mental Retar-dation
Emotional Disturbance
Hearing Impair-ment
Visual Impair-ment
Ortho-pedic
Impair-ment
Other Health Impair-ment Autism
Traumatic Brain Injury
Multiple Disabili-
ties
General Education Percentage of students whose language arts instructor holds a:
Regular/standard/ advanced certificate
88.3 (2.4)
90.1 (1.9)
92.2(3.8)
89.9 (2.9)
91.7 (2.6)
89.3(2.8)
88.9 (2.7)
95.3 (2.0)
94.7(2.8)
86.3(6.6)
84.9(9.2)
Probationary/ provisional/temporary certificate
8.7 (2.1)
7.3 (1.6)
6.0 (3.3)
9.0 (2.7)
7.2 (2.5)
9.2 (2.6)
7.7 (2.3)
3.5 (1.8)
5.3 (2.8)
13.7(6.6)
15.1 (9.2)
Emergency certificate 2.5 1.7 .0 1.2 0.6 0.8 2.7 0.9 .0 .0 .0
(1.2) (0.8) (.0) (1.0) (0.7) (0.8) (1.4) (0.9) (.0) (.0) (.0)
Special Education Percentage of students whose language arts instructor holds a:
Regular/standard/ advanced certificate
81.3 (2.9)
81.5 (5.9)
84.7(2.2)
77.4 (3.3)
90.7 (2.4)
85.1(4.9)
79.6 (3,8)
91.8 (2.9)
83.8(2.7)
88.3(4.7)
88.1 (2.97
Probationary/ provisional/temporary certificate 10.6 13.4 10.6 16.7 5.8 5.2 8.9 5.9 10.4 6.8 9.6
(2.3) (5.1) (1.9) (3.0) (1.9) (3.0) (2.7) (2.5) (2.3) (3.7) (2.5)
Emergency certificate 3.7 4.3 2.9 2.8 1.0 6.0 7.2 0.6 3.5 3.5 1.0
(1.4) (3.1) (1.0) (1.3) (0.8) (3.3) (2.4) (0.8) (1.4) (2.7) (0.8)
Sample size General education 343 478 94 202 276 303 323 269 197 78 52 Special education 352 88 517 308 423 202 269 227 458 145 367
Standard errors are in parentheses.
• In special education settings, students in ungraded classrooms are more likely
than their middle school peers to receive instruction from a teacher with a
standard certificate; 91% of the former compared with 80% of the latter have
teachers with standard certificates.
Teacher Certification: Demographic Differences
• In special education settings, students from lower income families are more
likely than students from higher income families to be taught by an instructor
with a provisional, probationary, or temporary certificate (15% vs. 7%). In
addition, African American students are less likely than white students to be
taught by teachers holding regular certificates (76% vs. 85%), and students in
urban communities are less likely than their peers in suburban communities
to be instructed by teachers holding regular certificates (77% vs. 85%).
Chapter 4 – Classroom Context
Page 4-16 SEELS
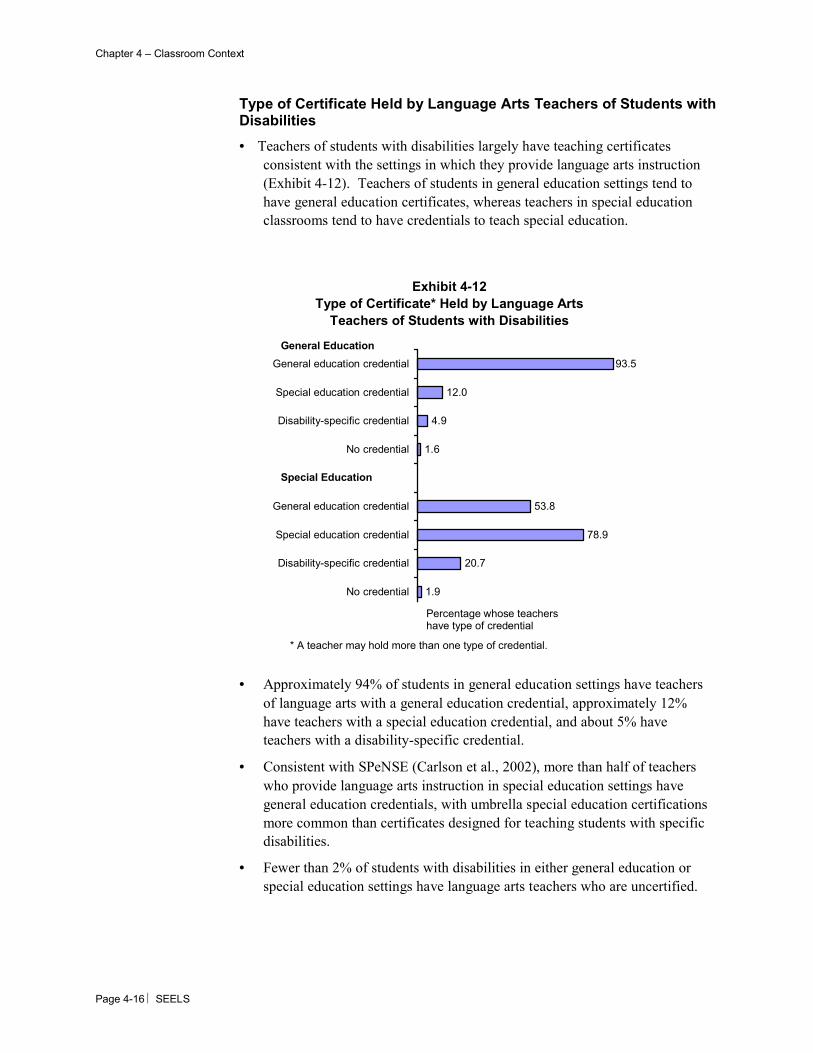
Type of Certificate Held by Language Arts Teachers of Students with Disabilities
• Teachers of students with disabilities largely have teaching certificates
consistent with the settings in which they provide language arts instruction
(Exhibit 4-12). Teachers of students in general education settings tend to
have general education certificates, whereas teachers in special education
classrooms tend to have credentials to teach special education.
• Approximately 94% of students in general education settings have teachers
of language arts with a general education credential, approximately 12%
have teachers with a special education credential, and about 5% have
teachers with a disability-specific credential.
• Consistent with SPeNSE (Carlson et al., 2002), more than half of teachers
who provide language arts instruction in special education settings have
general education credentials, with umbrella special education certifications
more common than certificates designed for teaching students with specific
disabilities.
• Fewer than 2% of students with disabilities in either general education or
special education settings have language arts teachers who are uncertified.
Exhibit 4-12Type of Certificate* Held by Language Arts
Teachers of Students with Disabilities
1.9
20.7
78.9
53.8
1.6
4.9
12.0
93.5
No credential
Disability-specific credential
Special education credential
General education credential
No credential
Disability-specific credential
Special education credential
General education credential
General Education
Special Education
Percentage whose teachers have type of credential
* A teacher may hold more than one type of credential.
Chapter 4 – Classroom Context
SEELS Page 4-17
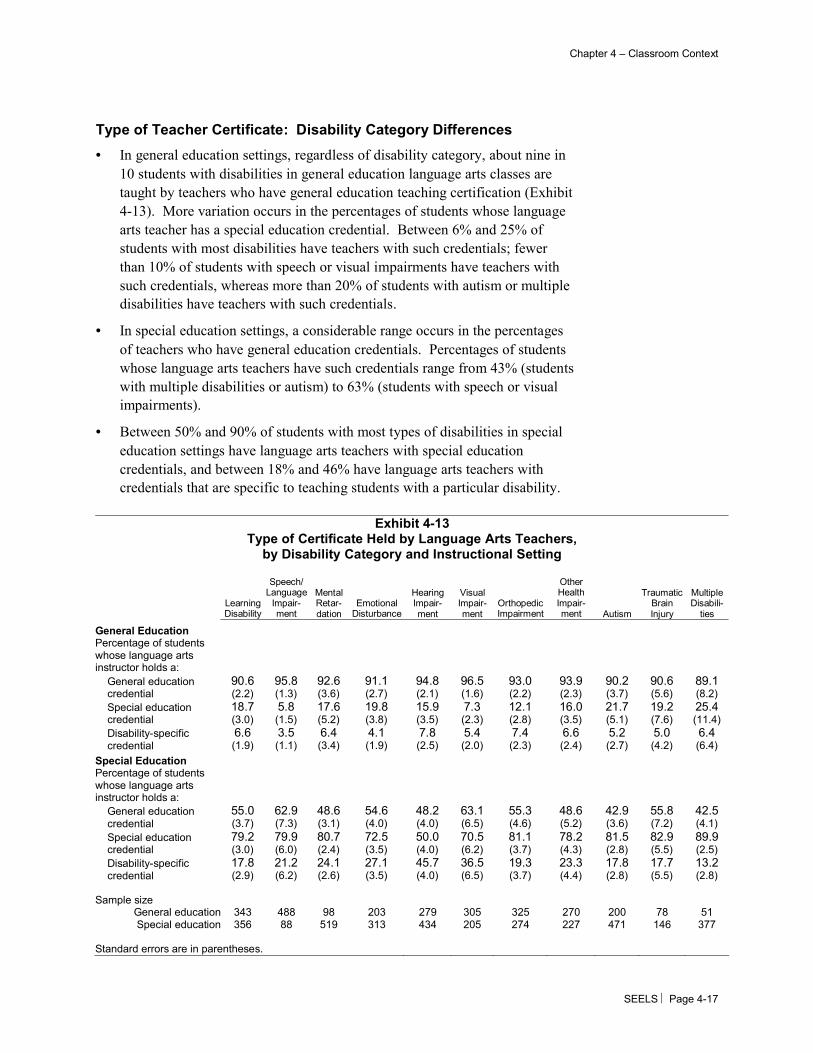
Type of Teacher Certificate: Disability Category Differences
• In general education settings, regardless of disability category, about nine in
10 students with disabilities in general education language arts classes are
taught by teachers who have general education teaching certification (Exhibit
4-13). More variation occurs in the percentages of students whose language
arts teacher has a special education credential. Between 6% and 25% of
students with most disabilities have teachers with such credentials; fewer
than 10% of students with speech or visual impairments have teachers with
such credentials, whereas more than 20% of students with autism or multiple
disabilities have teachers with such credentials.
• In special education settings, a considerable range occurs in the percentages
of teachers who have general education credentials. Percentages of students
whose language arts teachers have such credentials range from 43% (students
with multiple disabilities or autism) to 63% (students with speech or visual
impairments).
• Between 50% and 90% of students with most types of disabilities in special
education settings have language arts teachers with special education
credentials, and between 18% and 46% have language arts teachers with
credentials that are specific to teaching students with a particular disability.
Exhibit 4-13
Type of Certificate Held by Language Arts Teachers, by Disability Category and Instructional Setting
Learning Disability
Speech/Language
Impair-ment
Mental Retar-dation
Emotional Disturbance
Hearing Impair-ment
Visual Impair-ment
Orthopedic Impairment
Other Health Impair-ment Autism
Traumatic Brain Injury
Multiple Disabili-
ties
General Education Percentage of students whose language arts instructor holds a:
90.6 95.8 92.6 91.1 94.8 96.5 93.0 93.9 90.2 90.6 89.1 General education credential (2.2) (1.3) (3.6) (2.7) (2.1) (1.6) (2.2) (2.3) (3.7) (5.6) (8.2)
18.7 5.8 17.6 19.8 15.9 7.3 12.1 16.0 21.7 19.2 25.4 Special education credential (3.0) (1.5) (5.2) (3.8) (3.5) (2.3) (2.8) (3.5) (5.1) (7.6) (11.4)
6.6 3.5 6.4 4.1 7.8 5.4 7.4 6.6 5.2 5.0 6.4 Disability-specific credential (1.9) (1.1) (3.4) (1.9) (2.5) (2.0) (2.3) (2.4) (2.7) (4.2) (6.4)
Special Education Percentage of students whose language arts instructor holds a:
55.0 62.9 48.6 54.6 48.2 63.1 55.3 48.6 42.9 55.8 42.5 General education credential (3.7) (7.3) (3.1) (4.0) (4.0) (6.5) (4.6) (5.2) (3.6) (7.2) (4.1)
79.2 79.9 80.7 72.5 50.0 70.5 81.1 78.2 81.5 82.9 89.9 Special education credential (3.0) (6.0) (2.4) (3.5) (4.0) (6.2) (3.7) (4.3) (2.8) (5.5) (2.5)
17.8 21.2 24.1 27.1 45.7 36.5 19.3 23.3 17.8 17.7 13.2 Disability-specific credential (2.9) (6.2) (2.6) (3.5) (4.0) (6.5) (3.7) (4.4) (2.8) (5.5) (2.8)
Sample size
General education 343 488 98 203 279 305 325 270 200 78 51 Special education 356 88 519 313 434 205 274 227 471 146 377
Standard errors are in parentheses.
Chapter 4 – Classroom Context
Page 4-18 SEELS
• Students with autism or multiple disabilities in special education settings are
the least likely to have language arts teachers who held general education
certificates (43%) and are among the most likely to have language arts
teachers with special education certificates (82% and 89%, respectively).
• Students with hearing impairments in special education settings are the least
likely to have language arts teachers with a blanket special education
credential (50%) and the most likely to have language arts teachers with a
disability-specific certificate (46%).
Type of Teacher Certificate: Demographic Differences
• The only demographic differences in the types of teachers’ certificates
concern race/ethnicity.
• In general education settings, African-American students with disabilities are
less likely than white students to have teachers with general education
credentials (45% vs. 57%).
• In special education settings, Hispanic students are less likely than white
students to have teachers with special education credentials (fewer than 1%
vs. 6%).
Teacher Preparation Programs
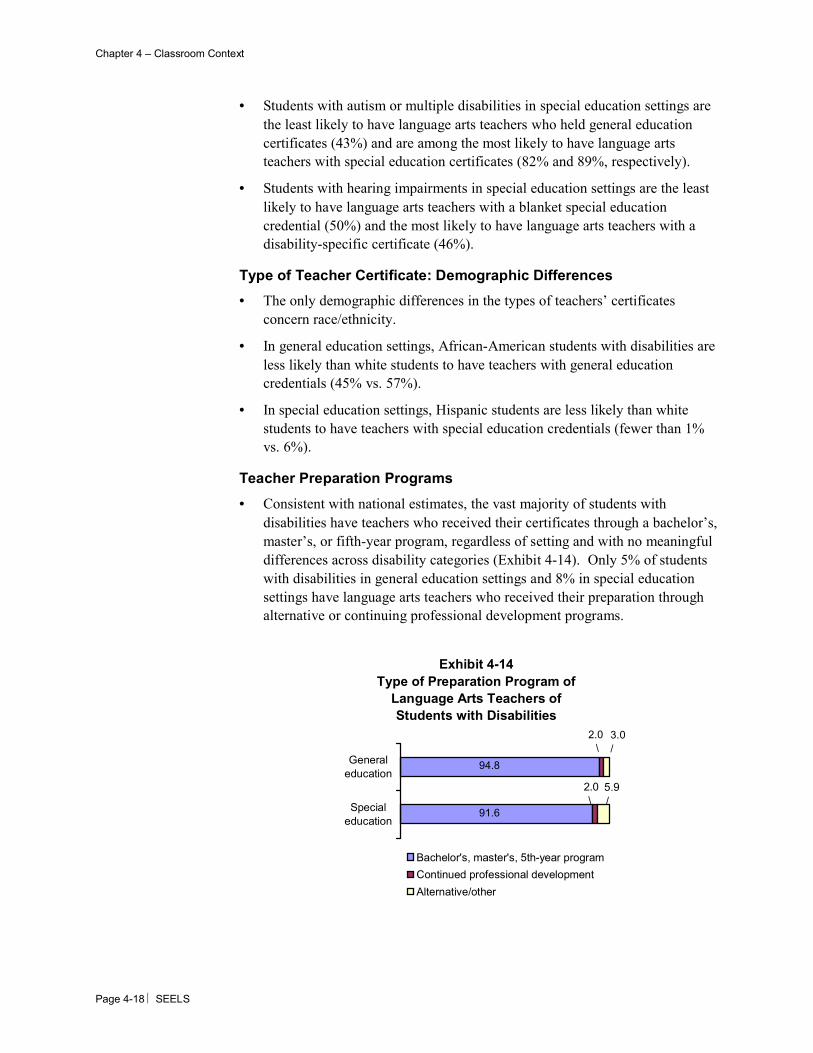
• Consistent with national estimates, the vast majority of students with
disabilities have teachers who received their certificates through a bachelor’s,
master’s, or fifth-year program, regardless of setting and with no meaningful
differences across disability categories (Exhibit 4-14). Only 5% of students
with disabilities in general education settings and 8% in special education
settings have language arts teachers who received their preparation through
alternative or continuing professional development programs.
Exhibit 4-14Type of Preparation Program of
Language Arts Teachers of Students with Disabilities
Specialeducation
Generaleducation
Bachelor's, master's, 5th-year program
Continued professional development
Alternative/other
94.8
91.6
2.0 \ 3.0
/
2.0 \
5.9/
Chapter 4 – Classroom Context
SEELS Page 4-19
• Among students with disabilities in general education settings, regardless of
disability category, at least 93% have language arts teachers who received
their degree through a bachelor’s, master’s, or fifth-year program.
• Among students with disabilities in special education settings, between 89%
and 98% of students with most types of disabilities have teachers who
received their degree through a bachelor’s, master’s, or fifth-year program.
The exception is students with traumatic brain injury, only 84% of whom
have language arts teachers who received their degrees through such
programs; 16% of these students have teachers who received their degrees
through alternative or continuing professional development programs.
• There are no grade-level differences in teacher preparation programs.
Teacher’s Education
• Regardless of setting, more than 90% of students with disabilities have
language arts teachers who earned their certificate or license through
bachelor’s, master’s degrees or fifth-year programs; 3% received their
certificates through alternative programs such as “fast-track programs” that
do not require education degrees but allow certification based on other
credentials; and 2% received their certificates through continuing
professional development.
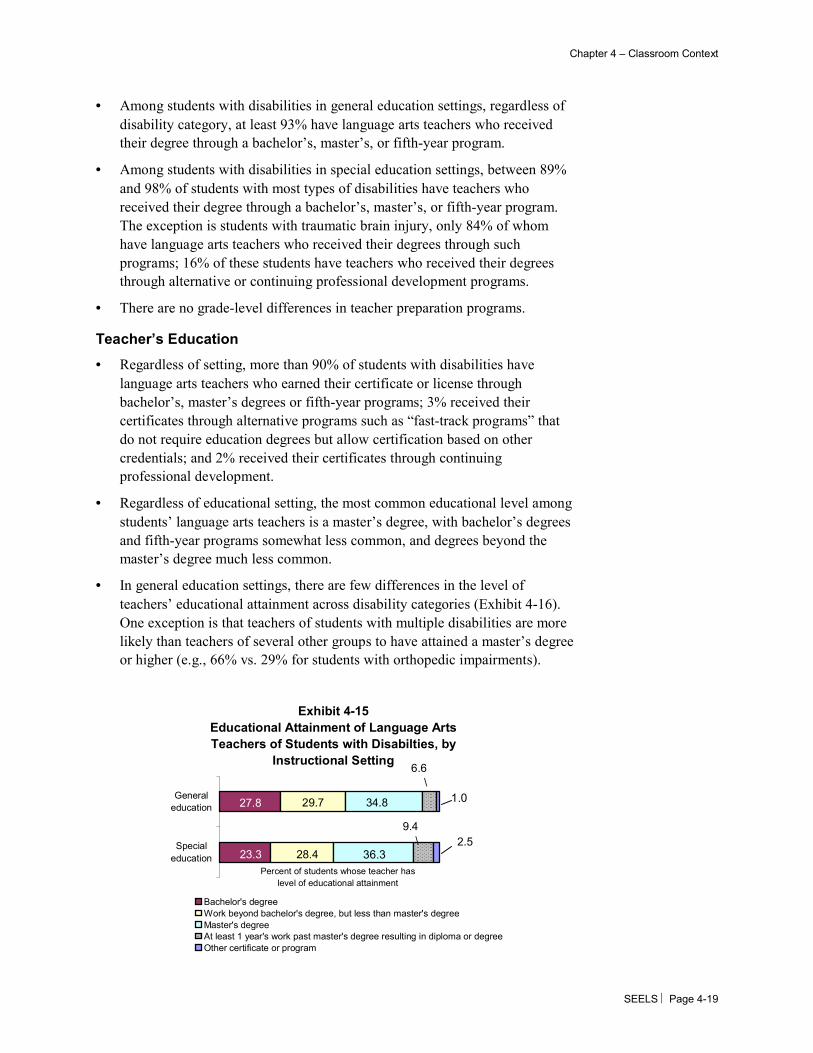
• Regardless of educational setting, the most common educational level among
students’ language arts teachers is a master’s degree, with bachelor’s degrees
and fifth-year programs somewhat less common, and degrees beyond the
master’s degree much less common.
• In general education settings, there are few differences in the level of
teachers’ educational attainment across disability categories (Exhibit 4-16).
One exception is that teachers of students with multiple disabilities are more
likely than teachers of several other groups to have attained a master’s degree
or higher (e.g., 66% vs. 29% for students with orthopedic impairments).
Exhibit 4-15Educational Attainment of Language Arts Teachers of Students with Disabilties, by
Instructional Setting
Specialeducation
Generaleducation
Bachelor's degreeWork beyond bachelor's degree, but less than master's degreeMaster's degreeAt least 1 year's work past master's degree resulting in diploma or degreeOther certificate or program
27.8
23.3
29.7 34.8
6.6 \
28.4
9.4 \ 2.5
1.0
36.3Percent of students whose teacher has
level of educational attainment
Chapter 4 – Classroom Context
Page 4-20 SEELS
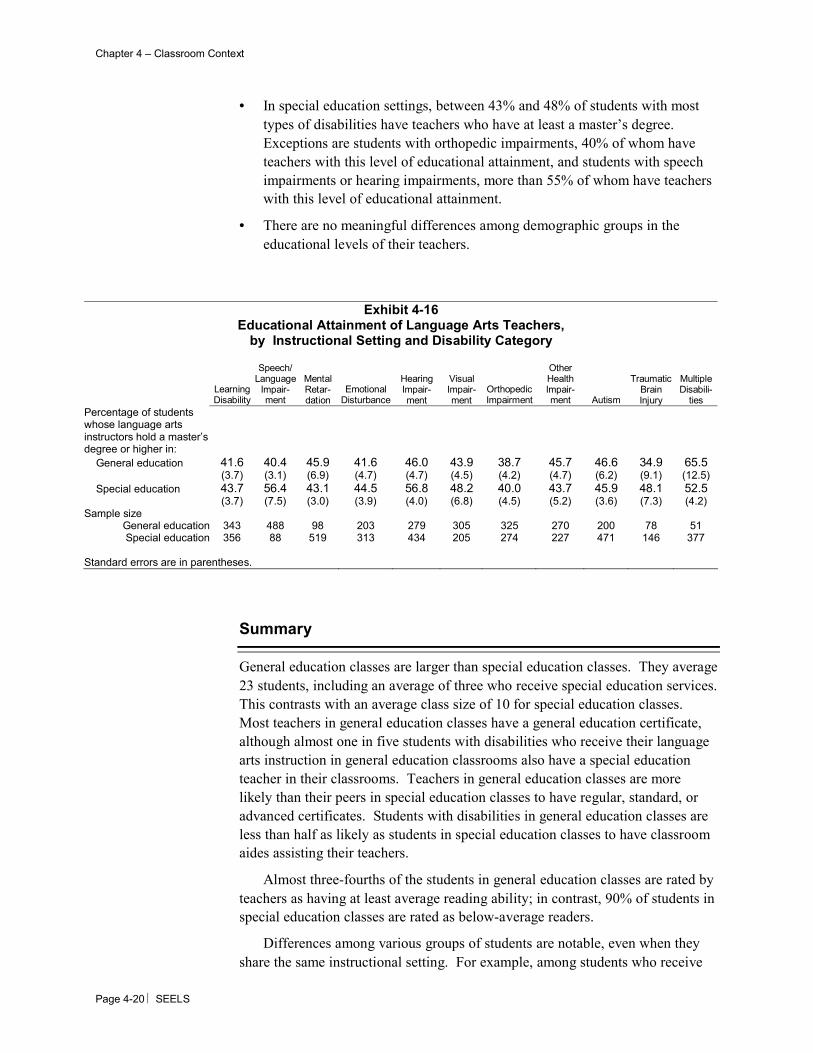
• In special education settings, between 43% and 48% of students with most
types of disabilities have teachers who have at least a master’s degree.
Exceptions are students with orthopedic impairments, 40% of whom have
teachers with this level of educational attainment, and students with speech
impairments or hearing impairments, more than 55% of whom have teachers
with this level of educational attainment.
• There are no meaningful differences among demographic groups in the
educational levels of their teachers.
Exhibit 4-16 Educational Attainment of Language Arts Teachers,
by Instructional Setting and Disability Category
Learning Disability
Speech/ Language
Impair-ment
Mental Retar-dation
Emotional Disturbance
Hearing Impair-ment
Visual Impair-ment
Orthopedic Impairment
Other Health Impair-ment Autism
Traumatic Brain Injury
Multiple Disabili-
ties Percentage of students whose language arts instructors hold a master’s degree or higher in:
General education 41.6 40.4 45.9 41.6 46.0 43.9 38.7 45.7 46.6 34.9 65.5 (3.7) (3.1) (6.9) (4.7) (4.7) (4.5) (4.2) (4.7) (6.2) (9.1) (12.5) Special education 43.7 56.4 43.1 44.5 56.8 48.2 40.0 43.7 45.9 48.1 52.5
(3.7) (7.5) (3.0) (3.9) (4.0) (6.8) (4.5) (5.2) (3.6) (7.3) (4.2) Sample size
General education 343 488 98 203 279 305 325 270 200 78 51 Special education 356 88 519 313 434 205 274 227 471 146 377
Standard errors are in parentheses.
Summary
General education classes are larger than special education classes. They average
23 students, including an average of three who receive special education services.
This contrasts with an average class size of 10 for special education classes.
Most teachers in general education classes have a general education certificate,
although almost one in five students with disabilities who receive their language
arts instruction in general education classrooms also have a special education
teacher in their classrooms. Teachers in general education classes are more
likely than their peers in special education classes to have regular, standard, or
advanced certificates. Students with disabilities in general education classes are
less than half as likely as students in special education classes to have classroom
aides assisting their teachers.
Almost three-fourths of the students in general education classes are rated by
teachers as having at least average reading ability; in contrast, 90% of students in
special education classes are rated as below-average readers.
Differences among various groups of students are notable, even when they
share the same instructional setting. For example, among students who receive
Chapter 4 – Classroom Context
SEELS Page 4-21
language arts instruction in special education settings, students with mental
retardation or multiple disabilities are in classes with more students with very
poor reading abilities, whereas students with speech impairments, learning
disabilities, or emotional disturbance who share a special education placement
are in classes with fewer very poor readers. Among students who take their
language arts in special education settings, those with speech or hearing
impairments are more likely than many other groups of students to have teachers
with at least a master’s degree.
Grade-level differences are apparent in several aspects of classrooms.
Among students for whom language arts instruction is in general education
settings, middle-school-age students are in larger classes than younger students.
Although they are more likely to have special education teachers in the general
education classrooms, they are less likely to have classroom aides. They also are
less likely to have teachers with standard certificates. In addition, their reading
abilities are more likely to be rated by their teachers as below average.
Among students whose language arts is delivered in special education
settings, students in lower grades have fewer students in their classrooms and are
more likely to have a paid staff member besides the teacher in the classroom.
Students in ungraded classrooms are the most likely of all students to have a paid
staff member other than the teacher in the classroom and the most likely to be in
classrooms where the average reading ability level is much below average.
Demographic differences also occur. For example, in general education
classes, students with disabilities from upper-income households tend to be in
larger classes than their lower-income peers, whereas in general education
classes, the reverse is true. Nonetheless, in both settings, classroom reading
ability levels tend to be lowest in the classrooms of students from low-income
families.
Few differences emerge among the racial/ethnic groups. However, in
general education settings, compared with white students, Hispanic students are
less likely to have a special education teacher in the classroom, and African-
American students are more likely to be in classrooms with relatively low ability
levels in reading. In special education settings, Asian/Pacific Islander students
are more likely than white students to have a paid staff member other than a
teacher in the classroom. In addition, these students and African-American
students are more likely than white students to be in classrooms in which the
preponderance of students have reading ability levels that teachers rate as much
below average.
Chapter 4 – Classroom Context
Page 4-22 SEELS
References Achilles, C. M., & Finn, J. D. (2000, November 30-December 1). The varieties of
small classes and their outcomes. Paper presented at the combined National Invitational Conference of the U.S. Department of Education and Temple University’s Laboratory for Student Success, Washington, DC.
Barr, R. (1986). Studying classroom reading instruction. Reading Research Quarterly, 21(3), 231-236.
Blackorby, J. Chorost, M., Garza, N., & Guzman, A. (2004). The academic performance of elementary and middle school students with disabilities. In J. Blackorby, M. Wagner, R. Cameto, E. Davies, P. Levine, L. Newman, et al., Engagement, Academics, Social Adjustment, and Independence: The Achievements of Elementary and Middle School Students with Disabilities. Menlo Park, CA: SRI International.
Brownell, M. T., & Pajares, F. (1999). Teacher efficacy and perceived success in mainstreaming students with learning and behavior problems. Teacher Education and Special Education, 22(3), 154-164.
Carlson, E., Brauen, M., Klein, S., Schroll, K., & Willig, S. (2002). SPeNSE: Key findings. Retrieved August 15, 2003 from http://ferdig.coe.ufl.edu/spense/KeyFindings.pdf.
Darling-Hammond, L. (2000a). Reforming teacher preparation and licensing: Debating the evidence. Teachers College Record, 102(1), 28-56.
Darling-Hammond, L. (2000b). Teacher quality and student achievement: A review of state policy evidence. Education Policy Analysis Archives,8(1).
Elbaum, B., Vaughn, S., Hughes, M., & Moody, S. W. (1999). Grouping practices and reading outcomes for students with disabilities. Exceptional Children, 65(3), 399-415.
Finn, J. D., Gerber, S. B., Achilles, C. M., & Boyd-Zaharias, J. (2001). The enduring effects of small classes. Teachers College Record, 103(2), 145-183.
Gersten, R., & Dimino, J. (1989). Teaching literature to at-risk students. Educational Leadership, 46(5), 53-57.
Harris, K. R., & Graham, S. (1996). Constructivism and students with special needs: Issues in the classroom. Learning Disabilities Research and Practice, 11(3), 134-137.
Slavin, R. (1990). Class size and student achievement: Is smaller better? Contemporary Education, 62(1), 6-12.