Embed Size (px)
Citation preview
4th ACT Workgroup Meeting
October 4, 2016
Fleet Cost Modeling Overview Evaluate total cost of ownership for individual fleets
Capital cost: vehicle, fueling infrastructure, maintenance infrastructure
O&M cost: vehicle maintenance, vehicle mid-life overhaul, vehicle fuel costs & LCFS credits, fueling infrastructure O&M
Compare annual costs of baseline to scenario
Individual fleet costs key to financial impact
Sum of individual fleet costs for statewide total
Analysis in 2016 constant dollars
2
Cost Inputs Bus prices
Infrastructure Fueling and maintenance facility upgrades
Operation and maintenance
Bus annual maintenance and major mid-life
Annual fuel costs vary by fleet Fuel consumption
Long term fuel price
LCFS credit value
Detailed latest assumptions for all bus and fuel types in handout www.arb.ca.gov/msprog/bus/actmeetings.htm
3
Where are Lower Risk
Opportunities for ZEBs Focus on first 15% of fleet
Where suitable for one for one replacements
Meet existing shorter daily range needs first
Depot charging example to simplify discussion
Bus replacements at a normal schedule (14 year life)
Existing diesel and CNG infrastructure costs remain
Fuel costs net of LCFS credit value at $100/credit
Comparison made without including funding
4
Fleet Specific Cost Analysis Analysis assumes no operational barriers for first 15%
Plan to follow-up with individual fleets
Selected fleet examples with key fuel cost differences
Golden Gate Transit – Diesel fleet in PG&E area
LA Metro – CNG fleet in SCE/LADWP area
San Diego MTS – CNG fleet in SDG&E area
Highlight key differences among fleet categories
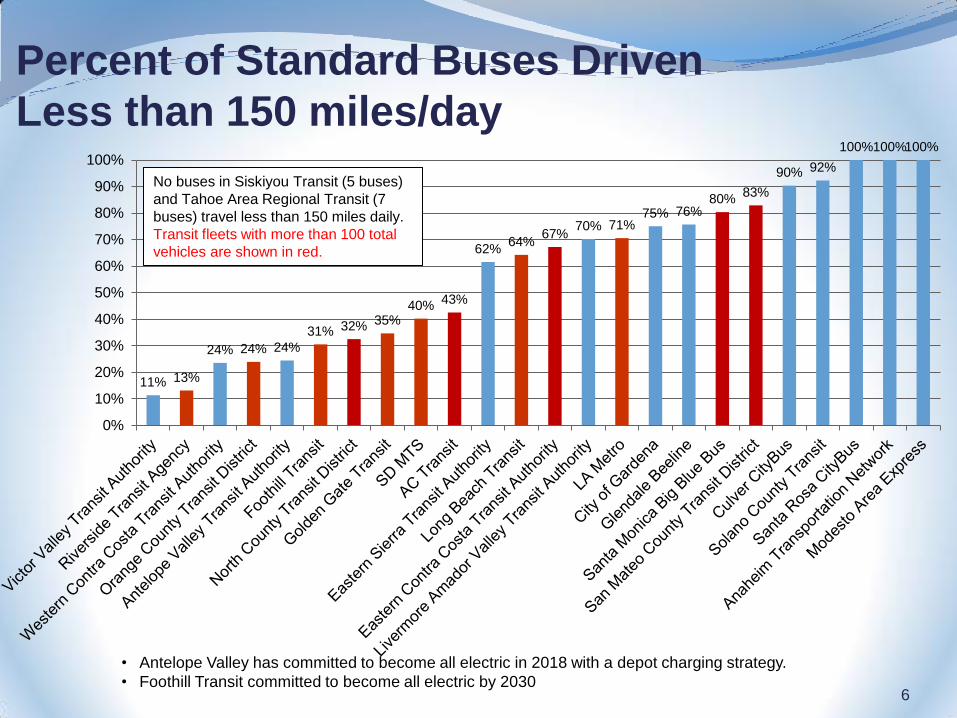
Percent of Standard Buses Driven
Less than 150 miles/day
6
• Antelope Valley has committed to become all electric in 2018 with a depot charging strategy.
• Foothill Transit committed to become all electric by 2030
11% 13%
24% 24% 24%
31% 32% 35% 40% 43%
62% 64%
67% 70% 71%
75% 76% 80%
83%
90% 92%
100% 100% 100%
0%
10%
20%
30%
40%
50%
60%
70%
80%
90%
100%
No buses in Siskiyou Transit (5 buses)
and Tahoe Area Regional Transit (7
buses) travel less than 150 miles daily.
Transit fleets with more than 100 total
vehicles are shown in red.
Bus Price Issues Conventional bus prices increasing faster than inflation
Battery electric bus prices currently declining Battery cost reductions (2016 $725/kWh; 2020 $405 kWh)
Economy of scale
Future battery electric bus prices depend on battery size and economy of scale
Transits can use shorter range and lower cost buses now for substantial part of the fleet
Longer daily range buses eventually needed with larger deployments
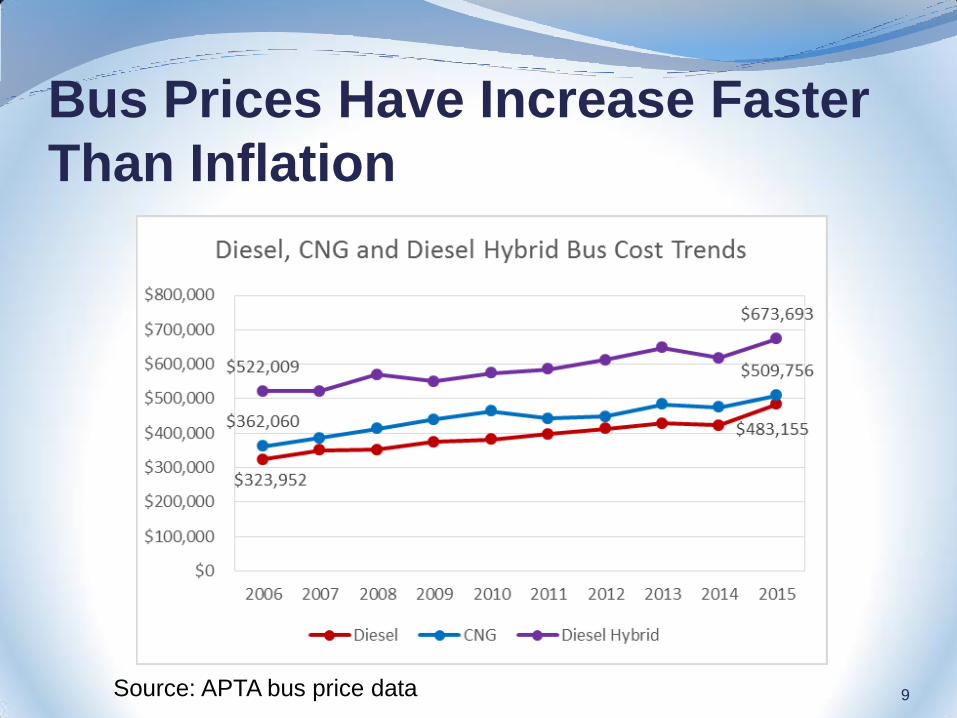
Bus Prices Have Increase Faster
Than Inflation
9 Source: APTA bus price data
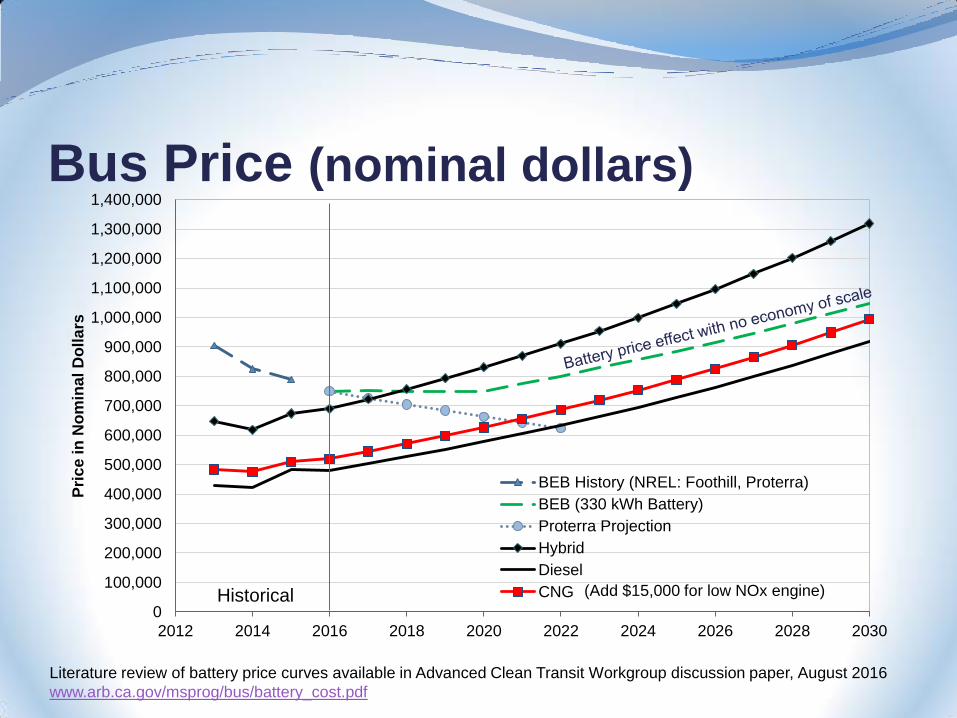
Bus Price (nominal dollars)
0
100,000
200,000
300,000
400,000
500,000
600,000
700,000
800,000
900,000
1,000,000
1,100,000
1,200,000
1,300,000
1,400,000
2012 2014 2016 2018 2020 2022 2024 2026 2028 2030
Pri
ce
in
No
min
al D
olla
rs
BEB History (NREL: Foothill, Proterra)
BEB (330 kWh Battery)
Proterra Projection
Hybrid
Diesel
CNG (Add $15,000 for low NOx engine)
Literature review of battery price curves available in Advanced Clean Transit Workgroup discussion paper, August 2016
www.arb.ca.gov/msprog/bus/battery_cost.pdf
Historical
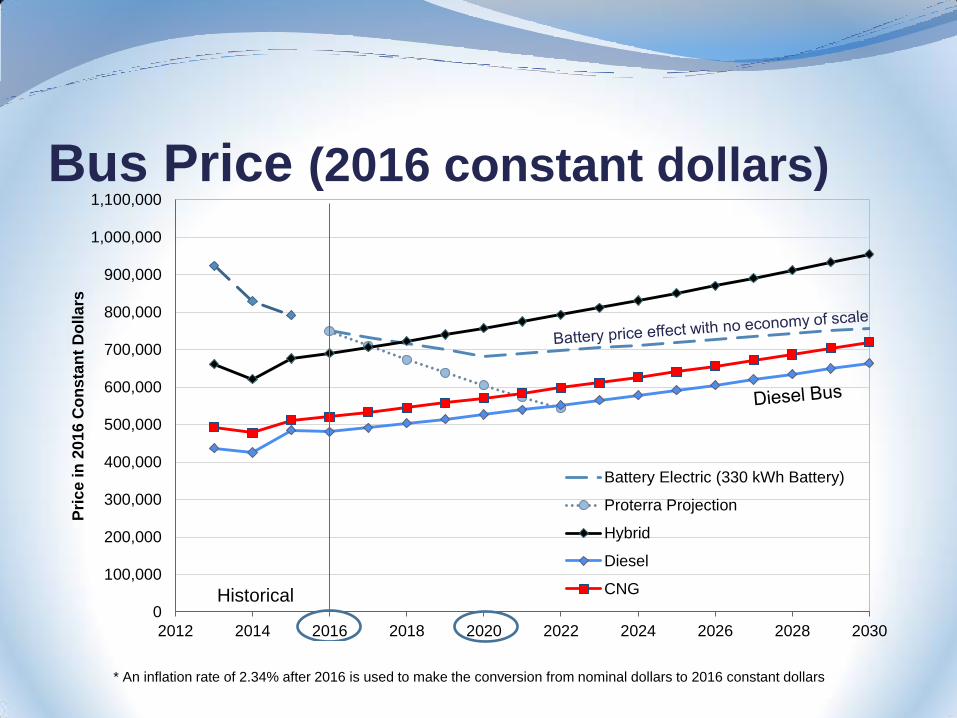
Bus Price (2016 constant dollars)
0
100,000
200,000
300,000
400,000
500,000
600,000
700,000
800,000
900,000
1,000,000
1,100,000
2012 2014 2016 2018 2020 2022 2024 2026 2028 2030
Pri
ce
in
20
16
Co
ns
tan
t D
olla
rs
Battery Electric (330 kWh Battery)
Proterra Projection
Hybrid
Diesel
CNG
* An inflation rate of 2.34% after 2016 is used to make the conversion from nominal dollars to 2016 constant dollars
Historical
Charger Infrastructure
Antelope Valley Transit Authority full depot conversion
$60,000 per bus with backup generator to charge buses
Golden Gate Transit engineering evaluation
Existing transformer has capacity for two chargers on existing meter
10 chargers requires new transformer and switchboard on separate meter
$500,000 for recommended option ($50,000/bus)
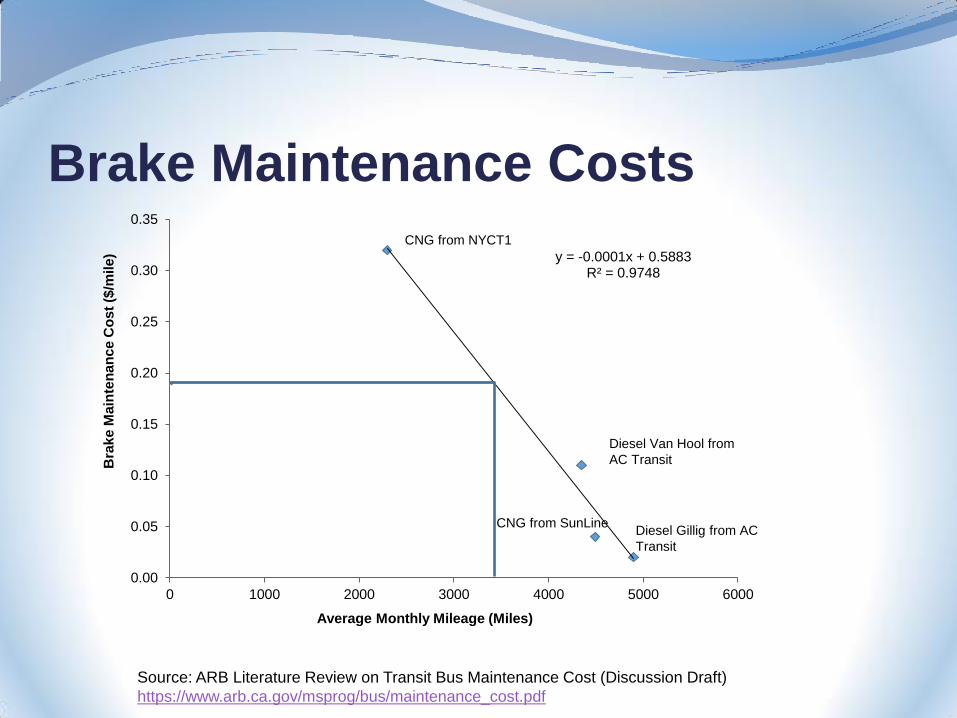
Brake Maintenance Costs
y = -0.0001x + 0.5883 R² = 0.9748
0.00
0.05
0.10
0.15
0.20
0.25
0.30
0.35
0 1000 2000 3000 4000 5000 6000
Bra
ke
Ma
inte
na
nc
e C
os
t ($
/mile
)
Average Monthly Mileage (Miles)
CNG from NYCT1
Diesel Gillig from AC
Transit
CNG from SunLine
Diesel Van Hool from
AC Transit
Source: ARB Literature Review on Transit Bus Maintenance Cost (Discussion Draft)
https://www.arb.ca.gov/msprog/bus/maintenance_cost.pdf
Bus Maintenance Cost ARB literature review of available studies and reports
Minimum $0.19 cost savings per mile at typical 12 mph Brake cost savings and avoided regular maintenance
from first year of Foothill study
No data to compare long term bus repairs
Manufacturer lifecycle estimates reflect savings of battery electric buses at about $0.25/mile
Supports hybrid bus brake cost savings of $0.11/mile
At 40,000 miles/year BEB saves $140,000 per bus compared to CNG and diesel
14
Discussion document at https://www.arb.ca.gov/msprog/bus/battery_cost.pdf
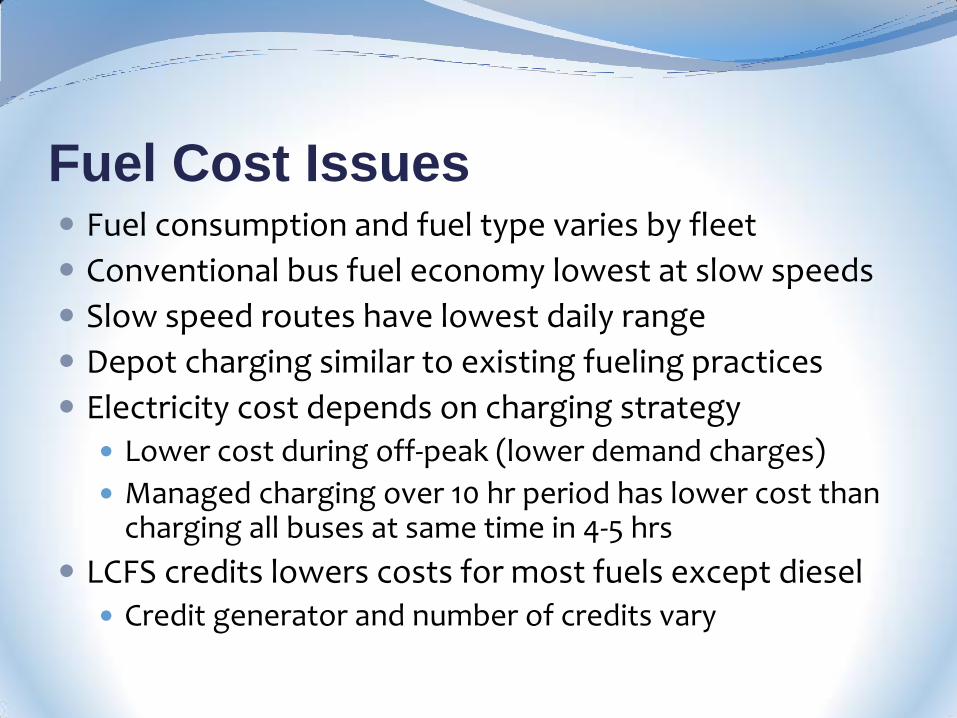
Fuel Cost Issues Fuel consumption and fuel type varies by fleet
Conventional bus fuel economy lowest at slow speeds
Slow speed routes have lowest daily range
Depot charging similar to existing fueling practices
Electricity cost depends on charging strategy Lower cost during off-peak (lower demand charges)
Managed charging over 10 hr period has lower cost than charging all buses at same time in 4-5 hrs
LCFS credits lowers costs for most fuels except diesel Credit generator and number of credits vary
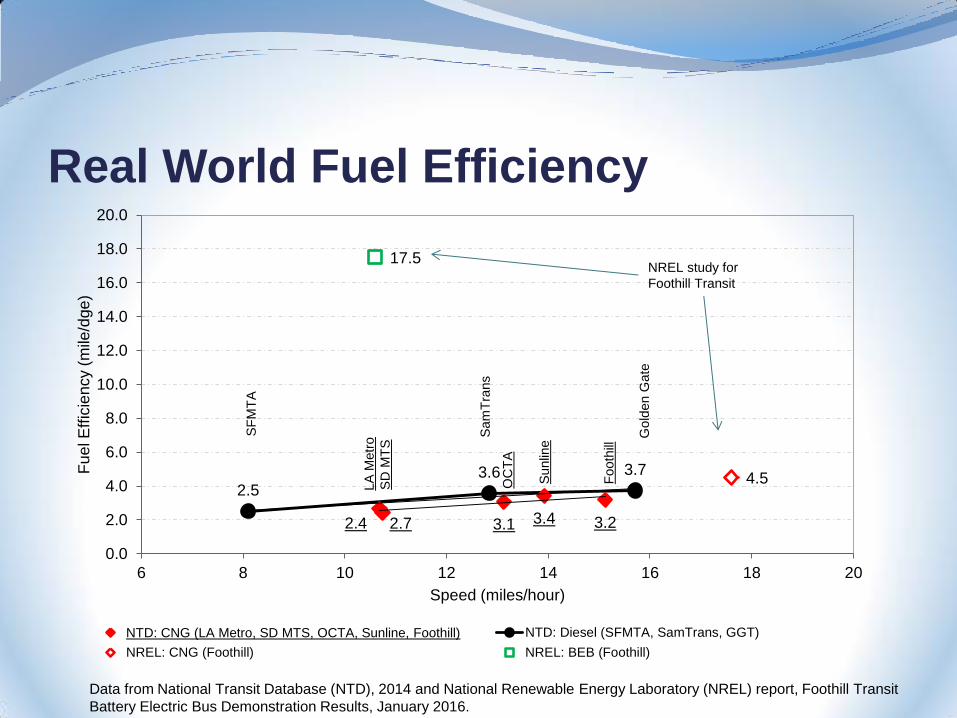
Real World Fuel Efficiency
2.4 2.7 3.1 3.4 3.2
2.5 3.6 3.7
4.5
17.5
0.0
2.0
4.0
6.0
8.0
10.0
12.0
14.0
16.0
18.0
20.0
6 8 10 12 14 16 18 20
Fue
l E
ffic
ien
cy (
mile
/dge
)
Speed (miles/hour)
NTD: CNG (LA Metro, SD MTS, OCTA, Sunline, Foothill) NTD: Diesel (SFMTA, SamTrans, GGT)
NREL: CNG (Foothill) NREL: BEB (Foothill)
SF
MT
A
LA
Metr
o S
am
Tra
ns
OC
TA
Sunlin
e
Footh
ill G
old
en G
ate
NREL study for
Foothill Transit
Data from National Transit Database (NTD), 2014 and National Renewable Energy Laboratory (NREL) report, Foothill Transit
Battery Electric Bus Demonstration Results, January 2016.
SD
MT
S
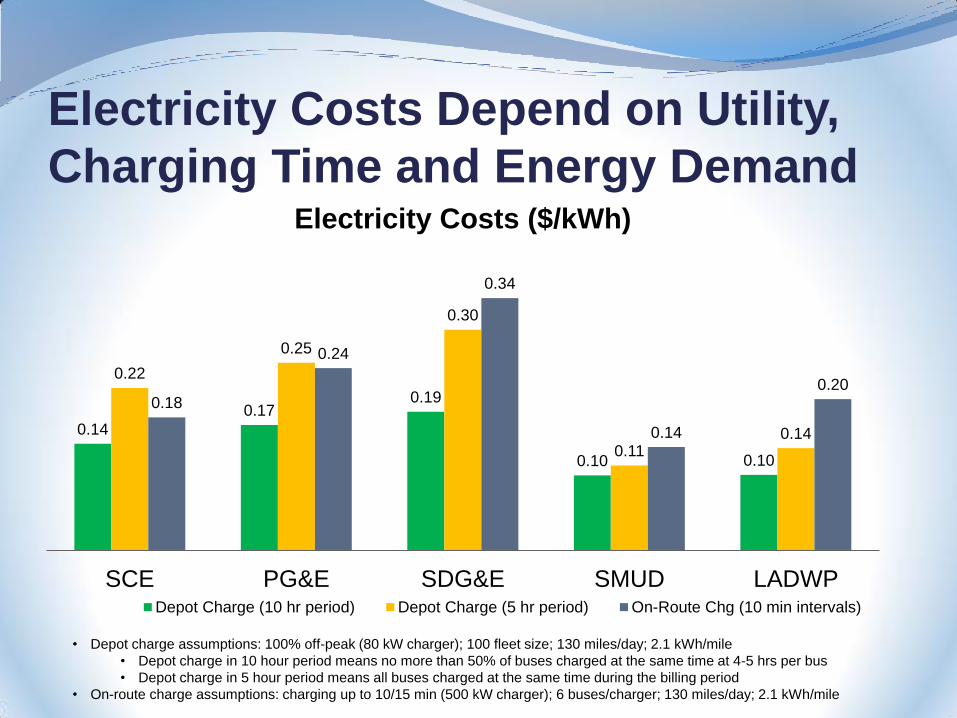
Electricity Costs Depend on Utility,
Charging Time and Energy Demand
0.14
0.17 0.19
0.10 0.10
0.22
0.25
0.30
0.11 0.14
0.18
0.24
0.34
0.14
0.20
SCE PG&E SDG&E SMUD LADWP
Electricity Costs ($/kWh)
Depot Charge (10 hr period) Depot Charge (5 hr period) On-Route Chg (10 min intervals)
• Depot charge assumptions: 100% off-peak (80 kW charger); 100 fleet size; 130 miles/day; 2.1 kWh/mile
• Depot charge in 10 hour period means no more than 50% of buses charged at the same time at 4-5 hrs per bus
• Depot charge in 5 hour period means all buses charged at the same time during the billing period
• On-route charge assumptions: charging up to 10/15 min (500 kW charger); 6 buses/charger; 130 miles/day; 2.1 kWh/mile
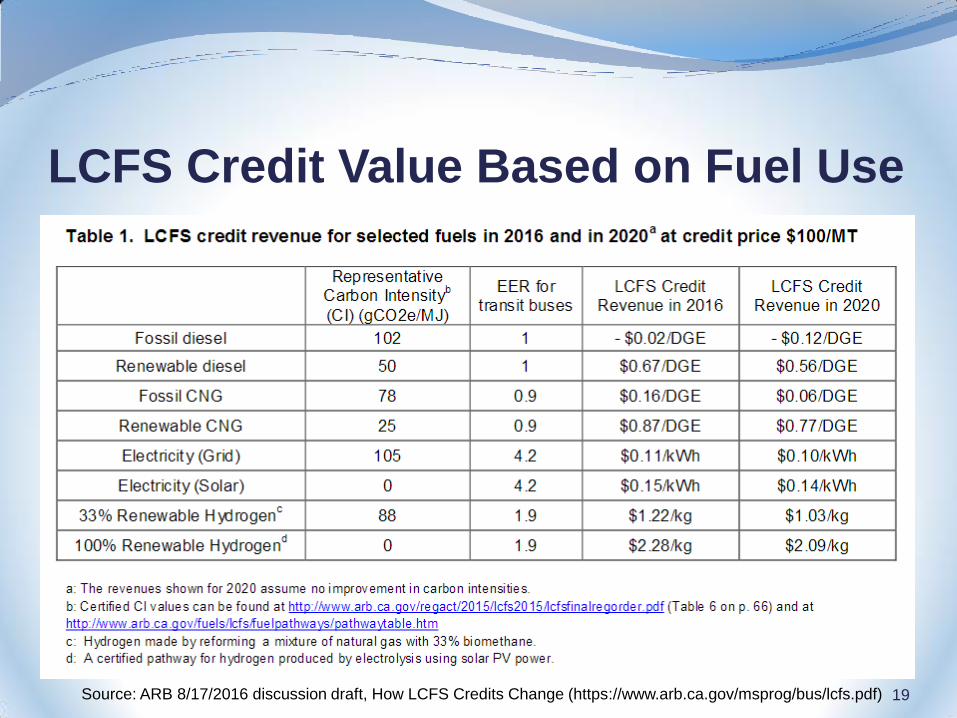
LCFS Credit Value Based on Fuel Use
19 Source: ARB 8/17/2016 discussion draft, How LCFS Credits Change (https://www.arb.ca.gov/msprog/bus/lcfs.pdf)
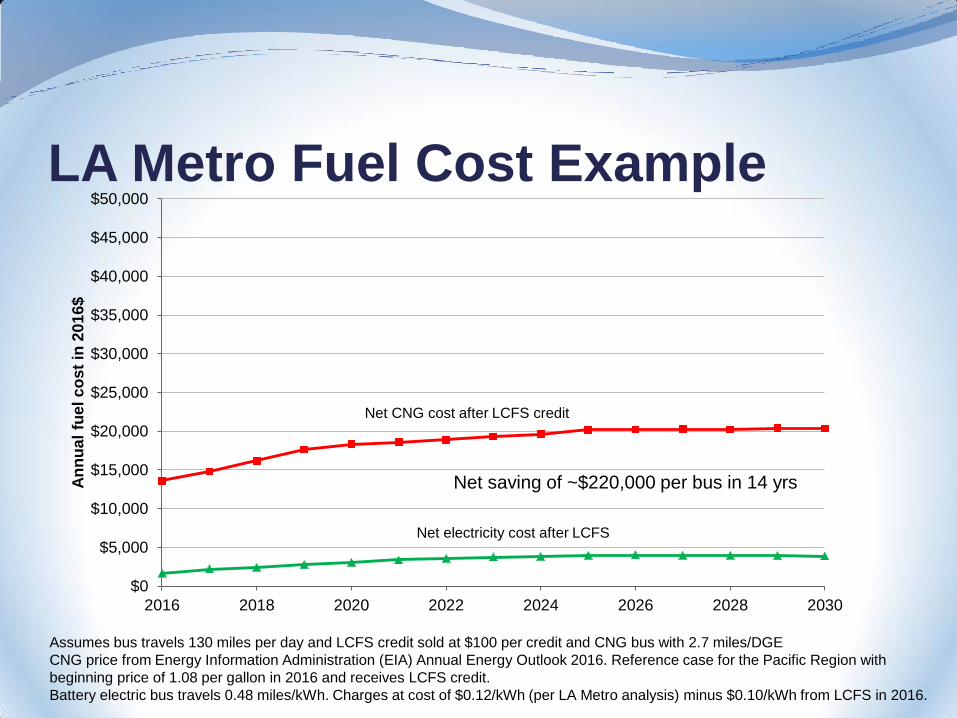
LA Metro Fuel Cost Example
$0
$5,000
$10,000
$15,000
$20,000
$25,000
$30,000
$35,000
$40,000
$45,000
$50,000
2016 2018 2020 2022 2024 2026 2028 2030
An
nu
al
fue
l c
ost
in 2
01
6$
Net electricity cost after LCFS
Net CNG cost after LCFS credit
Assumes bus travels 130 miles per day and LCFS credit sold at $100 per credit and CNG bus with 2.7 miles/DGE
CNG price from Energy Information Administration (EIA) Annual Energy Outlook 2016. Reference case for the Pacific Region with
beginning price of 1.08 per gallon in 2016 and receives LCFS credit.
Battery electric bus travels 0.48 miles/kWh. Charges at cost of $0.12/kWh (per LA Metro analysis) minus $0.10/kWh from LCFS in 2016.
Net saving of ~$220,000 per bus in 14 yrs
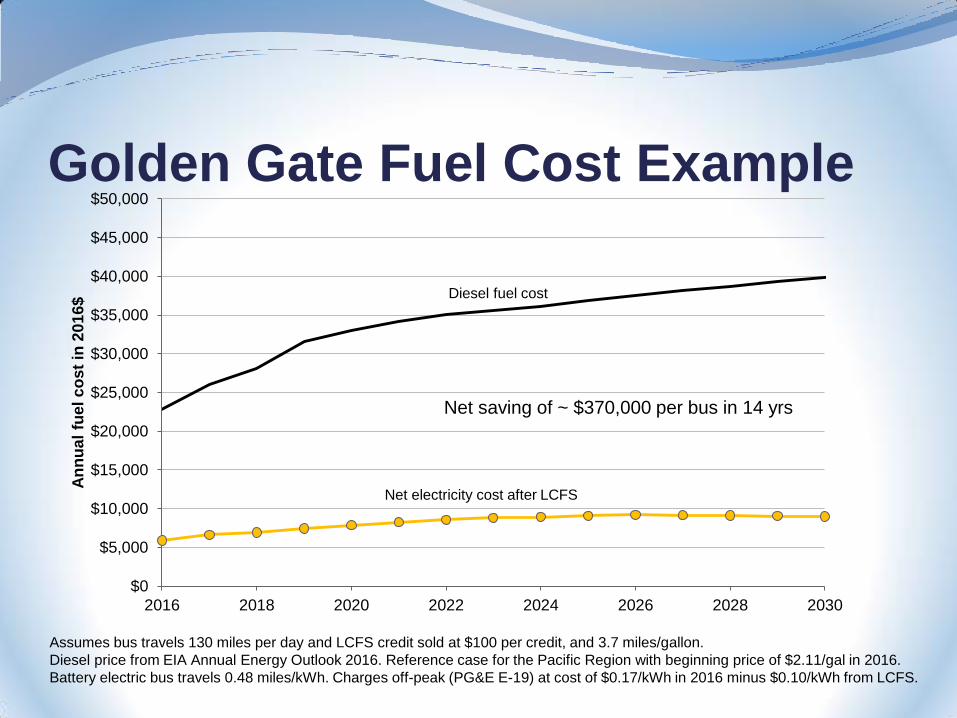
Golden Gate Fuel Cost Example
Assumes bus travels 130 miles per day and LCFS credit sold at $100 per credit, and 3.7 miles/gallon.
Diesel price from EIA Annual Energy Outlook 2016. Reference case for the Pacific Region with beginning price of $2.11/gal in 2016.
Battery electric bus travels 0.48 miles/kWh. Charges off-peak (PG&E E-19) at cost of $0.17/kWh in 2016 minus $0.10/kWh from LCFS.
$0
$5,000
$10,000
$15,000
$20,000
$25,000
$30,000
$35,000
$40,000
$45,000
$50,000
2016 2018 2020 2022 2024 2026 2028 2030
An
nu
al
fue
l c
ost
in 2
01
6$
Net saving of ~ $370,000 per bus in 14 yrs
Net electricity cost after LCFS
Diesel fuel cost
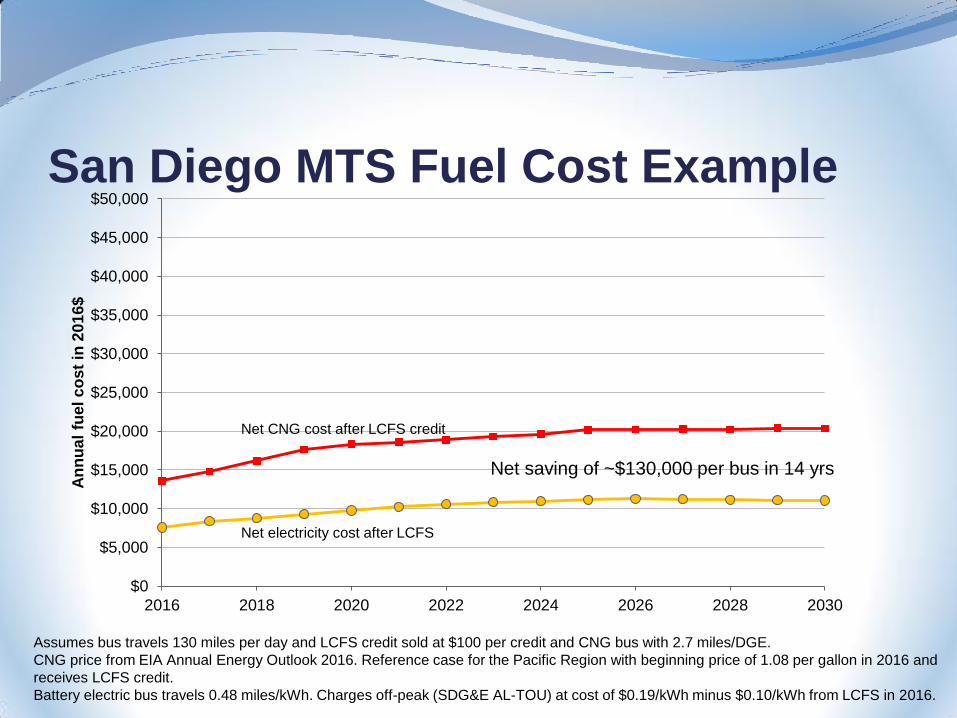
San Diego MTS Fuel Cost Example
$0
$5,000
$10,000
$15,000
$20,000
$25,000
$30,000
$35,000
$40,000
$45,000
$50,000
2016 2018 2020 2022 2024 2026 2028 2030
An
nu
al
fue
l c
ost
in 2
01
6$
Net electricity cost after LCFS
Net CNG cost after LCFS credit
Assumes bus travels 130 miles per day and LCFS credit sold at $100 per credit and CNG bus with 2.7 miles/DGE.
CNG price from EIA Annual Energy Outlook 2016. Reference case for the Pacific Region with beginning price of 1.08 per gallon in 2016 and
receives LCFS credit.
Battery electric bus travels 0.48 miles/kWh. Charges off-peak (SDG&E AL-TOU) at cost of $0.19/kWh minus $0.10/kWh from LCFS in 2016.
Net saving of ~$130,000 per bus in 14 yrs
Other Costs Diesel/CNG to BEB
Install shop charger, and software for diagnosis
Maintenance bay bus roof top access (diesel)
Technician training
Hybrid to BEB No changes needed for maintenance bay
Minimal technician training
Driver training (~4 hours per driver)
Off-ramps or other mechanism to address technological or operation barriers
23
24
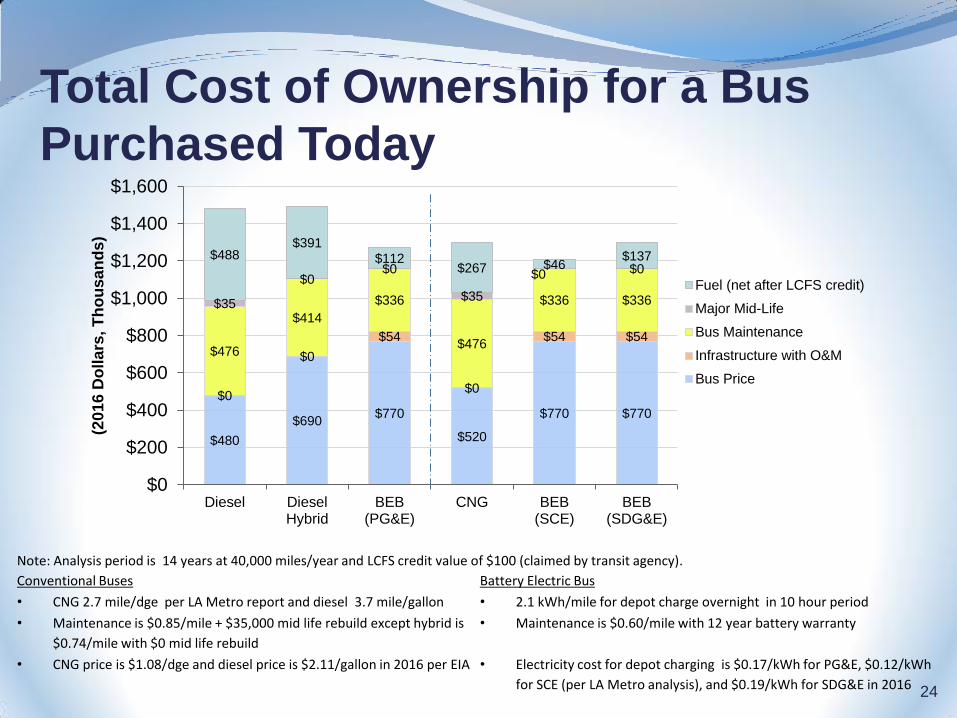
Total Cost of Ownership for a Bus
Purchased Today
$480
$690 $770
$520
$770 $770
$0
$0
$54
$0
$54 $54 $476
$414
$336
$476
$336 $336 $35
$0 $0
$35
$0 $0 $488
$391
$112 $267 $46
$137
$0
$200
$400
$600
$800
$1,000
$1,200
$1,400
$1,600
Diesel DieselHybrid
BEB(PG&E)
CNG BEB(SCE)
BEB(SDG&E)
(20
16
Do
lla
rs, T
ho
us
an
ds)
Fuel (net after LCFS credit)
Major Mid-Life
Bus Maintenance
Infrastructure with O&M
Bus Price
Note: Analysis period is 14 years at 40,000 miles/year and LCFS credit value of $100 (claimed by transit agency).
Conventional Buses Battery Electric Bus
• CNG 2.7 mile/dge per LA Metro report and diesel 3.7 mile/gallon • 2.1 kWh/mile for depot charge overnight in 10 hour period
• Maintenance is $0.85/mile + $35,000 mid life rebuild except hybrid is
$0.74/mile with $0 mid life rebuild
• Maintenance is $0.60/mile with 12 year battery warranty
• CNG price is $1.08/dge and diesel price is $2.11/gallon in 2016 per EIA • Electricity cost for depot charging is $0.17/kWh for PG&E, $0.12/kWh
for SCE (per LA Metro analysis), and $0.19/kWh for SDG&E in 2016
25
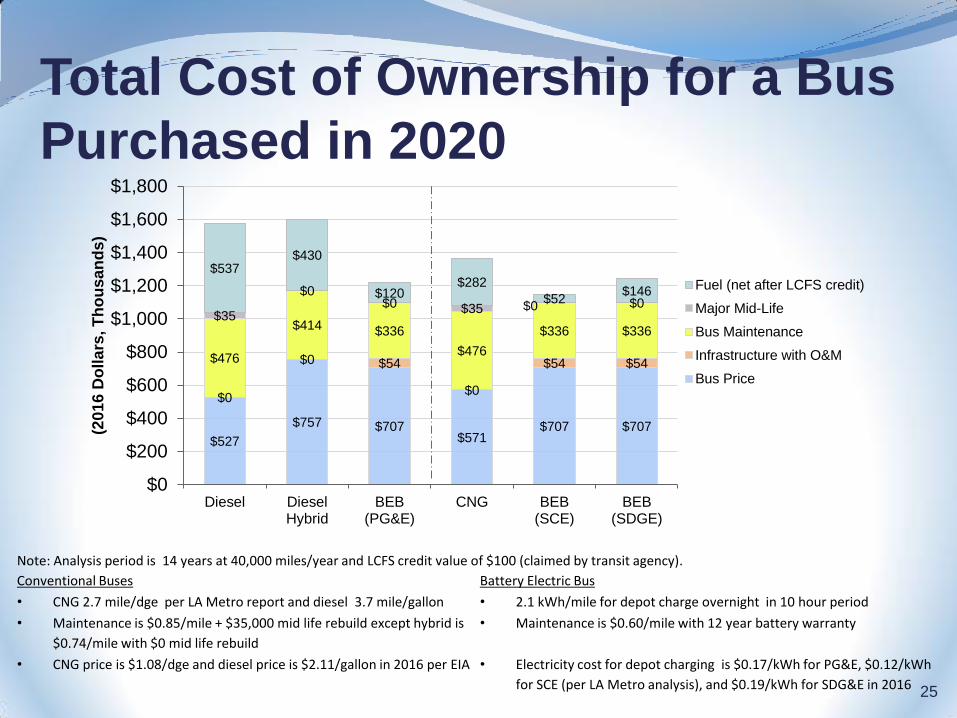
Total Cost of Ownership for a Bus
Purchased in 2020
$527
$757 $707 $571
$707 $707
$0
$0 $54
$0
$54 $54 $476
$414 $336
$476
$336 $336 $35
$0 $0 $35 $0 $0
$537 $430
$120 $282
$52 $146
$0
$200
$400
$600
$800
$1,000
$1,200
$1,400
$1,600
$1,800
Diesel DieselHybrid
BEB(PG&E)
CNG BEB(SCE)
BEB(SDGE)
(20
16
Do
lla
rs, T
ho
us
an
ds)
Fuel (net after LCFS credit)
Major Mid-Life
Bus Maintenance
Infrastructure with O&M
Bus Price
Note: Analysis period is 14 years at 40,000 miles/year and LCFS credit value of $100 (claimed by transit agency).
Conventional Buses Battery Electric Bus
• CNG 2.7 mile/dge per LA Metro report and diesel 3.7 mile/gallon • 2.1 kWh/mile for depot charge overnight in 10 hour period
• Maintenance is $0.85/mile + $35,000 mid life rebuild except hybrid is
$0.74/mile with $0 mid life rebuild
• Maintenance is $0.60/mile with 12 year battery warranty
• CNG price is $1.08/dge and diesel price is $2.11/gallon in 2016 per EIA • Electricity cost for depot charging is $0.17/kWh for PG&E, $0.12/kWh
for SCE (per LA Metro analysis), and $0.19/kWh for SDG&E in 2016
$0
$100,000
$200,000
$300,000
$400,000
$500,000
$600,000
$700,000
$800,000
$900,000
201
6
201
7
201
8
201
9
202
0
202
1
202
2
202
3
202
4
202
5
202
6
202
7
202
8
202
9
203
0
20
16
$
CNG
BEB (depot)
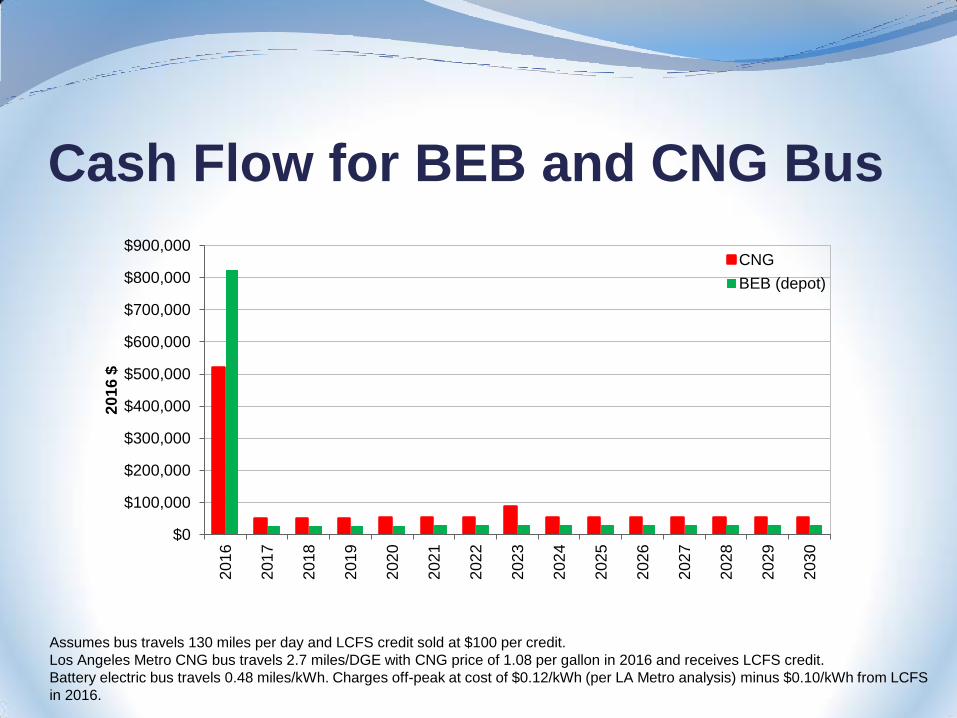
Cash Flow for BEB and CNG Bus
Assumes bus travels 130 miles per day and LCFS credit sold at $100 per credit.
Los Angeles Metro CNG bus travels 2.7 miles/DGE with CNG price of 1.08 per gallon in 2016 and receives LCFS credit.
Battery electric bus travels 0.48 miles/kWh. Charges off-peak at cost of $0.12/kWh (per LA Metro analysis) minus $0.10/kWh from LCFS
in 2016.
$0
$100,000
$200,000
$300,000
$400,000
$500,000
$600,000
$700,000
$800,000
$900,0002
01
6
201
7
201
8
201
9
202
0
202
1
202
2
202
3
202
4
202
5
202
6
202
7
202
8
202
9
203
0
20
16
$
Diesel
BEB (depot)
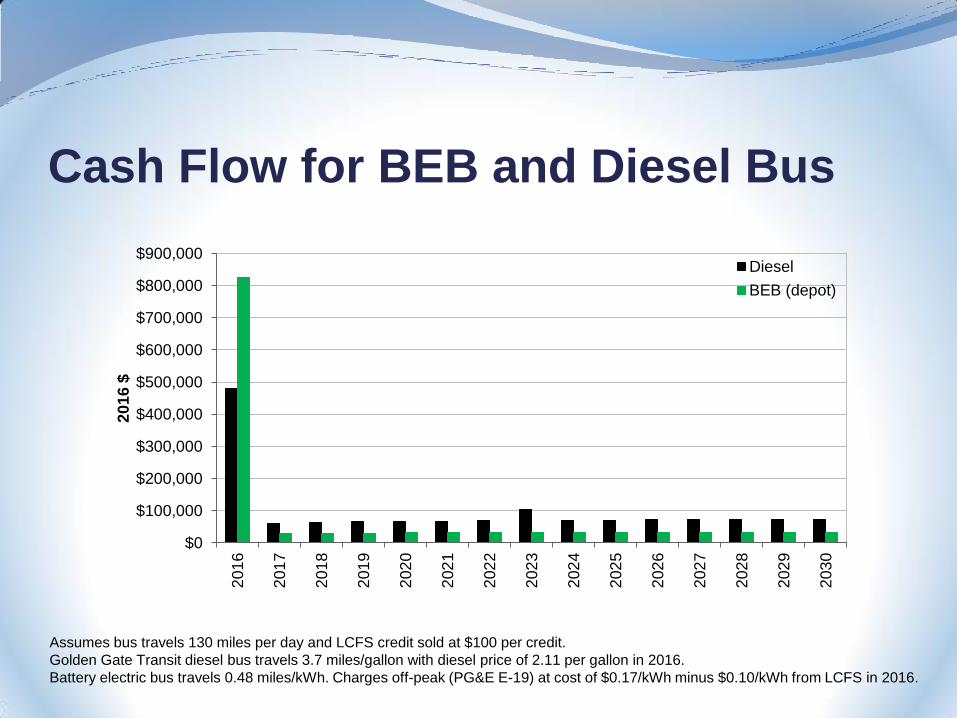
Cash Flow for BEB and Diesel Bus
Assumes bus travels 130 miles per day and LCFS credit sold at $100 per credit.
Golden Gate Transit diesel bus travels 3.7 miles/gallon with diesel price of 2.11 per gallon in 2016.
Battery electric bus travels 0.48 miles/kWh. Charges off-peak (PG&E E-19) at cost of $0.17/kWh minus $0.10/kWh from LCFS in 2016.
Proposed Fleet Case Studies Antelope Valley
Foothill transit
Victor Valley
LA Metro
San Diego
Orange County
Fairfield
Sacramento
28
Next Steps Publish ARB fleet cost model for comment
Update battery electric bus charging cost calculator
Meet with individual fleets
Discuss barriers, survey results, and cost information
Transit subcommittee meeting end of October