Embed Size (px)
Citation preview

Objective - To find the line of best fit for a given set of data in a scatter plot.
AnimalBrain
Weight (g)Max.
Life (yr.)
Mouse
Fox
J
0.450.4157
3.29.8
22 4
y
yrs.)
50
40
0 100 200 300 400 500 600
Jaguar
Sheep
Pig
Seal
Donkey
Chimp
157175180325419440
22.42027414050
x
Brain Weight (g)
Max
. Life
(y 30
20
10
y
yrs.)
50
40Trend is increasing
Scatterplot - a coordinategraph of data points.
0 100 200 300 400 500 600x
Brain Weight (g)
Max
. Life
(y 30
20
10Line of Best Fit-Points act like magnets attracting the line.
Trend looks linear
y
yrs.)
50
40Trend is increasing
Scatterplot - a coordinategraph of data points.
0 100 200 300 400 500 600x
Brain Weight (g)
Max
. Life
(y 30
20
10Line of Best Fit-Points act like magnets attracting the line.
Trend looks linear
y
yrs.)
50
40Trend is increasing
Scatterplot - a coordinategraph of data points.
0 100 200 300 400 500 600x
Brain Weight (g)
Max
. Life
(y 30
20
10Line of Best Fit-Points act like magnets attracting the line.
Trend looks linear
y
yrs.)
50
40Trend is increasing
Scatterplot - a coordinategraph of data points.
0 100 200 300 400 500 600x
Brain Weight (g)
Max
. Life
(y 30
20
10Line of Best Fit-Points act like magnets attracting the line.
Trend looks linear
y
yrs.)
50
40Trend is increasing
Scatterplot - a coordinategraph of data points.
0 100 200 300 400 500 600x
Brain Weight (g)
Max
. Life
(y 30
20
10Line of Best Fit-Points act like magnets attracting the line.
Trend looks linear
Lesson 4-4
Algebra Slide Show: Teaching Made Easy As Pi, by James Wenk © 2010
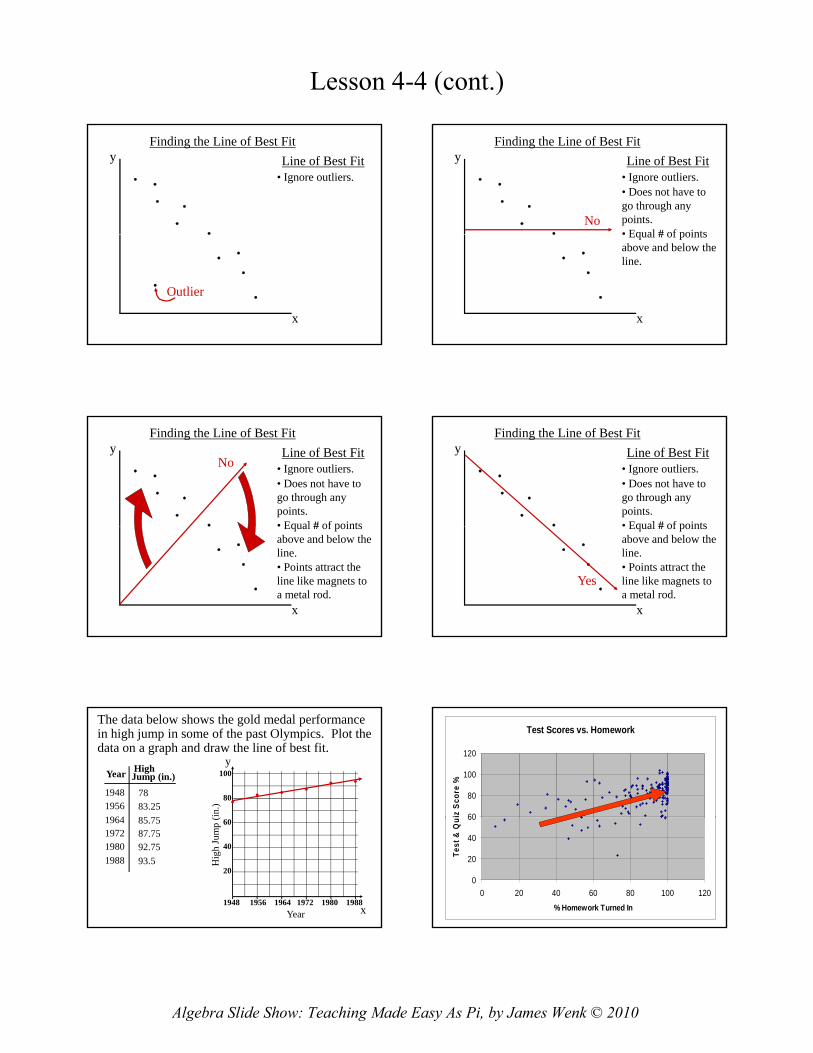
Finding the Line of Best Fity Line of Best Fit
• Ignore outliers.
Outlier
x
Finding the Line of Best Fity
No
Line of Best Fit
• Equal # of points
• Does not have to go through any points.
• Ignore outliers.
x
• Equal # of points above and below the line.
Finding the Line of Best Fity
NoLine of Best Fit
• Equal # of points
• Does not have to go through any points.
• Ignore outliers.
x
• Equal # of points above and below the line.• Points attract the line like magnets to a metal rod.
Finding the Line of Best Fity Line of Best Fit
• Equal # of points
• Does not have to go through any points.
• Ignore outliers.
x
Yes
• Equal # of points above and below the line.• Points attract the line like magnets to a metal rod.
The data below shows the gold medal performance in high jump in some of the past Olympics. Plot the data on a graph and draw the line of best fit.
Year HighJump (in.)
194819561964
7883.2585 75
y
(in.)
100
80
1964197219801988
85.7587.7592.7593.5
1948 1956 1964 1972 1980 1988xYear
Hig
h Ju
mp
( 60
40
20
Test Scores vs. Homework
60
80
100
120
iz S
core
%
0
20
40
60
0 20 40 60 80 100 120% Homework Turned In
Test
& Q
u
Lesson 4-4 (cont.)
Algebra Slide Show: Teaching Made Easy As Pi, by James Wenk © 2010

ScatterplotsWhich scatterplots below show a linear trend?
a) c) e)NegativeCorrelation
PositiveCorrelation
NoCorrelation
b) d) f)
ConstantCorrelation
NoCorrelation
NoCorrelation
Plot the data on the graph such that homework timeis on the y-axis and TV time is on the x-axis..
StudentTime SpentWatching TV
Time Spenton Homework
Sam
Jon
30 min.
45 min.
180 min.
150 min.
Lara
Darren
Megan
Pia
Crystal
120 min.
240 min.
90 min.
150 min.
180 min.
90 min.
30 min.
90 min.
90 min.
90 min.
Plot the data on the graph such that homework timeis on the y-axis and TV time is on the x-axis.
TV Homework
30 min.
45 min.
120 i
180 min.
150 min.
90 i n ork
240210180150120 min.
240 min.
90 min.
150 min.
180 min.
90 min.
30 min.
120 min.
120 min.
90 min.
Time Watching TV
Tim
e on
Hom
ewo
30 90 150 210 60 120 180 240
150120906030
Describe the relationship between time spent onhomework and time spent watching TV.
n ork
240210180150
Trend is decreasing.
Trend appears linear.
Time Watching TV
Tim
e on
Hom
ewo
30 90 150 210 60 120 180 240
150120906030
Negative correlation.
Time on TV ↑Time on HW ↓
State the type of correlation you would expect to see between the following.
1) The height of a candle and the number of hours it has been burning.
2) The grade received on a test and the number ofNegative correlation.
2) The grade received on a test and the number ofhomework problems completed.
3) The level of fuel in a gas tank of a vehicle andthe top speed of that vehicle.
Positive correlation.
No correlation.
Lesson 4-4 (cont.)
Algebra Slide Show: Teaching Made Easy As Pi, by James Wenk © 2010