Embed Size (px)
Citation preview
4 2016-17 BUDGET AND FORWARD ESTIMATES
Key Issues
The 2016-17 Budget delivers on the Government's commitment to return the Budget to surplus, three years ahead of the original target date of 2019-20, with the Net Operating Balance estimated to be in surplus by $77.3 million in 2016-17. Net Operating Balance surpluses are also expected to be achieved in 2017-18 and 2019-20.
Over the Budget and Forward Estimates period, expenditure growth has been constrained to a compound annual rate of 0.6 per cent (measured from the 2015-16 Estimated Outcome), below the expected annual revenue growth rate of 1.1 per cent over the same period and well below the long-run annual revenue growth rate of 4.6 per cent. Over the period from the actual Budget outcome in 2013-14 to the 2019-20 Forward Estimate, the average annual growth in expenditure is forecast to be 1.6 per cent.
The Budget position has been significantly impacted by both the loss of over $500 million in GST receipts over the Budget and Forward Estimates period and a write down in the level of Government Business returns from Hydro Tasmania.
In relation to Net Debt, whilst reducing over the Forward Estimates period, Net Cash and Investments remains positive reaching a level of $162 million as at 30 June 2020. This reflects the impact of estimated Net Operating Balance outcomes and infrastructure expenditure levels.
The Fiscal Balance is estimated to be a deficit of $160.6 million for 2016-17, with a projected improvement over the Forward Estimates period to achieve a small surplus of $17.4 million in 2019-20.
Total General Government expenses are anticipated to be $5 496.3 million in 2016-17, an increase of $130 million or 2.4 per cent above the 2015-16 budgeted expenses of $5 366.3 million.
2016-17 Budget and Forward Estimates 47
OVERVIEWThis chapter includes the General Government Sector Financial Statements for the 2016-17 Budget and Forward Estimates period and the Policy and Parameter Statement which reflects changes between the Budget and Forward Estimates reported in the 2015-16 Budget Papers and the 2016-17 Budget Papers.
The financial statements in this chapter have been prepared in accordance with the Uniform Presentation Framework (UPF). The statements present information for the 2015-16 Budget and for the 2016-17 Budget and Forward Estimates. Taxation information, required under the UPF, is provided in chapter 5 of this Budget Paper.
In accordance with the UPF, the final end of year results for the General Government Sector will be available in the Treasurer's Annual Financial Report 2015-16, which will be publicly released by no later than 31 October 2016.
48 2016-17 Budget and Forward Estimates
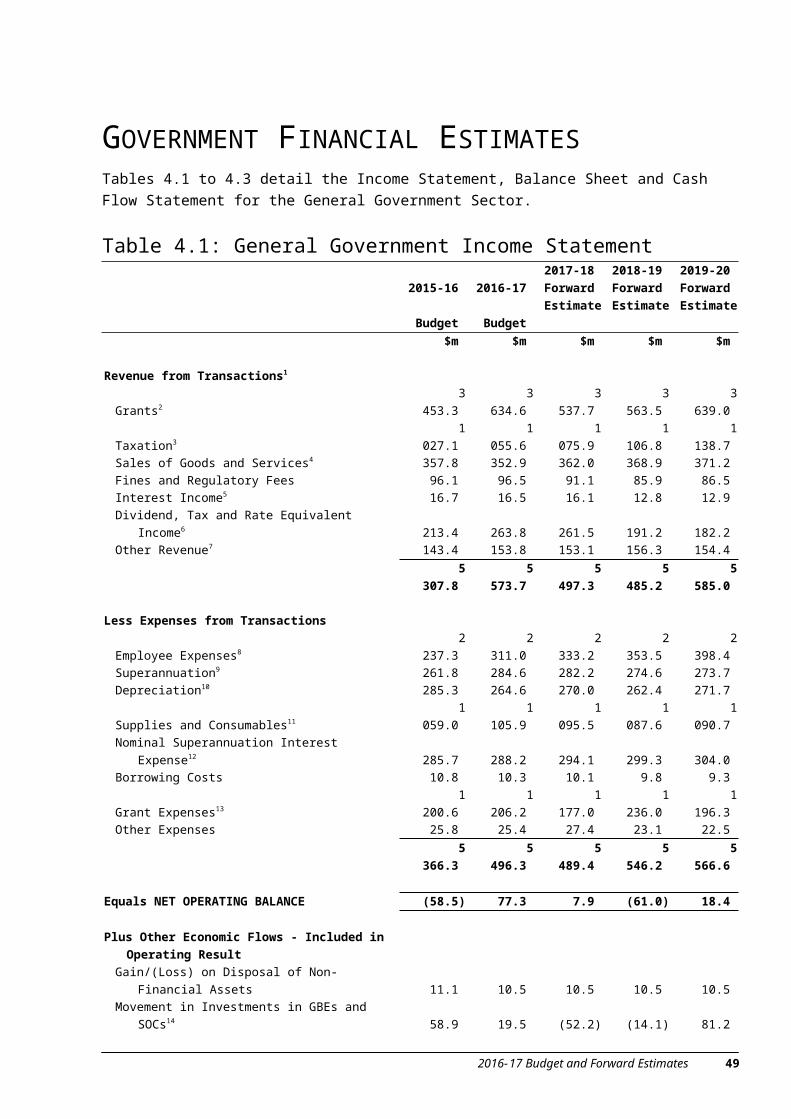
GOVERNMENT FINANCIAL ESTIMATESTables 4.1 to 4.3 detail the Income Statement, Balance Sheet and Cash Flow Statement for the General Government Sector.
Table 4.1: General Government Income Statement2015-16)
)Budget)
2016-17))
Budget)
2017-18)Forward)Estimate)
2018-19)Forward)Estimate)
2019-20)Forward)Estimate)
$m) $m) $m) $m) $m)
Revenue from Transactions1
Grants2 3 453.3) 3 634.6) 3 537.7) 3 563.5) 3 639.0)Taxation3 1 027.1) 1 055.6) 1 075.9) 1 106.8) 1 138.7)Sales of Goods and Services4 357.8) 352.9) 362.0) 368.9) 371.2)Fines and Regulatory Fees 96.1) 96.5) 91.1) 85.9) 86.5)Interest Income5 16.7) 16.5) 16.1) 12.8) 12.9)Dividend, Tax and Rate Equivalent Income6 213.4) 263.8) 261.5) 191.2) 182.2)Other Revenue7 143.4) 153.8) 153.1) 156.3) 154.4)
5 307.8) 5 573.7) 5 497.3) 5 485.2) 5 585.0)
Less Expenses from TransactionsEmployee Expenses8 2 237.3) 2 311.0) 2 333.2) 2 353.5) 2 398.4)Superannuation9 261.8) 284.6) 282.2) 274.6) 273.7)Depreciation10 285.3) 264.6) 270.0) 262.4) 271.7)Supplies and Consumables11 1 059.0) 1 105.9) 1 095.5) 1 087.6) 1 090.7)Nominal Superannuation Interest Expense12 285.7) 288.2) 294.1) 299.3) 304.0)Borrowing Costs 10.8) 10.3) 10.1) 9.8) 9.3)Grant Expenses13 1 200.6) 1 206.2) 1 177.0) 1 236.0) 1 196.3)Other Expenses 25.8) 25.4) 27.4) 23.1) 22.5)
5 366.3) 5 496.3) 5 489.4) 5 546.2) 5 566.6)
Equals NET OPERATING BALANCE (58.5) 77.3) 7.9) (61.0) 18.4)
Plus Other Economic Flows - Included in Operating ResultGain/(Loss) on Disposal of Non-Financial Assets 11.1) 10.5) 10.5) 10.5) 10.5)Movement in Investments in GBEs and SOCs14 58.9) 19.5) (52.2) (14.1) 81.2)Other Gains/(Losses) (33.9) (21.2) 3.4) (6.3) (12.6)
36.2) 8.8) (38.3) (9.9) 79.2)
Equals Operating Result (22.4) 86.1) (30.4) (70.8) 97.6)
Table 4.1: General Government Income Statement (continued)2015-16)
)Budget)
2016-17))
Budget)
2017-18)Forward)Estimate)
2018-19)Forward)Estimate)
2019-20)Forward)Estimate)
$m) $m) $m) $m) $m)
Plus Other Economic Flows - Other Movements in EquityRevaluations of Non-Financial Assets 290.1) 252.3) 277.1) 297.3) 328.1)
2016-17 Budget and Forward Estimates 49
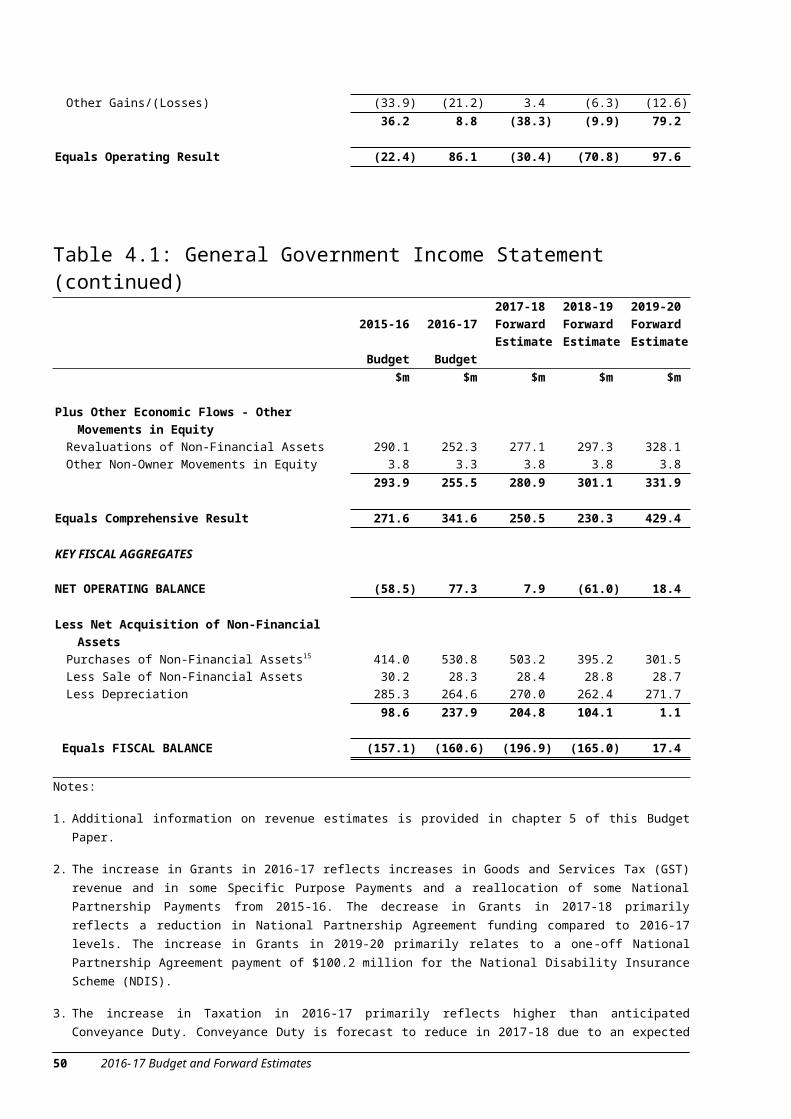
Other Non-Owner Movements in Equity 3.8) 3.3) 3.8) 3.8) 3.8) 293.9) 255.5) 280.9) 301.1) 331.9)
Equals Comprehensive Result 271.6) 341.6) 250.5) 230.3) 429.4)
KEY FISCAL AGGREGATES
NET OPERATING BALANCE (58.5) 77.3) 7.9) (61.0) 18.4)
Less Net Acquisition of Non-Financial AssetsPurchases of Non-Financial Assets15 414.0) 530.8) 503.2) 395.2) 301.5)Less Sale of Non-Financial Assets 30.2) 28.3) 28.4) 28.8) 28.7)Less Depreciation 285.3) 264.6) 270.0) 262.4) 271.7)
98.6) 237.9) 204.8) 104.1) 1.1)
Equals FISCAL BALANCE (157.1) (160.6) (196.9) (165.0) 17.4)
Notes:
1. Additional information on revenue estimates is provided in chapter 5 of this Budget Paper.
2. The increase in Grants in 2016-17 reflects increases in Goods and Services Tax (GST) revenue and in some Specific Purpose Payments and a reallocation of some National Partnership Payments from 2015-16. The decrease in Grants in 2017-18 primarily reflects a reduction in National Partnership Agreement funding compared to 2016-17 levels. The increase in Grants in 2019-20 primarily relates to a one-off National Partnership Agreement payment of $100.2 million for the National Disability Insurance Scheme (NDIS).
3. The increase in Taxation in 2016-17 primarily reflects higher than anticipated Conveyance Duty. Conveyance Duty is forecast to reduce in 2017-18 due to an expected return to trend, and increase again from 2018-19. The movement in Taxation from 2018-19 reflects increases in revenue estimates for Payroll Tax, Land Tax and Motor Vehicle Tax.
4. The decrease in Sales of Goods and Services in 2016-17 primarily reflects a reclassification of Health and Human Services Sales of Goods and Services to Other Revenue. The increase in Sales and Goods and Services over the Forward Estimates primarily reflects an increase in Tasmanian Health Service Own Source revenue.
5. The decrease in Interest Income in 2016-17 primarily reflects reduced cash held compared to 2015-16 and a reduction in interest rates.
6. The increase in Dividend, Tax and Rate Equivalent Income in 2016-17 primarily reflects the receipt from TT-Line Company Pty Ltd of $40 million in special dividends in 2016-17 and a $20.4 million increase in Income Tax Equivalents compared to 2015-16, which is partially offset by a decrease in estimated Hydro Tasmania Dividends of $13.6 million compared with 2015-16. The decrease in 2018-19 reflects an estimated reduction in Dividends primarily relating to a reduction in estimated dividends from Tasmanian Networks Pty Ltd and the Motor Accident Insurance Board. Further details are provided in chapter 5 of this Budget Paper.
7. The increase in Other Revenue in 2016-17 primarily reflects updates to revenue estimates by the Department of Health and Human Services to reflect reclassification from Sale of Goods and Services to Other Revenue, and a reclassification by the Department of Education to align with actual revenue. These movements are offset by a decrease in estimated Mineral Royalty Revenues of approximately $8.4 million compared with 2015-16.
50 2016-17 Budget and Forward Estimates

8. The increase in Employee Expenses in 2016-17 primarily relates to $32 million in expenditure associated with an increase in Australian Government Activity based funding, Block funding and National Partnership Agreements for the Department of Health and Human Services and a reclassification of $16.5 million from Supplies and Consumables by the Department of Education to align with actual increased employee expenditure as part of the implementation of the Students First Reform. The increase in 2019-20 primarily relates to an increase of $28 million in Activity based funding and Block funding for the Department of Health, and a $16.5 million reclassification from Supplies and Consumables by the Department of Education to align with actual increased employee expenditure.
9. The movement in Superannuation reflects revised actuarial assessment for the defined benefit schemes and agency expenditure estimates for accumulation scheme members.
10. The increase in Depreciation for 2017-18 primarily relates to an increase in road infrastructure depreciation of $1.9 million for the Department of State Growth, and an increase of $1.2 million for the Tasmanian Health Service for short life items. The decrease in 2018-19 relates to a reduction in the purchases of short life items by the THS from 2016-17. The increase of $9 million in 2019-20 primarily reflects an increase of $8 million for the Royal Hobart Hospital following the contracted completion date of the redevelopment in 2018-19.
11. The increase in Supplies and Consumables in 2016-17 primarily reflects $25.7 million of road expenditure reclassified by the Department of State Growth from capital to maintenance following a review to better align its expenditure projections with current experience. This change is partially offset by a decrease in the Department of Education following a reclassification of $16.5 million primarily relating to Employee expenses.
12. The increase in Nominal Superannuation Interest Expense in 2016-17 reflects the revised actuarial assessment for the defined benefit schemes.
13. The increase in Grant Expenses in 2016-17 of $5.6 million primarily relates to the funding profile for the National Disability SPP that has been amended following the ratification of the Bilateral Agreement for the Transition to the NDIS. The movements over the Forward Estimates broadly relate to changes made to reflect the terms of the Bilateral Agreement with the Australian Government.
14. The decrease in the Movement in Investments in GBEs and SOCs in 2016-17 of $39.4 million reflects changes in the net assets of the PNFC and PFC Sectors.
15. Additional information on agency 2016-17 Budget Infrastructure Investment is provided in chapter 6 of this Budget Paper.
2016-17 Budget and Forward Estimates 51

Table 4.2: General Government Balance Sheet as at 30 June2016)
Budget)
2017)
Budget)
2018)Forward)Estimate)
2019)Forward)Estimate)
2020)Forward)Estimate)
$m) $m) $m) $m) $m)
AssetsFinancial Assets
Cash and Deposits 889.3) 880.8) 769.5) 768.8) 773.1)Investments 64.5) 54.2) 56.2) 58.3) 60.4)Equity Investment in PNFC & PFC Sectors 4 515.0) 4 482.8) 4 474.1) 4 500.8) 4 586.5)Other Equity Investments 20.0) 27.4) 31.4) 33.4) 34.0)Receivables 331.5) 316.6) 315.3) 311.2) 306.3)Other Financial Assets1 661.4) 847.0) 861.3) 882.5) 897.1)
6 481.7) 6 608.9) 6 507.8) 6 555.0) 6 657.4)
Non-Financial AssetsLand and Buildings2 5 969.2) 6 098.6) 6 412.6) 6 616.2) 6 698.5)Infrastructure 4 668.9) 4 779.3) 4 972.1) 5 186.3) 5 445.5)Plant and Equipment 253.5) 224.6) 204.5) 193.4) 188.2)Heritage and Cultural Assets 490.6) 502.4) 514.6) 526.9) 539.2)Investment Property 19.0) 3.0) 3.3) 3.6) 3.9)Intangibles 45.4) 51.8) 50.2) 48.7) 44.9)Assets Held for Sale 7.0) 4.7) 3.8) 3.1) 2.9)Other Non-Financial Assets 30.7) 31.5) 30.7) 30.2) 26.9)
11 484.2) 11 696.0) 12 191.8) 12 608.3) 12 950.1)
Total Assets 17 965.9) 18 304.9) 18 699.6) 19 163.3) 19 607.4)
LiabilitiesBorrowings3 701.3) 633.7) 651.6) 770.5) 671.4)Superannuation4 5 470.5) 6 345.5) 6 462.2) 6 564.4) 6 652.8)Employee Entitlements 549.9) 583.0) 589.3) 598.8) 621.5)Payables 108.4) 134.9) 136.4) 137.6) 139.7)Other Liabilities 376.6) 358.7) 360.5) 362.1) 362.6)
Total Liabilities 7 206.7) 8 055.7) 8 199.9) 8 433.3) 8 448.0)
NET ASSETS 10 759.2) 10 249.2) 10 499.7) 10 730.0) 11 159.4)
EquityAccumulated Funds 5 712.1) 5 293.3) 5 266.7) 5 199.7) 5 301.1)Asset Revaluation Reserve 5 047.1) 4 955.9) 5 233.0) 5 530.3) 5 858.3)
Total Equity 10 759.2) 10 249.2) 10 499.7) 10 730.0) 11 159.4)
52 2016-17 Budget and Forward Estimates

Table 4.2: General Government Balance Sheet as at 30 June (continued)2016)
Budget)
2017)
Budget)
2018)Forward)Estimate)
2019)Forward)Estimate)
2020)Forward)Estimate)
$m) $m) $m) $m) $m)
NET WORTH5 10 759.2) 10 249.2) 10 499.7) 10 730.0) 11 159.4)
NET FINANCIAL WORTH6 (725.0) (1 446.7) (1 692.1) (1 878.3) (1 790.6)
NET FINANCIAL LIABILITIES7 5 240.0) 5 929.6) 6 166.2) 6 379.1) 6 377.1)
NET DEBT8 (252.6) (301.3) (174.1) (56.6) (162.0)
Notes:
1. The increase in Other Financial Assets over the Budget and Forward Estimates period primarily reflects revised income tax equivalent estimates and the impact of actual 2015 balances.
2. The increase in Land and Buildings in 2018 primarily reflects anticipated expenditure on the Royal Hobart Hospital Redevelopment Project.
3. The estimated Borrowings of $633.7 million as at 30 June 2017 includes an estimated end of year borrowing of $417.7 million to be undertaken on 30 June 2017. The end of year borrowing has no impact on the Government's Net Debt as the same amount will be borrowed and invested overnight on 30 June with the Tasmanian Public Finance Corporation, grossing up the amount of cash held and borrowings. Borrowings in 2017 and over the Forward Estimates period are higher compared to those published in the 2015-16 Budget. This increase is primarily due to a deterioration in the estimated Consolidated Fund position from 2016-17 onwards compared with the 2015-16 Budget, largely due to a write down in GST receipts.
4. The increase in Superannuation reflects the latest actuarial assessment of the defined benefit schemes.
5. Net Worth represents Total Assets less Total Liabilities.
6. Net Financial Worth represents Financial Assets less Total Liabilities.
7. Net Financial Liabilities represents Total Liabilities less Financial Assets, excluding Equity Investment in PNFC & PFC Sectors.
8. Net Debt represents Borrowings less the sum of Cash and Deposits and Investments.
2016-17 Budget and Forward Estimates 53
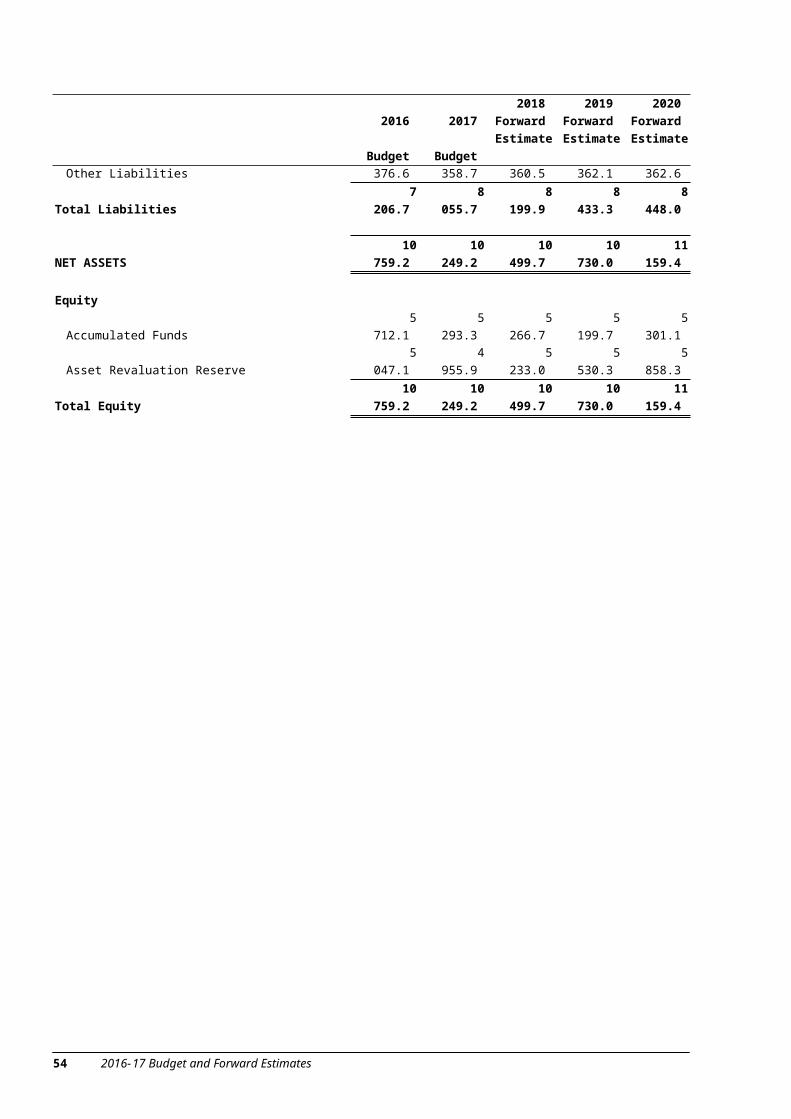
Table 4.3: General Government Cash Flow Statement2015-16)
)Budget)
2016-17))
Budget)
2017-18)Forward)Estimate)
2018-19)Forward)Estimate)
2019-20)Forward)Estimate)
$m) $m) $m) $m) $m)
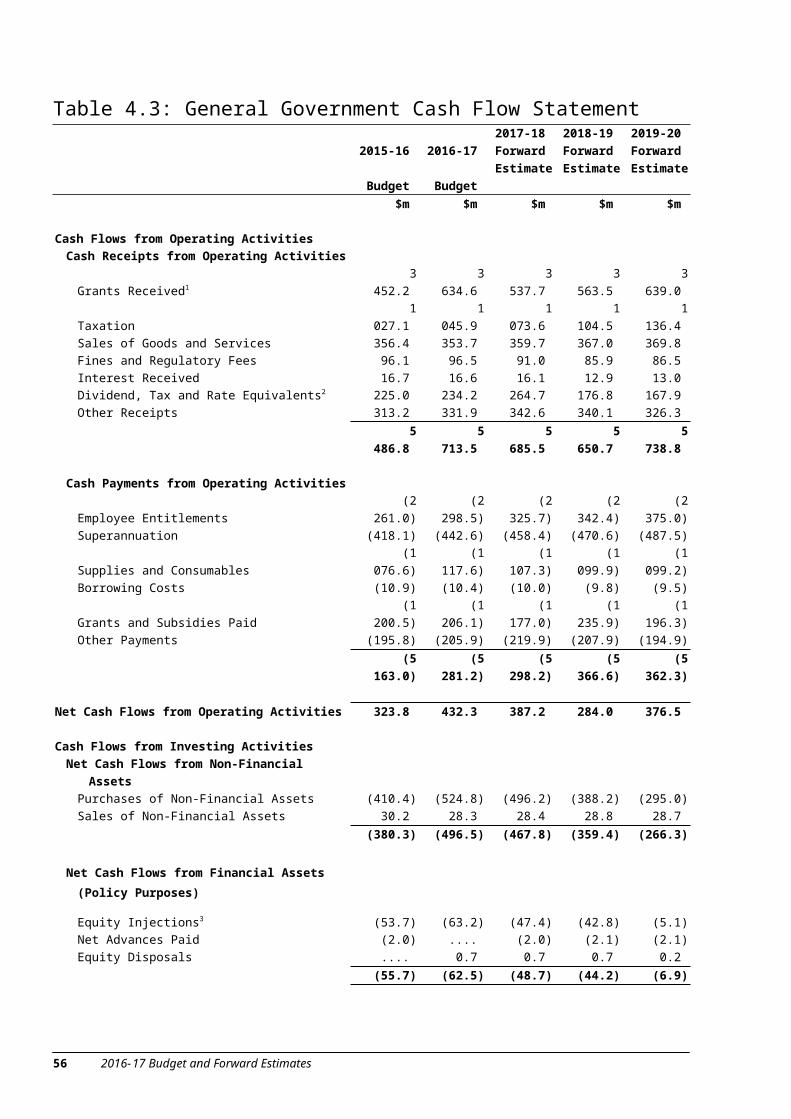
Cash Flows from Operating ActivitiesCash Receipts from Operating Activities
Grants Received1 3 452.2) 3 634.6) 3 537.7) 3 563.5) 3 639.0)Taxation 1 027.1) 1 045.9) 1 073.6) 1 104.5) 1 136.4)Sales of Goods and Services 356.4) 353.7) 359.7) 367.0) 369.8)Fines and Regulatory Fees 96.1) 96.5) 91.0) 85.9) 86.5)Interest Received 16.7) 16.6) 16.1) 12.9) 13.0)Dividend, Tax and Rate Equivalents2 225.0) 234.2) 264.7) 176.8) 167.9)Other Receipts 313.2) 331.9) 342.6) 340.1) 326.3)
5 486.8) 5 713.5) 5 685.5) 5 650.7) 5 738.8)
Cash Payments from Operating ActivitiesEmployee Entitlements (2 261.0) (2 298.5) (2 325.7) (2 342.4) (2 375.0)Superannuation (418.1) (442.6) (458.4) (470.6) (487.5)Supplies and Consumables (1 076.6) (1 117.6) (1 107.3) (1 099.9) (1 099.2)Borrowing Costs (10.9) (10.4) (10.0) (9.8) (9.5)Grants and Subsidies Paid (1 200.5) (1 206.1) (1 177.0) (1 235.9) (1 196.3)Other Payments (195.8) (205.9) (219.9) (207.9) (194.9)
(5 163.0) (5 281.2) (5 298.2) (5 366.6) (5 362.3)
Net Cash Flows from Operating Activities 323.8) 432.3) 387.2) 284.0) 376.5)
Cash Flows from Investing ActivitiesNet Cash Flows from Non-Financial Assets
Purchases of Non-Financial Assets (410.4) (524.8) (496.2) (388.2) (295.0)Sales of Non-Financial Assets 30.2) 28.3) 28.4) 28.8) 28.7)
(380.3) (496.5) (467.8) (359.4) (266.3)
Net Cash Flows from Financial Assets (Policy Purposes)
Equity Injections3 (53.7) (63.2) (47.4) (42.8) (5.1)Net Advances Paid (2.0) ....) (2.0) (2.1) (2.1)Equity Disposals ....) 0.7) 0.7) 0.7) 0.2)
(55.7) (62.5) (48.7) (44.2) (6.9)
54 2016-17 Budget and Forward Estimates
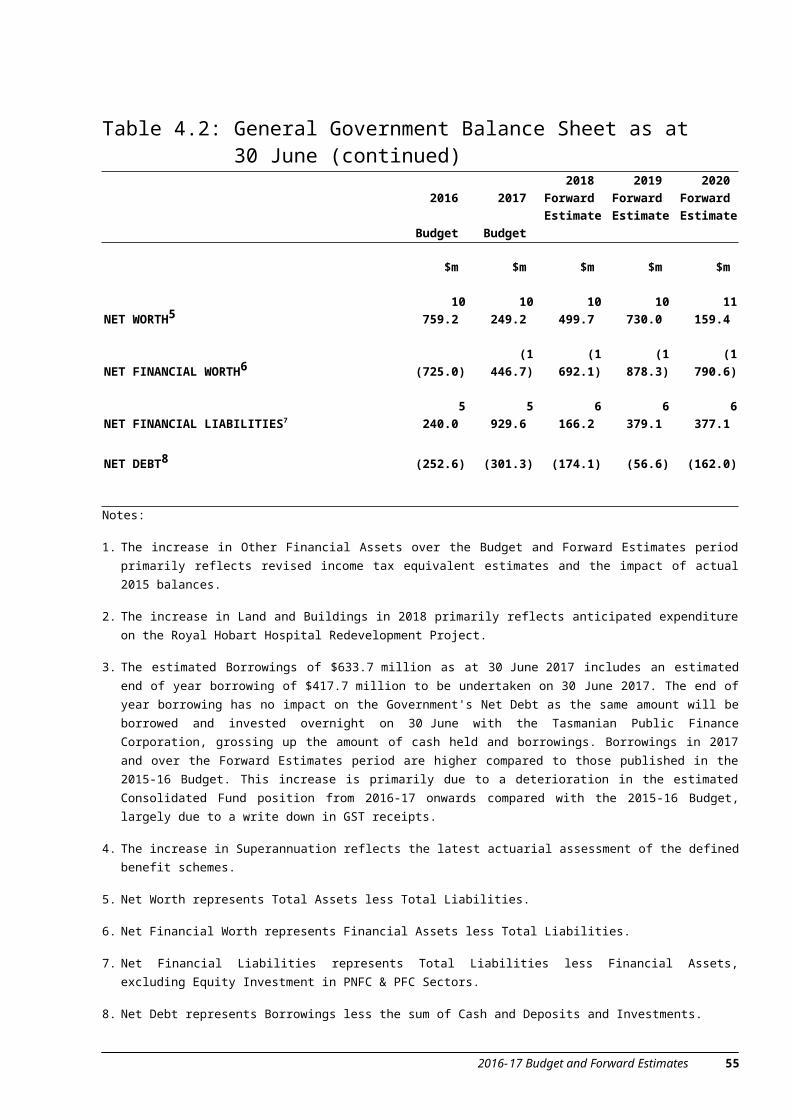
Table 4.3: General Government Cash Flow Statement (continued)2015-16)
)Budget)
2016-17))
Budget)
2017-18)Forward)Estimate)
2018-19)Forward)Estimate)
2019-20)Forward)Estimate)
$m) $m) $m) $m) $m)
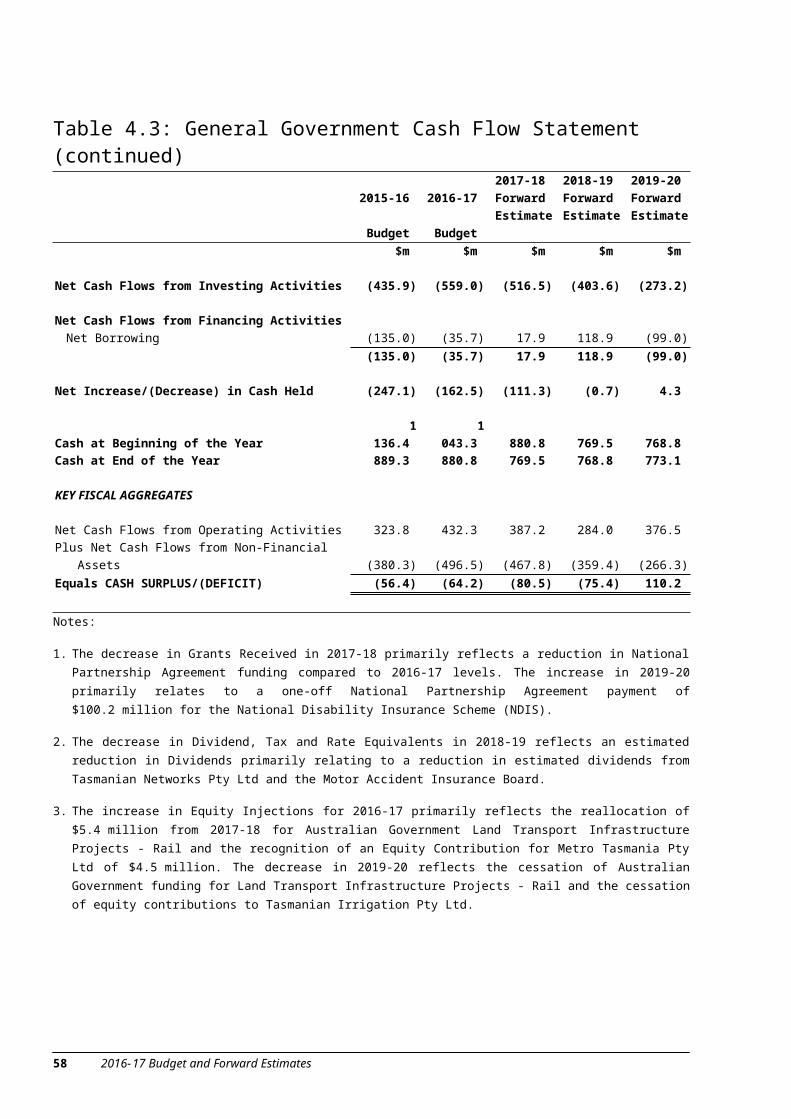
Net Cash Flows from Investing Activities (435.9) (559.0) (516.5) (403.6) (273.2)
Net Cash Flows from Financing ActivitiesNet Borrowing (135.0) (35.7) 17.9) 118.9) (99.0)
(135.0) (35.7) 17.9) 118.9) (99.0)
Net Increase/(Decrease) in Cash Held (247.1) (162.5) (111.3) (0.7) 4.3)
Cash at Beginning of the Year 1 136.4) 1 043.3) 880.8) 769.5) 768.8)Cash at End of the Year 889.3) 880.8) 769.5) 768.8) 773.1)
KEY FISCAL AGGREGATES
Net Cash Flows from Operating Activities 323.8) 432.3) 387.2) 284.0) 376.5)Plus Net Cash Flows from Non-Financial Assets (380.3) (496.5) (467.8) (359.4) (266.3)Equals CASH SURPLUS/(DEFICIT) (56.4) (64.2) (80.5) (75.4) 110.2)
Notes:
1. The decrease in Grants Received in 2017-18 primarily reflects a reduction in National Partnership Agreement funding compared to 2016-17 levels. The increase in 2019-20 primarily relates to a one-off National Partnership Agreement payment of $100.2 million for the National Disability Insurance Scheme (NDIS).
2. The decrease in Dividend, Tax and Rate Equivalents in 2018-19 reflects an estimated reduction in Dividends primarily relating to a reduction in estimated dividends from Tasmanian Networks Pty Ltd and the Motor Accident Insurance Board.
3. The increase in Equity Injections for 2016-17 primarily reflects the reallocation of $5.4 million from 2017-18 for Australian Government Land Transport Infrastructure Projects - Rail and the recognition of an Equity Contribution for Metro Tasmania Pty Ltd of $4.5 million. The decrease in 2019-20 reflects the cessation of Australian Government funding for Land Transport Infrastructure Projects - Rail and the cessation of equity contributions to Tasmanian Irrigation Pty Ltd.
2016-17 Budget and Forward Estimates 55
POLICY AND PARAMETER STATEMENT
Introduction The Policy and Parameter Statement (PPS) is a reconciliation of the major movements in the Net Operating Balance and the Fiscal Balance between two points in time. The movements reflect changes between the Budget and Forward Estimates reported in the 2015-16 Budget Papers and the 2016-17 Budget Papers.
The movements in the PPS are classified as revenue, expenses or net acquisition of non-financial assets and then further categorised as a policy or parameter change. The classification of a variation as a policy or parameter change is a matter of judgment and it is recognised there may be some instances where part of a Government initiative may have both policy and parameter components. In exercising judgement, Treasury aims to ensure that Government decisions are made transparent.
Policy Variation
For the purpose of the PPS, a policy variation reflects a specific decision by the Government that has an impact on the Budget and Forward Estimates and is related to a new policy or represents a change in the Government's existing policy position since the previous Budget. A decision to change a Budget or Forward Estimate aggregate, which is consistent with an existing policy, is not a policy decision.
Parameter Variation
A parameter variation reflects changes to the Budget and Forward Estimates due to the economic environment, the agency operating environment or the timing of a transaction.
Parameter variations will reflect the impact of changes in taxes, grants or other income that do not arise because of a Government decision and demand and cost variations in agency service delivery, including the provision of indexation. Variations resulting from the rollover of a new Forward Estimate year and changes in accounting policies, such as a change in an agency depreciation policy or the impact on estimates of a change in an Australian Accounting Standard are classified as parameter variations.
Table 4.4 provides a summary of the policy and parameter changes detailed in Table 4.5 that have impacted on the formulation of the 2016-17 Budget since the 2015-16 Budget.
Further Information
Additional information on revenue estimates is provided in chapter 5 of this Budget Paper. Additional information on agency expenditure estimates is included in the relevant agency chapters in Government Services Budget Paper No 2.
It should be noted that the estimates presented in the Policy and Parameter Statement were finalised prior to the release of the Australian Government's 2016-17 Budget. Therefore, the movements included for Specific Purpose Payments and some National Partnership Payments may differ from those calculated using published Australian Government 2016-17 Budget estimates.
56 2016-17 Budget and Forward Estimates
Table 4.4: Summary Policy and Parameter Statement, 2015-16 to 2019-20
2015-16)Estimated)Outcome)
2016-17))
Budget)
2017-18)Forward)Estimate)
2018-19)Forward)Estimate)
2019-20 Forward
Estimate1
$m) $m) $m) $m) $m
Forward Estimates (Net Operating Balance) as per the 2015-16 Budget (A)
(58.5) 101.5) 88.0) 182.4) ….
Forward Estimates (Fiscal Balance) as per the 2015-16 Budget (B)
(157.1) (127.0) (18.6) 106.9) ….
REVENUE
Policy Decisions(1.5) 38.4 49.4 19.9 20.4
Parameter Adjustments 47.4) 134.8) (38.4) (212.3) ….
TOTAL REVENUE VARIATIONS (C) 45.9) 173.2) 11.1) (192.4) ….
EXPENSES
Policy Decisions 56.2) 64.5) 56.0) 43.8) 47.7
Parameter Adjustments 21.5) 132.8) 35.2) 7.2) ….
TOTAL EXPENSE VARIATIONS (D) 77.7) 197.3) 91.2) 51.0) ….
NET OPERATING BALANCE (A+C-D)(90.3) 77.3) 7.9) (61.0) 18.4
Less NET ACQUISITION OF NON-FINANCIAL ASSETS
Purchases of Non-Financial Assets
Policy Decisions 15.3) 33.4) 49.1 69.7) 63.0
Parameter Adjustments(52.8) (54.6) 5.0 (99.3) ….
(37.5) (21.2) 54.1 (29.6) ….
Less Sale of Non-Financial Assets 4.7) (1.1) (1.6) (0.8) ….
2016-17 Budget and Forward Estimates 57
Less Depreciation - Total Parameter Adjustments (23.3) (29.5) (42.4) (57.3) ….
NET ACQUISITION OF NON-FINANCIAL ASSETS VARIATIONS (E)
(18.9) 9.4 98.2 28.5 ….
FISCAL BALANCE (B+C-D-E)(170.0) (160.6) (196.9) (165.0) 17.4
Note:
1. Parameter adjustments for 2019-20 are not reflected in the Table as the 2019-20 Forward Estimate was not published in the 2015-16 Budget. However, policy adjustments are reflected to show their full impact on the Budget and Forward Estimates.
58 2016-17 Budget and Forward Estimates
Table 4.5: Policy and Parameter Statement, 2015-16 to 2019-202015-16)
Estimated)Outcome)
2016-17)
Budget)
2017-18)Forward)Estimate)
2018-19)Forward)Estimate)
2019-20)Forward)Estimate1
$m) $m) $m) $m) $m)Forward Estimates (Net Operating Balance) as per the
2015-16 Budget (A) (58.5) 101.5) 88.0) 182.4) ....)Forward Estimates (Fiscal Balance) as per the 2015-16
Budget (B) (157.1) (127.0) (18.6) 106.9) ....)
Revenue from TransactionsPolicy Decisions
Criminal Conviction Levy (0.8) (0.8) (0.8) (0.8) (0.8)Insurance Duty2 ....) ....) 4.5 9.0 9.1 Motor Tax3 ....) ....) 5.7 11.7 12.1 Oyster Industry Support - Fee Waiver (0.7) (0.9) ....) ....) ....)Special Dividend ....) 40.0) 40.0) ....) ....)
Total Policy Decisions (1.5) 38.4) 49.4) 19.9) 20.4
Parameter AdjustmentsTaxation
Betting Exchange Taxes and Levies (0.2) ....) (0.1) (0.1) ....)Casino Tax and Licence Fees ....) (0.3) (0.8) (1.2) ....)Duties4 27.1) 18.9) 10.5) 10.0) ....)Guarantee Fees (2.1) 1.0 3.3 4.2 ....)Land Tax (1.3) (3.1) (3.3) (3.4) ....)Lottery Tax 0.8) 0.8) 0.7) 0.7) ....)Motor Taxation ....) (1.6) (2.1) (2.6) ....)Payroll Tax ....) (3.3) (3.9) (4.5) ....)State Fire Commission Operating Account .... 0.6 1.5 2.2 ....)Totalizator Wagering Levy ....) (0.1) (0.1) (0.1) ....)Vehicle Registration Fees 1.0) 1.0) 0.9) 0.8) ....)
Total Taxation 25.3) 13.9) 6.7) 6.0) ….)
Dividend, Tax and Rate Equivalent IncomeDividend income5
Aurora Energy Pty Ltd 7.5) 2.4) (2.5) (1.4) ....)Hydro Tasmania 11.4) (6.4) (26.7) (27.9) ....)Motor Accidents Insurance Board 3.9) 1.8) 1.1) 0.6) ....)Tasmanian Networks Pty Ltd 2.9) 1.3) 9.7) (9.3) ....)Tasmanian Ports Corporation Pty Ltd ....) ....) (1.8) ....) ....)Tasmanian Public Finance Corporation (1.6) 3.7) 2.6) 3.4) ....)The Public Trustee (0.1) (0.1) (0.1) (0.1) ....)
24.0) 2.8) (17.8) (34.7) ….)
2016-17 Budget and Forward Estimates 59
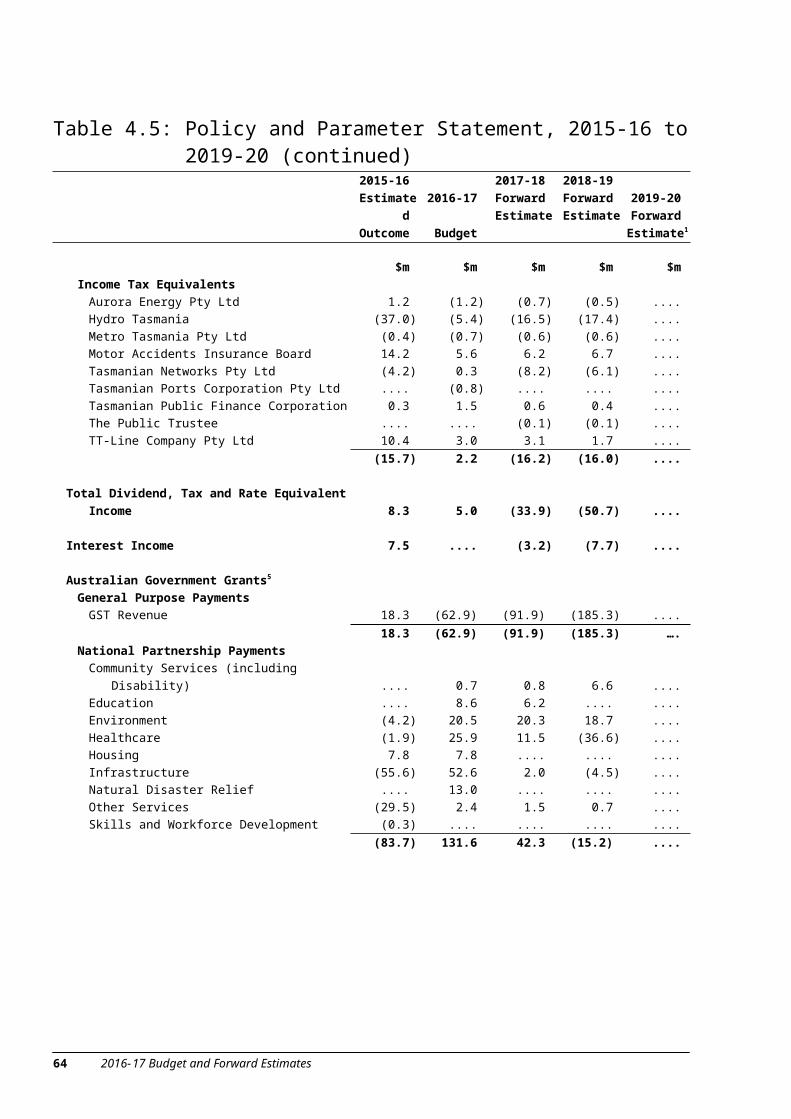
Table 4.5: Policy and Parameter Statement, 2015-16 to 2019-20 (continued)
2015-16)Estimated)Outcome)
2016-17)
Budget)
2017-18)Forward)Estimate)
2018-19)Forward)Estimate)
2019-20)Forward)Estimate1
$m) $m) $m) $m) $m)Income Tax Equivalents
Aurora Energy Pty Ltd 1.2 (1.2) (0.7) (0.5) ....)Hydro Tasmania (37.0) (5.4) (16.5) (17.4) ....)Metro Tasmania Pty Ltd (0.4) (0.7) (0.6) (0.6) ....)Motor Accidents Insurance Board 14.2) 5.6) 6.2 6.7 ....)Tasmanian Networks Pty Ltd (4.2) 0.3 (8.2) (6.1) ....)Tasmanian Ports Corporation Pty Ltd ....) (0.8) ....) ....) ....)Tasmanian Public Finance Corporation 0.3) 1.5) 0.6 0.4 ....)The Public Trustee ....) ....) (0.1) (0.1) ....)TT-Line Company Pty Ltd 10.4) 3.0) 3.1 1.7 ....)
(15.7) 2.2) (16.2) (16.0) ....)
Total Dividend, Tax and Rate Equivalent Income 8.3) 5.0) (33.9) (50.7) ....)
Interest Income 7.5) ....) (3.2) (7.7) ....)
Australian Government Grants5
General Purpose PaymentsGST Revenue 18.3) (62.9)) (91.9)) (185.3) ....)
18.3) (62.9)) (91.9)) (185.3) ….)National Partnership Payments
Community Services (including Disability) ....) 0.7) 0.8) 6.6 ....)Education ....) 8.6) 6.2) ....) ....)Environment (4.2) 20.5) 20.3) 18.7) ....)Healthcare (1.9) 25.9) 11.5) (36.6) ....)Housing 7.8) 7.8) ....) ....) ....)Infrastructure (55.6) 52.6) 2.0) (4.5) ....)Natural Disaster Relief ....) 13.0) ....) ....) ....)Other Services (29.5) 2.4) 1.5) 0.7) ....)Skills and Workforce Development (0.3) ....) ....) ....) ....)
(83.7) 131.6) 42.3) (15.2)) ....)
60 2016-17 Budget and Forward Estimates
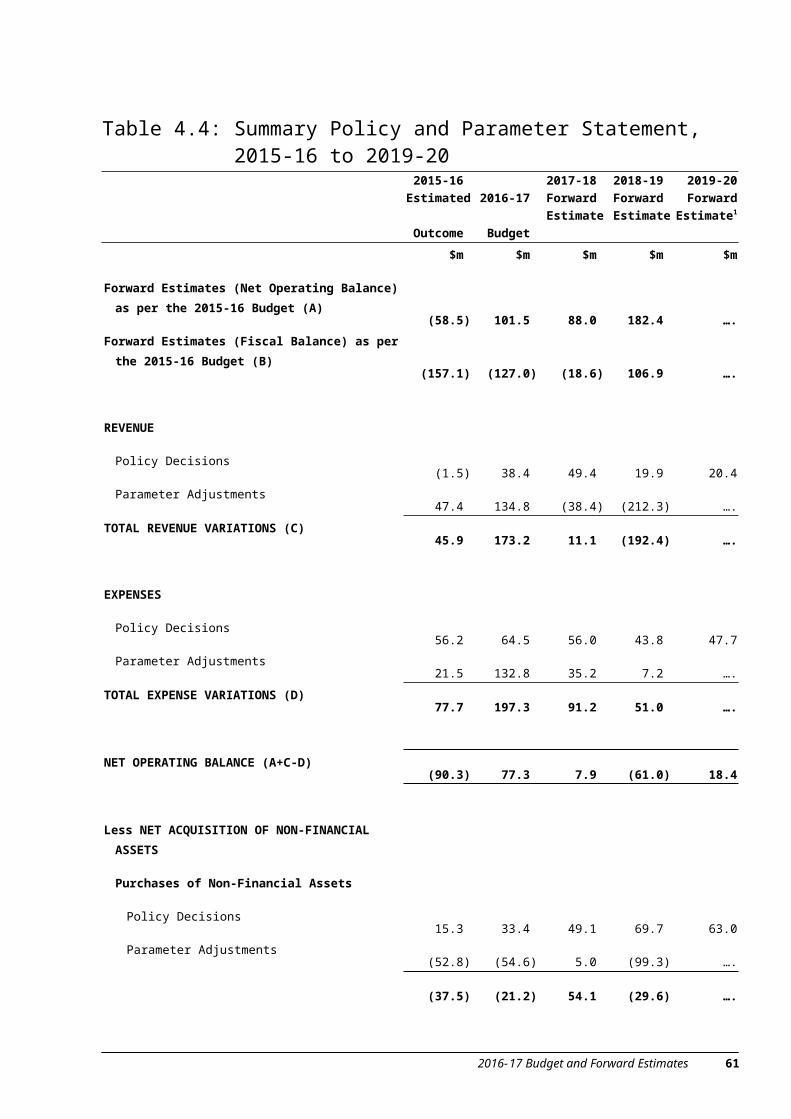
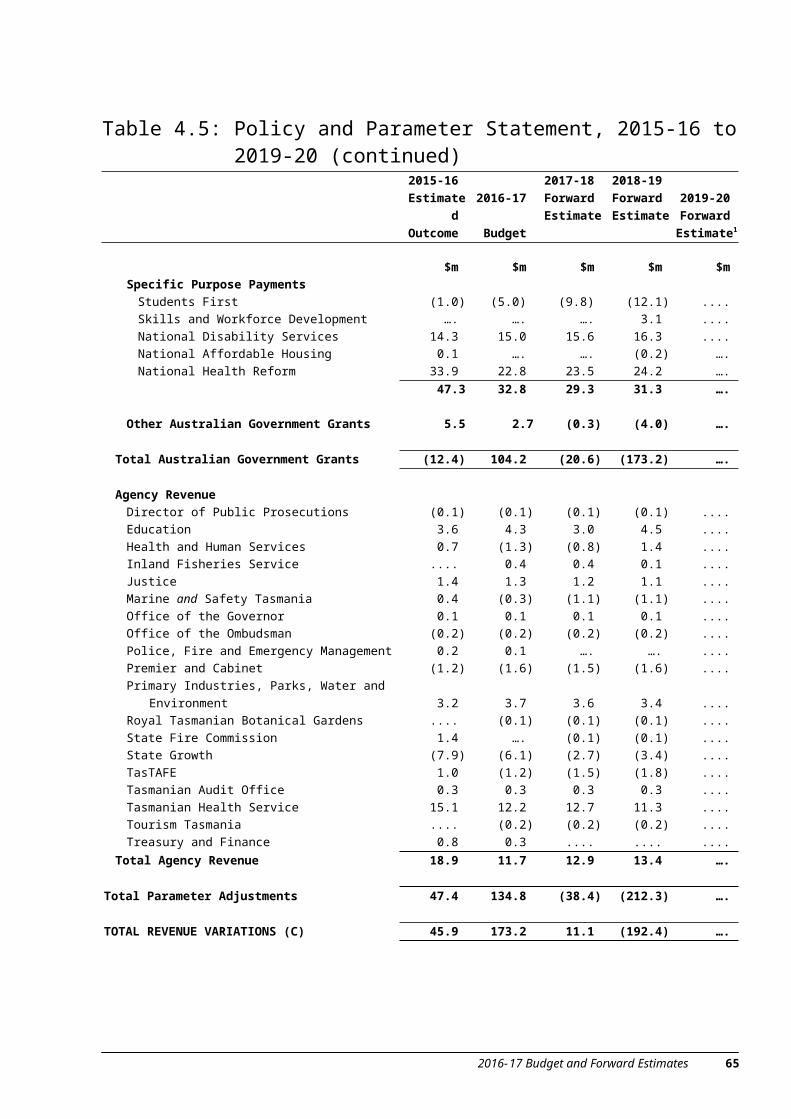
Table 4.5: Policy and Parameter Statement, 2015-16 to 2019-20 (continued)
2015-16)Estimated)Outcome)
2016-17)
Budget)
2017-18)Forward)Estimate)
2018-19)Forward)Estimate)
2019-20)Forward)Estimate1
$m) $m) $m) $m) $m)Specific Purpose Payments
Students First (1.0) (5.0)) (9.8)) (12.1) ....)Skills and Workforce Development ….) ….) ….) 3.1) ....)National Disability Services 14.3) 15.0) 15.6) 16.3) ....)National Affordable Housing 0.1) ….) ….) (0.2) ….)National Health Reform 33.9) 22.8) 23.5) 24.2 ….)
47.3 32.8) 29.3) 31.3) ….)
Other Australian Government Grants 5.5 2.7 (0.3) (4.0) ….)
Total Australian Government Grants (12.4) 104.2) (20.6) (173.2) ….)
Agency RevenueDirector of Public Prosecutions (0.1) (0.1) (0.1) (0.1) ....)Education 3.6) 4.3) 3.0) 4.5) ....)Health and Human Services 0.7) (1.3) (0.8) 1.4) ....)Inland Fisheries Service ....) 0.4) 0.4) 0.1) ....)Justice 1.4) 1.3) 1.2) 1.1) ....)Marine and Safety Tasmania 0.4) (0.3) (1.1) (1.1) ....)Office of the Governor 0.1) 0.1) 0.1) 0.1) ....)Office of the Ombudsman (0.2) (0.2) (0.2) (0.2) ....)Police, Fire and Emergency Management 0.2) 0.1) ….) ….) ....)Premier and Cabinet (1.2) (1.6) (1.5) (1.6) ....)Primary Industries, Parks, Water and Environment 3.2) 3.7) 3.6) 3.4) ....)Royal Tasmanian Botanical Gardens ....) (0.1) (0.1) (0.1) ....)State Fire Commission 1.4) ….) (0.1) (0.1) ....)State Growth (7.9) (6.1) (2.7) (3.4) ....)TasTAFE 1.0 (1.2) (1.5) (1.8) ....)Tasmanian Audit Office 0.3) 0.3) 0.3) 0.3) ....)Tasmanian Health Service 15.1 12.2 12.7) 11.3) ....)Tourism Tasmania ....) (0.2) (0.2) (0.2) ....)Treasury and Finance 0.8) 0.3) ....) ....) ....)
Total Agency Revenue 18.9) 11.7) 12.9) 13.4 ….)
Total Parameter Adjustments 47.4) 134.8) (38.4) (212.3) ….)
TOTAL REVENUE VARIATIONS (C) 45.9) 173.2) 11.1) (192.4) ….)
2016-17 Budget and Forward Estimates 61
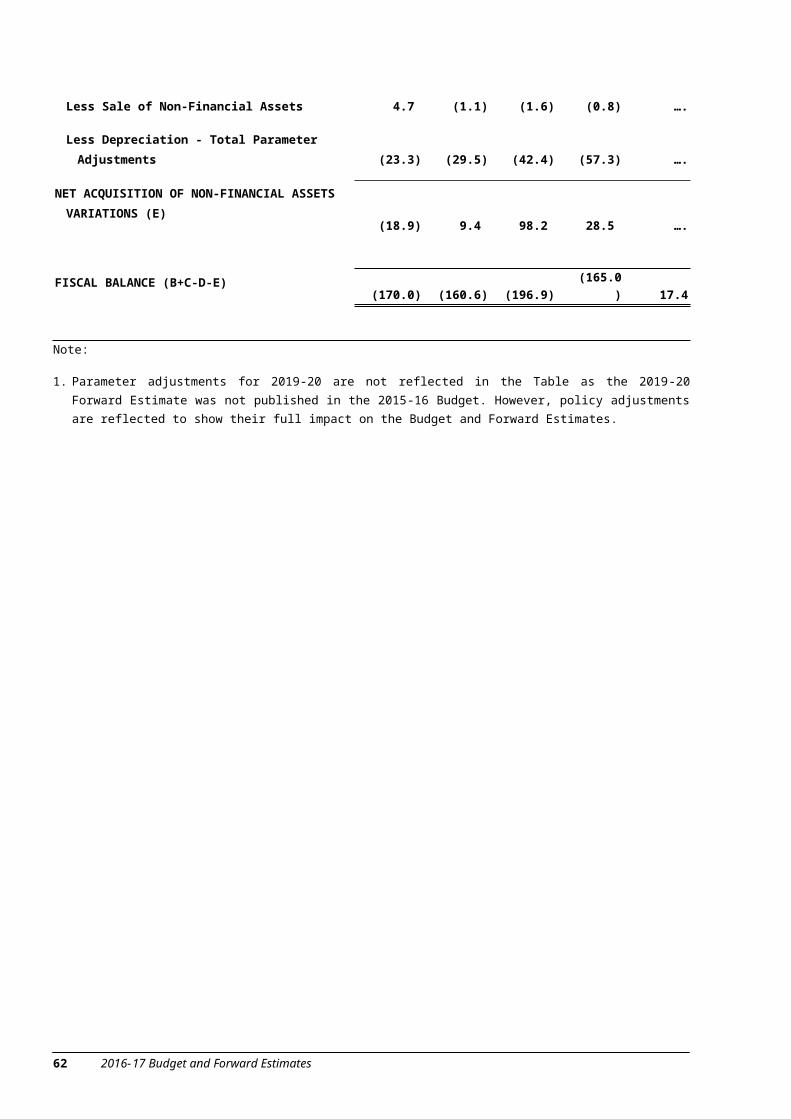
Table 4.5: Policy and Parameter Statement, 2015-16 to 2019-20 (continued)
2015-16)Estimated)Outcome)
2016-17)
Budget)
2017-18)Forward)Estimate)
2018-19)Forward)Estimate)
2019-20)Forward)Estimate1
$m) $m) $m) $m) $m)Expenses from Transactions
Policy Decisions6
Agency ExpenditureFinance-General
Gaming Review ....) 0.5) ....) ....) ....)Government Business Reviews and Energy Security
Taskforce ....) 1.5) 1.5) ....) ....)Fire Fighting Costs7 31.0) ....) ....) ....) ....)First Home Owner Grant ....) 6.5) 3.1) ....) ....)State Fire Commission Additional Funding 1.5) ....) ....) ....) ....)
32.5) 8.4) 4.7) .…) ….)Health and Human Services and Tasmanian Health
ServiceAmbulance Work Value ....) 2.5) 3.0) 3.0) 3.0)Equal Remuneration Order (ERO) ....) ....) ....) ....) 2.6)Healthy Tasmania ....) 0.4) 0.4) 0.4) 0.4)Mental Health Priorities - Rethink Mental Health
and Suicide Prevention ....) 0.8) 0.8) 0.8) 0.8)National Disability Insurance Scheme8 ....) ....) ....) ....) 17.3)Neighbourhood Houses ....) 0.5) 0.5) ....) ....)One Health System - Additional Investment ....) 8.0) 7.5) 7.0) 7.0)Patients First ....) 1.4) 1.4) 1.4) 1.4)Strong Families, Safe Kids ....) 3.5) 3.7) 3.8) 3.9)Tasmania's Affordable Housing Strategy9 0.5) 1.9) 1.8) 1.8) ....)Tasmanian Health Service Additional Funding 10.0) ....) ....) ....) ....)
10.5) 18.9) 19.1) 18.1) 36.3)Justice
Civil and Administrative Tribunal Project Team ....) 0.1) ....) ....) ....)Corrective Services - Compulsory Treatment of Sex
Offenders ....) 0.3) 0.3) 0.3) 0.3)Legal Assistance ....) 0.5) ....) ....) ....)Mary Hutchinson Women's Prison ....) 0.3) 1.2) 1.3) 1.3)Office of the Public Guardian ....) 0.1) 0.1) 0.1) 0.1)Planning Policy Unit ....) 0.2) 0.2) 0.2) 0.2)Supreme Court of Tasmania Security Upgrades ....) 0.1) 0.1) 0.1) 0.1)
62 2016-17 Budget and Forward Estimates
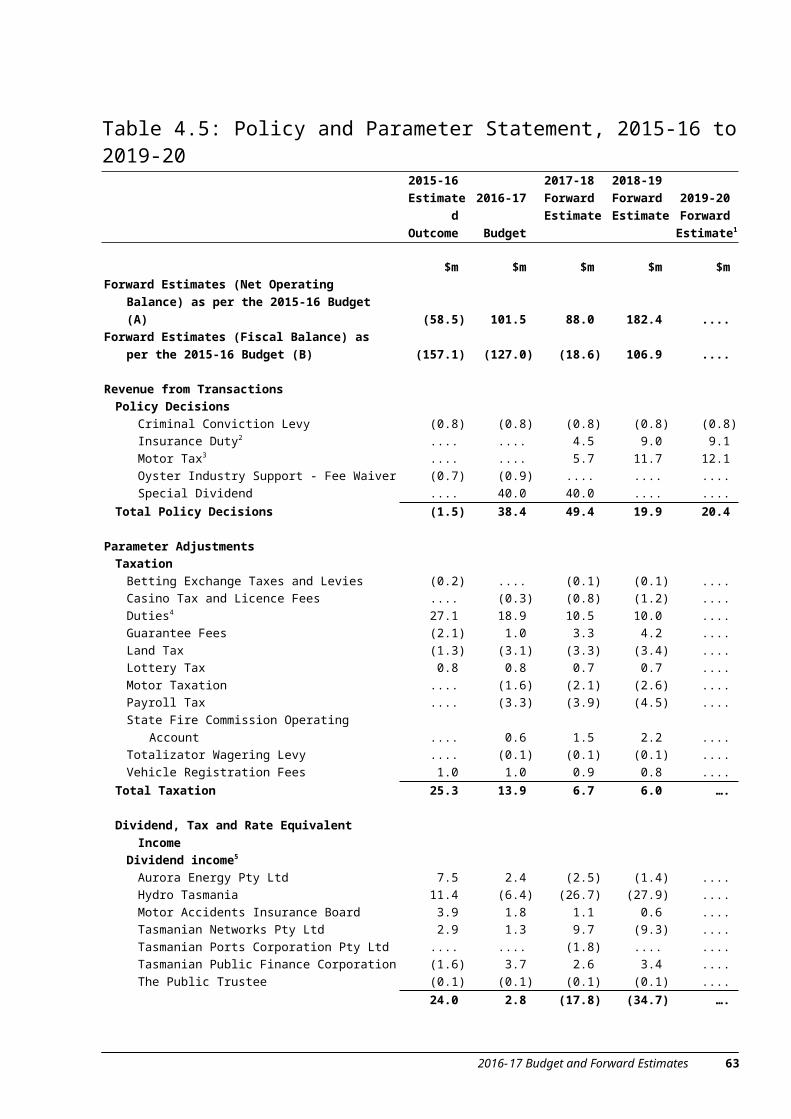
Table 4.5: Policy and Parameter Statement, 2015-16 to 2019-20 (continued)
2015-16)Estimated)Outcome)
2016-17)
Budget)
2017-18)Forward)Estimate)
2018-19)Forward)Estimate)
2019-20)Forward)Estimate1
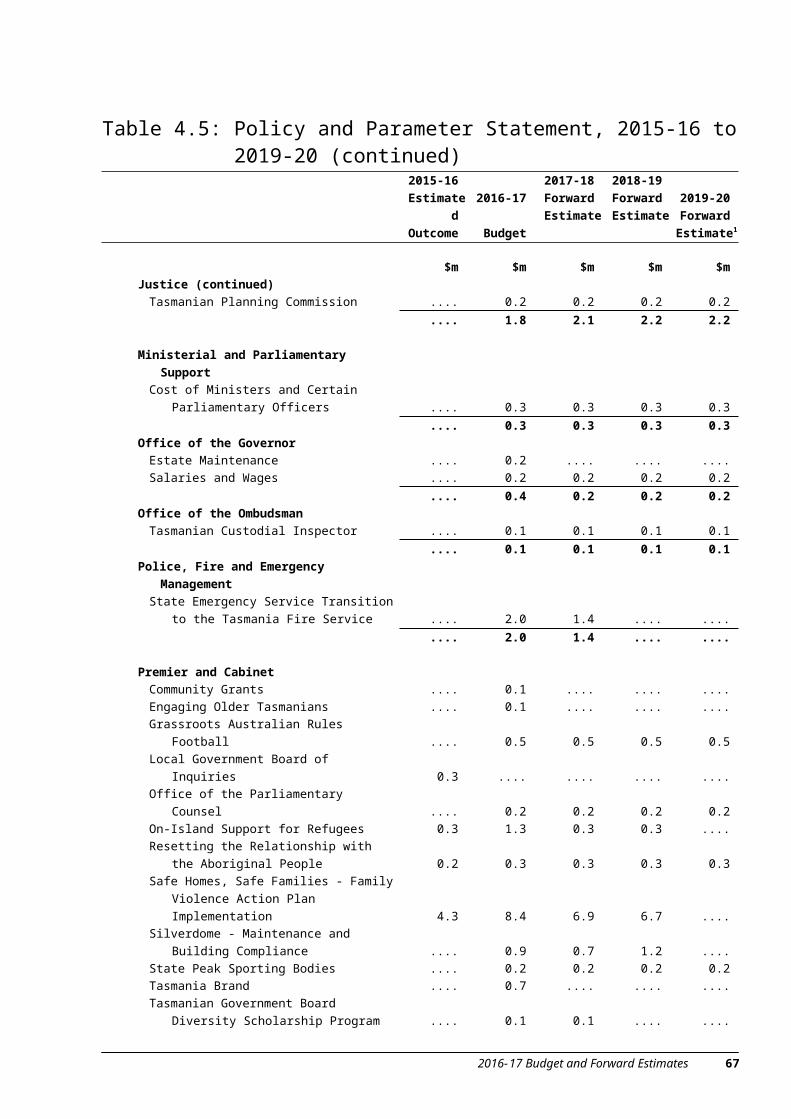
$m) $m) $m) $m) $m)Justice (continued)
Tasmanian Planning Commission ....) 0.2) 0.2) 0.2) 0.2)....) 1.8) 2.1) 2.2) 2.2)
Ministerial and Parliamentary SupportCost of Ministers and Certain Parliamentary
Officers ....) 0.3) 0.3) 0.3) 0.3)....) 0.3) 0.3) 0.3) 0.3)
Office of the GovernorEstate Maintenance ....) 0.2) ....) ....) ....)Salaries and Wages ....) 0.2) 0.2) 0.2) 0.2)
....) 0.4) 0.2) 0.2) 0.2)Office of the Ombudsman
Tasmanian Custodial Inspector ....) 0.1) 0.1) 0.1) 0.1)....) 0.1) 0.1) 0.1) 0.1)
Police, Fire and Emergency ManagementState Emergency Service Transition to the
Tasmania Fire Service ....) 2.0) 1.4) ....) ....)....) 2.0) 1.4) ....) ....)
Premier and CabinetCommunity Grants ....) 0.1) ....) ....) ....)Engaging Older Tasmanians ....) 0.1) ....) ....) ....)Grassroots Australian Rules Football ....) 0.5) 0.5) 0.5) 0.5)Local Government Board of Inquiries 0.3) ....) ....) ....) ....)Office of the Parliamentary Counsel ....) 0.2) 0.2) 0.2) 0.2)On-Island Support for Refugees 0.3) 1.3) 0.3) 0.3) ....)Resetting the Relationship with the Aboriginal
People 0.2) 0.3) 0.3) 0.3) 0.3)Safe Homes, Safe Families - Family Violence Action
Plan Implementation 4.3) 8.4) 6.9) 6.7) ....)Silverdome - Maintenance and Building
Compliance ....) 0.9) 0.7) 1.2) ....)State Peak Sporting Bodies ....) 0.2) 0.2) 0.2) 0.2)Tasmania Brand ....) 0.7) ....) ....) ....)Tasmanian Government Board Diversity
Scholarship Program ....) 0.1) 0.1) ....) ....)
Table 4.5: Policy and Parameter Statement, 2015-16 to 2019-20 (continued)
2015-16)Estimated)Outcome)
2016-17)
Budget)
2017-18)Forward)Estimate)
2018-19)Forward)Estimate)
2019-20)Forward)Estimate1
$m) $m) $m) $m) $m)Premier and Cabinet (continued)
World Heritage Bushfire Research ....) 0.3) ....) ....) ....)
2016-17 Budget and Forward Estimates 63
5.0) 12.8) 9.0) 9.3) 1.1)
Primary Industries, Parks, Water and EnvironmentAboriginal Joint Management of Reserves ....) 0.2) 0.2) 0.2) 0.2)Biosecurity Tasmania ....) 0.5) 0.5) 0.5) 0.5)Maria Island National Park Strategy ....) 0.2) ....) ....) ....)Nyrstar Agreement 1.3) 0.8) 1.0) 1.0) 1.0)Oyster Industry Support 0.5) 0.6) ....) ....) ....)Support the Regulatory and Other Services of the
Poppy Industry ....) 0.7) 0.7) 0.7) 0.7)Tasmanian Shellfish Quality Assurance Program ....) 0.1) 0.1) 0.1) 0.1)Wild Fisheries Management Program ....) 0.1) 0.1) 0.1) 0.1)
1.7) 3.1) 2.6) 2.6) 2.6)State Growth
Academy of Creative Industries and Performing Arts Additional Funding ....) ....) 4.0) 5.9) ....)
Business Enterprise Centres ....) 0.2) 0.2) ....) ....)Community Infrastructure Fund ....) 5.0) ....) ....) ....)Congestion in Greater Hobart ....) 0.5) 0.5) ....) ....)Dark MOFO10 1.7) ....) ....) ....) ....)Employee Separation costs 2.0) ....) ....) ....) ....)Geoscience Initiative Program ....) 0.4) 0.4) 0.4) 0.4)Hawthorn Football Club Bonus Payment 0.3) ....) ....) ....) ....)Move of Mineral Resources Tasmania to Burnie ....) 1.3) 1.3) ....) ....)New Hawthorn Football Club Agreement ....) 3.1) 4.0) 4.2) 4.2)Princes Wharf No 1 0.3) ....) ....) ....) ....)Savour Tasmania in China 0.2) ....) ....) ....) ....)State Growth Additional Funding 1.3) ....) ....) ....) ....)SubPartners Cable Consultancy 0.1) ....) ....) ....) ....)Supporting Small Businesses with Apprenticeships
and Traineeships ....) 0.3) 0.3) ....) ....)
Table 4.5: Policy and Parameter Statement, 2015-16 to 2019-20 (continued)
2015-16)Estimated)Outcome)
2016-17)
Budget)
2017-18)Forward)Estimate)
2018-19)Forward)Estimate)
2019-20)Forward)Estimate1
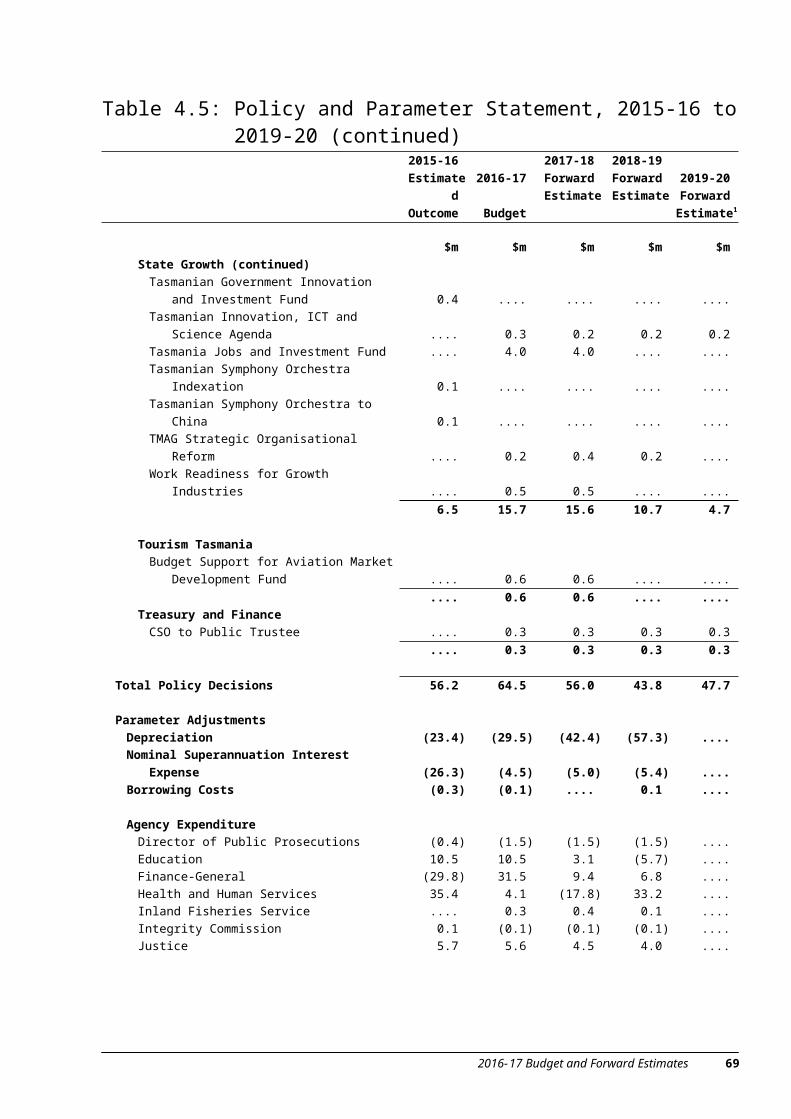
$m) $m) $m) $m) $m)State Growth (continued)
Tasmanian Government Innovation and Investment Fund 0.4) ....) ....) ....) ....)
Tasmanian Innovation, ICT and Science Agenda ....) 0.3) 0.2) 0.2) 0.2)Tasmania Jobs and Investment Fund ....) 4.0) 4.0) ....) ....)Tasmanian Symphony Orchestra Indexation 0.1) ....) ....) ....) ....)Tasmanian Symphony Orchestra to China 0.1) ....) ....) ....) ....)TMAG Strategic Organisational Reform ....) 0.2) 0.4) 0.2) ....)Work Readiness for Growth Industries ....) 0.5) 0.5) ....) ....)
6.5) 15.7) 15.6) 10.7) 4.7)
Tourism TasmaniaBudget Support for Aviation Market Development
Fund ....) 0.6) 0.6) ....) ....)....) 0.6) 0.6) ....) ....)
Treasury and FinanceCSO to Public Trustee ....) 0.3) 0.3) 0.3) 0.3)
64 2016-17 Budget and Forward Estimates
....) 0.3) 0.3) 0.3) 0.3)
Total Policy Decisions 56.2) 64.5) 56.0) 43.8) 47.7)
Parameter AdjustmentsDepreciation (23.4) (29.5) (42.4) (57.3) ....)Nominal Superannuation Interest Expense (26.3) (4.5) (5.0) (5.4) ....)Borrowing Costs (0.3) (0.1) ....) 0.1) ....)
Agency ExpenditureDirector of Public Prosecutions (0.4) (1.5) (1.5) (1.5) ....)Education 10.5) 10.5) 3.1) (5.7) ....)Finance-General (29.8) 31.5) 9.4) 6.8 ....)Health and Human Services 35.4 4.1 (17.8) 33.2) ....)Inland Fisheries Service ....) 0.3) 0.4) 0.1) ....)Integrity Commission 0.1) (0.1) (0.1) (0.1) ....)Justice 5.7) 5.6) 4.5) 4.0) ....)
2016-17 Budget and Forward Estimates 65
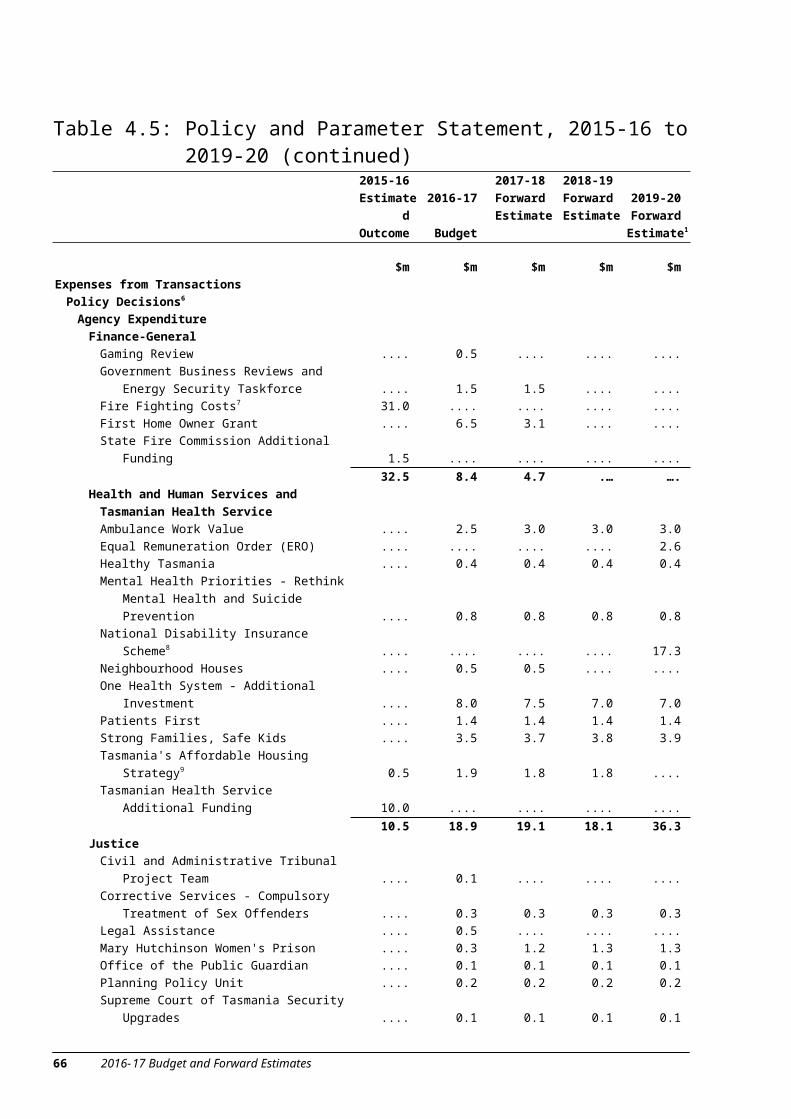
Table 4.5: Policy and Parameter Statement, 2015-16 to 2019-20 (continued)
2015-16)Estimated)Outcome)
2016-17)
Budget)
2017-18)Forward)Estimate)
2018-19)Forward)Estimate)
2019-20)Forward)Estimate1
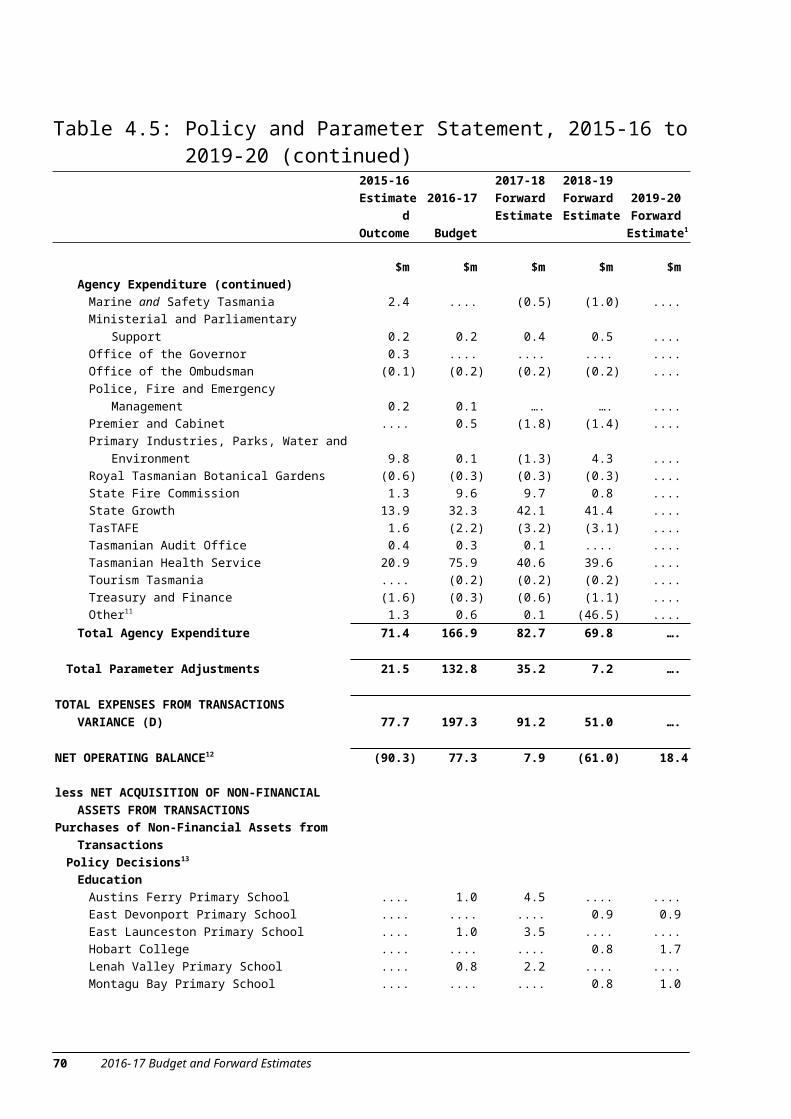
$m) $m) $m) $m) $m)Agency Expenditure (continued)
Marine and Safety Tasmania 2.4) ....) (0.5) (1.0) ....)Ministerial and Parliamentary Support 0.2) 0.2) 0.4 0.5 .... Office of the Governor 0.3) ....) ....) ....) ....)Office of the Ombudsman (0.1) (0.2) (0.2) (0.2) ....)Police, Fire and Emergency Management 0.2) 0.1) ….) ….) ....)Premier and Cabinet .... 0.5) (1.8) (1.4) ....)Primary Industries, Parks, Water and Environment 9.8) 0.1) (1.3) 4.3) ....)Royal Tasmanian Botanical Gardens (0.6) (0.3) (0.3) (0.3) ....)State Fire Commission 1.3) 9.6) 9.7) 0.8) ....)State Growth 13.9) 32.3) 42.1) 41.4) ....)TasTAFE 1.6) (2.2) (3.2) (3.1) ....)Tasmanian Audit Office 0.4) 0.3) 0.1) ....) ....)Tasmanian Health Service 20.9) 75.9) 40.6) 39.6) ....)Tourism Tasmania ....) (0.2) (0.2) (0.2) ....)Treasury and Finance (1.6) (0.3) (0.6) (1.1) ....)Other11 1.3) 0.6) 0.1) (46.5) ....)
Total Agency Expenditure 71.4) 166.9) 82.7) 69.8) ….)
Total Parameter Adjustments 21.5) 132.8) 35.2) 7.2) ….)
TOTAL EXPENSES FROM TRANSACTIONS VARIANCE (D) 77.7) 197.3) 91.2) 51.0) ….)
NET OPERATING BALANCE12 (90.3) 77.3) 7.9) (61.0) 18.4
less NET ACQUISITION OF NON-FINANCIAL ASSETS FROM TRANSACTIONS
Purchases of Non-Financial Assets from TransactionsPolicy Decisions13
EducationAustins Ferry Primary School ....) 1.0) 4.5) ....) ....)East Devonport Primary School ....) ....) ....) 0.9) 0.9)East Launceston Primary School ....) 1.0) 3.5) ....) ....)Hobart College ....) ....) ....) 0.8) 1.7)Lenah Valley Primary School ....) 0.8) 2.2) ....) ....)Montagu Bay Primary School ....) ....) ....) 0.8) 1.0)
Table 4.5: Policy and Parameter Statement, 2015-16 to 2019-20 (continued)
2015-16)Estimated)Outcome)
2016-17)
Budget)
2017-18)Forward)Estimate)
2018-19)Forward)Estimate)
2019-20)Forward)Estimate1
$m) $m) $m) $m) $m)Education (continued)
Northern Support School (1.3) 1.3) ....) ....) ....)Queechy High School ....) ....) ....) 1.5) 1.5)Riverside Primary School ....) ....) ....) 0.8) 1.7)Snug Primary School ....) ....) ....) 1.3) 1.3)
66 2016-17 Budget and Forward Estimates
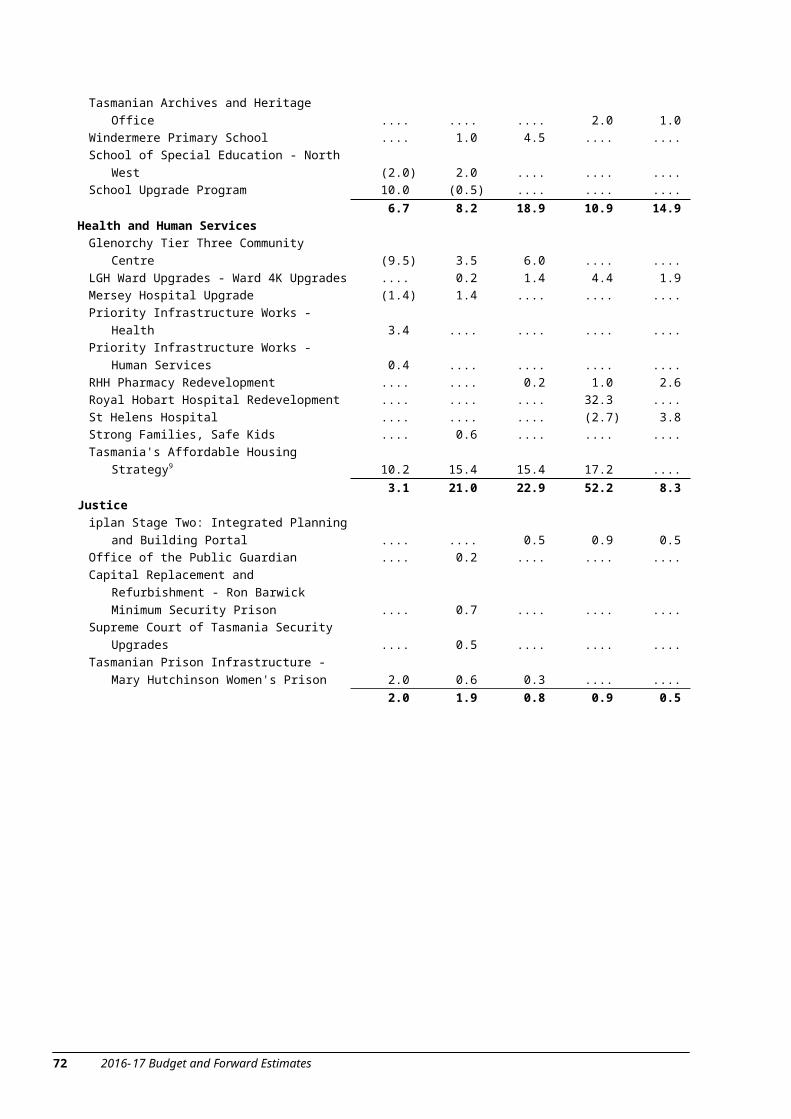
Somerset Primary School ....) 0.8) 1.0) ....) ....)Sorell School ....) ....) ....) 1.9) 1.9)St Marys District School ....) ....) ....) 1.0) 4.0)Tasman District School ....) 0.8) 3.2) ....) ....)Tasmanian Archives and Heritage Office ....) ....) ....) 2.0) 1.0)Windermere Primary School ....) 1.0) 4.5) ....) ....)School of Special Education - North West (2.0) 2.0) ....) ....) ....)School Upgrade Program 10.0) (0.5) ....) ....) ....)
6.7) 8.2) 18.9) 10.9) 14.9)Health and Human Services
Glenorchy Tier Three Community Centre (9.5) 3.5) 6.0) ....) ....)LGH Ward Upgrades - Ward 4K Upgrades ....) 0.2) 1.4) 4.4) 1.9)Mersey Hospital Upgrade (1.4) 1.4) ....) ....) ....)Priority Infrastructure Works - Health 3.4) ....) ....) ....) ....)Priority Infrastructure Works - Human Services 0.4) ....) ....) ....) ....)RHH Pharmacy Redevelopment ....) ....) 0.2) 1.0) 2.6)Royal Hobart Hospital Redevelopment ....) ....) ....) 32.3) ....)St Helens Hospital ....) ....) ....) (2.7) 3.8)Strong Families, Safe Kids ....) 0.6) ....) ....) ....)Tasmania's Affordable Housing Strategy9 10.2) 15.4) 15.4) 17.2) ....)
3.1) 21.0) 22.9 52.2) 8.3)Justice
iplan Stage Two: Integrated Planning and Building Portal ....) ....) 0.5) 0.9) 0.5)
Office of the Public Guardian ....) 0.2) ....) ....) ....)Capital Replacement and Refurbishment - Ron
Barwick Minimum Security Prison ....) 0.7) ....) ....) ....)Supreme Court of Tasmania Security Upgrades ....) 0.5) ....) ....) ....)Tasmanian Prison Infrastructure - Mary Hutchinson
Women's Prison 2.0) 0.6) 0.3) ....) ....) 2.0) 1.9) 0.8) 0.9) 0.5)
2016-17 Budget and Forward Estimates 67
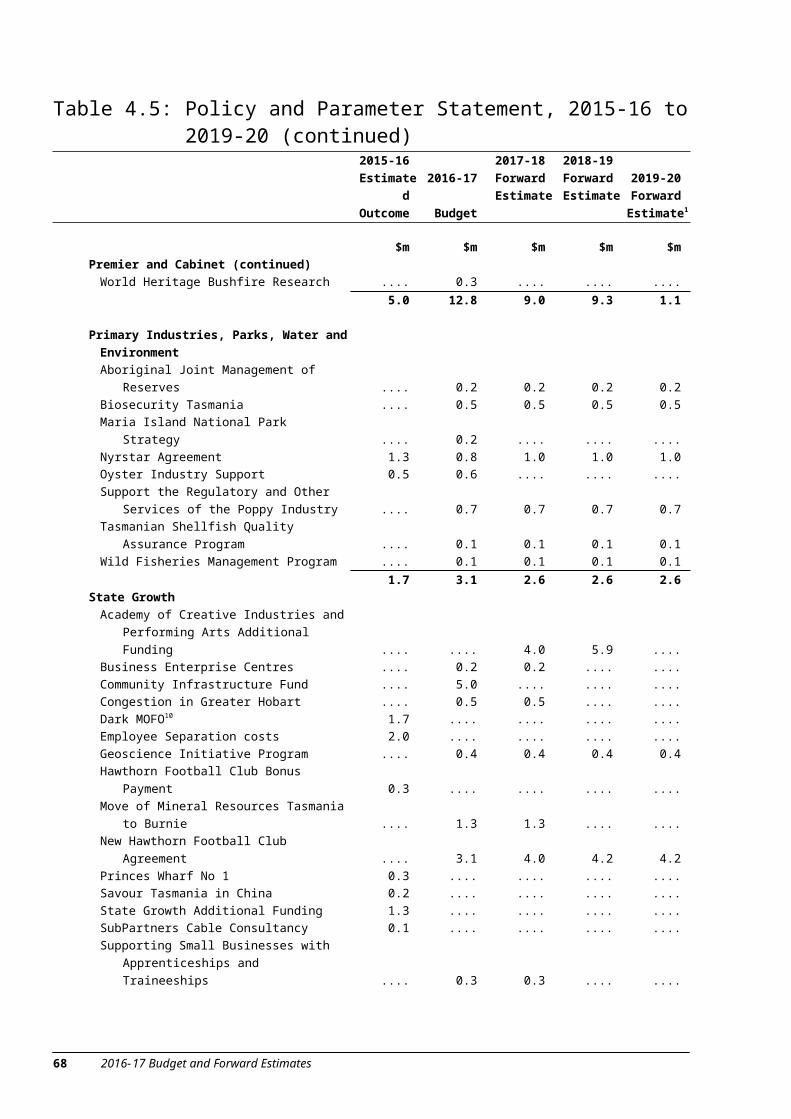
Table 4.5: Policy and Parameter Statement, 2015-16 to 2019-20 (continued)
2015-16)Estimated)Outcome)
2016-17)
Budget)
2017-18)Forward)Estimate)
2018-19)Forward)Estimate)
2019-20)Forward)Estimate1
$m) $m) $m) $m) $m)Legislature-General
Security Works ....) 0.9) ....) ....) ....)....) 0.9) ....) ....) ....)
Police, Fire and Emergency ManagementAdditional Funding for Large Vessel Replacement
Project ....) 3.6) ....) ....) ....)District Headquarters and Major Support Service
Building Refurbishment ....) 1.0) 1.0) ....) ....)Emergency Services Computer Aided Dispatch
(ESCAD) Project Additional Funding ....) ....) 2.0) ....) ....)Large Vessel Replacement Project Update (3.0) 3.0) ....) ....) ....)Upgrade Police Housing Statewide ....) 1.3) 1.3) 1.3) 1.3)
(3.0) 8.9) 4.3) 1.3) 1.3)Primary Industries, Parks, Water and Environment
Fisheries Integrated Licensing and Management System ....) 0.6) 0.6) ....) ....)
....) 0.6) 0.6) ....) ....)State Growth
Great Eastern Drive ....) ....) 0.3) 3.0) 3.0)Northern Cities Major Development Initiative ....) (5.0) ....) ....) 35.0)Huon Highway - Glendevie Climbing Lanes 3.0) (3.0) ....) ....) ....)Wrinkler's Lagoon Bridge 2.0) ....) ....) ....) ....)
5.0) (8.0) 0.3) 3.0) 38.0)TasTAFE
TAFE Infrastructure ....) ....) 1.5) 1.5) ....)Drysdale project 1.5) ....) ....) ....) ....)
1.5) ....) 1.5) 1.5) ....)
Total Policy Decisions 15.3) 33.4) 49.1 69.7) 63.0)
Parameter AdjustmentsEducation (1.1) 0.7) ....) ....) ....)Finance-General 7.1) (3.8) (1.2) (0.9) ....)Health and Human Services 8.8) (56.0) 58.7) 14.8 ....)Marine and Safety Tasmania (0.3) ....) ....) ....) ....)
Table 4.5: Policy and Parameter Statement, 2015-16 to 2019-20 (continued)
2015-16)Estimated)Outcome)
2016-17)
Budget)
2017-18)Forward)Estimate)
2018-19)Forward)Estimate)
2019-20)Forward)Estimate1
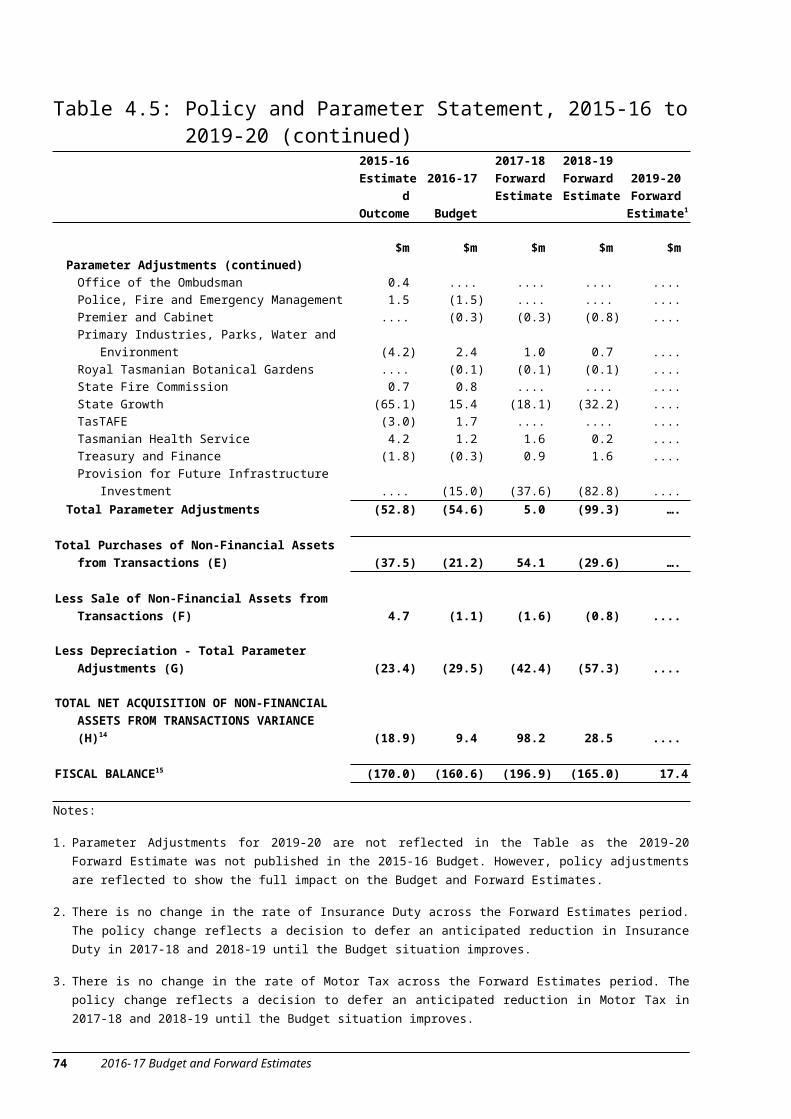
$m) $m) $m) $m) $m)Parameter Adjustments (continued)
Office of the Ombudsman 0.4) ....) ....) ....) ....)Police, Fire and Emergency Management 1.5) (1.5) ....) ....) ....)Premier and Cabinet ....) (0.3) (0.3) (0.8) ....)Primary Industries, Parks, Water and Environment (4.2) 2.4) 1.0) 0.7) ....)
68 2016-17 Budget and Forward Estimates
Royal Tasmanian Botanical Gardens ....) (0.1) (0.1) (0.1) ....)State Fire Commission 0.7) 0.8) ....) ....) ....)State Growth (65.1) 15.4) (18.1) (32.2) ....)TasTAFE (3.0) 1.7) ....) ....) ....)Tasmanian Health Service 4.2) 1.2) 1.6) 0.2) ....)Treasury and Finance (1.8) (0.3) 0.9) 1.6) ....)Provision for Future Infrastructure Investment ....) (15.0) (37.6) (82.8) ....)
Total Parameter Adjustments (52.8) (54.6) 5.0) (99.3) ….)
Total Purchases of Non-Financial Assets from Transactions (E) (37.5) (21.2) 54.1) (29.6) ….)
Less Sale of Non-Financial Assets from Transactions (F) 4.7) (1.1) (1.6) (0.8) ....)
Less Depreciation - Total Parameter Adjustments (G) (23.4) (29.5) (42.4) (57.3) ....)
TOTAL NET ACQUISITION OF NON-FINANCIAL ASSETS FROM TRANSACTIONS VARIANCE (H)14 (18.9) 9.4) 98.2) 28.5) ....)
FISCAL BALANCE15 (170.0) (160.6) (196.9) (165.0) 17.4
Notes:
1. Parameter Adjustments for 2019-20 are not reflected in the Table as the 2019-20 Forward Estimate was not published in the 2015-16 Budget. However, policy adjustments are reflected to show the full impact on the Budget and Forward Estimates.
2. There is no change in the rate of Insurance Duty across the Forward Estimates period. The policy change reflects a decision to defer an anticipated reduction in Insurance Duty in 2017-18 and 2018-19 until the Budget situation improves.
3. There is no change in the rate of Motor Tax across the Forward Estimates period. The policy change reflects a decision to defer an anticipated reduction in Motor Tax in 2017-18 and 2018-19 until the Budget situation improves.
4. The decrease in Duties in 2017-18 primarily reflects that Conveyance Duty on large commercial property transactions is forecast to reduce towards trend levels, which have been higher than usual in 2015-16 and 2016-17.
5. Additional information is provided in chapter 5 of this Budget Paper.
6. For further information on expense related policy decisions, refer to the relevant agency chapter in Government Services Budget Paper No 2.
7. Fire Fighting Costs in 2015-16 reflects additional funding allocated to date in 2015-16 to meet the costs of the 2016 Bushfire emergency. Final costs are expected to be in excess of this amount and will be addressed as they arise.
8. Funding for the National Disability Insurance Scheme (NDIS) of $17.3 million in 2019-20 reflects the allocation of additional funding in the 2016-17 Budget and is included within the funding of $56.9 million for the NDIS reflected in chapter 4 of Government Services Budget Paper No 2.
9. In 2015-16, the total allocation for the Affordable Housing Strategy was $13.5 million. In the 2016-17 Budget the allocation is $20 million in 2016-17, 2017-18 and 2018-19. This funding is not fully reflected in Table 4.5, as a portion of the total funding allocated includes equity investments that are not included in the Policy and Parameter Statement.
10. A one year funding arrangement was agreed for this event. Discussions are ongoing in relation to potential support for future events.
11. The movement in Other primarily reflects adjustments to eliminations and indexation as well as cost estimates associated with the State's superannuation expense and liability.
12. Net Operating Balance is equal to A + C - D.
2016-17 Budget and Forward Estimates 69
13. For further information on Non-Financial Asset policy decisions refer to chapter 6 of this Budget Paper.
14. Total Net Acquisition of Non-Financial Assets is equal to E - F - G.
15. Fiscal Balance is equal to B + C - D - H.
70 2016-17 Budget and Forward Estimates

MAJOR REVENUE VARIATIONS
Policy Decisions
Criminal Conviction Levy
The reduction in receipts reflects Parliament's decision not to proceed with the Government's policy proposal to impose levies on convicted criminals.
Insurance Duty
The 2014-15 Budget included a commitment to reduce the duty on compulsory third party motor premiums over two years commencing on 1 July 2017, back to pre 1 October 2012 levels (i.e. when tax rates were increased by the previous Government). Following the loss of over half a billion in GST revenue prior to the 2016-17 Budget, the Government has made a decision to defer the implementation of this change in the insurance duty rate until the Budget is in a stronger position. Insurance Duty estimates from 2017-18 onwards therefore assume a continuation of the rate for duty on Motor Accident Insurance Board (MAIB) premiums that was introduced from 1 October 2012.
Motor Tax
The 2014-15 Budget included a commitment to reduce the tax rate on light vehicles over two years, commencing 1 July 2017, back to pre 1 October 2012 levels (i.e. when tax rates were increased by the previous Government). Following the loss of over half a billion in GST revenues prior to the 2016-17 Budget, the Government has made a decision to defer the implementation of this change in the motor tax rate until the Budget is in a stronger position. Motor Tax estimates from 2017-18 onwards therefore assume a continuation of the rates for motor tax on light motor vehicles that were introduced from 1 October 2012.
Oyster Industry Support - Fee Waiver
This initiative, administered by the Department of Primary Industries, Parks, Water and Environment reflects the Government's decision to waive fees in 2015-16 and 2016-17 totalling $1.6 million for all Tasmanian Pacific Oyster growers as a result of the impact of the Pacific Oyster Mortality Syndrome (POMS). The reduction in revenue reflects a reduction in the lease rentals and licence fees, and a reduction in the Tasmanian Shellfish Quality Assurance Program (TSQAP) Levy revenues collected by the Department.
Special Dividend
A Vessel Replacement Fund will be established for replacing the Spirit of Tasmania I and II. The Fund will be backed by an initial cash injection of $40 million representing a special dividend from TT-Line Company Pty Ltd in 2016-17 and a second expected $40 million special dividend in 2017-18. The Fund will be protected by specific legislation to ensure it can only be used for the replacement of these vessels.
2016-17 Budget and Forward Estimates 71
Parameter Adjustments
Duties
Duties reflects changes in estimates for Conveyance Duty, Motor Vehicle Duty and Insurance Duty. The increase in 2015-16 primarily reflects a higher level of large property transactions, in addition, there has been a general increase to the base forecast for Conveyance Duty, which is the main driver for the movement in the Forward Estimates.
Dividend, Tax and Rate Equivalent Income
The overall movement in Dividends is primarily attributable to the change in dividends to be remitted from Hydro Tasmania. The reduction in dividends payable by Hydro Tasmania across the Forward Estimates period reflects low inflows, the Basslink outage and the strategies adopted as part of the Energy Supply Plan. As Hydro Tasmania will be rebuilding its water storages, dividends are not expected to be paid until 2019-20.
Other key movements in Dividend receipts are attributable to Aurora Energy Pty Ltd and the Motor Accidents Insurance Board. The reduction in dividends payable by Aurora Energy Pty Ltd reflects lower profit estimates across the Forward Estimates. The increase in dividends from the MAIB reflects improved claims experience and investment returns being more favourable than expected.
Forecast income tax equivalents from the MAIB have increased as a result of favourable revisions to its claims expense and higher overall income from operations. These increases are, however, offset by reduced income tax equivalent returns from Hydro Tasmania due to its reduced profitability.
Further information in relation to Dividend, Tax and Rate Equivalent Income is contained in chapter 5 of this Budget Paper.
GST Revenue
The movement in GST reflects estimates and assumptions regarding the size of the GST pool, Tasmania's population and its GST relativity. The per capita relativity used for 2016-17 is the relativity recommended by the Commonwealth Grants Commission and determined by the Australian Treasurer. The per capita relativities from 2016-17 onwards are based on modelling by the Department of Treasury and Finance. For more information on GST receipts, refer to chapter 5 of this Budget Paper.
National Partnership Payments
Movements in National Partnership payments occur frequently and may reflect either changes to underlying program agreements or the reallocation of funding to different years as advised by the Australian Government. Information on major movements is provided below.
The increase in Natural Disaster Relief in 2016-17 reflects estimated receipts from the Australian Government under the Natural Disaster Relief and Recovery Arrangements for costs associated with the 2016 Bushfires.
The increase in Education in 2016-17 and 2017-18 reflects increased cash flows for the Universal Access to Early Childhood Education agreement.
The increase in Environment from 2016-17 primarily reflects the provision of funding under the Water for the Future agreement.
72 2016-17 Budget and Forward Estimates

The increase in Healthcare in 2016-17 and 2017-18 primarily reflects the reallocation of $40 million in funding for the Royal Hobart Hospital redevelopment from 2018-19 to 2016-17 ($25 million) and 2017-18 ($15 million).
The increase in Housing in 2016-17 reflects funding of $2.8 million through the Homelessness agreement and $5 million for the John L Grove walk in centre.
The decrease in Infrastructure in 2015-16 and subsequent increase in 2016-17 reflects the reallocation of Roads funding from 2015-16 to 2016-17 and the receipt of additional funding for Off-Network Projects.
The decrease in Other services in 2015-16 primarily reflects an advance payment made by the Australian Government during 2014-15 for Grants to the State for Local Government of $35.5 million.
Specific Purpose Payments
Tasmania will now receive the full National Disability SPP to 2018, which is approximately $31.7 million in 2016-17. As Tasmanian NDIS participants transition to full scheme, the NDSPP will be progressively paid to the National Disability Insurance Agency (NDIA) as a contribution on behalf of the Australian Government. As a result, the estimates for the NDSPP have increased prior to ceasing in 2019-20 when transition is complete. The Budget neutrality arrangements will continue to apply from 2019-20 but will be a separate payment.
National Health Reform increases primarily reflect an increase in Australian Government Activity Based Funding due to a revision of Tasmanian Health Service activity profiles which relate to: actual activity achieved in 2014-15 which was higher than anticipated; administrative improvements in coding of activity that result in additional activity being captured; and changes made to prior years funding which has positively impacted on growth levels.
The decrease in Students First Funding reflects the latest advice from the Australian Government. Movements in funding reflect changes in both enrolment levels and targeted subgroups, such as students with disabilities and for students where English is a second language which have impacted on fund loadings.
Agency Revenue
Tasmanian Health Service
The increase for the Tasmanian Health Service reflects an upward revision of own source revenues, which are primarily the Private Patient Scheme of $2.3 million following a comprehensive review, Children's Dental Benefit Scheme of $5.8 million and the Training More Specialists Program of $2.2 million.
2016-17 Budget and Forward Estimates 73
MAJOR EXPENSE VARIATIONS
Policy DecisionsFor detailed information on policy decisions, refer to agency chapters in Government Services Budget Paper No 2.
Parameter Adjustments
Agency Expenditure
Education
The increase in expenditure for 2015-16 and 2016-17 primarily reflects increases in Australian Government funding related expenditure of approximately $5.4 million in 2015-16 primarily for the Smarter Schools programs and an additional $9 million in 2016-17 for the Early Childhood Education - Universal Access to Early Education Program. Other movements in 2015-16 reflect the alignment of expenditure to actual trends.
Finance-General
The movement in expenditure for Finance-General in 2015-16 primarily reflects a reduction in projected Grants for Local Government of $35.5 million following the advance payment made by the Australian Government during 2014-15 which was on-forwarded to councils in the same year. The increase for 2016-17 primarily reflects the change in the timing of expenditure for the Tasmanian Forests Agreement of $9.4 million and increased Superannuation service costs based on latest actuarial estimates of $10.4 million.
Health and Human Services
The major expense variations for Health and Human Services predominantly reflect new arrangements agreed under the Bilateral Agreement between the Tasmanian and Australian Governments for the transition to the NDIS of approximately $15 million per annum. Other major movements relate to adjustments to projected expenditure of National Partnership funds provided by the Australian Government and the expenditure of funding carried forward from 2014-15 to 2015-16.
Justice
The movement in expenditure for the Department of Justice reflects additional Australian Government funding for Legal Aid assistance of $1.1 million in 2015-16, $1 million in 2016-17, $539 000 in 2017-18, $523 000 in 2018-19 and $601 000 in 2019-20. Additional expenditure of $2.5 million per annum in 2015-16 and over the Forward Estimates period reflects the realignment of service responsibilities for WorkSafe Tasmania and Building Standards and Occupational Licensing, as a result of the restructure undertaken in 2014-15.
Primary Industries, Parks, Water and the Environment
The increase in expenditure in 2015-16 includes the timing of expenditure for the Tasmanian Wilderness Extension Funding provided by the Australian Government of $3.8 million, Wildfire suppression costs of $2.2 million and revised estimates for the Three Capes Track of $1 million.
74 2016-17 Budget and Forward Estimates
State Growth
Increased expenditure for the Department of State Growth primarily reflects reclassification of $104.1 million in road expenditure from capital to maintenance over the Budget and Forward Estimates, following a review by the Department to better align its expenditure projections with current experience. In addition, there is an increase in estimated expenditure of Australian Government funding for Workforce Development and on administered transport items.
Tasmanian Health Service
The major expense variations for the Tasmanian Health Service predominantly relate to the expensing of additional State and Commonwealth National Health Reform payments of $25.5 million in 2015-16 and $21 million per annum over the Forward Estimates, as well as increases generated by the receipt of additional own-source revenue of $11 million in 2015-16 and $15.8 million in 2016-17. The movement in 2016-17 also includes a change in the funding profile for National Partnership Agreements, as per advice from the Australian Government, of $24.1 million.
2016-17 Budget and Forward Estimates 75
MAJOR PURCHASES OF NON-FINANCIAL ASSETS VARIATIONS
Policy DecisionsFor detailed information on 2016-17 Budget Infrastructure Policy Decisions, refer to chapter 6 of this Budget Paper.
Parameter Adjustments
Health and Human Services
Movements in Health and Human Services primarily reflect the reallocation of cash flow estimates for the Royal Hobart Hospital Redevelopment.
State Growth
Movements primarily reflect the reallocation of funding from Non-financial Asset Purchases to Infrastructure Maintenance Expense to more accurately reflect actual expenditure trends over the past four financial years. Movements in 2015-16 and 2016-17 also reflect updates to the timing of funding receipts from the Australian Government for the Roads Program.
76 2016-17 Budget and Forward Estimates