Embed Size (px)
Citation preview


EDITORIAL Technically three volumes, each consisting of four issues (except in the first year) have been released successfully.
Now the issue of the fourth volume has commenced. This has happened with the kind cooperation of the college management, members of editorial and advisory boards, content management and technical teams, authors and readers. Some improvement or the other has been made in every issue. In this issue also certain improvements have been made.
After a careful scrutiny and peer review eight articles have been selected for publication in this issue.
The first article is on the “effect of the use of derivative instruments on stock returns.” For the purpose the author has selected a few banks both from emerging and recently developed countries. The data collected for the purpose were relating to the period 2003-2009. The finding rejects the usual hypothesis by showing a negative effect of derivatives on performance.
Cricket is a passion, cricket players are idols and idolatry is used by the business. As a result we see different cricketers endorsing different brands. But for how long they continue to do that? They retire, they fade out and they lose the business. Businesses keep on studying the impact of the players and consider changing them when a better alternative is available.
Sachin is a great player, has excelled many and created history. After a long and fruitful innings he did retire from cricket on 16th November 2013. For the services rendered by him to the game and to the country he has been honoured by the Government of India with “Bharat Ratna”. At the time of retirement he was endorsing about 16 brands. Naturally a doubt arises in the minds of many as to how long Sachin continues to endorse effectively those brands. The second article titled “Visualising ‘Brand Sachin’ Beyond His Retirement” tries to clarify their doubt to some extent.
The third article selected for publication is “Personal Finance Management Practices and the Financial Stability of Tertiary Level Student Community.” In that the authors contended that there are many studies which have attempted to find a link between financial behaviour and financial well-being of the people. They further contended that those studies were mostly confined to know how the financial literacy of the individuals has been translated into the personal financial management practices. Hence the authors, for the purpose of their study, have selected tertiary level students, who are on the brink of beginning their careers and whose incomes are fixed, to find out the impact of financial management practices on financial stability.
The fourth article is on positive psychological intervention. In that the author has taken the positive psychology concept introduced by Martin Seligman and applied to the job seekers. He opines that a positive approach to the management graduates would be better received and more effective. He takes a positive psychology approach to job seekers, focusing on leveraging their strengths and talents for organizational success and suggests that it is better to focus on their career opportunities rather than focusing on the problems associated with mismanagement of the careers.
Risk-taking is an important dimension of organizational culture. Today, organizations regard risk-taking as a means of dealing with problems and finding solutions to those problems. Multiple factors influence the risk-taking propensity of an employee at the work place. The fifth article, selected for publication, is on risk-taking propensity of employees in a teaching hospital. In that the authors have examined the factors that support and the factors that discourage risk-taking attitude of the employees in the hospital and correlated risk-taking propensity with other important dimensions of organizational culture.
Emotional competence is the ability to understand, use, manage and express one’s emotions. It is the skill to recognize an individual’s own emotions adequately and respond to other’s emotions appropriately. The work atmosphere will be productive and supportive when the people are emotionally competent. Now-a-days, it has become a precept for hiring companies, especially in service sector, to measure the emotional competence of the individuals for ensuring that the selected candidates best fit in the position. In the sixth article, the authors tried to identify emotional competence proficiencies in personal selling with particular reference to salesmen in Chennai city and identified that exciting acceptability and moral emotional flexibility as the most dominant emotional competence proficiencies among the sales people of insurance, banking, communication and automobile sectors.
In the seventh article the author has focused on the impact of stress on Organizational Commitment among Officers and Jawans of the Indian Army. For this purpose the Organizational Commitment Instrument and Stress Questionnaire were administered on randomly selected Officers and Jawans. Regression Technique was used to see the impact of stress on Organizational Commitment of the Officers and the Jawans. The results revealed that the dimensions of stress, selected for the purpose of the study, have negative impact on Organisational Commitment of the Officers and no impact on Organisational Commitment level of the Jawans. The last article is a case study on marketing. I hope this articles will be useful to the students, scholars, teachers and practitioners of Management.
Punaty Babujee Apparao
Chief Editor

Copyright © 2009 by Gokaraju Rangaraju Institute of Engineering & Technology, Hyderabad
Access any latest information about Gokaraju Rangaraju Institute of Engineering & Technology
(GRIET) http://griet.ac.in from our web site : http://mgmt2day.griet.ac.in
The articles covered in this Journal have been peer reviewed. However, the publisher neither
guarantees accuracy of facts nor accepts any liabilities with respect to the articles printed in this
Journal.
Management Today (An International Journal of Management Studies)
Published by
Gokaraju Rangaraju Institute of Engineering and Technology
Bachupally, Kukatpally, Hyderabad - 500 090.

Management Today (An International Journal of Management Studies)
Contents 1. Effect of the Use of Derivative Instruments on Stock Returns: Evidence
from Banks in Emerging and Recently Developed Countries
Mohamed Rochdi Keffala… … … … … … … … … … … … … … … … … 1-9
2. Visualising ‘Brand Sachin’ Beyond His Retirement: An Application of CBBE Model
Manoharan, S. and John Manohar, S. … … … … … … … … … … … … … 10-13
3. Personal Finance Management Practices and the Financial Stability of Tertiary Level Student Community
Chedza Pelaelo & Prof. B.N. Swami… … … … … … … … … … … … … 14-21
4. A Study on Positive Psychological Intervention towards Job Search Attributes among Management Graduates
Dipesh Gangrade… … … … … … … … … … … … … … … … … … … … 22-27
5. A Study on Factors Supporting Risk-Taking (Rt) Propensity of Employees in a Teaching Hospital
Krishnamurthy Naidu, S., Subbaraju, G. V. and Naveen Kumar, D. … … … … 28-31
6. Identifying Emotional Competence Proficiencies in Personal Selling: A Study with Reference to Salesmen in Chennai City
Ramesh, G. and Vijaya Kumar, G. … … … … … … … … … … … … … … 32-35
7. Impact of Stress on Organisation Commitment of Officers and Jawans; A Study of Indian Army
Nidhi Arora Kumar… … … … … … … … … … … … … … … … … … … 36-41
8. New Product Strategy of M/S Roll Form Industry - Case Study
K. Satya Subram… … … … … … … … … … … … … … … … … … … ... 42-45
Volume 4 Number 1 January-March 2014


1
-----------------------------------------------------------------------------------------------------
Responsibility of Contents of this paper rests upon the authors and
not upon GRIET publications
ISSN: 2348-3989 (Online)
ISSN: 2230-9764 (Print)
Doi: http://dx.doi.org/10.11127/gmt.2014.03.01
pp.1-9
Copyright@GRIET Publications. All rights reserved.
MANAGEMENT TODAY
-for a better tomorrow An International Journal of Management Studies
home page: www.mgmt2day.griet.ac.in Vol.4, No.1, January-March 2014
Effect of the Use of Derivative Instruments on Stock Returns: Evidence from Banks in Emerging and Recently Developed Countries Mohamed Rochdi Keffala
Laboratoire d’Economie et de Finance Appliquée (LEFA), IHEC Carthage, Tunisia. Laboratory of Actuarial and Financial Sciences (SAF, EA2429), Institute of Financial and Insurance Sciences, University Claude Bernard Lyon 1, University of Lyon, France. [email protected]
A R T I C L E I N F O Article history: Received 19.2.2014 Accepted 24.3.2014 Keywords:
A B S T R A C T Considering banks from both emerging and recently developed countries - during the period 2003-
2009 - we aim to investigate the effect of derivatives use on stock returns. Our finding rejects usual
hypothesis by showing a negative effect of derivatives on performance. The main conclusion rejects the
thesis stipulating that derivatives are beneficial for banks
Derivatives Banks Stock Returns Emerging Countries Panel Econometrics
Introduction Banks are very motivated to use financial innovations like derivative instruments especially to make profits and to take advantages, which explain the widespread use and the rapid growth of derivative transactions in the recent decades.
Benefits of derivatives usage are mentioned widely in the literature. In fact, several authors, such as Smith and Stulz (1985), Nance et al. (1993) and Fok et al. (1997) argue that there are three major benefits from using derivatives: reduced taxes under a progressive tax schedule, reduced expected cost of financial distress, and reduced agency cost problems.
However, there is a gap in the literature in studying the effect of derivative usage on bank performance. An overview of the
literature shows that in our knowledge there are only two papers focusing in this topic (Said, 2011; Rivas et al. 2006). However, the last financial crisis has opened a debate about the real effect of derivatives on bank. For this reason, we are motivated in this paper to test the effect of derivatives on bank performance. We focus on financial performance measured by stock returns. Our contributions regarding the literature consist on choosing banks from emerging countries. However, in order to enlarge the sample size we introduce banks from a group of countries that were considered few years ago as emerging countries (such as Cyprus, Estonia, South Korea) and which we call recently developed countries. Indeed, this paper will be the first to combine banks from emerging and recently developed countries, and also to study the effect of derivatives on stock returns.
According to literature, principal findings reveal that by using derivatives banks improve their performance. Said (2011) found that derivatives usage affect positively performance of US banks. Rivas et al. (2006) deduced an increase of Latin American bank efficiency due to derivatives use. Contrarily to literature results the findings of the paper show that derivatives use has negative effect on main results expose that derivatives usage decreases bank performance.
The rest of the article is organised as follows. Section 1
Effect of the Use of Derivative Instruments on Stock Returns: Evidence from Banks in Emerging and Recently Developed Countries
2
represents a background of the theoretical and empirical literature concerning the association between the use and performance of derivative instruments. Section 2 describes the methodology of the paper. Section 3 analyses the empirical result. Finally, conclusion with policy implications is made. 1. Literature Background
1.1. Theoretical Literature Review and Results
Literature investigating the effect of derivative use on bank performance is limited to few papers.
In his study Said (2011) explores how the use of derivatives by US banks have impacted their performance (measured by return on assets ratio, return on equity ratio, efficiency ratio, cost of funding earning assets, and net interest margin). He found a positive correlation between accounting performance measures and usage of derivatives.
Furthermore, investigating whether the use of derivatives by banks in Latin America affect their efficiency (measured by Data Envelopment Analysis), Rivas et al. (2006) conclude that bank’s efficiency increases with the use of derivatives.
Brewer et al. (2000) study the relationship between lending and derivatives use over the period from the fourth quarter of 1994. They explain how the association between BHC lending and their use of interest rate derivatives can be measured by examining the relationship between the growth in BHC business loans and their involvement in interest rate derivative markets. They find that banks using derivatives increase their business lending faster than banks that do not use derivatives. Moreover, they deduce that large banks are much more likely than small banks to use derivatives. They argue that there is an agreement with the idea that there is a fixed cost associated with initially learning how to use derivatives and large banks are more willing to incur this fixed cost because they are more likely to use a larger amount of derivatives.
The findings of Brewer et al. (2001) show that U.S. interest-rate derivatives users do not increase significantly their accounting profits defined by return in asset and return on equity ratios in the 1986 to 1994 period.
Finally, and in opposite to previous studies Sinkey and Carter (2000) deduce that U.S. bank users of derivatives have lower net interest margin than non-users.
Compared to these past studies, this current paper contributes to the literature by focusing on banks principally from emerging countries and by examining the effect of each derivative instrument on bank performance.
1.2. Empirical Literature Review
Brewer et al. (2001) have used a widely two-index market model to characterize the return generating process for bank common stocks in order to explore the impact of U.S. interest-rate derivatives usage on accounting profits This model is an extension of single index market model in which capital market risk sensitivity can be represented by the equity “beta” or the measured sensitivity of the firm’s equity return with respect to the return on the market-wide portfolio of risky assets. They examine other determinant of stock return which is unanticipated changes in interest rates during the entire period is from January 1986 to December 1994.
Brewer et al. (2000) study the relationship between lending and derivatives use over the period from the fourth quarter of 1994. To this end, they employ a basic model which relates C&I lending to previous quarter capital to total assets ratio and C&I charge offs to total assets. They add to the base model indicators for participation in any type of interest rate derivatives. The derivative-augmented regressions indicate that banks using any type of interest rate derivative, on average experience higher growth in their C&I loan growth. The net impact of derivative usage complements the C & I lending activities of banks.
Rivas et al. (2006) have used two-step OLS regressions to study the effect of derivatives use on bank efficiency in order to investigate how the use of derivatives by banks in Latin America affect their efficiency. In the first stage, the efficiency scores are obtained on a variable representing derivatives usage and control variables that have been documented to affect efficiency scores. In this regression, efficiency measure represents the efficiency scores of Latin American banks obtained from the DEA model of the first stage. They have introduced dummy variable measuring derivatives usage, which take the value of 1 if a bank uses derivatives, 0 otherwise. If Latin American banks are using derivatives to hedge, a positive relation between derivatives usage and the efficiency score of Latin American banks is expected, and if the coefficient for derivatives measure is insignificant, it indicates that derivatives usage does not affect the efficiency of Latin American banks. The second stage regress efficiency within control variables. These variables are represented by the loans portfolio of the bank, which is a proxy for asset diversification, plays an important role in determining risk and hence, on average banks with small loan portfolios are required to maintain much higher capital levels. Therefore, they expect a positive relation between the size of the loans portfolio and the efficiency of Latin American banks. As control variable a measure of banks equity ratio adequacy is introduced in the model. They argue that lower equity ratio levels imply a higher risk-taking propensity and greater leverage, which could result in greater borrowing costs. Thus, they expected a positive relation between equity ratio and the efficiency of Latin American banks. They add to the model a proxy of the size. They are based in the theory that predicts that large well-diversified banks will be less likely to fail than small banks. Bank size serves as a proxy for a bank’s ability to diversify since large banks have better diversified asset portfolios. Finally, they incorporate in the model as control variable the economic freedom index that the Heritage Foundation calculates on a yearly basis. The index represents an average of 10 individual factors that allows one to classify countries as free, mostly free, mostly unfree, or repressed.3 According to this index, Brazil and Mexico are classified as “mostly unfree” while Chile is classified as “mostly free.” They suggest that Thus, economic freedom index defined as a dummy variable takes a value of 1 if the country is “mostly unfree” (Brazil and Mexico) or 0 if it is mostly free (Chile).
In his study Said (2011) looks into the effect of the use of derivatives on U.S. banks performance during the sample period from 2002 to 2009. He has employed a two stages OLS regressions approach to determine the effect of the use of derivatives on US bank performance. They measure bank performance by the ratio of return on assets, the ratio of return on equity, the efficiency ratio, cost of funding earning assets, and net interest margin. While the objective of the second stage to examine the sensitivity of performances ratios within these five

Management Today Vol.4, No.1 January-March 2014
3
banks to the use of derivatives. After calculating the performances ratios for these banks the author uses the regression model to measure the sensitivity of the performances ratios to the usage of derivatives between independent.
Following most of previous papers (Rivas et al., 2006; Said, 2011), this current work also uses panel regression model to estimate the effect of using derivatives in bank performance. Much details of the methodology adopted in this present study is developed in the next section.
2. Methodology
2.1. Data Description
Daily stock prices from DataStream1 were used to determine daily stock returns (Brown and Warner 1984; Buyusalvarci, 2010) on individual bank using the formula as defined in Equation (1) in the first subsection of the first part. Moreover, yearly accounting data drawn from bank websites (see Table 2) are used to determine control variables. All data cover the period 2003-2009.
2.2. Sample Description
The sample is composed by banks from both emerging and recently developed countries. Emerging countries are defined according to the list of countries announced by the United Nations Office in 2010. Countries having Human Development Index less than 0.784 are classified as emerging countries and more than this index countries are considered as developed countries. On the other hand, during the last decade countries like Czech Republic and Singapore were considered as emerging countries but now-a-days they are called developed countries according to the United Nations Office. In this article, we decide to introduce these countries in order to enlarge the sample composed of emerging banks and because we think that specificities of such countries still close to those of emerging countries. Table 1 presents this classification and also exposes the list of banks and their countries (as well as hyperlinks to bank web sites).
Table-1: Countries Classification and Banks
Emerging countries Recently developed countries Bulgaria Bahrain Raiffiensen Bank Bulgaria Ahli United Bank B.S.C. Chile United Gulf Bank Banco de Chile Cyprus Croatia Bank of Cyprus Erste & Steiermärkische Bank D.D
Hellenic Cyprus Bank
Privrednabanka banka Zagreb
Czech Republic
Zagrebacka Banka Komerční banka Indonesia Raiffensenbank Bank Danamon Estonia Jordan Swedbank Capital Bank Hong Kong Jordan Ahli Bank Bank of East Asia Jordan Kuwait Bank Chong Hing Bank Kazakhstan DAH SING Bank
1.
op. cit. page No. 10
Halyk Bank Fubon Bank Kuwait Hang Seng Bank Burgan Bank Wing Hang Bank Gulf Bank Kuwait Israel Malaysia FIBI Bank CIMB Bank Bank Hapoalim EON Bank Poland Mauritius Bank BPH S.A. MCB Bank Pekao S.A Oman PKO Bank Polski Muskat Bank Bank Zachodni WBK Latvia BRE Bank DNB Nord Banka Kredyt Bank S.A. Lebanon Nordea Bank Polska S.A. BLOM Bank SAL Qatar Lithuania Commercial Bank of Qatar ŠIAULIU BANKAS Qatar National Bank Swedbank Singapore Pakistan DBS Bank United Bank Limited United Overseas Bank Philippines Slovakia Philippine National Bank Dexia banka Slovensko a.s
Výročná správa Russia Tatra banka Gazprombank Slovenia TransCreditBank Abanka Vipa d.d. Slovenska Saudi Arabia South Korea Arab National Bank Industrial Bank of Korea Saudi British Bank Korea Exchange Bank South Africa Taiwan ABSA Bank Hua Nan Commercial Bank Capitec Bank Mega International Commercial
Bank FirstRand Ltd. Taiwan Business Bank Imperial United Arab Emirates Sasfin Bank National Bank of Abu Dhabi Thailand Bangkok bank Bank of Ayudhya Kasikorn Bank Krung Thai Bank Turkey Akbank Anadolubank Anonim Sirketi Garanti Bankasi Sekerbank
In total, the sample analysis is defined by 74 banks, in which 39 banks are from emerging and 35 banks from recently developed countries. Banks are spread over 34 countries regrouped as emerging and recently developed. There are 20 emerging countries and 14 recently developed countries. Additionally, the sample also includes 10 dealer banks, which represent 13.51% of the total banks2.
Table 2 presents the number of banks per derivatives
2 ABSA Bank, Bank Hapoalim; BRE Bank; EON Bank, FirstRand
Lt, Hang Seng Bank, Hellenic Cyprus Bank, Industrial Bank of Korea, PKO Bank Polski; United Bank Limited

Effect of the Use of Derivative Instruments on Stock Returns: Evidence from Banks in Emerging and Recently Developed Countries
4
instruments used. In terms of the research sample, with the exception of Sasfin Bank, each bank made use of forwards. Swaps were the second most used instruments with 68 banks. Moreover, less than three quarter of banks was involved in using options (71.62%), while only 47.30% of banks used futures. In general, the two most commonly used instruments were forwards and swaps, which were utilized simultaneously by 90.54% of all banks.
Table-2: Number and Percentage of Banks per Derivative Instruments Used
Instruments Number of banks Percentage FWD+SWP+OPT+FUT 33 44.59% FWD+SWP+OPT 53 71.62% FWD+SWP+FUT 34 45.95%
FWD+OPT+FUT 33 44.59% SWP+OPT+FUT 33 44.59% FWD+SWP 67 90.54% FWD+OPT 53 71.62% FWD+FUT 35 47.30% SWP+OPT 53 71.62% SWP+FUT 34 45.95% OPT+FUT 33 44.59% FWD 73 98.65% SWP 68 91.89% OPT 53 71.62% FUT 35 47.30%
Details in derivative instruments statistics are presented in
Table-3.
Table-3: Description of Derivative Notional Amounts* Per Year
Year FWD %FWD SWP %SWP OPT %OPT FUT %FUT FWD+SWP
+OPT+FUT
%(FWD+OPT
+SWP+FUT) Total assets
2003 321,596 28.01 485,789 42.32 150,708 13.12 113,856 9.91 1,071,951 9.33 1,147,832
2004 402,721 32.24 1,233,533 98.75 192,536 15.41 107,732 8.62 1,936,524 155.03 1,249,051
2005 424122 29.86 1,663,470 117.13 240,992 16.96 72,757 5.12 2,401,343 169.09 1,420,152
2006 522,915 31.37 1,677,291 100.63 377,267 22.63 106,546 6.39 2,684,020 161.03 1,666,774
2007 882,704 46.44 2,077,909 109.32 401,023 21.10 68,734 3.61 3,430,371 180.48 1,900,630
2008 1,275,447 58.12 2,216,431 101.00 471,583 21.49 70,472 3.21 4,033,934 183.83 2,194,374
2009 1,196,193 52.58 2,005,044 88.13 273,497 12.02 67,191 2.95 3,541,927 155.69 2,274,954
Total 5,025,700 42.39 11,359,470 95.83 2,107,610 17.78 607,292 5.12 1,9100,074 161.13 11,853,771
* Amounts are in USD millions. Percentages are with respect to total assets.
From Table 3 statistics show that the amount of derivative instruments represents 161.13% of total assets covering the period of the study from 2003 to 2009, and with an average bank size of approximately $12 billion. During the study period swaps are the most represented instruments with notional amount equals to 11359470 million USD, with a percentage equals to 95.83% of total assets, followed by forwards with percentage equals to 42.39% of total assets, then options with a percentage equals to 17.78% of total assets, and finally futures represent
only 5.12% of total assets. Statistics per year indicates that the highest notional amount of instruments traded is swaps defined by 117.13% of total assets in 2005. In contrast, the lowest percentage is referred to futures in 2009 by 2.95% of total assets.
2.3. Variables description
Table 4 presents variables employed in this analysis with their labels, definitions, proxies, expected signs and references are described.
Table-4: Description of Variables
Labels Definition Proxy for Expected
Sign References
Dependent Variable
SR Stock returns Financial
performance +
Brown and Warner (1984); Buyuksalvarci (2010)
Independent Variables Derivative instruments
FWD Notional value of forwards divided by total assets Forwards + Chaudhry et al. (2000)
SWP Notional value of swaps divided by total assets Swaps + Chaudhry et al. (2000);
Reichert and Shyu (2003)
OPT Notional value of options divided by total assets Options + Chaudhry et al. (2000);
Reichert and Shyu (2003) FUT Notional value of futures divided by total assets Futures + Chaudhry et al. (2000)
Control variables
CAP the ratio of book-value-equity-to-total-assets Capital + Chaudhry et al. (2000);
Reichert and Shyu (2003)
LIQ the ratio of liquid-assets-to-total-assets Liquidity + Chaudhry et al. (2000);
Reichert and Shyu (2003) LOAN the ratio of gross-loans-to-total-assets Risky assets - Chaudhry et al. (2000)
CR the ratio of loan-loss-reserves-to-gross-loans Credit risk - Chaudhry et al. (2000);
Reichert and Shyu (2003) NIM The difference between total interest income and total Net interest margin + Chaudhry et al. (2000);

Management Today Vol.4, No.1 January-March 2014
5
interest expense expressed, as a percentage of total assets. Reichert and Shyu (2003) NONI
M Non- interest income
on-balance sheet interest rate risk
+ Fraser et al. (2002)
SIZE Natural log of total assets Bank size + Chaudhry et al. (2000) ;
Reichert and Shyu (2003) Dummies
DEAL 1 if bank is a member of the International Swaps and
Derivative Association (ISDA), 0 otherwise Dealer + Chaudhry et al. (2000);
COUNTRY
Dummy variable equals 1 when bank is issued from, 0 otherwise
Country variable ? Agusman et al. (2008)
The dependent variable is defined by stock return as measure of financial bank performance.
The independent variables in this study can be divided into three groups. The first group are the four derivative instruments, FWD, SWP, OPT and FUT, which define respectively Forwards, Swaps, Options, and Futures. The second group are control variables, defined by CAP, LIQ, LOAN, CR, NIM, NONIM and SIZE, which define capital, liquidity, gross loan, loan loss reserve, net interest margin, non-interest income and bank size, respectively. The last group is defined by dummy variables, expressed by DEAL and COUNTRY, which designate the country variable of each bank.
The expected sign column corresponds to the sign found in the literature cited in the reference column. For instance, the sign of the relationship between the bank performance and the use of financial derivatives is found to be positive in most of the studies of the literature.
The country dummy variable is introduced in order to identify the specificity of each country. The dichotomous variable (DEAL) takes a value one for dealer banks and zero otherwise. According to Chaudhry et al. (2000) DEAL is introduced in order to differentiate between the risk exposure of dealer banks and non-dealer banks.
2.4. Testing Hypotheses and Expected Results
Literature results (Rivas el al. 2006; Said, 2011) indicate a positive effect of derivative instruments use on bank performance. Hence, our hypothesis stipulates that the use of derivative instruments affects positively performance measure.
Following the thesis stipulating that possessing considerable liquid assets in portfolios means generally that banks are healthy, so we anticipate a positive association between the variable proxy of liquidity and bank performance.
According to Rivas et al. (2006) the variable LOAN which measures the loans portfolio of the bank plays an important role in determining risk and hence, on average banks with small loan portfolios are required to maintain much higher capital levels than banks with large portfolios, and this reduces the banks’ ability to perform efficiently. Thus, we expect a positive relation between the size of the loans portfolio (LOAN) and bank performance.
Since it is considered as the proxy of credit risk (CR), we expect a negative effect of credit risk on bank performance.
Theory states that high levels of equity ratio leads to higher efficiency. Casu and Molineux (2003) argue that lower equity ratio levels imply a higher risk-taking propensity and greater leverage, which could result in greater borrowing costs. Thus, a
positive relation between the variable measuring equity ratio (CAP) and bank performance is expected (Rivas et al., 2006).
Theory also predicts that large well-diversified banks will be less likely to fail than small banks (Rivas et al., 2006). Bank size serves as a proxy for a bank’s ability to diversify since large banks have better diversified asset portfolios (Shyu and Reichert, 2002; Mester, 1993). Thus, a positive relation between bank stock return and bank size (SIZE) is expected.
Net interest margin (NIM) is used in the study of Said (2011) as a performance measure, so we forecast a positive correlation between net interest margin and performance.
According to Fraser et al. (2002) the proxy of interest rate risk (NONIM) has a positive effect on bank risk, so we by analogy we presume a negative effect of non-interest income on performance.
Ultimately, the sign of the dummies on bank performance is not expected.
2.4. Empirical Model
The aim is to test empirically the relationship between financial performance and derivative instruments. Then, panel data methodologies are used to estimate the parameter values. The empirical model is defined by Equation (1),
Performance measurei,t = γ0+ γ1 FWDi,t + γ2SWPi,t + γ3 OPTi,t + γ4 FUTi,t + γ5 CAPi,t + γ6 LIQi,t + γ7 LOANi,t + γ8 CRi,t + γ9 NIMi,t + γ10
NONIMi,t + γ11 SIZEi,t + γ12 DEALi,t +
K
k 1 γ13,k COUNTRYi,t,k + ui + ei,t, (1)
in which Performance measure is determined by daily stock returns of bank i and which indicates for financial performance; (ui + ei,t) is the composite error term; ui is the random error in which bank unobserved heterogeneity is specifically; and ei,t is the remaining random error term. The computer software STATA 10 was used to estimate all regressions.
2.5. Specification Tests
Firstly, the stationarity of all the variables is checked using the Augmented Dickey Fuller tests with zero to four lags, with and without trend, and finally with and without constant. Then, the stationarity is also checked using unit Phillips-Perron (1988) root tests test and Elliott, Rothenberg, and Stock (1996) DF-GLS test. Correlations between variables and collinearity are checked by correlation matrix and multicollinearity test. Moreover, the linearity of the model is tested for with Ramsey (1969) RESET Test. In addition, a normal hazard of residuals is finally examined with Jacques-Bera Test. Hausman (1978) test is applied to

Effect of the Use of Derivative Instruments on Stock Returns: Evidence from Banks in Emerging and Recently Developed Countries
6
examine the absence of correlation between the independent variables and the error terms which confirms the choice of random effect model. Lastly, the homoskedasticity of models is examined by Modified Wald test for group wise heteroskedasticity test and Breusch and Pagan Lagrangian multiplier test.
3. Empirical Results
3.1. Regression Analysis
In Table 5 the parameter estimates from Equation (1) are described.
Table-5: Estimated Coefficients, Years 2003--2009
Stock Returns
Parameter Estimate St. Err.
Constant 0.008176*** (0.0013631) FWD NS NS SWP -0.0001086* (0.0000583) OPT NS NS FUT NS NS CAP -0.0083051*** (0.0027816) LIQ NS NS
LOAN -0.0051295*** (0.0011274) CR NS NS
NIM 0.0054379* (0.0029234) NONIM NS NS
SIZE -0.0003781*** (0.0000807) DEAL NS NS
Country See details of the country dummies in Appendix
III. R-squared 0.1205 F statistic 5.57***
Number of obs.
518
*, ** and *** indicate statistical significance at the 10%, 5% and 1% level, respectively.
The variable that are insignificant were removed and the model was re-estimated to get more precise results. Consequently, no parameter values are provided for these variables.
( ) indicates standard deviation of the estimators.
NS indicate non-significance of coefficient.
Years 2003-2009.
As regards control variables, at a level of significance equals to 1%, the variable proxies of risky assets (LOAN), capital (CAP), and bank size (SIZE) affect negatively the performance measure. Thus, contrarily to theory stipulating that the size of banks influences positively bank performance, the size of our sample banks decrease bank performance. This finding suggests that smaller banks have better performance than large banks which is relative to our sample banks. However, the performance is measured by the share returns. Since small firms are riskier than large firms, an excess return due to risk premium can explain a higher return for small banks. Similarly, and in the opposite of expectations, the book equity ratio measured by the percentage of capital on total assets (CAP) affects negatively performance. This finding means that our sample banks do not use in the better
way their capital to enhance their performance. Again, this can be justified by a smaller risk for greater (in percentage) capital bank. However, and according to expectations the proxy of risky assets (LOAN) influences negatively performance. In fact, higher level of the risky assets ratio means that performance is badly affected.
In contrast, net interest margin has a positive effect on stock return performance at a level of significance equals to 10%.
3.2. Specification Tests Results
The results of the Augmented Dickey Fuller Test, Phillips-Perron test, and DF-GLS test rejects the null hypothesis of unit root at 1% significance level for all the specifications which corroborates the stationarity of variables.
Due to the large number of observations (around 520), the non-normality of the errors terms should not affect the results. However, Error! Reference source not found. schematizes the probability density of residuals.
Table 6 verifies the linearity of the model basing on Ramsey-Reset Test (see Appendix V.c. for more details).
Table-6: Ramsey-Reset Test
Dependent variable chi2(1) Prob > chi2 Stock returns (SR) 2.28 0.32
In addition, the correlation structure of the regressors is examined. The correlation matrix between the regressors is provided in Table a, in Appendix. Even if some correlations are significant, they are not large enough to cause any co-linearity problem. To corroborate this finding, a test for multicollinearity is done. A detection-tolerance or the variance inflation factor (VIF) for multicollinearity can be defined as follows:
Tolerancej = 1-Rj2, VIFj = 1/Tolerancej
where Rj2 is the coefficient of determination of a regression of explanatory variable j on all the other explanatory variables. A tolerance of less than 0.20 or 0.10 and/or a VIF of 5 or 10 and above indicates a multicollinearity problem (see O'Brien 2007). The results are summarized in Table 7.
Table-7: Multicollinearity test
Variable VIF 1/VIF Size 15.44 0.064783 Loan 13.00 0.076903 Cap 3.17 0.315864 Liq 1.99 0.502093
Swp 1.69 0.590076 Nonim 1.45 0.690491
Fwd 1.42 0.702949 Opt 1.40 0.712053 Cr 1.31 0.763757
Fut 1.21 0.823285 Mean VIF 4.21
From these results we can deduce an absence of multicollinearity problem.
Table 8 summarizes Hausman test results.

Management Today Vol.4, No.1 January-March 2014
7
Table-8: Hausman Test
Dependent variable chi2(1) Prob > chi2 Stock returns (SR) 67.67 0.0000
From Table 8 results reject the absence of correlation between the independent variables and the error terms. Therefore, fixed effect model is used in this analysis.
Finally, a modified Wald test for groupwise heteroskedasticity in fixed effect regression model is made:
Table-10: Modified Wald test for groupwise heteroskedasticity
Dependent variable chi2(137) test statistic P value Stock returns (SR) 5488.09 0.0000 *
The results in Table 10 reject the null hypothesis of homoskedasticity (i.e. constant variance). (Therefore, we add the option ‘robust’ in STATA in the fixed effect model regression in order to control for heteroskedasticity.)
4. Summaries and Discussion
Findings indicate that the use of swaps decreases financial performance in terms of stock returns, while forwards, options and futures have no significant effect on performance. Comparing to literature results which show an increase of performance by using derivatives, and knowing that most of past studies are focusing in banks from developed countries, we can say that in our study banks from emerging and recently developed countries manage bad the use of forwards. As an example, large losses occur in Tunisian banks when they started to use financial derivatives.
As concerning control variables, the proxy of capital decreases financial performance since its negative effect on stock return, this rejects the usual findings of the literature. In addition, the variable used as proxy of risky assets affects negatively performance given that its negative correlation with stock returns, so that the usual findings are also rejected. Furthermore, bank size decreases bank performance because of its negative impact on stock return. This result contradicts the theory that bank size augments financial performance. This would be explained by riskier firms display an excess return due to risk premium.
The difference in results between emerging countries and developed countries can be explicated by the fact that large banks in developed countries take advantage from government encouragements and rescue so that size in such countries affects positively performance.
Finally, and accordingly to expectation net interest margin increases financial performance.
For the other control variables, results show that their impact on financial performance is not comprehensible.
The variables proxies of on-balance sheet interest rate risk, credit risk, liquidity and the dummy defining the dealer bank results are not significant.
We deduce that the ratio of non-interest income which is a measure of on-balance sheet interest rate risk does not affect the relationship between derivatives use and stock returns, so on balance-sheet interest risk does not influence the effect of
derivative use on performance.
We can conclude also that credit risk does not play a significant role in studying the relationship between derivative use and performance. Equally, the proxy of liquidity does not contribute significantly to study the effect of derivatives use on performance.
For the variable defining dealer bank, we deduce that there is no difference in the effect on stock returns between dealer and no dealer, so the introducing of dealer dummy variable in the model seems to be not necessary because of its insignificant effect.
In summary, the main results indicate that swaps decrease financial performance, whereas the other instruments have no significant effect on financial performance.
The evidence deduced from these results is that swaps are used for speculation purpose which explains its negative impact on performance. It appears also that in term of stock return the use of derivatives by sample bank is not favourable.
Conclusions
The purpose of this work is to explore the relationship between derivatives use and bank performance. We are interested to financial performance measured by stock returns on sample Also, several control variables are included in the model in order to affine regressions. The results of panel regressions data from 2003 to 2009 on banks from both emerging and recently developed countries indicate that generally derivatives decrease bank performance.
This finding contradicts literature results. This can be explicated by the specificity of our sample compared to literature which is limited to essentially banks from developed countries. As implication we can deduce that developed countries manage well derivatives in term of performance compared to banks from emerging and recently developed countries. Thus, the common opinion of many authors supporting that derivative instruments are beneficial for banks should be revised.
In the end, further papers should investigate the effect of derivatives on other bank performance measures and compare banks from emerging and developed countries.
References
Agusman, A., G. S. Monroe, D. Gasbarro, J.K. Zumwalt, 2008. Accounting and capital market measures of risk: Evidence from Asian banks during 1998–2003. Journal of Banking and Finance 32, 480–488.
Ameer, R., .Determinants of Corporate Hedging Practices in Malaysia. International Business Research, vol. 3, No. 2; April 2010.
Allayannis, G., Lel, U., and Miller P.D., 2011. The use of foreign currency derivatives, corporate governance, and firm value around the world. Journal of International Economics.
Allayannis, G, and J. P. Weston, 2001. The use of foreign currency derivatives and firm market value. Review of Financial Studies, 14, 243-276.
Bartram, S., M., G., W. Brown, J. Conrad, 2006. The Effect of derivatives on firm performance and value. Journal of

Effect of the Use of Derivative Instruments on Stock Returns: Evidence from Banks in Emerging and Recently Developed Countries
8
Financial and Quantitative Analysis.
Berger A. N., G. R.G. Clarke, R. Cull, L. Klapper, G. F. Udell, 2005. Corporate governance and bank performance: A joint analysis of the static, selection, and dynamic effects of domestic, foreign, and state ownership. Journal of Banking and Finance 29, 2179–2221.
Bonin, J. P., I. Hasan and P. Wachtel, 2004. Bank performance, efficiency and ownership in transition countries. BOFIT, discussion papers, 2004, No. 7.
Boubakri, N., J.C Cosset, K. Fischer and O. Guedhami, 2005. Privatization and bank performance in developing countries. Journal of Banking and Finance 29, 2015–2041.
Brewer, E., W.E. Jackson, and J. T. Moser, 2001. The Value of Using Interest Rate Derivatives to Manage Risk at U.S. Banking Organizations. Federal Reserve Bank of Chicago Economic Perspectives, 49-66.
Brewer, E., Minton, B. A., and Moser, J.T., 1999. Interest-rate derivatives and bank lending. Journal of Banking and Finance 24, 353-379
Carter, D. A. and J. F. Jr. Sinkey, 1998. The use of interest-rate derivatives by end users: the case of large community banks. Journal of Financial Services Research 14, 17-34.
Casu, B. and P. Molyneux, 2002. A comparative studies of efficiency in European banking. Working paper.
Chaudhry, M. and A. Reichert, 1999. The impact of off-balance sheet derivatives and interest rate swaps on bank risk. Research in Finance 17, 275-300.
Chaudhry, M.K., R. Christie-David, R., T.W. Koch, and A.K. Reichert, 2000. The risk of foreign currency contingent claims at us commercial banks. Journal of Banking and Finance 24, 1399-1417.
Choi, J., Elyasiani, E., 1997. Derivative exposure and the interest rate and exchange rate risks of U.S. banks. Journal of Financial Services Research 12, 267-286.
Cyree, K. B., P. Huang, 2006. The Effects of Derivatives Use on Bank and Dealer Value and risk. Refereed Paper presented at Financial Management Association Meeting, Salt Lake City, Utah in October 2006.
Elliott, G., T. J. Rothenberg, and J. H. Stock. 1996. Efficient tests for an autoregressive unit root. Econometrica 64: 813–836.
Fauver, L. and A. Naranjo, 2010. Derivative usage and firm value: The influence of agency costs and monitoring problems. Journal of Corporate Finance 16, 719–735.
Fok, R.C.W., C. Carroll, and M.C. Chiou, 1997. Determinants of corporate hedging and derivatives: a revisit. Journal of Economics and Business 49: 569-585.
Frei, F, X., Kalakota, R., Leone, A., J., and Marx, L., M., 1999. Process variation as a determinant of bank performance: Evidence from the retail banking study. Management Science 45 (9), 1210-1220.
Froot, K. A., D. S. Scharfstein, and J. C. Stein, 1993. Risk Management: Coordinating Corporate Investment and Financing Policies. Journal of Finance 48, 1629-1658.
Gunther, J.W. and T.F. Siems, 1996. The likelihood and extent of bank participation in derivatives activities. Financial Industries Studies, Federal Reserve Bank of Dallas Working Paper.
Hausman, J. A. (November 1978). "Specification Tests in Econometrics". Econometrica 46 (6): 1251–1271.
Hirtle, B., 1997. Derivatives, portfolio composition, and bank holding company interest rate risk exposure. Journal of Financial Services Research 12, 243-266.
Kapitsinas, S., 2008. The Impact of Derivatives Usage on Firm Value: Evidence from Greece. Working paper.
Lin, X. and Zhang, Y., 2006. Bank ownership reform and bank performance in China. Journal of Banking and Finance (2008).
Liu, T. K., 2010. An empirical study of firms’ merger motivations and synergy from Taiwanese banking industry. International Research Journal of Finance and Economics, 38.
Mayers, D. and C. W. Smith, 1982. On the corporate demand for insurance. Journal of Business 55, 281-296.
Mayers, D. and C. W. Smith, 1987. Corporate insurance and the Underinvestment problem. Jounal of risk and insurance, 54. 45-54.
Merton, R., 1992. Financial innovation and economic performance. Journal of Applied Corporate Finance 4, 12-22.
Merton, R., 1995. Financial innovation and the management and regulation of financial institutions. Journal of Banking and Finance 19, 461-481.
Mester, L., 1993. Efficiency in the saving and loan industry. Journal of Banking and Finance 17, 267-286.
Miller, K. D., 1992. A Framework for Integrated Risk Management in International Business. Journal of International Business Studies, Second quarter, 311-331.
Minton, B., R., Stulz, and R.,Williamson, 2009. How Much Do Banks Use Credit Derivatives to Hedge Loans? Journal of Financial Services Research, 35(1), 1-31.
Nance, D.R., C.W. Smith, Jr., and C.W. Smithson 1993. On the determinants of corporate hedging. Journal of Finance 48, 267-284.
Nguyen, H. and R. Faff, 2007. Are financial derivates really value enhancing? Australian evidence. Working paper in Accounting, Finance, Financial Planning and Insurance Series.
O'Brien, Robert M. 2007. A caution regarding rules of thumb for variance inflation factors. Quality and Quantity 41(5), 673-690.
Phillips, P.C.B. and P. Perron (1988). “Testing for Unit Roots in Time Series Regression,” Biometrika, 75, 335-346.
Ramsey, J.B. (1969) "Tests for Specification Errors in Classical Linear Least Squares Regression Analysis", Journal of the Royal Statistical Society, Series B., 31(2), 350–371.
Reichert, A. and Y. W. Shyu, 2003. Derivative activities and the risk of international banks: A market index and the VaR approach. International Review of Financial Analysis 12, 489-511.

Management Today Vol.4, No.1 January-March 2014
9
Rivas A., T. Ozuna, and F. Policastro 2006. Does the Use of Derivatives Increase Bank Efficiency? Evidence from Latin American Banks. International Business & Economics
Research Journal, 5 (11) 47–56.
Said, A. 2011. Does The Use of Derivatives Impact Bank Performance? A Case Study of Relative Performance during 2002-2009. Middle Eastern Finance and Economics ISSN: 1450-2889 Issue 11.
Shanker, L., 1996. Derivatives use and interest rate risk of large banking firms. The Journal of Futures Markets, 16, No. 4, 459474 (1996).
Sinkey, J.F., Jr. and D.A. Carter, 2000. Evidence on the financial characteristics of banks that do and do not use derivatives. The Quarterly Review of Economics and Finance 40, 431-449.
Smith, C. and R. Stulz, 1985. The Determinants of firms’ hedging policies. The Journal of Financial and Quantitative Analysis 20, 391-405.
Stout, L., 1995. Betting the bank: How derivatives trading under conditions of uncertainty can increase risks and erode returns in financial markets. Journal of Corporation Law, 21(1), 53.
Appendix
Table a. Matrix of Correlation of the Regressors
sr fwd swp opt fut loan cap
sr 1.0000
fwd 0.0318 1.0000
(0.4701)
swp -0.0207 0.3812* 1.0000
(0.4207) (0.0000) (0.0000)
opt -0.0355 0.2010* 0.3907* 1.0000
(0.4207) (0.0000) (0.0000)
fut 0.0085 0.0213 0.2985* 0.1921* 1.0000
(0.8476) (0.6293) (0.0000) (0.0000)
loan -0.0710 0.0685 - 0.0604 0.0418 - 0.0317 1.0000
(0.1065) (0.1194) (0.1697) (0.3423) (0.4722)
cap 0.0480 - -0.1256* 0.0274 - 0.0853 - 0.0237 - 0.2957* 1.0000
(0.2756) (0.0042) (0.5334) (0.0525) (0.5901) (0.0000)
liq -0.0072 -0.0739 - 0.1253* - 0.0487 - 0.0521 - 0.2037* 0.3009*
(0.8699) (0.0931) (0.0043) (0.2689) (0.2366) (0.0000) (0.0000)

10
---------------------------------------------------------------------------------------------------
Responsibility of Contents of this paper rests upon the authors and
not upon GRIET publications
ISSN: 2348-3989 (Online)
ISSN: 2230-9764 (Print)
Doi: http://dx.doi.org/10.11127/gmt.2014.03.02
pp.10-13
Copyright@GRIET Publications. All rights reserved.
MANAGEMENT TODAY
-for a better tomorrow An International Journal of Management Studies
home page: www.mgmt2day.griet.ac.in Vol.4, No.1, January-March 2014
Visualising ‘Brand Sachin’ Beyond His Retirement: An Application of CBBE Model Manoharan, S.1 and John Manohar, S.2 1Associate Professor and 2Professor, Department of Management Studies and Research, BMSCE, Bangalore. [email protected]
A R T I C L E I N F O Article history: Received 12.3.2014 Accepted 24.3.2014 Keywords: Image Viewership Endorsing Enthusiasts Customer Based Brand Equity Model
A B S T R A C T Cricket, as a game, has become a rage in India. On many occasions, when Indian team plays cricket, the number of people watching those matches surpasses some country’s population. There are a few cricketers in Indian team who have created excellent image for themselves amidst the fans. One such cricketer who is blessed to have fans across the globe is Sachin Ramesh Tendulkar. He has the maximum number of centuries and records to his credit and is a humble and modest human being. He recently retired on 16th November 2013 from all formats of cricket. Cricket as a game is naturally blessed with a break after every over and hence this format suits the marketers/advertisers to associate with cricket. Also the viewership is high for cricket matches. During his retirement Sachin was endorsing about 16 brands across various sectors. As a brand ambassador Sachin brings a lot of attributes to the brand that he endorses. Post his retirement, what would be the impact of Sachin? Whether he would be endorsing more number of brands? These were the questions lingering in the minds of the researchers. A survey was conducted to capture the opinion of the cricket enthusiasts falling under a certain age group (generally youngsters). The survey had questions that would capture the major elements of Customer Based Brand Equity Model by Kevin Lane Keller. Field survey and online survey techniques were used to collect the required information and validate the work.
Introduction Indian National cricket team, governed by Board of Control for Cricket in India (BCCI), played their first match in June 1932. But, cricket was brought into India during the 18th century by the Europeans and the first Indian Cricket Club was established in Kolkata during 1792. The Indian cricket team has a lot of credit to itself, to name a few, winning the world cup more than once, winning the inaugural T20 world cup, rated No.1 Test team and No.2 ODI team currently are all positive indicators of the team’s overall performance. There were great players at different points
in time associated with Indian Cricket Team and were able to attract huge fan following and had a lot of influence on them as well. The Role of Cricketers in Marketing
Cricketers are assumed to play a part larger than their life across the people in Indian society. They are a huge source of inspiration and are capable of making many people accept them as role models. Today’s marketers witness a wonderful opportunity in cricket and cricketers who can be a part of their marketing effort. Hence, many cricketers, especially in India, are approached by various companies to endorse their brands. Depending upon the popularity, performance and overall stature of the player, he may endorse brands and charge according to his market value.
To quote a few, M.S. Dhoni and Sachin Tendulkar made to Forbes magazine's list of the top 100 highest-paid athletes for the period June 2011 to June 2012, having made $26.5 million and $18.6 million respectively. Apart from them, today lot of young cricket players have endorsements to their kitty. Marketers have clear ideas about the segment they cater to, target audience they

Management Today Vol.4, No.1 January-March 2014
11
want to focus upon and the brand ambassador who will be the right fit for the brand’s profile. Brand Sachin
Sachin started cricket at the age of eleven and made his debut against Pakistan during November 1989 when he was sixteen. He has played 664 international cricket matches in total, scoring 34,357 runs. The feat that Sachin Tendulkar has achieved is remarkable and from the time he has associated with Indian cricket team, he proved his worth by his consistent performance and quickly rose to fame. Sachin as a brand started seeking the attention of many marketers world over.
Sachin was soon seen endorsing various brands nationally and internationally across different sectors. During his long tenure with Indian cricket team Sachin was a person with very less controversy. Many of his qualities like honest, down to earth, sincere, hard work, dedicated, focus, perseverance, passion etc. made marketers to ideally make use of Sachin as the brand ambassador by assessing the sync between the endorsed brand and Sachin. The inferencing effect between Sachin and the brand endorsed is so high that many of his advertisement contracts were long term. Even after the contracts expired, many brands wanted to continue and some rightly did so. Same was the case even after his retirement with most of his endorsements. Since Sachin had a huge recall among the cricket lovers he was effectively used by the marketers. CBBE Model
The model, as promulgated by Keller (2001), called Customer Based Brand Equity Model widely known as CBBE, looks at building a brand as a sequence of steps, each of which is contingent on successfully achieving the objectives of the previous one. The steps are as follows:
1. Ensure identification of the Brand with customers and an association of the brand in customers’ minds with a specific product class or customer need.
2. Firmly establish the totality of brand in the minds of the customers by strategically linking a hot of tangible and intangible brand associations with certain properties.
3. Elicit the proper customer response to this brand identification and brand meaning.
4. Convert brand response to create an intense, active loyalty relationship between customers and the brand.
These four steps represent a set of fundamental questions invariably ask about brands – at least implicitly. The four questions (with corresponding brand steps in parenthesis) are:
1. Who are you? (brand identity) 2. What are you? (brand meaning) 3. What about you? What do I Think or feel about you?
(brand response) and 4. What about you and me? What kind of association and
how much of a connection would I like to have with you? (brand relationships)
In the branding ladder, as depicted in Figure 1, the ordering is from identity to meaning to response to relationships. That is, we cannot establish meaning unless we have created identity; response cannot occur unless we have developed the right meaning; and we cannot forge a relationship unless we have elicited the proper responses.
Fig.-1: Branding Ladder
Objectives
Considering CBBE model as the base for the research, the following objectives have been identified by the researchers:
1) To study the perception of the cricket enthusiasts about Sachin as a brand in the field of cricket,
2) To study the factors, as per the perception of the respondents, that enable Sachin to be their favourite cricketer,
3) To study the judgment and feelings of the respondents about Sachin and
4) To study the impact of brand Sachin post his retirement on the perception of the respondents.
Methodology A descriptive research method was adopted for achieving the
objectives set forth. The sample units were the students and a sample size of 100 was considered for this study. After the conceptualisation of the study by the researchers, a structured questionnaire was developed and the same was pilot tested to verify the validity and reliability of the scale and the instrument. Finally, the questionnaire was administered among the prospective respondents, the data collected were analysed using SPSS 0.15 version. The results of the analysis are discussed in detail in the forthcoming paragraphs. Discussions
The questionnaire was prepared by the researchers with the intention of capturing data related to brand building activity, CBBE, as has been discussed earlier. The researchers tried to capture the required data with appropriate statements under each category. The validity of the questions were tested through Cronbach’s alpha which is found as .901 and the values of each factors, as given in parenthesis against each factor, suggested that the statements and scales were valid (all values above 0.7).
1. Identity (Cronbach’s Alpha: 0.826)
The first component in CBBE model talks about the Identity which is mainly the awareness. The awareness clearly constitutes recall and recognition. For most of the respondents sports is cricket and cricket means Sachin. The mean values indicated in this table shows that people are very much aware of cricket and Sachin. They don’t consider all players equally when compared to providing a special place for Sachin. The identity that the game has created for itself and Sachin is very much evident.
4. RELATIONSHIPS
3. RESPONSE
2. MEANING
1. IDENTITY

Visualizing ‘Brand Sachin’ Beyond His Retirement: An Application of CBBE Model
12
Table-1: Identity
Sl No. Statement Mean
Value
1 I enjoy watching cricket 4.41
2 I watch all formats of cricket 3.89
3 I watch cricket only when India plays 3.37
4 All players in India are equal according to me 3.21
5 Sachin has a special place in my heart 4.14
6 Sachin is a great Indian cricketer 4.52
Source: Primary data from field survey
2. Meaning (Cronbach’s Alpha: 0.841)
The second component comprises the performance and imagery in the CBBE model. It is very clear from the analysis as most of the cricket enthusiasts have vouched for Sachin in terms of his consistency, reliability, team work, role model, honesty and self-respect. The mean scores in the table are indicating the same. Of all the values, Sachin has scored the highest for his values and self-respect which speaks for the great cricketer of all times. It clearly emphasizes that he is a disciplined sportsman.
Table-2: Meaning Sl.
No. Statement
Mean
Value
1 I believe Sachin is a consistent contributor (batsman) 4.00
2 I think Sachin is a good team player 4.23
3 I feel Sachin is a role model for young cricketers 4.48
4 I am of the opinion that Sachin brings strength to the
team 4.33
5 I believe Sachin has great values and self-respect 4.66
6 I am of the opinion that Sachin is honest and modest 4.54
7 Sachin is a reliable performer 4.23
Source: Primary data from field survey
3. Response (Cronbach’s Alpha: 0.816)
The third component talks about judgment and feelings the respondents hold about Sachin both functionally and emotionally. Functionally his skills and performance form one part and on the other side what kind of feelings does he evoke amidst the fellow countrymen is remarkably evident with many considering him to be part of every family and the nation feeling happy if he performs well. The mean scores are high and show the wonderful response the great cricketer has. Since he was considered as the brand ambassador for Indian cricket and also considering the contributions to the Nation through the sport he was recently announced for this year’s (2013) Bharat Ratna which is the highest civilian award. Also he is a Rajya Sabha member which is an honour bestowed on him.
Table-3: Response Sl.
No. Statement
Mean
Value
1 I think Sachin is one of the finest cricketers of all
time 4.40
2 I feel Sachin is blessed with excellent technique 4.35
3 I believe Sachin is considered to be a part of every
family in India 4.02
4 The whole nation is happy if Sachin performs well
in any match 4.40
5 The country takes credit on Sachin’s achievements 4.18
6 Sachin is the brand ambassador for Indian cricket 4.43
Source: Primary data from field survey
4. Relationship (Cronbach’s Alpha: 0.820)
The fourth component discusses about the resonance the brand has created. The longevity he has with Indian cricket team has been widely appreciated. Since Sachin has built a clean and no controversy image, people would respond to his call for any activity in future. His bonding with the sport cricket is inseparable. The mean values confirm the above discussed information.
Table-4: Relationship Sl.
No. Statement
Mean
Value
1 I feel in his 24 years career Sachin has given a
lot to Indian cricket and the Nation 4.50
2 If Sachin calls for a cause many would respond 4.21
3 Sachin and cricket is almost inseparable 4.43
Source: Primary data from field survey Brand Sachin’ Post his Retirement
The researchers also tried capturing the impact of brand Sachin post his retirement on a 3-point ranking scale where 1 indicated inferior, 2 indicated about the same and 3 indicated superior. About 59% of the respondents felt his brand value is going to remain the same even after his retirement. About 25% had the opinion that his brand value will come down; whereas 16% felt his brand value would go up. The mode which was used to get the average indicated that his brand value was about the same according to the respondents. There were about 44% of the respondents who indicated that he probably will endorse more brands where as 24% indicated that he surely will endorse more brands which reiterates that his brand value in the minds of the consumers has not faded as yet.
From the table it is clear that the respondents are of the opinion that Sachin exhibits passion, focus, consistent performance and a combination of these as the key personality attributes which can be used by marketers for their communications.
Table-5: Sachin Brand Personality Factors Sl. No. Factors Frequency Percent
1 Consistent Performance 16 16.0
2 Focus 20 20.0
3 Perseverance 7 7.0
4 Passion 26 26.0
5 Modesty 2 2.0
6 Others 3 3.0
7 Multiple options 26 26.0
Total 100 100.0
Source: Primary data from field survey There are various qualities of Sachin Tendulkar that have
stood out as his brand personality factors which the marketers have rightly identified and utilized for their brands. The researchers have assessed the current brands that he is endorsing and have clearly captured the same in a Table, their perception of the shared value that the respective brand enjoys with Sachin Tendulkar.
Research reveals from many sources that many brands where Sachin is associated with are keen in continuing his association by the way of renewing their contracts despite his retirement. According to them whether he is associated with active cricket or not, they feel he will be able to evoke responses and create awareness for the brands. There are certain brands which have co-created with Sachin namely the ITC, Coca-Cola, Amit Enterprises, Toshiba, Future group, and Aviva are of the opinion

Management Today Vol.4, No.1 January-March 2014
13
that it has worked for them. Table-6: Brands Endorsed by Sachin*
Sl
No. Brand Category
Shared
Values
Hierarchy in
CBBE
1 Adidas Sport
accessories
Athletics /
Achievers
Response /
Relationship
2 Amit
Enterprises Housing
Trust /
Comfort Identity
3 Audemars
Piguet
Luxury
Watches
Creativity /
Freedom
Response /
Relationship
4 Aviva Life
Insurance
Quality /
Security
Response /
Relationship
5 Boost Health Drink Energy /
Winning Response
6 BMW Luxury cars Master Class
/ Style
Response /
Relationship
7 Coca-Cola Beverages Happiness Relationship
8 Future
group Retail
Leadership /
Respect /
Humility
Response
9 ITC Biscuits
Active
Health /
Fitness
10 Jaypee
Cement Cement
Strength &
Endurance
Meaning /
Response
11 Kaspersky Anti-Virus
Relentless
Expertise /
Always
Ahead
Meaning /
Response
12 Luminous Power
Technologies
Passion /
Teamwork /
Innovation
Meaning /
Response
13 RBS Banking Futuristic Meaning /
Response
14 Reynolds Writing
Instruments
Clarity /
Longevity
Response /
Relationship
15 Toshiba Consumer
Electronics
Trend /
Inspiration Response
16 Ujala
Supreme
Consumer
products
Quality /
Innovation
Meaning /
Response
*Table compiled by the authors based on the information gathered from various sources
Conclusion The research work has provided some insights about the
perceptions, the cricket enthusiasts have about Sachin, especially post retirement. It also provides us to visualize brand Sachin through the CBBE model and understand how he has built his brand over the years. The marketers who have witnessed Sachin grow in his stature have perfectly utilized him for various brands
based on the fitment. Sachin has been a source of strength and identity to many marketers who have largely benefitted his association. Sachin’s association brings high recall to the brand which is very important for any brands sustenance. New brands have used Sachin to create Identity and later meaning while brands who have been associating with him for some time have utilized him to get responses and build relationship by co-creation and making the CBBE model complete to its effect. There are many brands who have invested handsome money to rope in Sachin to endorse their brands nevertheless to a large extent it has paid off so that it is evident that many are willing to continue. The adage that Legends never retire holds good for Sachin both on and off the field. References: Keller, Kevin Lane, Building Customer-Based Brand Equity,
Marketing Management. Jul/Aug 2001, Vol. 10 Issue 2, p14-19
http://www.espncricinfo.com/india/content/story/570077.html accessed on 04/12/13
http://en.wikipedia.org/wiki/India_national_cricket_team accessed on 04/12/13
http://en.wikipedia.org/wiki/Sachin_Tendulkar accessed on 04/12/13
http://www.jyothylaboratories.com/WhatWeDo.aspx accessed on 07/12/13 http://wsgworld.com/services/sponsorship/ accessed on 07/12/13
http://www.itcportal.com/media-centre/press-releases-content.aspx?id=137&type=C&news=Sunfeast-Great-Partnership-Great-Innings-Sachin-Tendulkar accessed on 07/12/13
http://www.kaspersky.com/news?id=207576404 accessed on 07/12/13
http://wsgworld.com/wp-content/uploads/2013/01/Sachin_Sponsors.png accessed on 07/12/13
http://www.toshiba-india.com/images/news/committed-to-the-future-big.jpg accessed on 08/12/13
http://articles.economictimes.indiatimes.com/2011-01-28/news/28428948_1_sachin-tendulkar-ashesh-amin-brand accessed on 08/12/13
http://www.coca-colaindia.com/presscenter/whats_new-Coke-Cricket_ki_Khushi_Campaign.html accessed on 08/12/13
http://www.kaspersky.com/news?id=207576404 accessed on 08/12/13
http://bmwbroombikes.wordpress.com/2013/11/19/sachin-the-brand-ambassador-of-bmw-
http://articles.economictimes.indiatimes.com/2009-10-28/news/27640585_1_sachin-tendulkar-adidas-bat-sponsorbrand/ accessed on 08/12/13
About the Authors
Dr. S. Manoharan, Associate Professor, Department of Management Studies and Research, BMSCE, Bangalore
Dr. S. John Manohar, Professor, Department of Management Studies and Research, BMSCE, Bangalore, [email protected]

14
-----------------------------------------------------------------------------------------------------
Responsibility of Contents of this paper rests upon the authors
and not upon GRIET publications
ISSN: 2348-3989 (Online)
ISSN: 2230-9764 (Print)
Doi: http://dx.doi.org/10.11127/gmt.2014.03.03
pp.14-21
Copyright@GRIET Publications. All rights reserved.
MANAGEMENT TODAY
-for a better tomorrow An International Journal of Management Studies
home page: www.mgmt2day.griet.ac.in Vol.4, No.1, January-March 2014
Personal Finance Management Practices and the Financial Stability of Tertiary Level Student Community Chedza Pelaelo & B.N. Swami
Faculty of Business, University of Botswana, Gaborone, Botswana.
A R T I C L E I N F O Article history: Received 7.2.2014 Accepted 24.3.2014 Keywords: Personal Finance
Management Practices
Financial Stability
Tertiary Level
A B S T R A C T Many studies have attempted to find the link between financial behaviour (financial management practices) and the financial well-being among various groups regarding personal finance. However most have only gone as far as researching the impact of financial literacy of individuals and how that translated to their personal finance management. The objective of this paper is to find out the impact that financial management practices have on financial stability. The research also wanted to evaluate a group that is generally in a unique position, their income is fixed and their expenses are high (Micomonaco, 2003). Tertiary level students are important because they are on the brink of beginning their careers and having to take on more responsibility of their lives and finances. The sample for this research consisted of first degree students (Undergraduates) from Botswana’s tertiary Institutions.
1. Theoretical Foundation
1.1 Introduction
The way in which students manage their finances has many important implications as it affects their current and future financial stability. This is especially true as they are not guaranteed jobs and so any income upon graduating. Tertiary level students are future captains of the industry; their financial management practices now will have an impact on not just their lives but the economy as a whole. The majority of people live on the edge of financial crisis and many of them do not possess the knowledge needed to manage their money. Henry et al., (2001) suggest that college students are at an even greater risk. This research intended to show a clear link between financial management practices and the financial stability of tertiary level community in Botswana, mainly the undergraduates.
1.2 Problem Statement
Due to the serious implications that current financial management practices have on students’ current and future financial stability as well as the stability of the country, it is important to be able to approximate the average management
practices among tertiary students. However to the best of the researchers’ knowledge, there is no published data on such research, locally (Botswana). Internationally, there has been limited research on the link between financial stability and the practices employed and also most researchers have focused on financial literacy. This research planned to gauge the financial preparedness of tertiary level community by using variables of comparison.
1.3 Objectives
Paper aimed to generate data which would be used to find out the This pgeneral financial management practices of tertiary level students in Botswana. This was to ensure to get a better understanding of their financial behaviours as well as to assess the link between financial management practices and financial stability.
1.4 Hypotheses
H1: The financial management practices of tertiary level students in Botswana, is very poor, leading to financial instability.
H2: Financial management practices of tertiary level students are dependent on their background.
These hypotheses were based on the observations as the general impression is that students run out of funds well before the end of the month. This paper attempts to verify the validity and extent of this impression.
1.5 Scope
This research project was intended to cover the University of

Management Today Vol.4, No.1 January-March 2014
15
Botswana community, Botswana Accountancy College and NIIT (Botho College) in order to prove conclusive results. The research was conducted in different faculties to ensure that if there were disparities between institutions and faculties, they may be uncovered and be in a better position to make inferences for the findings.
1.6 Conceptual Clarification
In order to have better understanding, the terms used in this research are briefly defined /explained.
Personal Financial Management is the managerial activity which is concerned with the planning and controlling of financial resources. Planning, directing, monitoring, organizing and controlling of monetary resources (Hetr, 2012).
Financial Stability is defined in terms of its ability to facilitate and enhance economic processes, manage risks, and absorb shocks. Moreover, financial stability is considered a continuum: changeable over time and consistent with multiple combinations of the constituent elements of finance (Schinasi, 2004).
Investment Decision is allocation of capital to investment proposal whose benefits are to be realized in the future (Analysis Project, 2012).
Conspicuous Consumption refers to the ostentatious display of wealth for the purposes of acquiring or maintaining status or prestige (Page, 1992).
The life-cycle theory assumes that household members choose their current expenditures optimally, taking account of their spending needs and future income over the remainder of their lifetimes (Modigliani & Brumberg, 1954).
1.7 Literature Review
The majority of research on the issue of student personal finances is mainly aimed at literacy. Researchers have not delved much into the financial management practices that students have taken to and how these practices could affect their financial stability in the present and possibly into the future. Researchers generally agree that bad financial management practices may pave a way to a generation that is not financially stable which could have adverse impacts for the economies of countries. However, good financial management practices may lead to a better standard of living in the future, a debt free lifestyle and financial fulfilment.
Henry et al., (2001) and Atkinson & Messy (2012) were of opinion that tertiary level students are close to financial ruin and most are not aware since they do not have the financials skills to realise it. Pathak et al., (2011) believed that it is not a question of ignorance but a social or behavioural problem, in which they care more about status and consumption in the mean time than they do about planning ahead. Students feel the need to spend to impress others and elevate their social status. These behavioural patterns all fall under examples of conspicuous consumption (Brueggemann, 2010).
Human beings are often influenced by others. A person with a good sense of financial planning and management, slowly start to follow the influences of peers, family and other social entities. What was once considered odd or distasteful somehow becomes
normal, desirable and acceptable. An analysis of 133 related studies by Bond & Smith (1996) confirmed the Conformity Effect which can be extended to any behavioural issue. Applying this theory to the financial practices of tertiary level students, we can form an idea of how socialization may lead an individual to financial ruin. Since majority of students are in their late teens to early twenties, they are still at a very impressionable age and are more likely to have a “follow the crowd” mentality. Pinto et al.,(2005) found that one of the most important factors regarding college students and their financial habits were their socialization agents. This influence could be appraised from the analysis of the questionnaire and personal interviews with peers, family members and other social entities.
Besides being influenced by those around them and the media, sometimes, students just make bad financial decisions based on priorities, or in some cases lack of prioritization. “Despite the development of new media and new financial products and services, people keep making the same common financial mistakes over and over — procrastinating and lack of planning, wasteful spending, falling prey to financial salespeople and pitches, failing to do sufficient research before making important financial decisions, and so on” (Tyson, 2010, p. 1). This account proposed that financial management is not only a matter of being knowledgeable or not, sometimes, it is a question of not seeing the need or feeling the urgency for proper financial management.
Bodie et al., (2007) also raised the issue that students tend to think against the Life cycle theory by Modigliani. They hardly save for the future and even if they do, it is a negligible percentage or portion. The individual investor life cycle suggests that the accumulation stage of one’s life begins in the early twenties. This is the typical age of the average tertiary level student. The implication is that this is the point where savings and some form of personal finance management should be applied.
Robb & Sharpe (2009) proposed that most consumption and saving practices are influenced by the incomes of the parents. This can be used an indicator of how the target group would send their resources, for example, lifestyle. It becomes a matter of having something to fall back on (Cude et al., 2006).
Emanating from the knowledge that there will always be a fall back plan, it seems that tertiary level students have developed a sense of entitlement regarding the financial assistance they receive. The students now believe they will forever be taken care of by either parents, or in the case of Botswana, the government. This creates a situation where they see no reason to plan ahead and ensure financial stability.
Moga (2012) argued that the youth of Botswana have now come to the view that tertiary level education sponsorship, including allowance is their right. It is what they are owed and so allowances may be spent in any way deemed fit, not only to enhance their educational experiences and needs but for leisure as well. It has gone to a point where they now demand financial assistance (Maphisa, 2011).
Based on lifestyle choices, some studies have come to the conclusion that men are better financial planners than women. This may be due to impulse buying of clothes and cosmetics. Women have been proven to have more problems managing their

Personal Finance Management Practices and the Financial Stability of Tertiary Level Student Community
16
finances. Literature has shown that women experience more problems in managing their finances than men (Martinez, 1995).
2. Methodology
This research used a comprehensive survey to determine the subject’s personal finance management practices and how financially stable the target group is, that is, savings, borrowings and investments. One of the definitions given for survey is “gathering information about the characteristics, actions, or opinions of a large group of people, referred to as a population” (Pinsonneault & Kraemer, 1993, p. 2).
2.1 Sampling Scheme
A sample scheme is “A scheme in which different parts of the sample are drawn by different methods”, (Glossary of Statistical terms, 2009). Data was collected at random sample of the population from the tertiary Institutions such as University of Botswana, Botswana Accountancy College and NIIT with the sample size of 100 participants.
2.2 Period of Study
The research was conducted between September 2012 and March 2013, however the data used was based on the experiences of the respondents between the years 2009 and 2013, during their stay at a tertiary level institution. That is, the students covered were from the groups that started between 2009 and 2013.
2.3 Procedure of Data Collection
The questionnaires having open and closed ended questions were delivered to the respondents who were selected at random. Sufficient time was given to the respondents for answering them. The answered questionnaires were then collected at a pre-scheduled date. In addition information was collected from different institutions (University of Botswana, Botswana Accountancy College and National Institute of Information Technology) so as to make a comparative study whether the conclusions are the same or different, whether they face the same issues. “A stratified random sample is one obtained by separating the population elements into non-overlapping groups, called strata, and then selecting a simple random sample from each stratum.” (Scheaffer, Mendenhall, & Ott, 1996, p.125). Information was also gathered from personal finance managers and lecturers of the institutions so as to get a more learned point of view to judge the best practices.
2.4 Data Processing
Collected data from the study was categorized and put through Statistical Product and Service Solutions [SPSS] for analysis Figures and tables were constructed using the Microsoft office range in order to provide visual aid about the statistical data. Open ended questions were grouped according to the similarity of responses.
2.5 Source of Information
Primary data were collected from the tertiary level school community from the selected institutions. Some questions were sourced from other similar questionnaires, particularly the survey done by the World Bank on financial literacy (World Bank, 2008). Observations of the situation and atmosphere, within the country, regarding student finances were also formed part of this research.
Secondary data were collected from journals, books, newspapers, interviews and websites. The secondary data were used to build a foundation on which the primary data could be extracted
3. Analysis of Data, Discussion and Findings
3.1 Analysis
The presentations of results from the analysis are based on personal background of the respondents and information on family money management habits. This research aimed at gauging financial management ability and financial preparedness of tertiary level community by using variables of comparison.
3.1.1 Demographic factors
The demographic characteristics discussed include gender, age, institution of learning and whether or not one has dependents.
a. Gender
Table-1: Respondents' Gender
S.No. Gender Frequency Percent
1 Male 48 48.0
2 Female 52 52.0
--- Total 100 100.0
The study covered 100 respondents. Results show that 48 (48%) of the respondents were male and 52 (52%) were female. These results suggest that females constitute the majority of the individuals willing to answer the questionnaires to determine personal finance management practices and their level of
financial stability.
b. Age
Table-2: Age of the Respondents
S.No. Age Frequency Percent
1 Below 18 1 1.0
2 18-20 46 46.0
3 21-25 48 48.0
4 Above 25 3 3.0
5 Missing 2 2.0
--- Total 100 100.0
Of the hundred (100) respondents 98 indicated their ages and only two (2) failed to do so. The results show that the highest proportion of the student community is made up of the age group: 21-25 year olds, at 48 (48%) of all the respondents and 49% of those who answered the question. The age group 18-20 followed closely behind at 46%. There were 3(3%) respondents under the age group above 25 and only 1% that is below 18.
c. Institution of Learning
Table-3: Institution of Learning
S.No. Institution of Learning Frequency Percent
1 University of Botswana 49 49.0
2 NIIT 29 29.0
3 Botswana Accountancy College
(BAC) 19 19.0
4 Missing 3 3.0
--- Total 100 100.0

Management Today Vol.4, No.1 January-March 2014
17
One hundred questionnaires were supplied to the following institutions of higher learning: UB, BAC and NIIT. Of which 49% of the respondents were from U.B, 29% from NIIT and19% were from BAC were finally collected. The response rate is 97%.
d. Dependents
Table-4: Dependents
S.No. Response Frequency Percent
1 Yes 28 28.0
2 No 70 70.0
3 Missing 2 2.0
--- Total 100 100.0
Out of the students who responded to the question “of having dependents”, 28 (28.6%) indicated that they have dependents. 70 (71.4%) do not have dependents.
3.1.2 Spending Habits
Bearing in mind that students are on a fixed income, it is important that they manage their finances well. Through a cross tabulation, the researchers wanted to determine how gender influences spending habits of the respondents.
Table: 5: Spending Habits
S.No. Gender
Spending Habits
Total Spend money
freely
Reluctant to spend money
unnecessarily
Spend
money to
enjoy
youth
Hoping
someone will bail
you out,
financially
1 Male 3 30 9 4 46
2 Female 8 30 6 5 49
--- Total 11 60 15 9 95
The above Table highlights the number of respondents who indicated that they spend money freely to be 11, of these, 3 were male and 8 were female. Those who indicated a reluctance to spend money unnecessarily were 30 in both males and in females, making up a total of 60. A total of 15 students indicated and inclination to spend their finances with the aim of enjoying their youth. Of this category, 9 were male and 6 were female. Nine (9) respondents acknowledged having someone they know will always bail them out, of this category, 4 were male and 5 were female. Five (5) responses were missing and so were not included in the analysis.
To determine how spending habits were linked to residence of respondent, a cross tabulation was done. It seems 1 (20%) out of the 5 on campus students used up the bulk of their amounts in hand in the first week after receipt of the amounts, 3 (60%) used it within the first two weeks and only 1 (20%) confirmed as if the amounts lasted until the last week of the month. Whereas ‘the off campus students’, 25 (26.3%) respondents indicated they used up the bulk of their income in the first week itself, 20 (21.1%) said within 2 weeks of receiving their income, 19 (20%) indicated that they used the bulk of the income within 3 weeks and 31 (32.6%) respondents indicated that the bulk of it takes them through the whole month.
3.1.3 Financial Planning
In exploring the notion of financial planning, gender was cross referenced with creating a budget that one could use to guide expenditure. The following results were found.
Table-6: Budgeting Based on Gender
S.No. Gender Budget
Total Yes No.
1 Male 37 10 47
2 Female 33 19 52
--- Total 70 29 99
From the results, it is evident that the male respondents plan better than their female counterparts. This is shown by the 37 males (about 80%) as compared to the 33 females (just over 60%) that make budgets. Also, a greater number of females indicated that they do not make budgets.
Planning also includes keeping track of income and expenditures. In order to plan one needs to know roughly how much they spend in a given period so they can make provisions for the future. From the analysis of data, it is located that 36% of the respondents do not keep records of everything, 32% do not keep records but have a vague idea of how much is spent, 22% keep some records and only 10% keep records of all revenues and expenditures.
3.1.4 Family Background/ Influence
The family’s financial situation may also play a part in the financial management practices and financial stability of a student. Having dependents can also cause strain in the financial wellbeing of the student.
Table-7: Influence of Family Background
S.
N
o.
Depend
ent
Family Financial Background
Tot
al Substantia
lly Secure
and Stable
Moderat
ely
Secure
and
Stable
Somew
hat
Insecure
and
Unstabl
e
Insecu
re and
Unstab
le
1 Yes 4 16 5 3 28
2 No 26 26 11 7 70
- Total 30 42 16 10 98
The table above depicts a cross reference between having dependents and the type of family situation a respondent faces. 4(13.3%) of respondents who have dependents indicated that their family financial situation was substantially secure and stable, whereas 26(86.7%) without dependents said they were in substantially secure and stable families. Of the 42 who come from moderately secure and stable family financial situations, 16(38.1%) had dependents and 26(61.9%) did not. The category of somewhat insecure and unstable, 5(31.3%) had dependents and 11(68.8%) did not. Those with unstable family financial backgrounds indicated that only 3(30%) had dependents and 7(70%) did not.
In “Money 101” for College Students and Parent, Stewart Welch III, a personal finance manager, indicated that family should have an input in the financial planning of college students. In an interview he indicated that parents and guardians should
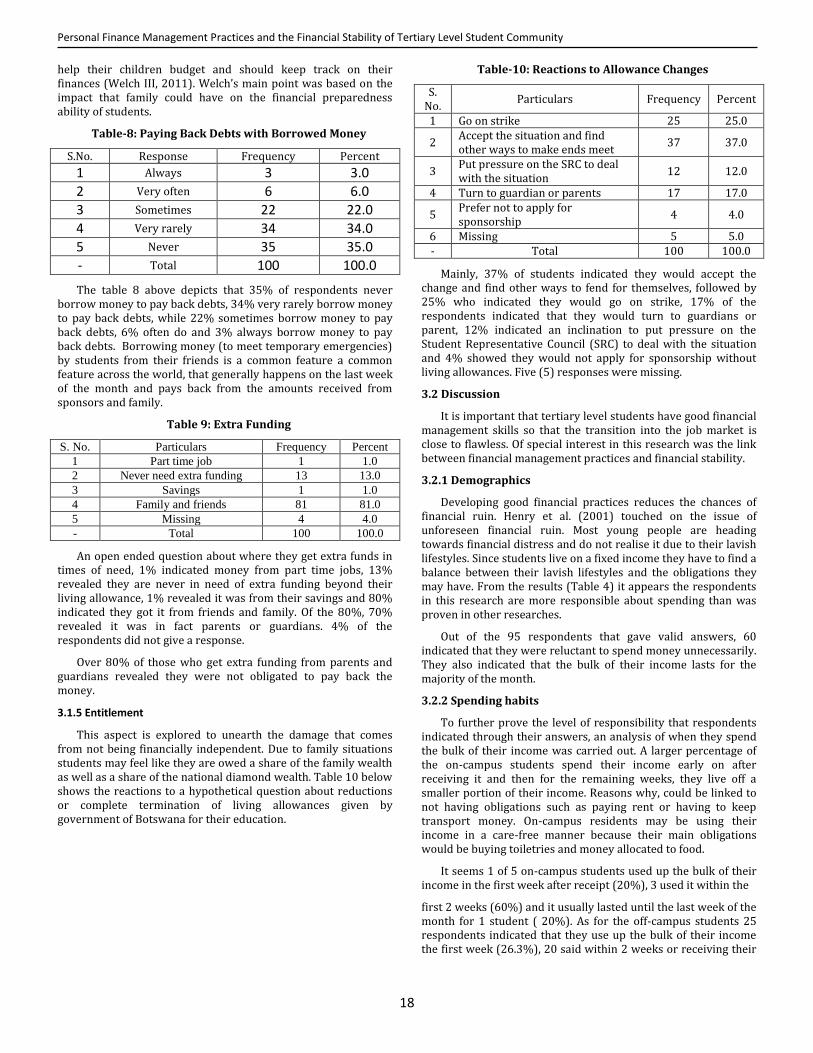
Personal Finance Management Practices and the Financial Stability of Tertiary Level Student Community
18
help their children budget and should keep track on their finances (Welch III, 2011). Welch’s main point was based on the impact that family could have on the financial preparedness ability of students.
Table-8: Paying Back Debts with Borrowed Money
S.No. Response Frequency Percent 1 Always 3 3.0
2 Very often 6 6.0
3 Sometimes 22 22.0
4 Very rarely 34 34.0
5 Never 35 35.0
- Total 100 100.0
The table 8 above depicts that 35% of respondents never borrow money to pay back debts, 34% very rarely borrow money to pay back debts, while 22% sometimes borrow money to pay back debts, 6% often do and 3% always borrow money to pay back debts. Borrowing money (to meet temporary emergencies) by students from their friends is a common feature a common feature across the world, that generally happens on the last week of the month and pays back from the amounts received from sponsors and family.
Table 9: Extra Funding
S. No. Particulars Frequency Percent
1 Part time job 1 1.0
2 Never need extra funding 13 13.0
3 Savings 1 1.0
4 Family and friends 81 81.0
5 Missing 4 4.0
- Total 100 100.0
An open ended question about where they get extra funds in times of need, 1% indicated money from part time jobs, 13% revealed they are never in need of extra funding beyond their living allowance, 1% revealed it was from their savings and 80% indicated they got it from friends and family. Of the 80%, 70% revealed it was in fact parents or guardians. 4% of the respondents did not give a response.
Over 80% of those who get extra funding from parents and guardians revealed they were not obligated to pay back the money.
3.1.5 Entitlement
This aspect is explored to unearth the damage that comes from not being financially independent. Due to family situations students may feel like they are owed a share of the family wealth as well as a share of the national diamond wealth. Table 10 below shows the reactions to a hypothetical question about reductions or complete termination of living allowances given by government of Botswana for their education.
Table-10: Reactions to Allowance Changes
S. No.
Particulars Frequency Percent
1 Go on strike 25 25.0
2 Accept the situation and find other ways to make ends meet
37 37.0
3 Put pressure on the SRC to deal with the situation
12 12.0
4 Turn to guardian or parents 17 17.0
5 Prefer not to apply for sponsorship
4 4.0
6 Missing 5 5.0 - Total 100 100.0
Mainly, 37% of students indicated they would accept the change and find other ways to fend for themselves, followed by 25% who indicated they would go on strike, 17% of the respondents indicated that they would turn to guardians or parent, 12% indicated an inclination to put pressure on the Student Representative Council (SRC) to deal with the situation and 4% showed they would not apply for sponsorship without living allowances. Five (5) responses were missing.
3.2 Discussion
It is important that tertiary level students have good financial management skills so that the transition into the job market is close to flawless. Of special interest in this research was the link between financial management practices and financial stability.
3.2.1 Demographics
Developing good financial practices reduces the chances of financial ruin. Henry et al. (2001) touched on the issue of unforeseen financial ruin. Most young people are heading towards financial distress and do not realise it due to their lavish lifestyles. Since students live on a fixed income they have to find a balance between their lavish lifestyles and the obligations they may have. From the results (Table 4) it appears the respondents in this research are more responsible about spending than was proven in other researches.
Out of the 95 respondents that gave valid answers, 60 indicated that they were reluctant to spend money unnecessarily. They also indicated that the bulk of their income lasts for the majority of the month.
3.2.2 Spending habits
To further prove the level of responsibility that respondents indicated through their answers, an analysis of when they spend the bulk of their income was carried out. A larger percentage of the on-campus students spend their income early on after receiving it and then for the remaining weeks, they live off a smaller portion of their income. Reasons why, could be linked to not having obligations such as paying rent or having to keep transport money. On-campus residents may be using their income in a care-free manner because their main obligations would be buying toiletries and money allocated to food.
It seems 1 of 5 on-campus students used up the bulk of their income in the first week after receipt (20%), 3 used it within the
first 2 weeks (60%) and it usually lasted until the last week of the month for 1 student ( 20%). As for the off-campus students 25 respondents indicated that they use up the bulk of their income the first week (26.3%), 20 said within 2 weeks or receiving their

Management Today Vol.4, No.1 January-March 2014
19
income (21.1%), 19 indicated that they used the bulk of the income within 3 weeks (20%) and 31 respondents indicated that the bulk of it goes to the end of the month (32.6%). (See Figure 3 in Appendices)
It appears respondents with dependents are generally more cautious about how they spend their income. A larger percentage of them indicate reluctance to spend money unnecessarily and a smaller percent of them indicating that they have someone to bail them out. This proved to be inconsistent with what was observed by other writers and researchers. (Tyson, 2010); (Henry et.al., 2001)
3.2.4 Financial planning
Respondents indicated that they had their spending habits in control and that they did not spend money carelessly. The next step of the research was to understand how far the self control went. A comparison between males and females was conducted to ascertain who the better planner was. Martinez (1995) came to the conclusion that males were better financial planners than females. From the analysis of data it is evident that male respondents plan better, in the form of budgeting than their female counterparts. This research confirmed this fact (Table 5). Far beyond the actual planning, sticking to the budget is also important. It appears even the females who had created a budget attest to not following the budget created. More than 60% of the females who created budgets do not stick to them. In this regard, the information obtained from the research was consistent with what is known.
Cude et al., (2006); Robb & Sharpe (2009) made a clear link between family financial background and the student’s financial decisions. 47% of respondents described their personal finance management skills as good however only 13% believe they never need extra funding because their finances are impeccable. Yet 80% of them indicated that they get extra funds from their parents and friends, of which 80% of those who get funds from their parents (in particular) are not required to pay it back, which may explain why the majority of respondents do not need to borrow to pay off their debts. This affects the financial decisions of an individual about saving, planning and borrowing. The family situation makes it easier for the student to be irresponsible with money knowing they will be assisted by the family.
The research confirmed earlier opinions on the matter.
3.2.5 Entitlement
As the family continues to cushion the students from their financial “falls”, it gives them certain expectations of always having a backup plan, to the point where one might expect certain situations to come easy and when they want them (Table 8 and 9). This may lead to the student community of tertiary institutions failing to express their grievances in a dignified manner; they always take out their financial frustrations in some form of extreme expression. Better financial practices such as planning could help alleviate this. Positive influence and role examples from their family background could also better curb the entitlement attitude. During the course of this research a few events took place, for example boycotts of schools by students in another institution in Botswana (Limkokwing University) over book allowance accreditation (Kayawe, 2013).
Though respondents indicated a level of responsibility in spending money they also displayed a hint of entitlement. Regarding the issue of allowances from the government, respondents were asked to advice the Botswana Government on what was the best option given the economic climate. 77.32% of the respondents opted to advice the government to increase student allowances. This may be due to increased cost of living that students are exposed to especially since the academic crunch. Student allowances have not been increased. Some showed compassion with close to 18% indicating that only those in dire need should be given allowance. This caters for both students in need and reduces pressures on government, financially. This is also inconsistent with the behaviour displayed throughout the years. (Maphisa, 2011); (Kayawe, 2013).
3.3 Findings
Most students indicated that they have a budget and hey stick to the budget and most are reluctant to spend money unnecessarily (See Tables 5 and 6). However, other data such as student actions observed over the years, suggest otherwise as well as reports in newspapers (Maphisa, 2011) (Kayawe,2013).
This research finds that the family background of respondent greatly influences their personal finance management practices (Tables 7 and 9)
There is a sense of entitlement among respondents especially the government sponsored respondent. This is evidenced by the Table 10.
4. Conclusions and Recommendations
4.1 Conclusions
On a general note the results of the study showed that students have some form of financial management practices in place. However, this may not warrant the conclusion that they have financial stability. This conclusion was reached based on the fact that the students had indicated getting financial assistance from those around them, especially family. Therefore, it is assumed that the results on the link between financial management practices and financial stability were inconclusive as there were outside influences on the level of their personal finances. Their view regarding the financial stability was distorted by getting financial assistance that was not repayment obligated.
4.2 Recommendations
Organize programs to educate the tertiary students on the importance of budgeting and saving and also teach them ways to manage their monthly cash flows. They could be taught about financial resource management tools available to them. Seminars may also be used.
Financial management courses should be taught from an earlier age. For example in primary schools and secondary schools so taught by the time the students get to tertiary level they may be better prepared. Parents and guardians should try and teach their children the importance of proper financial management through practical exercises like encouraging saving through piggy banks in primary level children and so on.
References
Analysis Project. (2012, February 22). Retrieved from

Personal Finance Management Practices and the Financial Stability of Tertiary Level Student Community
20
Blogspot.com: http://analysisproject.blogspot.com/2012/02/investment-decision.html
Atkinson, A., & Messy, F. (2012). Measuring Financial Literacy:Results of the OECD/International network on financial education (INFE) pilot study. OECD Working Papers on Finance, Insurance and Private Pensions No. 15 .
Bodie, Z., Treussard, J., & Willen, P. (2007). Theory of Life-Cycle Saving and Investing. 2006 Life-Cycle Saving and Investment Conference (pp. 1-26). Boston: Federal Reserve Bank of Boston.
Bond, R., & Smith, P. B. (1996). Culture and Conformity: A Meta-Analysis of Studies. Psychological Bulletin , pp. 111-137.
Brueggemann, J. (2010). Rich, Free and Miserable: Failure of Success in America. Rowman and Littlefield Publishers Inc.
Cude, B. J., Lawrence, F. C., Lyons, A. C., Metzger, K., LeJeune, E., Marks, L., et al. (2006). “College Students’ Financial Literacy: What They Know and What They Need to Learn”. Easten Family Economics and Resource Management Association , 102-109.
Glossary of Statistical terms. (2009, May 19). Retrieved from OECD Website
http://stats.oecd.org/glossary/detail.asp?ID=3620
Henry, R. A., Weber, J. G., & Yarbrough, D. (2001, June 01). College Student Journal , p. Source Volume 35 Source Volume Issue 2.
Hetr, I. D. (2012, October). Personal Financial Management. definitions. Retrieved from Hub pages: Personal Financial Management|Definition|Simple Steps How To better Manage Your Personal Finance
Kayawe, B. (2013, February 27). Mmegi Online. Retrieved March 2013, from News: http://www.mmegi.bw/index.php?sid=1&aid=1382&dir=2013%2FFebruary%2FWednesday27
KK. (2012, November 8). Should you tell a friend they make bad financial decisions. Retrieved January 2013, from Student Debt Survivor: http://www.studentdebtsurvivor.com/should-you-tell-a-friend-they-make-bad-financial-decisions/
Maphisa, M. (2011, September 16). Pay Us More or else. The Voice , pp. http://www.thevoicebw.com/2011/09/16/pay-us-more-or-else/.
Martinez, M. N. (1995, November). Why Women Should Save and Plan More. HR Magazine , pp. 104-105.
Micomonaco, J. P. (2003). Borrowing against the future: Practices,
attitudes and knowledge of financial management among college students.
Modigliani, F., & Brumberg, R. (1954). Utility Analysis and the Consumption Function. Post- Keynesian Economics .
Moga. (2012, September 8). Is there a Sense of Entitlement? Retrieved September 2012, from Blogspot: http://keaipotsa.blogspot.com/2012/09/is-there-sense-of-entitlement.html
Page, C. (1992). A History of Conspicious Consumption. University of Colorado.
Pathak, P., Holmes, J., & Zimmerman, J. M. (2011). Accelerating financial capability among youth. Nudging new thinking. New American Foundation.
Pinsonneault, A., & Kraemer, K. L. (1993). Survey Research Methodology in management information systems:An assessment. Journal of Management Information Systems , 10(2) 75-105.
Pinto, M. B., Parente, D. H., & Mansfield, P. M. (2005). Information Learned from socialisation Agents:Its relationship to credit card usage. Journal of Family and Consumer Sciences Research , 33(4):357-367.
Robb, C. A., & Sharpe, D. L. (2009). Effect of Personal Financial Knowledge on College Students' Credit Card Behavior. Robb, C.A. and Sharpe, D.L. (2009). Effect of Personal Financial Knowledge onAssociation for Financial Counseling and Planning Education , 25-43.
Scheaffer, R. L., Mendenhall, W., & Ott, W. (1996). Elementary Survey Sampling . Duxbury Press.
Schinasi, G. J. (2004). Defining Financial Stability. IMF Working papers 187.
Tyson, E. (2010). Personal Finance for Dummies. Indianapolis, Indiana: Wiley Publishing, Inc.
UB SRC (Estudiantes UB Represantative Consejo). (2013, February). Retrieved March 2013, from Facebook.com: https://www.facebook.com/photo.php?fbid=416171891799516&set=o.433667739984897&type=1&relevant_count=1&ref=nf
Welch III, S. (2011, August 22). Money 101 for College Sudents and Parents . (R. Levanthal, Interviewer)
World Bank. (2008, June). Financial Literacy Program. Retrieved November 2012, from http://siteresources.worldbank.org/INTECAREGTOPPRVSECDEV/Resources/RU-WB_Financial_Literacy_Questionnaire.pdf

Management Today Vol.4, No.1 January-March 2014
21
APPENDICES
Tables and Figures
Figure 2: Student Usage of the bulk of their allowance
Figure 3: Attitudes towards Spending
Table-11: Rate of Allowance Consumption
S. No. Particulars Frequency Percent Cum. Percent 1 First week of receipt 26 26.0 26.0 2 Within the first 2 weeks 23 23.0 49.0 3 Within 3 weeks 19 19.0 68.0 4 It usually lasts until the end of the month 32 32.0 100.0 - Total 100 100.0

22
----------------------------------------------------------------------------------------------------
Responsibility of Contents of this paper rests upon the authors
and not upon GRIET publications
ISSN: 2348-3989 (Online)
ISSN: 2230-9764 (Print)
Doi: http://dx.doi.org/10.11127/gmt.2014.03.04 pp.22-27
Copyright@GRIET Publications. All rights reserved.
MANAGEMENT TODAY
-for a better tomorrow An International Journal of Management Studies
home page: www.mgmt2day.griet.ac.in Vol.4, No.1, January-March 2014
A Study on Positive Psychological Intervention towards Job Search Attributes among Management Graduates Dipesh Gangrade
Asst. Professor (HR), Dept. of Management Studies, Mathura Devi Institute of Technology & Management, Indore, Madhya Pradesh, 452018.
A R T I C L E I N F O Article history: Received 26.11.2013 Accepted 24.3.2014 Keywords: Positive Approach Values Talents Management Graduates
A B S T R A C T There is growing evidence that the aging of the global workforce will be the dominant factor for business and organizations in the next two decades. According to renowned management expert Peter Drucker, this is because the rapid growth of the older population and the rapid shrinking of the younger generation will result in a growing scarcity of knowledgeable and competent professionals in our global labour pool. Therefore, the purpose of this study is to analyze and explain that which constitutes what we term the positive contributory value of job seekers. The researcher takes a positive psychology approach to job seekers, focusing on leveraging their strengths and talents for organizational success. He makes the argument that organizational leaders have yet to turn their full attention to attract. He suggests that a positive approach would be better received and more effective.
The researcher suggests that a positive approach to the management graduates would be better received and more effective. Drawing from recent research findings, our approach focuses on management graduates as valuable assets and highlights the positive consequences associated with appropriate attention to these students. Said differently, instead of focusing on the problems associated with mismanaging the careers of management graduates, a positive psychological approach makes a business case for focusing on the opportunities related to the proper management of the careers of these students. As recently as 1998, renowned psychologist Martin Seligman introduced the positive psychology movement. Positive psychology has emerged and gained momentum as an approach that redirects focus from what is wrong with people or organizations toward one that emphasizes human strengths that allow individuals, groups, and organizations to thrive and prosper.
Introduction In today’s world, society is facing extremely tough challenges in the form of global warming, natural disasters, economic recession, unprecedented homelessness, terrorism and the draining continuation of war. With all this sadness and horror,
where in the world does a science based on testing happiness, wellbeing, personal growth and ‘the good life’ fit into the modern-day agenda?
Positive psychology concentrates on positive experiences at three time points: (1) the past, centring on wellbeing, contentment and satisfaction; (2) the present, which focuses on concepts such as happiness and flow experiences; (3) the future, with concepts including optimism and hope. Not only does positive psychology distinguish between wellbeing across time points but it also separates the subject area into three nodes:
the subjective node, which encompasses things like positive experiences and states across past, present and future (for example, happiness, optimism, wellbeing);

Management Today Vol.4, No.1 January-March 2014
23
the individual node, which focuses on characteristics of the ‘good person’ (for example, talent, wisdom, love, courage, creativity); and
the group node, which studies positive institutions, citizenship and communities (for example, altruism, tolerance, work ethic) (Positive Psychology Centre, 1998).
Contrary to criticism, positive psychology is not a selfish psychology. At its best, positive psychology has been able to give the scientific community, society and individuals a new perspective on existing ideas as well as providing empirical evidence to support the phenomenon of human flourishing. Above all, though, positive psychology has challenged and rebalanced the deficit approach to living while connecting its findings to many different disciplines. It can be observed that how psychological interventions inducing positive emotions, committing acts of kindness and enhancing social connections enable individual and societal flourishing, demonstrating the usefulness of the discipline for individual, group and community wellbeing.
Socrates, Aristotle and Plato believed that when people pursued a virtuous life, they would become authentically happy. Epicurus and later utilitarian preached that happiness was indeed the abundance of positive feelings and pleasures. Positive psychology has traditionally conceptualized authentic happiness as a mix of hedonic and udemonic wellbeing (Seligman and Csikszentmihalyi, 2000). Hedonic happiness encompasses high levels of positive affect and low levels of negative effect, in addition to high subjective life satisfaction (Diener, 1999). Eudemonic wellbeing focuses more on the creation of meaning and purpose in life, although the distinction between these two concepts is subject to debate (Kashdan et al., 2008; Keyes and Annas, 2009; Tiberius and Mason, 2009).
The person regarded as being responsible for the creation of the positive psychology movement is Martin E. P. Seligman, a professor at the University of Pennsylvania. After decades of experimental research and success with his learned helplessness theory, Seligman was appointed President of the American Psychological Association (APA) in 1998. It was during his inauguration at the 107th Annual Convention of the APA in Boston, Massachusetts, 21 August 1999, that Seligman decided to introduce his agenda to correct the trajectory of modern day ‘pathologically focused’ psychology. Since Seligman’s presidential position, he has become a figurehead for the positive psychology movement and continues to gain support from research funds and governments across the world to include positive psychology theories and practices into daily life.
Job Search Related Behaviour
There is growing evidence that the aging of the global workforce will be the dominant factor for business and organizations in the next two decades. According to renowned management expert Peter Drucker, this is because the rapid growth of the older population and the rapid shrinking of the younger generation will result in a growing scarcity of knowledgeable and competent professionals in our global labour pool. Higher education faces similar challenges with the retirement of many “older workers,” e.g., full professors who have worked over lifetimes to become experts in their chosen disciplines. Other examples include government, where nearly 65
percent of middle managers are within three years of potential retirement. Despite these realities, few organizations are currently preparing for the loss of knowledge and experience when employees retire. Nor are they actively seeking to retain these workers. As Greller and Stroh point out in a recent Organizational Dynamics article, this is due primarily to inaccurate perceptions that older workers are of less value than their younger counterparts.
Therefore, the purpose of this study is to analyze and explain that which constitutes what we term the positive contributory value of job seekers. We take a positive psychology approach to job seekers, focusing on leveraging their strengths and talents for organizational success. We make the argument that organizational leaders have yet to turn their full attention to attract. We suggest that a positive approach would be better received and more effective. As a representative for Price water house Coopers recently noted, “Warnings of the boomer crisis are being ignored primarily because most companies are not in enough pain yet, and are still in the mindset that there are too many people at the water cooler, not too few.”
The researcher suggests that a positive approach to the management graduates would be better received and more effective. Drawing from recent research findings, our approach focuses on management graduates as valuable assets and highlights the positive consequences associated with appropriate attention to these students. Said differently, instead of focusing on the problems associated with mismanaging the careers of management graduates, a positive psychological approach makes a business case for focusing on the opportunities related to the proper management of the careers of these students. As recently as 1998, renowned psychologist Martin Seligman introduced the positive psychology movement. Positive psychology has emerged and gained momentum as an approach that redirects focus from what is wrong with people or organizations toward one that emphasizes human strengths that allow individuals, groups, and organizations to thrive and prosper.
The overall goal of positive psychology is to create organized systems that actualize human potential. Based on the premise of positive psychology, Fred Luthans proposed positive organizational behaviour or POB. POB applies positive oriented human resource strengths and psychological capacities that can be measured, developed, and managed for performance improvement in today’s workplace.
These POB capacities include confidence, hope, optimism, and resiliency, each of which is described below.
Confidence: Belief in one’s ability to mobilize motivational resources and execute specific course of action within a specific context. Confident people achieve goals and persevere in the face of obstacles.
Hope: The sum of “willpower” and “way power.” Hopeful people have the desire or agency to achieve goals and have the capability to develop various pathways or strategies toward goal accomplishment.
Optimism: A positive explanatory style that attributes positive events to internal, permanent, and pervasive causes and negative events to external, temporary, and institutional ones. Optimistic people take credit for good things that

A Study on Positive Psychological Intervention towards Job Search Attributes among Management Graduates
24
happen to boost morale and distance themselves from bad things that happen.
Resiliency: Capacity to bounce back from adversity, uncertainty, failure, or even positive but seemingly overwhelming changes.
Management Graduates remain confident in their abilities to learn, grow, and contribute and are hopeful and optimistic about their futures in the workplace. In addition, having lived longer and gone through many more life experiences than younger workers, older workers have dealt with life’s ups and downs and have come to realize that change is a constant. They have survived the bad times and thrived in the good times economically, financially, professionally, and personally. This seesaw of surviving and thriving demonstrates a sense of resiliency that students are less likely to have developed.
Intellectual capital includes graduates’ experience, skills, knowledge, intuition, and attitudes developed during an academic period. Institutions help to create intellectual capital by increasing the capacity of students through investing significant amounts of time and money to train and develop their competencies and skills. Moreover, intellectual capital is rapidly becoming an increasing source of value and competitive advantage, as today’s economy becomes more and more knowledge-based. The idea that knowledge can be managed and leveraged for competitive advantage just as a physical or financial asset is a powerful concept. In his book Intellectual Capital: The New Wealth of Organizations, Tom Stewart describes what it takes for knowledge to become such an asset: ‘‘Intelligence becomes an asset when some useful order is created out of free-floating brainpower — that is, when it is given a coherent form. Intellectual capital is packaged useful knowledge.’’ In other words, intelligence becomes an asset when someone can use it to create contributory value. Intellectual Capital as it relates to Management Graduates part of the contributory value comes down to a build-up of intellectual capital through their years of academics achievements. It is simply a matter of ‘‘time in the saddle’’ or ‘‘been there — done that.’’ A perpetual negative attitude toward students prevents institutions from fully harnessing their intellectual capital. The widespread myth that fresh energy, high technology, and a change mindset are characteristics.
Review of Literature
As limited studies have been done on psychological intervention related to other factors/variables. The researcher has taken a new concept ‘A Study of Positive Psychological Approach (Psychology Intervention) in Job Search among University Management Graduates in Indore." and tried to explore factors of psychological interventions such as self-confidence, optimism, hope, self-evaluation, resiliency etc. and apply on the job search attributes among management graduates in Indore.
Anderson, C., Kraus, M. W., Galinsky, A. D., & Keltner, D. (2012), in their study ‘The Local-Ladder Effect: Social Status and Subjective Well-Being’ revealed that socioeconomic status only weakly predicts an individual's subjective well-being (SWB). These results imply that although the pursuit of social status is a fundamental human motivation, achieving high status has little impact on one's SWB. However, the researchers propose that
socio-metric status-the respect and admiration one has in face-to-face groups (e.g., among friends or co-workers)-has a stronger effect on SWB than does socioeconomic status. Using correlational, experimental, and longitudinal methodologies, four studies found consistent evidence for a local-ladder effect: Socio-metric status significantly predicted satisfaction with life and the experience of positive and negative emotions. Longitudinally, as socio-metric status rose or fell, SWB rose or fell accordingly. Furthermore, these effects were driven by feelings of power and social acceptance. Overall, individuals' socio-metric status matters more to their SWB than does their socioeconomic status.
Bird, J. M., & Markle, R. S. (2012) in their research on subjective well-being indicates that it is associated with academic success and positive B- school functioning. Despite a wealth of empirical research demonstrating the benefits of interventions aimed at increasing students' well-being, few educational institutions have adopted evidence-based curricula that address this construct as a means of promoting future academic and social achievement. In addition, numerous studies have begun to identify several factors that contribute to well-being and thus have helped management graduates to be successful in both academic and social domains. These critical factors include personal goal setting, structured mentoring or life coaching, increasing gratitude, problem solving, and interpersonal skills. The present study provides a broad discussion of relevant research findings on these factors and advocates for the adoption of curricula that incorporate these components in order to ensure that best practices are utilized in the campus environment and for positive youth development. Lastly, a theoretical proposal for empirically based assessment and interventions that encompass key components associated with increased students’ well-being is provided.
Konstantina Georgiou et al. (2012), in their study they described the job search process is considered a complex and intensive procedure requiring investment in time and effort on behalf of job seekers. Our study attempts to explore further the effects of a number of individual characteristics on job search behaviour, effort, job search outcomes, as well as, on psychological well-being. We examined these relationships using a daily diary methodology with the participation of 79 recent university graduates–job seekers in Greece at the beginning of the recent financial crisis. Our results did not support the importance of these individual characteristics on job search behaviour, effort, and job search outcomes, but it supported their role of daily psychological well-being, especially their self-esteem. We discuss implications for job seekers to cultivate these skills that are related to these individual characteristics helpful in maintaining a positive psychological state during the job search period.
Bernard, M., Froh, J., DiGiuseppe, R., Joyce, M., & Dryden, W. (2010). Albert Ellis: Unsung hero of positive psychology. This study reveal the contributions of Albert Ellis to the understanding of human happiness including his suggestions for living a happier life have not been represented in the field of positive psychology. This study presents Ellis' theoretical constructs associated with his conception of happiness (dual nature of human psyche, self–actualization, purpose and goals of life and short– and long–term happiness). Eleven of Ellis' rational principles of living (e.g. self–interest, self–direction, self–acceptance, commitment to absorbing activities, hedonism) are

Management Today Vol.4, No.1 January-March 2014
25
presented. When consistently applied in practice, they may help people to experience frequent positive affect, less frequent and intense negative emotions and high life satisfaction. It will show how Ellis' ABC–DE scientific method can be used with individuals to lessen unhappiness. Suggestions are provided for research into associations between rationality and happiness as well as the impact of different rationality–based interventions on happiness. It is hoped that Ellis' rationality–based happiness interventions will become recognized and studied to see if they make a distinctive difference to the science of positive psychology as well as to the lives of everyday people.
Cohn, M. A, Fredrickson, B. L., Brown, S. L., Mikels, J., & Conway, A. M. (2009). ‘Happiness unpacked: Positive emotions increase life satisfaction by building resilience.’ They explored Happiness-a composite of life satisfaction, coping resources, and positive emotions-predicts desirable life outcomes in many domains. The broaden-and-build theory suggests that this is because positive emotions help people build lasting resources. To test this hypothesis, the authors measured emotions daily for 1 month in a sample of students (N = 86) and assessed life satisfaction and trait resilience at the beginning and end of the month. Positive emotions predicted increases in both resilience and life satisfaction. Negative emotions had weak or null effects and did not interfere with the benefits of positive emotions. Positive emotions also mediated the relation between baseline and final resilience, but life satisfaction did not. This suggests that it is in-the-moment positive emotions, and not more general positive evaluations of one's life, that form the link between happiness and desirable life outcomes. Change in resilience mediated the relation between positive emotions and increased life satisfaction, suggesting that happy people become more satisfied not simply because they feel better but because they develop resources for living well.
Planning and decision-making are both essential steps in job searching and both can linked to an individual’s self-efficacy. Keiner used the Self-Regulation Model of Decision Making as developed by Byrnes in 1998.This model defines self-regulation as the process of creating, establishing, and maintaining a sense of control over one’s own actions and psychological processes in an attempt to achieve a desired goal (Keiner 2006). A self-regulated decision maker is defined as an individual who sets adaptive goals and takes appropriate measures to accomplish them (Keiner 2006). A comprehensive understanding of self-regulatory processes not only allows an individual to become more aware of their needs and goals, but also provides a critical framework for achieving these goals. People who use self-regulatory processes to make educated decisions are aware of different situations in which they have both ease and difficulty in making decisions, and they take adaptive and evaluative steps to guarantee positive outcomes. Individuals who have better knowledge of themselves are more motivated and have a better chance of finding a work environment that matches their personality (Keiner 2006). As demonstrated by research on self-regulatory processes, self-efficacy plays an important role in one’s goal setting and accomplishments.
Objectives of the Study
To study the positive psychological approach towards job searching
To study the effectiveness of positive approach
To measure the Graduates’ perception towards job search behavior
Research Methodology
The study population consisted of 300 Management Graduates from various Management Institutions in Indore. A total of 56% were male and the remaining was female. The data was collected through self-structured questionnaire consisted of 25 statements based on 5-point Likert Scale ranges from strongly agree to strongly disagree. The statements were related to aforesaid variable.
Sampling Method: Random and Convenient Sampling Method was used.
Unit of Universe: 150 Students from Management Discipline.
Data Tools: Correlation and Regression Analysis
Based on the above objectives, the following hypothesis was formulated for empirical testing:
H01: There is no significant impact of positive psychological approach on Management Graduates towards job searching attitude.
H1: There is a significant impact of positive psychological approach on Management Graduates towards job searching attitude.
Analysis and Findings
For the analysis of data, we used the correlation and regression analysis Job searching attitude as dependent variable and positive psychological approach as independent variable.
Status: Null hypothesis Rejected
Table-1: Descriptive Statistics
Particulars Mean Std.
Deviation N
Job search attitude 215.5400 26.45919 300 Positive Psychological Approach 24.7633 4.12602 300
Table-2: Correlations
Job
search attitude
Positive Psychological
Approach
Pearson Correlation
Job search attitude
1.000 .745
Positive Psychological
Approach .745 1.000
Sig. (1-tailed)
Job search attitude
. .000
Positive Psychological
Approach .000 .
N
Job search attitude
300 300
Positive Psychological
Approach 300 300

A Study on Positive Psychological Intervention towards Job Search Attributes among Management Graduates
26
Above table shows the correlations and it is evident from this table that Pearson’s correlation coefficient between Positive Psychological Approach and Job search attitude is 0.745 which is significant since the significant value (p- value) 0.000 is less than 0.05. Therefore, we may conclude that there is significant association between Positive Psychological Approach and Job search attitude. Furthermore, since the value of correlation coefficient r suggests a strong positive correlation, we can use a regression analysis to Model the relationship between the variables.
Regression Analysis
Table-3: Model Summaryb
Model R R
Square Adjusted R
Square Std. Error of the
Estimate 1 .745a .555 .554 17.67694
a. Predictors: (Constant), Positive Psychological Approach
b. Dependent Variable: Job search attitude
Table-4: Model Summaryb
Model Change Statistics
R Square Change
F Change
df1 df2 Sig. F
Change 1 .555 371.900 1 298 .000
b. Dependent Variable: Job search attitude
Table-5: ANOVAb
Model Sum of
Squares Df
Mean Square
F Sig.
1 Regression 116209.180 1 116209.180 371.900 .000a
Residual 93117.340 298 312.474 Total 209326.520 299
a. Predictors: (Constant), Positive Psychological Approach b. Dependent Variable: Job search attitude
Table-6: Coefficientsa
Model
Unstandardized Coefficients
Standardized Coefficients
B Std.
Error Beta t Sig.
1
(Constant) 97.219 6.220 15.631 .000 Positive
Psychological Approach
4.778 .248 .745 19.285 .000
a. Dependent Variable: Job search attitude
Fig.-1: Dependent Variable: Job Search Attitude
Discussion Over all model summary shows the value of multiple
correlation coefficient R=0.745, it is the linear correlation coefficient between observed and model predicted values of the dependent variable, Its large value indicates a strong relationship. R2, the coefficient of determination is the squared value of the multiple correlation coefficient. Adjusted R2=0.554, R2 change is also 0.555 and these values are significant which shows that overall strength of association is noteworthy. The coefficient of determination R2 is 0.554; therefore, 55.4% of the variation in job search relates attitude is explained by Positive Psychological Approach.
ANOVA is used to exhibit model’s ability to explain any variation in the dependent variable. ANOVA table exhibits that the hypothesis that all model coefficients are 0 is rejected at 1% as well as 5% level of significance which means that the model coefficients differ significantly from zero. In other words we can say that there exists enough evidence to conclude that slope of population regression line is not zero and hence, Positive Psychological Approach are useful as predictor of Job search.
From the table of coefficients, the regression equation can be obtained as
Job Search= 97.219 + 4.778* Positive Psychological Approach
The normal probability plot is obtained to test the assumption about the normality of residuals and it appears that the residuals are approximately normally distributed. Thus the assumptions for regression analysis appear to be met.
Conclusion As management graduates make the transition to higher
education they take on roles and occupy positions they have never experienced before. During this transition into higher education undergraduates are increasingly asked to consider their next transition through the policy-driven, university-supported employability and skills agenda. Being able to find meaningful employment and maintain it is inextricably linked with thoughts about careers. These career decisions are acknowledged as amongst the most important decisions we make in life and entering higher education is a significant transition point in this process for all, but particularly for young people. However, careers are mainly understood in retrospect. There is after all considerable emotion associated with becoming a student (Christie, 2009). Kidd (1998) stresses the importance of acknowledging the complex interplay between judgements, feelings and actions and how we cannot isolate the emotionalities of career from cognitions and behaviour’. Therefore, we may need to consider work experiences and opportunities to manage our working lives as a forerunner to actually having a career.
With regard to their working life, young people have to take responsibility for their own employment and in so doing they are in the process of creating what Meijers (1998) calls a career identity. If identity refers to how you see yourself, it is made up of your life-history and as such develops as a result of managing roles and transitions and negotiating relationships both socially and structurally. Notions of change and transition are at the heart of current thinking about careers…and careers are work-role transitions‛ (Kidd, 1998). Employability has now become an extension of this identity formation as young adults expect to gain economically from their investment in higher education. The findings also revealed that students engaged with their academic experience, developed career ideas, approached making career choices, or thought about their futures in very different ways.

Management Today Vol.4, No.1 January-March 2014
27
Career identity acts as a cognitive compass that motivates one to actively adapt in order to create or realise opportunities that match career aspirations (Ashforth and Fugate, 2001). Interestingly, Fugate, Kinicki and Ashforth (2004) identify employability as a psycho-social construct consisting of three dimensions consisting of career identity, personal adaptability and social and human capital.
Career identity is the motivational component of employability.
Personal adaptability included knowledge, skills, capabilities and other characteristics valued by employers. People who are adaptable can and are willing to change their personal characteristics to meet the demands of the situation.
Social capital has to do with social networks, interpersonal skills and job search behaviour.
Human capital has to do with age, education, work experience and training, job performance, emotional intelligence and cognitive ability.
Recommendations Based on the findings of this study, the following
recommendations are proffered:
1. University policy makers recognise that students are orientated towards their future employment in different ways.
2. The university does not primarily target instrumental students who are already engaged with the process of gaining graduate employment.
3. Reframe skills for employment as skills for life to include personal development as well as employment.
4. Consider integrating work-related interventions, such as skills development, labour market information, work experience, recruitment procedure knowledge into the curriculum across all degree programmes.
All of these contribute to a person’s ability to obtain work and maintain employment and how much they identify with it. This bears strong similarities to the current concept of employability.
References Anderson, C., Kraus, M. W., Galinsky, A. D., & Keltner, D. (2012).
The Local-Ladder Effect: Social Status and Subjective Well-Being. Psychological science, (May). doi:10.1177/0956797611434537.
Ashforth, B. E. & Fugate, M. (2001). Role transitions and the life span. In B.E. Ashforth (Ed.) Role transitions in organizational life: An identity based perspective (pp. 225-257). Mahah, NJ: Lawrence Erlbaum.Christie, H. (2009). Emotional journeys: young people and transitions to university. British Journal of Sociology of Education, 30(2), 123-136.
Bernard, M., Froh, J., DiGiuseppe, R., Joyce, M., & Dryden, W. (2010). Albert Ellis: Unsung hero of positive psychology. The Journal of Positive Psychology, 5(4), 302–310. doi:10.1080/17439760.2010.498622.
Bird, J. M., & Markle, R. S. (2012). Subjective well-being in school environments: Promoting positive youth development through evidence-based assessment and intervention. The American Journal of Orthopsychiatry, 82, 61-6. doi:10.1111/j.1939-0025.2011.01127.x
Cohn, M. A, Fredrickson, B. L., Brown, S. L., Mikels, J., & Conway, A. M. (2009). Happiness unpacked: Positive emotions increase life satisfaction by building resilience. Emotion, 9, 361-8. doi:10.1037/a0015952.
Fugate, M., Kinicki, A., & Ashforth, B. (2004). Employability: a psycho-social construct, its dimensions and applications. Journal of Vocational Behavior, 65, 14-38.
Kidd, J. M. (1998). Emotion: An Absent Presence in Career Theory. Journal of Vocational Behavior, 52, 275-288.
Konstantina Georgiou et al. (2012) ‘The Role of Job Seekers' Individual Characteristics on Job Seeking Behaviou r and Psychological Well-being International Journal of Selection and Assessment’ Volume 20, Issue 4, pages 414–422.
Meijers, F. (1998). The development of a career identity. International Journal for the Advancement of Counselling, 20, 191-207.
Seligman, M. E. P., & Csikszentmihalyi, M. (2000). Positive psychology: An introduction. American Psychologist, 55, 5-14
About the Author
Mr. Dipesh Gangrade, Assistant Professor (Human Resources), Department of Management Studies, Mathura Devi Institute of Technology
& Management, Indore, Madhya Pradesh, 452018, E-Mail: [email protected]; [email protected]; Mobile No.: +91-
98268-71717; +91-98266-71717; 0731-2906899 (O); Address: H.No.06, Kalp-Taru Avenue, Nagziri, Ujjian-Dewas Road, Near Rukmai Motors,
Maruti Showroom, Ujjian, Madhya Pradesh, 456010.

28
-------------------------------------------------------------------------------
Responsibility of Contents of this paper rests upon the authors
and not upon GRIET publications
ISSN: 2348-3989 (Online)
ISSN: 2230-9764 (Print)
Doi: http://dx.doi.org/10.11127/gmt.2014.03.05 pp.28-31
Copyright@GRIET Publications. All rights reserved.
MANAGEMENT TODAY
-for a better tomorrow An International Journal of Management Studies
home page: www.mgmt2day.griet.ac.in Vol.4, No.1, January-March 2014
A Study on Factors Supporting Risk-Taking (Rt) Propensity of Employees in a Teaching Hospital Krishnamurthy Naidu, S.,1 Subbaraju, G. V.,2 and Naveen Kumar, D.3
1Sr. Asst. Professor, 2Professor and Head, and 3Asst. Professor,Department of Management Studies, Sri Vasavi Engineering College, Tadepalligudem, WG Dist., A.P.
A R T I C L E I N F O Article history: Received 9.12.02013 Accepted 24.3.2014 Keywords: Risk Taking (Rt) Propensity Teaching Hospital Proactive Dimensions Bureaucracy
A B S T R A C T The concept of risk-taking (RT) is examined from various perspectives such as economic, decision-making and psychological. Today, organizations regard RT as a means of discovering the new ways of dealing with problems and finding innovative solutions to them thereof. In any organization, multiple factors influence the RT propensity of an employee at the work place. The present research work is undertaken in a teaching hospital, SVIMS Tirupati, Chittoor Dist in Andhra Pradesh. It examines the factors they support and discourage RT attitude of employees in the hospital. In review of literature of Risk-taking, it is identified as an important dimension of organizational culture. The present paper focuses on correlation of RT with other important dimensions of organizational culture. The paper also examines the significant difference between male and female employee with regard to RT attitude
Introduction
The concept of Risk-taking can be understood as ‘one’s ability to employ innovative methods at workplace’. Innovative behavior is the practical application of new ideas in an effective manner and in conjunction with the objectives of a health organization. However, not every new innovation ends in success; sometimes, new things lead to problems. In this case, RT is the prerequisite for innovativeness. Results of studies on the topic show that risk-taking individuals have higher entrepreneurship and leadership qualities. Risk taking is a necessary element for the desire to produce something and the success of individuals. Seen from this perspective, it is important that a doctor or nurse who uses initiative within the organization encourages other employees to do the same, supports their decisions, and encourages them. In
such an environment, individuals can openly and freely share their thoughts about how to improve things, develop creative solutions, be proactive, and take steps. Research Objective
The present study has been undertaken with the main objective of identifying factors that support and discourage risk-taking in a large scale hospital i.e., teaching hospital (1020 bed capacity). Methods and Material
The environment of a hospital is enveloped by several dimensions. Some dimensions may promote RT, while others are not. In the literature, seven dimensions have been identified, widely used in culture studies, having greater impact and correlation with RT attitude of employees. The dimensions are as follows.
Table.1a. Dimensions identified for the study of organizational culture in review of literature.
Name of the author
Dimensions proposed
Lkert (1967) Leadership, Motivational Forces, Communication Processes, Interaction Processes, Decision Making Processes, Goal Setting Processes, Performance Processes,

Management Today Vol.4, No.1 January-March 2014
29
Control Processes, Training
Robbins (1990) Individual Initiative, Risk Tolerance, Direction, Integration, Management Support, Control, Identity, Reward System, Conflict Tolerance, Communication Patterns
Gordon (1988)
Clarity of Direction, Organizational Reach, Integration, Top Management Contact, Encouragement Of Individual Initiative, Conflict Resolution, Performance Clarity, Performance Emphasis, Action Orientation, Compensation, Human Resource Development
Bettinger (1989)
Attitude Towards Change, Strategic Organization Focus, Performance Standards And Values, Rituals, Concern For People, Reward And Punishments, Openness In Communication, Conflict Resolution, Market And Customer Orientation, Sense of Pride, Commitment, Team Work
Dension (1990) Organization of Work, Communication Flow, Emphasis on People, Decision Making Practices, Influence and Control, Absence of Bureaucracy, Co-Ordination, Job Challenge, Job Reward, Job Clarity, Supervisory Support, Supervisory Team Building, Supervisory Goal Emphasis, Peer Work Facilitation, Group Functioning, Satisfaction, Goal Integration.
Pareek (1996)) Internal, Ambiguity, Tolerant, Context Sensitive, Narcissistic, Future Oriented, Individualistic, Inner Directed, Universal, Role Bound, Androgynous, Power Parity, Expressive, Conserving, Assertive and OCTAPACE
Parida, MathurKhurana 1990)
Support, Structure, Conflict Tolerance, Performance Reward, Individual Responsibility, Risk Tolerance, Individual Autonomy, Beliefs, Group Norms, Exercise of Authority and Identity.
Cooke, Lafferty (1989)
Humanistic/Helpful, Affiliation, Achievement, Self-Actualization, Approval, Conventionality, Dependence, Avoidance, Oppositional, Power, Competitive, Perfectionism
Kilan , Saxton (1983)
Task Support, Task Innovation, Social Relations, Personal Freedom
Sashkin (1984) Work Should be Fun, Being the Best, Innovation, Attention to Detail, Worth and Value of People, Quality, Communicating to Get the Job Done, Growth/Profit/Other Indicators of Success, Hands-on Management, Importance of a Shared Philosophy
Hofsted (2001)
Individualism (IND) Vs. Collectivism, Masculinity(MAS), Power Distance (PD), Uncertainity Avoidance (UA) and Long Term Orientation (LTO).
Selection of Dimensions The hundred and thirty six organizational culture dimensions
which were identified during literature review are not unique
and most of them get repeated and overlapped. Hence, it is attempted to synthesize these dimensions in the following method to develop an instrument to measure culture in organizations.
A panel of five experienced people from the areas of Training, HRD, Academics, Business consulting and Psychology was formed. The list of all the dimensions was given to them individually and the members asked to go through the same to check for repetitions and overlapping. In the light of the intended utility of the instrument for research in the Indian context, particularly in health sector eight dimensions emerged as a result of convergent view and the careful scrutiny of the panel. The dimensions were:
1. Individualistic 2. Power distance 3. Trust 4. Supportiveness 5. Bureaucratic 6. Customer concern 7. Employee concern
1. Individualistic is the degree to which people in an organization acts as individual rather than members of the organization. It is a situation in which people are supposed to look after themselves and their immediate family only. Individualistic culture assumes that any person looks primarily his/her own interest and the interest of his/her immediate family.
a) People here are more individualistic, they complete assigned tasks for which they expect to be completed
b) Great value is given have to good relationship and loyalty to the organization(R)
c) Maintaining harmony is highly valued here(R) d) I have an element of variety and adventure on the
job(R) e) My job gives me sufficient time for my personal and
family life 2. Power distance is the extent to which the less powerful
members of organization accept that power is distributed unequally. It is the degree of inequality among members of an organization considers it normal. a) How often you will be consulted by your direct superior
in his/her decision making. b) How is your working relationship with your boss c) Seniors exercise their authority in most matters and
which is accepted by their juniors(R) d) Hierarchical relationships are seen as necessary for
running the organization(R) e) Achievement and competence are more important than
hierarchical status. 3. Trust here is not used in the normal sense. It is reflected in
maintaining the confidentiality of information shared by others, and in not misusing it. It is also reflected in a sense of assurance that others will help, when such help is needed and will honor mutual commitment and obligations. Trust is also reflected in accepting what other person says at face value, and not searching for ulterior motives. Outcomes of trust are higher empathy, timely support, reduced stress, reduction and simplification of forms and procedures.
a) Offering moral support and help to employees and colleagues in crises.

A Study on Factors Supporting Risk-Taking (Rt) Propensity of Employees in a Teaching Hospital
30
b) Interpersonal contact and support amongst employees.
c) Confiding in seniors without fear of their misusing trust.
d) Trust begets trust. e) When the chips are down you have to fend for
yourself(R). 4. Supportiveness involves working together and using one
another’s strength for a common cause. Involves strategies, work out plans of action, and implement them together.
a) Team work and team spirit is highly valued here. b) Accepting and appreciating help offered by others. c) Performing immediate tasks rather than being
concerned about large organizational goals(R) d) Usually emphasis on team work dilutes individual
accountability(R). e) Employee’s involvement in developing
organizational mission and goals contributes to productivity.
5. Bureaucratic This organization has a culture that supports a methodical approach to doing business. Symbols, heroes, and ceremonies support cooperation, tradition, and following established policies and practices as ways to achieve goals.
a) Designation is more important than anything else in taking responsibility
b) In the organization a person’s designations matters more than the person him/her self.
c) Hierarchy is observed only for critical events in the organization(R)
d) A very formalized and structural place. Established procedures generally govern what people do.
e) The glue that holds company together is formal rules and policies. Maintaining a smooth-running company is important here.
6. Customer concern Customer is viewed as very important in this organization and customer complaints are immediately attended.
a) In this organization customer complaints are immediately attended.
b) Everyone in this organization believes that customers are very important.
c) Employees in this organization are very serious about implementing remedial measures to bring down the number of customer complaints.
d) Members of this organization try to please the customers.
e) Here employees feel happy in serving customers. 7. Employee concern Employees are viewed and respected for
their commitment and dedication. Employees are seen as an important resource in the organization.
a) Employees in this organization feel that the management is interested in exploiting them(R)
b) Prompt attention is given to employees’ grievances in this organization.
c) Employees believe here that the management shows genuine interest in solving their problems.
d) Every employee is seen as an important resource in this organization.
e) Employees are sufficient freedom at their work place.
Risk Taking Experimenting as a value, emphasizes the importance given
to innovation and trying out new ways of dealing with problems in the organization. RT propensity is an individual’s ability and willingness to take risks at the workplace.
a) Employees trying out innovative ways of solving problems.
b) Encouraging employees to take a fresh look at how things are done.
c) Making genuine attempts to change behavior on the basis of feedback received.
d) Thinking out and doing new things tones up organizational vitality.
e) In today’s competitive situation consolidation and stability are more important than experimentation(R).
Note: R indicates reverse questions. Interpretation
A five point Likert scale is used for rating responses of the questionnaire. The ratings are defined as follows.
5 = Always True 4 = True 3 = Undecided 2 = Rarely True 1 = Never True A five point Likert scale is used for rating responses of the
questionnaire. Sampling Technique:
The study was undertaken in SVIMS, Tirupati, Chittoor Dt, Andhra Pradesh.
The respondents which includes doctors and nurses have been selected by using stratified random sampling with proportionate allocation. The table 1.b shows the population and sampling frame in SVIMS. 51 respondents have been studied in the present study which includes 16 doctors and 35 nurses.
Table.1b. Population and Sampling Frame
Hospital
Doctors Present
Qustionnaires Administered
Received
Staff Nurses
Questionnaires Administered
Received
Total
SVIMS
152 35 16 310 50 35 51
Source: field study
Results and Discussion
Pearson correlation test is conducted to know the dimensions
supporting and discouraging RT in the selected hospital. Table 1
shows the results of Pearson Correlation between RT and other
selected dimensions of the organisation.
Table-1c: Relationship between RT and other Dimensions.
S.No. Dimension of
Organisational Culture
(Pearson Correlation) of
Risk Taking
1 Individualistic .517**
2 Power Distance .706**
3 Trust .704**
4 Supportive .538**
5 Bureaucratic -.708**

Management Today Vol.4, No.1 January-March 2014
31
6 Customer Concern .427**
7 Employee Concern -.442**
Source: Field study
Individualistic and RT: It is found that Pearson coefficient
correlation of RT with individualistic dimension is 0.517. This
indicates there is a moderate positive relationship between RT and
individualistic dimension of the organisation.
Power Distance and RT: It is found that Pearson coefficient
correlation of RT with power distance dimension is 0.706. This
indicates that employees exhibited their risk taking behavior when
there is high degree of power distance in the hierarchy.
Trust and RT: The Pearson coefficient correlation of RT with
trust figured out at 0.704. It indicates that where there is trust, there
will be risk taking dimension. The employees will undertake risk
when the other employees have trust on his/her capabilities.
Supportive and RT: The correlation coefficient of Pearson of
RT with supportive dimension was figured at 0.538. It represents that
there is a moderate positive correlation between these two
dimensions.
Bureaucratic and RT: When there is bureaucracy in the
hierarchy in an organization the risk taking culture will be totally
disrupted. It is clear from the Pearson correlation coefficient that
these two dimensions are negatively correlated. In highly
bureaucratic organisations formal rules and structure are more
important than the key contributions of the employees. Hence,
members of these kinds of organisations feel little freedom and more
of mechanical. This could be a possible reason for negative
correlation between bureaucratic and RT.
Customer Concern and RT: The risk taking behavior of
employees will take a hit when high importance is given to the
dimension called customer concern. The Pearson coefficient
correlation of RT with customer concern stood at 0.427 from which it
is clear that the relation between these two dimensions is moderately
low.
Employee Concern and RT: It is an interesting finding of the
study. High employee concern is likely to lessen the Risktaking
propensity of employees. This implies that, when the employee
concern is high, the employees will take the things for granted and do
not take up any risky projects for execution. It leads to organizational
stagnation and curbs the further growth. It was proved with the
figures of correlation coefficient that the correlation between these
two dimensions stood at negative.
Conclusion
Risk-taking is very good means of innovative practices.
Organisations may gain competitive advantage through risk-taking.
Most of the organisations in, irrespective of industry, encourage their
employees to take good enough risk at workplace. The present study
examines the factors pro and against to the Risk taking propensity of
employees in a teaching hospital. From this study it is concluded that
dimensions of organisation such as Individualistic, Power distance,
Trust, Supportive and Customer concern have positive correlation
with Risktaking. But Bureaucracy and employee concern are found to
be negatively correlated with Risk taking. This implies that highly
bureaucratic and high employee concern organisations are likely to
trim down the chances of Risk taking.
8.
About the Authors
Dr. S. Krishnamurthy Naidu, Professor and Head, Department of Management Studies, Sri Vasavi Engineering College, Tadepalligudem,
WG Dist- AP. E-mail: [email protected], Mob:9849763739.
Dr. G. V. Subbaraju, Sr. Asst. Professor, Department of Management Studies, Sri Vasavi Engineering College, Tadepalligudem, WG Dist-
AP. E-mail:[email protected] Mob:9866362674.
D. Naveen Kumar, Asst. Professor, Department of Management Studies, Sri Vasavi Engineering College, Tadepalligudem, WG Dist- AP. E-
mail: [email protected] Mob:9032960145.

32
------------------------------------------------------------------------------
Responsibility of Contents of this paper rests upon the authors
and not upon GRIET publications
ISSN: 2348-3989 (Online)
ISSN: 2230-9764 (Print)
Doi: http://dx.doi.org/10.11127/gmt.2014.03.06 pp.32-35 Copyright@GRIET Publications. All rights reserved.
MANAGEMENT TODAY
-for a better tomorrow An International Journal of Management Studies
home page: www.mgmt2day.griet.ac.in Vol.4, No.1, January-March 2014
Identifying Emotional Competence Proficiencies in Personal Selling: A Study with Reference to Salesmen in Chennai City
Ramesh, G. and Vijaya Kumar, G.
Assistant Professors, Department of Commerce, Sir Theagaraya College, Chennai-600021.
A R T I C L E I N F O Article history: Received 12.12.2013 Accepted 24.3.2014 Keywords: Personality Emotional acceptability Self presentation Skill Fitment
A B S T R A C T Nowadays, it has become a precedent for hiring companies, especially in service sector, to measure the
emotional competence of individuals for ensuring that the selected candidate fit in the position
perfectly. The work atmosphere can be productive and supportive when the people around are
emotionally competent and exhibit the trait at appropriate levels and in right times. Emotional
competence is the ability to understand, use, manage and express one’s emotions. It is the skill to
recognize an individual’s own emotions adequately and respond to other’s emotions appropriately.
Exciting Acceptability and Moral Emotional Flexibility are identified as the most dominant emotional
competence proficiencies among the sales people of Insurance, Banking, Communication and
Automobiles sector in Chennai city.
Introduction
In the ever changing business scenario, organizations are encountering a number of issues in the market as well as in their work places. Intense competition present in almost all industries; unethical practices and obnoxious behavior have become the norms of the day. Today, the emphasis is on the organization’s success in a market and an individual’s performance in the workplace. Since employees tend to show poor performance in few circumstances, no one can win at all times and in all endeavors. Customers complaining, negative environment and leg pulling are common in a work environment which pressurizes even the good performers. The emotional effects of work related pressures are stressful. If employees do not recognize and respond to these situations in time, it will affect their professional and personal lives severely. For dealing with workplace challenges and avoiding pressures from getting too far, an employee can use his emotional competence. The work
atmosphere can be productive and supportive when the people around are emotionally competent and exhibit the right trait at appropriate levels and in right times. What is really emotional competence?
Organizations have always debated on what is that one thing that best judges whether the executive is a perfect fit to the task. Is it the technical skills, personality, work experience or professional expertise? Well, the fitment of the individual to the job profile, can also be assessed with a more important component of personality; emotional competence. Now-a-days, it has become a precedent for hiring companies, especially in service sector, to measure the emotional competence of individuals for ensuring that the selected candidate fits in the position perfectly.
Emotional competence is the ability to understand, use, manage and express one’s emotions. It is the skill to recognize an individual’s own emotions adequately and respond to other’s emotions appropriately. Vebeke et al. (2004) found six emotional competence proficiencies representing emotional competence skills of Indian sales force. They are: Ironic perspective, authentic dealing, Empathy with customers, Emotional acceptability, Ethical emotional flexibility and Self presentation. Emotional competence is the necessary trait for appropriate use of emotional knowledge in specific situation for deriving desired results. With sincere effort and proper guidance an employee can learn, polish and sharpen this skill at any point of his career. An

Management Today Vol.4, No.1 January-March 2014
33
emotionally competent executive can easily manage his emotions with intellect and improve his understanding and interpretation skills. How emotional competence can actually help sales force?
Today’s market offers customers of products and services an abundance of choices to choose from. Sales people perform multiple tasks to create and keep customers. Salesmanship is a dance. Here, every dancer (salesman) is different and every stage (market) is also different. Emotional competence can benefit a sales man in the following ways:
Enhances the performance of a salesman especially when he has to deal with tough marketing scenario; by improving the personal abilities and relational qualities
Improves the professional expertise of sales force through calm and clear approach to the tasks on hand
Makes the sales force more productive with a marked improvement in its attitude
Determines the salesman’s potential to learn of effective selling
Considering the importance of emotional competence and the impact it can make on the sales volume, American Express provided training to its sales force on improving emotional proficiencies. Consequently, the company found that there was a significant increase in sales achieved by those who joined and benefited from such a training session. Review of Literature
Spencer et. al. (1997), there are six emotional competencies: influencing capacity, team leadership, organizational awareness, self-confidence, achievement drive and leadership.
Tsai (2001) has indicated that employee’s positive emotional displays would increase customer willingness to return to the store and pass positive comments to friends.
Bonanno (2001) has suggested that Emotional competency has some similarity to emotional homeostasis in that it reflects reference goals pertaining to ideal frequencies, intensities or duration of experimental, expressive or physiological channels of emotional responses. These reference goals function as personal principles to guide emotional behavior and are exemplified in such virtues as generosity or integrity.
The salespeople manage their emotions in an attempt to develop a new and better self, which in turn can manage emotions (Abraham, 2004, and Schweingruber and Berns, 2005).
Luskin et. al (2005) have measured the effect of EC/forgiveness training on sales and quality of life. The emotional honesty, self-confidence, and emotional resilience can promote superior performance, if positive feedback is delivered in an informative manner, and can mitigate the adverse effects of negative feedback.
Daniel Goleman (1998) described that emotional intelligence has direct applicability to the jobs of all kinds; from sales to leadership.
A number of studies in recent years have established that emotional competence is the key factor contributing to the performance of employees and positively influencing the organizational effectiveness. Objective of the Study
To identify the emotional competence proficiencies among the sales people of Insurance, Banking, Communication and Automobiles sector in Chennai city.
Methodology Nature of the study
To identify the proficiencies of Emotional Competence skills among the sales people of insurance, banking, communication and automobiles sectors in Chennai city we have adapted the domain specific framework developed by Verbeke et.al. (2004). Sample and Sampling Design
A random sample of 700 sales people (175 each from insurance, banking, communication and automobiles) was selected from different companies. However, the valid responses turned out to be 600 due to incomplete responses, yielding response rate of 85.71 per cent. For the purpose of data analysis, descriptive statistics (i.e., frequencies and percentages) and factor analysis were applied. Respondents were asked to emotional competence proficiencies on a five-point scale ranging from “Strongly agree” to strongly disagree”. The analysis was conducted using the SPSS version 20 statistical package. Results and Discussion
Table-1: Characteristics of the Respondents Gender Frequency Percentage
Male 408 68.0 Female 192 32.0 Total 600 100.0
Age (Years) Up to 25 180 30.0
26-35 228 38.0 36-45 120 20.0
Above 46 72 12.0 Total 600 100.0
Educational Qualification Up to HSC 183 30.5
UG 233 38.8 PG 116 19.3
Professional 68 11.3 Total 600 100.0
Experience Less than 1 Year 138 23.0
1-5 Years 252 42.0 6-10 Years 120 20.0
More than 10 Years 90 15.0 Total 600 100.0
Sector Banking sector 150 25.0
Insurance sector 150 25.0 Communication sector 150 25.0
Automobile sector 150 25.0 Total 600 100.0
Source: Computed data Table No.1 highlights the characteristics of the respondents.
The total number of respondents was 600, out of which 408 (68%) were males and 192 (32%) were females. Age-wise analysis shows 72 (12%) were in the age group of above 46 years, 120 (20%) were in the age group of 36-45 years, 180 (30%) were in the age group of up to 25 years and 228 (38%) were in the age group of 26-35 years. When considered educational qualification, 68 (11.3%) were professionals, 116 (19.3%) were postgraduates, 183 (30.5%) had studied upto HSC and 233 (38.8%) were undergraduates. Analysis on the basis of experience shows that 90 (15%) respondents have more than 10 years of experience, 120 (20%) have 6-10 years of experience,

Identifying Emotional Competence Proficiencies in Personal Selling: A Study with Reference to Salesmen in Chennai City
34
138 (23%) have less than one year of experience and 252 (42%) have 1-5 years of experience.
Factor Analysis to identify the exclusive EC proficiencies of sales people: Table 2 shows that the KMO measure is 0.726 thus confirming the appropriateness of the use Factor Analysis. Bartlett’s test of sphericity indicates whether a given correlation matrix is an identity matrix, which would indicate that the variables are unrelated. The significance level gives the result of the test. The values less than 0.05 indicate that there are probably significant relationships among the given variables. A value higher than that, about 0.10 or so, may indicate that the data are not suitable for factor analysis. In this case, the significance level has a very small value i.e. 0.000, which is less than 0.05, thus, suggesting that the variables are highly correlated.
Table-2: KMO and Bartlett's Test Kaiser-Meyer-Olkin Measure of Sampling Adequacy. 0.726
Bartlett's Test of Sphericity Approx. Chi-Square 957.901
df 136 Sig. 0.000
Source: Computed data Table-3: Communalities for factors of Emotional Competence
Communalities EC Initial Extraction
EC 1 1.000 .643 EC 2 1.000 .561 EC 3 1.000 .493 EC 4 1.000 .646 EC 5 1.000 .824 EC 6 1.000 .613 EC 7 1.000 .372 EC 8 1.000 .478 EC 9 1.000 .520
EC 10 1.000 .560 EC 11 1.000 .744 EC 12 1.000 .535 EC 13 1.000 .501 EC 14 1.000 .418 EC 15 1.000 .701 EC 16 1.000 .597 EC 17 1.000 .634
Extraction Method: Principal Component Analysis Source: Computed data The above table shows that communalities for factors of
Emotional Competence among the sales people. The variance ranges from 0.372 to 0.824. It implies 17 variables exhibited the variations from 37.2% to 82.4%. This is statistically significant for derivation of factors.
Table-4: Total Variance Explained for Factors of Emotional Competencies
Co
mp
on
en
t Initial Eigen values Extraction Sums of Squared Loadings
Total Percenta
ge of Variance
Cumulative
percentage
Total
percentage of
Variance
Cumulative
percentage
1 2.713 15.957 15.957 2.613 15.373 15.373 2 1.674 9.845 25.802 1.303 7.663 23.036 3 1.236 7.272 33.073 1.291 7.594 30.629 4 1.091 6.420 39.494 1.227 7.216 37.846
5 1.070 6.293 45.787 1.225 7.204 45.050 6 1.043 6.134 51.921 1.113 6.546 51.596 7 1.015 5.972 57.893 1.071 6.297 57.893 8 .968 5.695 63.588 9 .865 5.090 68.678
10 .837 4.924 73.602 11 .788 4.637 78.239 12 .728 4.283 82.521 13 .686 4.034 86.555 14 .653 3.838 90.394 15 .621 3.653 94.047 16 .519 3.054 97.101 17 .493 2.899 100.000
Extraction Method: Principal Component Analysis Source: Computed data The above table highlights the total variance explained for
factors of Emotional Competencies. The total 17 variables are reduced into 7 predominant factors with the individual variances (15.957, 9.845, 7.272, 6.420, 6.293, 6.134 and 5.972). The seven factors are represented by the considerable number of underlying variables.
Table-5: Rotated Component Matrix for Identifying Emotional Competence
Component 1 2 3 4 5 6 7
EC 2 0.691 EC 8 0.686 EC 9 0.685 EC 13 0.665 EC 3 0.629 EC 7 0.560 EC 4 0.769 EC 6 0.747 EC 16 0.741 EC 15 0.720 EC 1 0.727 EC 10 0.683 EC 17 0.653 EC 14 0.580 EC 12 0.470 EC 11 0.847 EC 5 0.890
Extraction Method: Principal Component Analysis Rotation Method: Varimax with Kaiser Normalization a rotation
converged in 11 iterations. Source: Computed data
The above table shows that the prime seven components which played a great role of identifying the EC among the sales people in Chennai city. The rotated component helps in making a broad interpretation of seven parameters that are identified. The first factor is the most important factor explaining 15.957% out of the total variance. In total, six statements load on this factor. Highest loading is for the statement “Others have learned to accept the way I manage my emotions” (0.691) followed by the statements “I feel that my expressed emotions are a part of my sincere and deeper self” (0.686), “People accept how I mange emotions (0.685), “I am acquainted with creating emotions to facilitate the process of a sales interaction” (0.665), “I can easily show a different type of emotions when the situation as for it” (0.629) and “My expressed emotions are a part of what I see as

Management Today Vol.4, No.1 January-March 2014
35
my truthful way of dealing with people” (0.560). It is named as “Exciting Acceptability”.
The second factor explains 9.845% out of total variance, which comprises two statements. The highest loading of this statements is “I am always flexible with my emotions but only up to a limit” (0.769) and “I feel little or guilt about the way I manage my emotions” (0.747) which is called as “Moral Emotional Flexibility” The EC proficiency of “Moral Emotional Flexibility” assumes that sales peoples morality and ethical values greatly influence their emotional responses. The sales people should have the morality and flexibility at the time of their business calls with the customers.
The third factor explains 7.272% out of total variance, which comprises two statements namely “whatever happens, I have learned to accept my emotions and look at them with some humor/irony” (0.741) and “when I laugh, I am relieved of the worry – if my emotions are adequate for the given social context” (0.720). It is named as “Positive Perception”. The EC proficiency of “Positive Perception” empowers the sales people to disassociate themselves from negative feelings. Positive is the ability to view the experiences from newer perspectives. Sales people with “Positive Perception” realize that anything can be made to look good or bad by describing it. Positive perception enables sales people to tolerate emotionally ambiguous situations. The sales people should be away from the distress aroused by the emotional coping strategies. Therefore, they are better prepared to handle conflicting emotional and mental states. When their emotions get too strong, they normally laugh at themselves and are relieved of the worry if their emotions are adequate for the given situation or not.
The fourth factor explains 6.420% out of total variance. This factor comprises of two statements, “I can easily put myself in the place of my customers and their requirements” (0.727) and when I laugh at my self- it helps me in not getting too emotional” (0.683). It is represented as “Customer oriented”. The EC proficiency of “Customer oriented” is the sales people are better listeners and tend to be better performers. They have the ability to provide good services to customers.
The fifth factor explains 6.293% out of total variance, which comprises of three statements namely “I can easily laugh at myself when my emotions get too strong” (0.653), “I feel that people can quickly feel my emotions” (0.580) and “I feel some guilt when showing my enthusiasm during a sales interaction
(0.470). It is named as “Self Confidence” The EC proficiency of “Self Confidence” is capable of dealing actively with customers during the sales calls.
The sixth factor explains 6.134% out of total variance, which comprises of only one statement namely “I manage my emotions keeping in mind certain societal/moral norms” (0.847). This factor can be interpreted as “managing emotions”.
The seventh factor explains 5.972% out of the total variance, which comprises only one variable like “I can tune my emotions to those of my customer” (0.890), which can interpret as “positive emotions for my customer”.
Conclusion Undeniably, organizations with emotionally competent
employees influence the buying behavior of consumers and dominate their decisions. Recent recession and uncertainty of market have made a vast majority of employees overwhelmed and anxious. If they can make few corrections in managing their emotions, they can overcome any challenge that comes in their way. The present study is an attempt to find out the factors contributing the emotional of sales force in Chennai city. An analysis of the results depicts seven key factors leading to the emotional competence. Becoming and being emotionally competent begins and ends with particular salesman. However, focusing on development of this trait of sales force can generate significant returns to organization over the long run; leading to a better future in the market.
References: Spencer, L.M.J., McClelland, D. C. and Kelne, S. (1997),
Competency Assessment Methods: History and state of the art, Hay/McBer, Boston.
Tsai Wei-Chi (2001), “Determinants and Consequences of Employee Displayed positive Emotions”, Journal of Management, Vol.27, No.4, pp.497-512.
Bonanno, G. A. (2001), “Emotion self-Regulation”, in T J Mayne and G a Bonanno (Eds.), Emotions: current issues and future direction, pp.286-310, Guilford, New York.
Edwin B. Flippo (1984), “Personnel Management”, Sixth Edition, Mc-Graw Hill, New York.
Tripathi, P.C (2005), “Human Resource Development” Fourth Revised edition, Sultan Chand & Sons, New Delhi
Khanka, S. S (2005), “Human Resource Management( Text and Cases)”, S Chand & Company Ltd., New Delhi.
About the Authors
Dr. G. Ramesh and Assistant Professor,, Department of Commerce, Sir Theagaraya College, Chennai-600021. Email: [email protected],
and
Dr. G. Vijaya Kumar, Assistant Professor, Department of Commerce, Sir Theagaraya College, Chennai-600021. Email: [email protected]

36
---------------------------------------------------------------------------
Responsibility of Contents of this paper rests upon the authors
and not upon GRIET publications
ISSN: 2348-3989 (Online)
ISSN: 2230-9764 (Print)
Doi: http://dx.doi.org/10.11127/gmt.2014.03.07 pp.36-41
Copyright@GRIET Publications. All rights reserved.
MANAGEMENT TODAY
-for a better tomorrow An International Journal of Management Studies
home page: www.mgmt2day.griet.ac.in Vol.4, No.1, January-March 2014
Impact of Stress on Organisation Commitment of Officers and Jawans; A Study of Indian Army Nidhi Arora Kumar
Asst. Profssor, SRM University, Email: [email protected] .
A R T I C L E I N F O Article history: Received 20.12.2013 Accepted 24.3.2014 Keywords: Indian Army Officers Jawans of Indian Army
A B S T R A C T
The present study focuses on the impact of Stress on Organizational Commitment among the officers and jawans of Indian Army. It consists of a sample of 200 associates of Indian Army. Out of which 100 officers and 100 jawans are selected. For this purpose the Organizational Commitment Instrument and Stress Questionnaire were administered individually to all officers and jawans. Regression technique was applied to see the impact of variable of stress on Organizational Commitment of officers and jawans. The results revealed that the dimensions of stress selected for study have no impact on organisational commitment level in case of jawans of Indian Army and in case of officers of Indian Army dimensions of stress under study have negative impact on organisational commitment level.
Introduction
Stress is a prevalent and costly problem in today's workplace. About one-third of workers report high levels of stress (NIOSH 1999). One-quarter of employees view their jobs as the number one stressor in their lives (Northwestern National Life Insurance Company 1991). Three-quarters of employees believe that the worker has more on-the-job stress than a generation ago. Evidence also suggests that stress is the major cause of turnover in organizations. With continued stress at the workplace, workers will develop psychological and physiological dysfunctions and decreased motivation in excelling in their position.
A person's status in the workplace can also affect levels of
stress. While workplace stress has the potential to affect employees of all categories; from those who have very little influence to those who make major decisions for the company. However, less powerful employees (that is, those who have less control over their jobs) are more likely to suffer stress than powerful workers. Managers as well as other kinds of workers are vulnerable to work overload (Primm, 2005).
Although just enough stress can be good thing, stress overload is a different story. Pressures that are too intense or last too long or troubles that are shouldered alone can cause people to feel stress overload. Here are some of the things that can overwhelm the body‘s ability to cope if they continue for long time:
Relationship stress, family conflicts or the heavy emotions that can accompany a broken heart or the death of a loved one.
Crammed schedules, not having enough time to rest and relax, and always being on the go.
Bullying in the workplace can also contribute to stress. This can be broken down into five different categories:
o Threat to professional status o Threat to personal status o Isolation o Excess Work

Management Today Vol.4, No.1 January-March 2014
37
o Destabilization i.e. lack of credit for work, meaningless tasks etc
This in effect can create a hostile work environment for the employees, which in turn, can affect their work ethic and contribution to the organization.
Some stressful situations can be extreme and may require special attention and care. Posttraumatic stress disorder is a very strong stressor, making even small difficulties seem like crises. If a person frequently feels tense, upset, worried, or stressed, it may be a sign of anxiety. Anxiety problems usually need attention, and many people turn to professional counselors for help in overcoming them.
In the era of globalization, organizations of market economies face strong pressures to be both efficient and produce value added outputs. The goal of efficiency and competitiveness can be attained if organization possesses the right people with right attitude or skills. That is why the organizations across the business landscape are being seen battling out for workforce share in a way they battle for market share. Organizations have realized that their survival largely depends upon their ability to attract, motivate and retain the key talent needed to meet aggressive business goals and gain competitive edge. While the factors such as capital, equipment, and other resources are important for organizational success, the human factor appears to be the most important one since it is the people who have to use all other resources. Without the productive efforts and whole-hearted engagement of the workers, the material and other resources of the organization would be of no use. Not even the latest technologies would be able to produce the targeted results for the organization without the right people with right attitude to utilize them. In support of this viewpoint, Robbins (1978) has pointed out that the existence of dedicated or committed employees serves as the “pivotal variable without which the inanimate assets are worthless.” Several reputed research and consulting organizations also suggest that committed workforce is a “hallmark” of successful organization. Committed dedicated employees are expected to be more productive and work with focus on quality to increase the profitability of the organization. In other words, committed employees are salient resources and the foundations of any organization. The most widely accepted conceptualization of organizational commitment is the model forwarded by Allen and Meyer (1990). These researchers have come up with the most influential model which has three components: Affective Commitment, Continuance Commitment and Normative Commitment. Meyer and Allen (1991) provide a description of each of these components as follows;
Affective commitment involves the employee’s emotional attachment, identification and involvement in the organization. Employees with a strong affective (emotional) commitment continue employment with the organization because they want to do so.
Continuance commitment involves commitment based on cost that employee associates with leaving the organization. Employees, who perceive the cost of leaving the organization is greater than the cost of staying, remain because they need to do so.
Normative commitment involves the employee’s feeling of obligation to stay with the organization. Employees with high level of normative commitment stay in the organization
because they feel they ought to.
Employee commitment refers to psychological attachment of workers to their workplace (Allen , Meyer, O’reilly & Chatman 1986), commitment to organization is positively related to such desirable outcomes as job satisfaction (Bat man & Stasser, 1984; Mowday. Porter & Steers 1982), motivation (Mowday, Steers & Porter 1979) and attendance and negatively related to such outcomes as absenteeism and turnover. However, the relationship between organizational commitment and job performance is more feeble. About the Organisation
The Indian Army has its origin in the armed guards of the East India Company of merchant from Britain. These guards were required for the company’s protection. Initially there were Englishmen but gradually Indians were also enrolled. In 1902 when Lord Kitchener took over as Commander–in-Chief (C-in-C) of Army it was further reorganized as a new regular force. In 1947, with the partition of the country, two-third of the strength remained with India and one-third went away to Pakistan. On the eve of our independence the strength of undivided Army was nearly 25, 00,000.On 15 January 1948, Lieutenant General K.M. Cariappa became the first Indian Commander- in –Chief (C-in-C). 15 Jan is now celebrated every year as ‘Army Day’. Our Army is the ultimate insurance policy to safeguard our freedom as it stand guarantee against disintegration of the country, whether planned by the enemies outside the country or from within.
India has 1.13 million strong Army making it world’s second largest Army. No better soldier than the Indian soldier. The Indian soldier can suffer the privacy, his needs are few and more importantly, he can brave the hardship of Army life even in combat better than any other soldier in the world. Though it has not fought a full blown war in decades, the force is bogged down in fighting domestic insurgencies, guarding restrictive borders and sometime quelling civilian rioting. Each type of profession has its own difficulties and demands adjustment to it. Adjustment and devotion in any work get hampered by non-fulfillment of basic needs e.g. physical and emotional needs and this is true for our army men too. The need for physical survival and bodily comforts includes the needs for food, clothing, shelter, sleep, rest etc the love and affection for family, religious as well as national sentiments are emotional needs that drives human behavior. The changing times through which army has traversed during the past over six decades, the Politico-Bureaucratic establishment, the socio-economic changes and the consequent changes in value of the society and advent of booming electronic media and telecommunication revolution have had their direct impact on the men in the uniform. Their levels of aspirations are high and they feel they are left behind in the race of life than their counterparts in the civil society. The armed forces personnel have perceived to have been neglected vis-à-vis their counterparts especially the IAS/IPS cadres. Armed forces appear to be the last option for the youth. This transition is inconsistent with the core value of Armed Forces depriving them of the best material in the youth and resulting in the continued shortage of officers in junior ranks.
Stress has become the biggest wary of the Army personnel. Stress therefore is the byproduct of the environment from which they come and the environment in which they operate Violence by itself has become synonymous with trauma and stress. That is why 80,000 people from Kashmir alone complained of depression during 2005-6 with over three fourth of them being

Impact of Stress on Organisation Commitment of Officers and Jawans; A Study of Indian Army
38
diagnosed with serious physiological disorders. Axiomatically, warfare without doubt is among the most distressing circumstances that human beings endure. To be separated from family, friends and familiar locations for longer period is sufficient enough to produce stress reaction in most healthy people. Death and injuries to friends and colleagues are emotionally devastating and cause intense grief reaction. Add in the constant threat of personal maiming or death and contributions to killing of others. The result is extremely high level of psychological arousal, aggression, anxiety and fear. Therefore from Generals to the enlisted in lower ranks everyone in the military is stressed. Literature Review
Dixit K.C (2011) - This paper attempts to discuss the main causes of stress in Army including cases of suicides and fratricides, studies on stress related incidents, action taken by the organization/ government to address the issue and finally recommended focus areas. The methodology adopted involved the study of literature, Reports, journals, interaction and survey during field trips. The survey was through two different questionnaires. The survey sample consisted of 100 officers, 100 JCOs and 300 other ranks. The analysis of factors in sample survey related to operational as well as domestic environment suggests that the cumulative effect of the professional and domestic pressures induce varying levels of stress in Army personnel.
Sharma Ritu (2010) - The article states that prolonged deployment in difficult areas and staying away from families causes stress in Indian soldiers. In 2007, 86 cases of suicide and fratricide were reported in armed forces of which the Army accounted for 70 suicides, the Army had witnessed two cases of fratricide with soldier shooting dead their seniors. In 2006, the armed forces witnessed 146 suicides. Soldiers have to live a tough life and stress levels are high.
Col Kapoor R, (2007) - This article states the consequences of poor approachability and poor relationship with subordinates in Army. The poor approachability leads to stress, lack of communication, lack of spirit, lack of credibility, poor self-esteem, suspicion, Isolation, Lack of courtesy, Inconsiderate behavior, Rude behavior, arrogance and self-centeredness.
Gilani Iftikhar (2006) - According to the article, 34 percent soldiers deputed in Jammu & Kashmir was diagnosed as severely stressed and 50 percent moderately stressed. 28 percent were clinically depressed, 39.5 percent had become alcoholics and 12 percent were headed towards alcoholism. Indian Army Headquarters receive fortnightly reports about soldiers going mad and killing their colleagues or committing suicides. No official figures of suicides by soldiers posted in Jammu and Kashmir are available, but sources claimed that around 100 soldiers each committed suicide in 2003, 2004 and 2005. 96 percent of suicides were cause by tension over family welfare and property disputes. The Indian Army has just two stress-relief stations (rest and rehabilitation centers), one on the high-altitude Bhalu Ridge and another in the transit camp. However, these stations are activated only during summer when soldiers from high-stress belts are brought there to relax. According to Study undertaken in 2005, the Indian Army evolved a multi-pronged approach to keep soldiers’ calm. Measures include briefing and debriefing when soldiers go on leave and return, liberal leave, timely rest, sight-seeing tours, yoga and interactions with officers. Posted a psychologist counselor with each unit. The study highlighted that 93 percent of soldiers experienced stress
from exposure to live-fire operations while 98 percent were stressed by the fear of being ambushed during patrol. 24 percent were stressed about the futility of continuous low-intensity conflict without the support of the local and civil administration. Many (63.5) experienced stress from seeing militants and colleagues being killed or wounded. Topping the list of “operational stressors” was frustration at fighting with “one arm tied behind the back” (88%) and anger at public admonishment (84%). There is also bitterness among 64 percent at not being able to deal with unarmed but vicious ideologues, motivators, and financers.
Krista L, Kelly S. Ervin (2008) - The purpose of this research was to examine how work experiences contribute to junior officers’ intentions to leave the Army. Specifically, we hypothesized that psychological climate perceptions have direct and indirect effects on intent to leave through affective commitment and morale and that affective and continuance commitment interact to predict intent to leave the Army. The sample for this study was 649 captains who responded to an Army-wide survey, the fall 2002 Sample Survey of Military Personnel. Results demonstrate support for full mediation, indicating that psychological climate impacts intent to leave the Army by influencing captains’ affective commitment and morale. The psychological climate dimension of leadership had the largest impact on affective commitment, morale, and intent to leave the Army. Affective commitment did not interact with continuance commitment to predict intent to leave. Implications for Army retention policies and leadership are discussed.
The main purpose of this paper is:
To study the impact of various dimensions of stress on organisational commitment level among Indian Army officers and jawans.
For this purpose, the hypotheses are as follows:-
Unpleasant Superior Subordinate Relationship, War Time would have a negative impact on Organisational Commitment among Indian Army Officers and Jawans.
Field Posting and Role Ambiguity would have impact on Organisational Commitment among Indian Army Officers and Jawans
Misuse of Authorities and Inadequate Salary and Rewards will have a negative impact on Organisational Commitment among Indian Army Officers and Jawans
Rationale of the Study Survival of any organisation largely depends upon their
ability to attract, motivate and retain the key talent needed to meet aggressive organisational goals. While the factors such as capital, equipment and other resources are important for organisational success, the human factor appears to be the most important since it is the people who have to use all other resources. The material and other resources of the organisation would be of no use not even the latest technologies would be able to produce the targeted results for the organisation without the right people with the right attitude to utilize them. Research Design
The sample of this study consists of 100 Jawnas and 100 Officers from various units of Indian Army. Methodology
Simple Random sampling technique was followed to obtain a representative sample. The questionnaires were administered

Management Today Vol.4, No.1 January-March 2014
39
personally to all the associates. There were certain tools which were used in the form of questionnaire and scales to test the hypothesis. The tools and scales have been briefly described below:
1. Organisational Stress Questionnaire (Officers):
This questionnaire was developed by the researcher to find out the stress among Officers of Indian Army. It is a 29 –item questionnaire consists both positively and negatively keyed items in which each statement is rated on a 5-point scale from true to almost no extent to true to very great extent. The test retest reliability of the test is 0.73. In all, 10 dimensions were identified to measure the magnitude of job stress. These are as follows:
a) Superior Subordinate Relationship: A situation of stress where incumbent perceives the unpleasant relationship with superior
b) Role Ambiguity: A situation of stress where incumbent is
not clear about the requirements of the job c) Misuse of Authorities: A situation of stress where
incumbent feels that his/her superior misuses the authorities
d) Role Overload: A situation of stress where incumbent
feels that he is required to do too much
e) Salary and Promotions: A situation of stress where
incumbent feels that salary and promotions are not
according to the work and performance
f) Family Problems: A situation of stress where incumbent
experiences problem on family front due to job
g) Separation from Spouse: A situation of stress when
incumbent has to be separated from the spouse due to
requirements of the job
h) Field Posting: A situation of stress when incumbent is posted in insurgency areas
i) War Time: A situation where incumbent feels stressed due to violence and fear of loss of life
j) Health: A situation of stress where incumbent feels that his/her health problem is due to job
a) Role Ambiguity: A situation of stress where incumbent is not clear about the requirements of the job
b) Misuse of Authorities: A situation of stress where incumbent feels that his/her superior misuses the authorities
c) Role Overload: A situation of stress where incumbent feels that he is required to do too much
d) Salary and Promotions: A situation of stress where incumbent feels that salary and promotions are not according to the work and performance
e) Family Problems: A situation of stress where incumbent experiences problem on family front due to job
f) Separation from Spouse: A situation of stress when incumbent has to be separated
2. Organisational Stress Questionnaire (JAWANS): This questionnaire was developed by the researcher to find
out the stress in Jawans of Indian Army. It is 50 –items questionnaire consisting of both positively and negatively keyed items in which each statement is rated on a 5-point scale from true to almost no extent, true to very great extent. The reliability of the questionnaire is 0.7.In all 13 dimensions were identified to measure the magnitude of job stress. These are as follows:
a) Superior Subordinate Relationship: A situation of
stress where incumbent perceives the unpleasant relationship with superior
b) Role Ambiguity: A situation of stress where incumbent is not clear about the requirements of the job
c) Role Overload: A situation of stress where incumbent feels that he is required to do too much
d) Misuse of Authorities: A situation of stress where incumbent feels that his/her superior misuses the authorities
e) Salary and Promotions: A situation of stress where incumbent feels that salary and promotions are not according to the work and performance
f) Family Problems: A situation of stress where incumbent experiences problem on family front due to job
g) Separation from Spouse : A situation of stress when incumbent has to be separated from the spouse due to requirements of the job
h) Field Posting: A situation of stress when incumbent is posted in insurgency areas
i) War Time: A situation where incumbent feels stressed due to violence and fear of loss of life
j) Health: A situation of stress where incumbent feels that his/her health problem is due to job
k) Suicide: A condition of stress where incumbent feels like to ends his life
l) Fratricides: A condition of stress where incumbent feels like to kill others
m) Leave : A condition where incumbent feels stressed due no grant of leave
3. Organisational Commitment Instrument
This questionnaire was developed by Balaji (1979). The instrument attempts to measure OC defined as “the relative strength of an individual’s identification with an involvement in a particular organization”. It consists of 15 statements; out of 15 six of statements are negatively phrased and reversely scored to reduce response bias. It employs a seven point likhert type response format with anchors: Strongly Disagree, Moderately Disagree, and Slightly Disagree, Neither agree Nor Disagree, Slightly Agree, Moderately Agree, Strongly Agree. The average of scores for the statement provides the index of OC, higher score indicating stronger OC. OCQ has reasonable strong internal consistency and test retest reliability the convergent, discriminate and predictive validities were of acceptable levels. Results and Discussion
Scrutiny of the regression table (Table 1.1 Multiple Regression for Organisational Commitment (Officers)) shows that multiple correlation between Organisational Commitment and various predictors is 0.78 indicating that there exists a significant relationship among them. R square indicates to what extent Stress variables are influencing the Organisational Commitment. In this model it was found to be 0.62, which means that 53% of variance is caused by the Stress variables we have selected for our study.
The t values are found to be significant for Role Ambiguity (-2.25), Field Posting (-3.63) and War Time (-3.67). This implies that Role Ambiguity, Field Posting and War Time have significant negative impact on Organisational Commitment. Rests of the Stress variables selected for the study are not significantly influencing the Organisational Commitment of Indian Army Officers.

Impact of Stress on Organisation Commitment of Officers and Jawans; A Study of Indian Army
40
Model Summary
Model R R
Square Adjusted R
Square Std. Error of the
Estimate F Sig.
1 .788a .621 .535 12.14021 7.223 .000b
Coefficientsa Table-1.1: Multiple Regression for Organisational
Commitment (Officers)
Model Unstandardized
Coefficients Standardized Coefficients t Sig.
B Std. Error Beta (Constant) 114.005 13.321 8.558 .000
SS -.012 .709 -.002 -.017 .987 RO -.378 1.096 -.035 -.345 .732 RA -2.173 .965 -.269 -2.252 .029 MA .753 1.009 .083 .747 .459 FP -4.228 1.163 -.482 -3.636 .001 WT -1.839 .501 -.517 -3.671 .001 SAL -.006 .949 -.001 -.006 .995
HLTH -1.433 1.534 -.109 -.934 .356 SPRN .919 .914 .151 1.005 .320 FMP 1.008 .706 .152 1.426 .161 a. Dependent Variable: Organisational Commitment Frequent redeployment is unique characteristic of CI
operations. Large numbers of troops are sent out as patrol to carry out search operations without proper intelligence report. It gets very frustrating when there is no contact with militants moreover inadequacy of specialized equipment is another factor which enhances stress when the militants are equipped with modern technology arms. The Army Personnel could also become a victim of human right violation for inflicting casualties and collateral damage during an encounter with the militants in populated areas. The open aversion of the public to the security forces adversely affects the Officers. The fear of perpetuating human rights violations and subsequent judicial harassment inhibits the action of Army Personnel and also make them vulnerable to militants during operations. The worst is when the higher commanders fail to hold the hands of subordinates during HR violation. No Mistake Syndrome impacts the psyche of the person in uniform. When operations are on, reverses is a natural fall out. But this is not acceptable and formal enquires are ordered. This has a negative impact on Officers. War time is the stressful time for Armed Forces personnel and their families. Army fights with enemies during war but there are various other factors like obsolete defense system and lack of adequate weaponry creates stress and decreases the Organisational Commitment. During War Time the Misuse of Authorities are high. The living and hygienic conditions during war are not good. The fear of unknown and concern for the family back home particularly in case something happens to them. The officer is constantly tense at the uncertainty of the family if he/she is killed in action. During Field Posting Officers cannot take their families with them and anxiety results when family is left alone and Officers are not able to solve the problems of the family and officers feels like that their family is suffering because of their job and posting. H/she misses them a lot as they are very much attached with the family and thus feels the pangs of separation; all this reduces the Commitment of officers towards the Organisation. As it is well known fact that there is shortage of officers in Indian Army the officers are overburdened and sometime more and irrational works are being assigned to the Officers that does not match with their qualifications. Even
objectives of assigned work are not clear cut and well defined. This affects the performance and career of individual and thus and thus it impacts negatively on Commitment of officers towards the Organisation.
On the basis of the above result the hypothesis:
Unpleasant Superior Subordinate Relationship would have a negative impact on Organisational Commitment among Indian Army Officers is rejected.
War Time would have negative impact on Organisational Commitment among Indian Army Officers is accepted.
Field Posting and Role Ambiguity would have impact on Organisational Commitment among Indian Army Officers is accepted.
Misuse of Authorities and Inadequate Salary and Rewards will have a negative impact on Organisational Commitment among Indian Army Officers is rejected.
Model Summary
Model R R Square
Adjusted R Square
Std. Error of the Estimate
F Sig.
1 .403a .163 .040 11.88444 1.329 .212b
Coefficientsa
Table-1.2: Multiple Regression for Organisational Commitment (Jawans)
Model Unstandardized
Coefficients Standardized Coefficients t Sig.
B Std. Error Beta (Constant) 100.016 7.876 12.698 .000
SS -.149 .319 -.066 -.468 .641 RO -.684 .472 -.215 -1.449 .151 RA -1.124 .679 -.194 -1.656 .101
FRT -.238 .821 -.035 -.290 .773 SAL -.135 .366 -.046 -.368 .714 FP -.263 .453 -.074 -.581 .563 WT -.082 .282 -.034 -.291 .771 MA -.604 .838 -.078 -.721 .473
FMP .796 .377 .325 2.111 .038 SPRNS -.170 .641 -.033 -.265 .792
HP -.561 .760 -.086 -.738 .462 LV -.057 .520 -.014 -.110 .913
SUICIDE -.905 2.150 -.046 -.421 .675 a. Dependent Variable: Organisational Commitment The regression table (Table 1.2 Multiple Regression for
Organisational Commitment (Jawans)) shows that R square is not significant as indicated by F value (1.329). It indicates that there is no significant relationship between Stress variables under study and Organisational Commitment. Although jawans of Indian Army are more stressed than the officers of Indian Army but still jawans are more committed to the organisation. It could be due to various factors. They are not qualified enough to get good job anywhere else at same payband. Army provides various facilities to them and their families like free ration, free education to their wards and free accommodation. Even after them army takes care of their families.
On the basis of the above results the hypothesis:
Unpleasant Superior Subordinate Relationship, War Time would have a negative impact on Organisational

Management Today Vol.4, No.1 January-March 2014
41
Commitment among Indian Army Jawans is rejected. Field Posting and Role Ambiguity would have impact on
Organisational Commitment among Indian Army Jawans is rejected.
Misuse of Authorities and Inadequate Salary and Rewards will have negative impact on Organisational Commitment among Indian Army Jawans is rejected.
Conclusion On the basis of present research, it can be concluded that
jawans are more stressed than the Officers of Indian Army. The relationship between Superior and Subordinate is also more unpleasant in case of jawans than the officers of Indian Army. Also, the results reveal that the jawans of Indian Army are more committed towards their organization as compared to the officers. None of the variables of Stress under study have impact on Organisational Commitment of jawans of Indian Army. Soldier of Indian Army is committed to the organisation under all circumstances. Whereas in case of officers Stress variables: Role Ambiguity, Field Posting and War time have negative impact on the Organisational Commitment.
Bibliography Books / Journals and Working Papers Balaji .C. (1986), “Organisational Commitment Instrument”, In
Indian Journal of Industrial relation Vol.21, No3, January. Col Kapoor Rajeev(2007), “Armed Forces And Approachability At
Senior Level”, Light Reading, USI Journal, Pg 48-50 Colligan, Thomas W; Colligan MSW, & Higgins M. (2006).
"Workplace Stress - Etiology and Consequences". Journal of Workplace Behavioral Health 21 (2): 89–97.
Concha, Anton. "The Impact of Role Stress on Workers' Behaviour through Job Satisfaction and Organizational Commitment", International Journal of Psychology, Spain, June 2009.
Dixit K.C(2011), “Addressing Stress-Related Issues in Army”, IDSA Occasional paper No 17.
Ganesh, M.P.(2005) “Level of Organisation Commitment”, journal of Organisation behavior.pp.49.
Jennifer Lee Gibson, Trueman R. Tremble “Influences of Work-Life Support of Officers’ Organisational Commitment and Negative Work-Family Spillover”, U.S. Army Research Institute for The Behavioral and Social Sciences Army Project Number 622785A790 Personnel Performance and Training Technology.
Krista L. Langkamer, Kelly S. Ervin, “Psychological Climate, Organizational Commitment And Morale: Implications For
Army Captains’ Career Intent”, Military Psychology, 20:219–236, 2008.
Maj Gen Samayram UYSM, AVSM, VSM (Retd), “Stress, Suicide and Fratricide in the Army” Vij Books India Pvt. Ltd.
Mishra P.C. Srivastava S. (2001) “Job Stress as a Moderator Variable Of The Organisational Commitment And Job Satisfaction Relationship”, Journal Of Indian Academy Of Applied Psychology 2001 Jan-Jul; 27 (1-2):45-49.
Mowday, R., Porter, L. and Steers, R. (1981). “Employee Organization Linkages”, New York: Academic Press.
Mowday, R, Steers & Porter (1982), “Measurement of Organisational Commitment, Journal of Vocational Behavior, pp.224-247.
Meyer, J. P. and Allen, N. J. (1991). “A Three-Component Conceptualization of Organizational Commitment: some Methodological Considerations”, Human Resource Management Review, 1, Pp. 61-98.
NIOSH (1999). Stress at Work, U.S. National Institute for Occupational Safety and Health, DHHS (NIOSH) Publication Number 99-101.
Selye Hans, “The Stress of Life”, London: McGraw Hill Book Company, 1976.
Sharma Ritu, “Coming Up Mental Toughness Test for Aspiring Soldiers”, Salute to The Indian Soldier, Apr. 2010, Vol.2, No.10.
Stephen P Robbins, “Organizational Behaviour”, New Delhi, PHI, 1996.
News Papers and Websites “Army Chief Ka Letter Bomb”, Report in The Hindi, Daily
Newspaper, “Navbharat Times”, March 29, 2012. Col. (Ret.) Vasudeva P. K., “Rising Suicides in Army Restore
Dignity, Improve Pay”, http://www.sarkaritel.com/news_and_features/infa/august07/03sucide_in_army.htm
Gilani Iftikhar, “84 Percent of Indian Soldiers in Kashmir are Stressed”, English Daily “Daily Times”, April 20, 2006.
http://www.dailytimes.com.pk/default.asp?page=2006\04\20\story_20-4-2006_pg7_42
“Jawan Taunted After Being Scolded Publicly”, Report, English Daily Newspaper, “The Times of India”, April 29, 2011.
Six Jawans killed, One Missing in Siachen Avalanche, Report in the English Daily Newspaper, “The Times of India”, December 17, 2012
About the Author
Dr. Nidhi Arora Kumar, Asst. Professor, SRM University, D1A, F-3, Chander Nagar, Ghaziabad, Tel. 9891777443,

42
-----------------------------------------------------------------------------
Responsibility of Contents of this paper rests upon the authors
and not upon GRIET publications
ISSN: 2348-3989 (Online)
ISSN: 2230-9764 (Print)
Doi: http://dx.doi.org/10.11127/gmt.2014.03.08 pp.42-45 Copyright@GRIET Publications. All rights reserved.
MANAGEMENT TODAY
-for a better tomorrow An International Journal of Management Studies
home page: www.mgmt2day.griet.ac.in Vol.4, No.1, January-March 2014
New Product Strategy of M/S Roll Form Industry Satya Subram, K.
Vice president, 34-93, F-1, KNR Residency, Vivekanada Puram, Sainikpuri, Secundrabad -500094 Ph: 09441041921 E-.Mail: [email protected]
A R T I C L E I N F O Article history: Received 6.1.2014 Accepted 24.3.2014 Keywords:
Case Study
Introduction
Marketing deals with the activities that direct the flow of goods and services from producers to consumers. Identifying and meeting the human and social needs fall under its ambit. The present business situation is characterized by consumer oriented market. Immense competitions, rapid strides in technology and liberalization, privatization and globalization have become the major points in competitive edge in the market. In these circumstances the survival and growth of a business firm essentially depends on a marketing strategy which results in broadening the customer bases as much as possible by not only creating new customer bases but also retaining existing customers.
Product is regarded as only one of the four P’s or elements which go to make up the marketing mix, and frequently the space given to it is less than that given to selling and promotion. Product strategy lies at the very heart of the firm’s overall strategy and must occupy a dominant position in the firm’s thoughts and actions. All the products pass through a series of stages starting with gestation and culminating in elimination.
This case of M/S Roll Form industry (real name has been changed) describes real life situation faced, a decision or actions taken by an individual manager or by organization at the strategic, functional, operational levels.
In a meeting held on 10th April 2012, Mr. Ram, Vice President and Mr. K. K. Paul, General Manager, Marketing, of Roll Form industries were discussing the opportunities to increase the sales and market share of the company. This had become imperative in view of the near stagnant sales and increased competition in the doors and windows market. They were quite sure that the company’s strength and standing could be enhanced through new product introductions. For this purpose, they reviewed the company’s performance, developments in domestic window market, competition and competitiveness in domestic markets, and the company’s role in entering into UPVC window market. Case Body
Ram, 40, was a postgraduate in management from the Indian Institute of Management, Ahmadabad. He had taken over as Vice President of M/s Roll form industries in 2005. Earlier, he was General Manager, marketing, of PCL Group (name changed), the parent holding company of building materials. He had worked for 12 years in all with the Group. He had also worked as the head of marketing of M/s Roll form industries itself. Paul had been at Roll form industries in the marketing function in different capacities and managing the southern region immediately before taking over as the General Manager. The turnover of southern region is almost 85% of the total division’s turnover and is more than 50% in Andhra Pradesh.
Roll form industries was promoted by family owned PCL

Management Today Vol.4, No.1 January-March 2014
43
group, in 1980 in collaboration with M/s Industry secco spa of Italy. They are into building materials industry and launched various colour coated steel doors and windows products in India PCL group lunched innovative building material products with technical collaboration from world renewed industries. All the products are innovative products and new to India. The factory at Hyderabad was commissioned in 1981. It was a significant technical and managerial challenge to put up such a unit in an industrially less developed region. The family had also promoted other products like particle boards and putties and paints in technical collaboration with Swedish company. These industries are first generation industries and the firm has to depend on funding from banks Apart from the initial investment from the promoters. PCL group is not in a position to allocate enough of money for the advertisements to promote all the innovative products.
The PCL family had shown keen interest in its growth. It was a training ground for inducting younger members of the family into business. In 2008-09, Mr. Madav, a member of the family, took over as the director of Roll form industries. Mr. Subhash, another member of the family, was the Chairman. The Family believed in the values of fairness, truth, honesty, and human considerations in treating people in managing its businesses. The family advocated strict adherence to the laws, regulations, and rules of the land. It was also keen on making a distinct contribution to the well-being of the society.
Roll form industries was organized functionally. The unit head, called the Vice President, was responsible for the overall functioning of the unit and reported to the Executive director. The head of production was responsible for purchase, maintenance, quality control, and stores of all varieties of doors and windows. Similarly, the head of marketing was responsible for pricing, promotion, distribution, and product management of all varieties of doors and windows. He was assisted by regional managers in South, North, West, and East. The head of personnel looked after recruitment and training of employees up to the managerial level. The Manager, Finance, was in charge of day-to-day accounting and working capital management. The head of Research and Development was in charge of product up gradation and new product development. The Research and Development division was equipped to develop product and introducing new technologies from abroad specially in building materials industry. For quality testing and painting, it relied on the facilities of the production department. The functional heads reported to the Vice President of the unit. The Vice President together with the functional heads constituted the top management committee of Roll form industries. They met once a month and when needed to plan and review the performance of the unit.
The employee turnover especially in marketing division of north area and east area is very high when compared to south and west. The support of service team in south India is good to the marketing team and the efficiencies and returns from south team is far ahead of north and east team.
Roll form industries after bringing technology from Italy in way back 90’s had to face lot of problems in marketing the windows as the product/ concept of GI windows are not accepted by Indian market at that point of time where the market is predominately dominated by the close substitute wooden windows. The Italian model of windows is not having option of safety grills and fly mesh provisions as they are not required in European markets. But in India window has to provide with grill
and mesh. The other problem is the raw material (colour coated steel of
0.8mm thick) is not available in India during 1990’s and has import from Italy. And keeping stock of huge quantity in different colours has led to working capital blockage and affected the financials of the firm resulted in poor delivery schedules and complaints from customers. Due to financial constraints the firm is not in a position to spend on advertisement to market the new concept of GI windows resulting poor order flow
It took almost 8 to 10 years for the company to come out of the problems and the brand image of the firm improved considerably in south India. During these 10 years, company positioned themselves as service providers and due to the govt policies on ban on wood in government segment and problems in availability of carpenters, customers are looking for complete system providers (from designing, supplying and installation and after sales service).
Roll form industries developed a window with brand name eco windows, which is ideally suited for Indian market to satisfy the needs of providing safety grills and fly mesh provision. This product is well accepted in housing sector and the imported model (brand name ajantha model) is fast moving in industrial sector. Eco windows are more accepted in government housing sector then private housing sector. Builders sector that are predominant in Private housing sector are reluctant to use this model keeping in view of price. The builders are not willing to take risk of putting new product in the building. Some builders who faced lot of problems with wood shifted to Roll form industries and happy with the services.
Mr. K. K. Paul after promoting as general manager analyzed the market and found that the delivery schedules and logistical problems are the bottle neck for growth in the north and eastern religion and convinced Mr. Ram to set up the new fabrication facilities in Bhubaneswar and Delhi to improve the service. During last year the growth in north was recorded and the Mr. Paul is putting constant efforts to set the eastern team, but till now could not able to succeed. He wanted to transfer the Hyderabad area in charge Mr. Vijay, to Bhubaneswar; Mr. Vijay clearly told him that if they transfer, he will resign hence no option left to Mr. Paul other than to look for new candidate to take care of Bhubaneswar operations. As the products are innovative the new team is taking considerable time to give the returns and resulting high employee turnover , the team who are working with Roll form industry for more than 2 years are giving returns to the company and the employee turnover in this case is very low.
As the service to going to be the problem Mr Paul wanted to appoint more dealers in these areas to take care of installation. Unless and until, he creates the brand image in that market attracting the new dealers is going to be tough task. As we increase more dealers the end price of the product is creating problem for increasing the market share.
After taking over as Vice President in 2005, Ram spent considerable time in understanding the people, the decision-making processes, and work culture through interactions with senior executives and workers and visits to the shop-floor. He shared the performance of the company with executives and introduced a system of sharing, questioning, and provision of answers through team efforts. He also introduced the concept of ‘Saturday meetings’ where various issues facing the company were openly brainstormed by a cross-functional team of senior executives. This process helped the work culture to change to a

New Product Strategy of M/S Roll Form Industry
44
significant extent. A senior executive commented: “The Saturday reviews were a real help. They opened our eyes to the deteriorating competitiveness and financial performance of the company. We were shocked to know that the company’s performance is not good from last two years. Earlier, we were working in our own silos and thought that the situation was ‘hunkey dorey.’ It also brought in a change in our mind set. Earlier, we did not involve ourselves in resolving the issues faced by the other functions. For example, competition and dealer complaints were to be addressed by the marketing executives. Similarly, IR issues were to be tackled by the HR department. For that matter, quality was the concern of production people only.”
From 2006 onwards there is a growth of around 35% year on year in turnover till 2010. From last two years the growth in turnover is nominal and less than 5% which is worrying the management. The company believes that their marketing team is their strength apart from the technical competencies in roll forming of sections and established a name and reputation for quality. To retain the team roll forms industry is forced to increase the employee’s salaries more than its turnover growth which is putting pressure on the bottom line, The Company was considering ways of cutting costs by outsourcing, but the extent of cost reduction needed to make a significant increase in its contributions.
There is lot of untapped market in north and eastern India. In southern, western India major segment of builders and residential segment M/s Roll form industries is having low market share. Roll form industries is strong in A category cities (Metros) only and all the major district headquarters is having lot of potential for colour coated steel windows. With the same service teams and marketing teams roll form industries can enter into UPVC windows which is having lot of potential. M/s Roll form industries have two roll form line with a capacity of 800 tons production capacity. At present roll form industry utilizing around 55% of their installed capacity and it can enter into roofing sheets or roll formed sections used for automobile industry, solar panels, industrial steel sections etc.
The doors and windows industry faced competition from the new entrants UPVC windows (unplasticised poly viniy clorode) . DCM Sreeram group went into backward integration and used one of their By-product and introduced UPVC windows in Indian market. They started manufacturing UPVC sections with German collaboration and spent extensively to promote UPVC sections and started 4 fabrication units across India and focusing on builder segment and slowly eating the market share of aluminum windows and became threat to Roll form industries (colour coated steel windows).
Due to good hardware and sealing systems, majority of the customers are satisfied with UPVC windows. For the last two years lot of new fabricators started fabrication units in India by importing UPVC sections from China. More number of fabricators are from south India and the price is major deciding factor and became threat to Roll form industries.
The USP of Roll form industries was “only service provider” in doors and windows market now no longer a USP after the entrance of UPVC windows As more number of players started UPVC windows, there is lot of pressure in the price and builders are taking advantage of the situation.
Ram and Paul had to think through the nature and size of opportunities available to Roll form industries. They were aware of the lack of technical competencies in the company to improve the hardware which matches the UPVC windows quality. Growth
opportunities existed in penetrating the different regions, in extending the coverage to smaller towns, and in expanding the product ranges. They are aware of the fact that retaining the service team for installation works is going to be tough task after the entrance of lot of UPVC window fabricators especially in south India. The key issue of concern for them was: “Having turned around the unit from a loss making one to a profit-making one in, how do we chart out a path for sustained and profitable growth, to take Roll form industries to number one position”.
Paul is having deference of opinion with Ram and wanted Ram to go ahead with other Roll formed sections and Roofing sheets and diversify from window market to Roll form industry ( to become section manufacture).
Ram strongly believes that we need to strengthen in USP and with good will in the market we should enter into UPVC windows along with colour coated steel windows. Paul is worrying that marketing team will be confused and will become competitor for themselves (colour coated steel window vs. UPVC window) .the other worry for Paul is that unhealthy competition in UPVC windows will kill the price and there will be growth in top line but not in bottom line. Ram also worried about the bottom line as roll form industry cannot import UPVC sections from china due to poor quality and it has to import the sections from Germany which are costlier then china sections or to start section manufacturing in India which means investment of another 10 cores. Questions
1. Describe the strengths and weakness of the roll form industries
2. Do you suggest the Roll form industry to start UPVC windows?
3. If yes, what do you suggest roll form industries: start section manufacturing in India or imports from Germany or imports from china. Do you suggest two different marketing teams to market colour coated steel windows and UPVC windows separately?
4. Do the roll form industry shift from window industry to roll form sections for automobile industry or roofing sheets?
Teaching Notes Over View
This case of M/S roll form industry Describes real life situation faced, a decision or actions to be taken by an individual manager or by organization at the strategic, functional, operational levels. Product strategy lies at the very heart of the firm’s overall strategy and must occupy a dominant position in the firm’s thoughts and actions. All the products pass through a series of stages starting with gestation and culminating in elimination. Application
This case is ideally suited for a post graduate management student , who is having knowledge on product strategy and management, product life cycle. This case will allow the student to conceptualize the SWOT analysis and it’s practical relevance for taking the important decisions like new product introduction. It also allows student to conceptualize the challenges faced by HR in retaining and motivating the team. This case is classical example of illustration of Michel porters generic business strategies of cost leadership, differentiation and focus strategies. Objectives of the Case
This case is a Decision case. Student can infer different

Management Today Vol.4, No.1 January-March 2014
45
decision or actions by organization at the strategic, functional, operational levels. Some of the objectives of this case are:
To conceptualize the internal analysis (strengths and weakness) and identifying the competitive advantage
To understand the dynamics of competition and safeguarding the firm from the threats from external environment
To formulate business strategy To formulate product strategy, which is heart of the
firm’s overall strategy and to decide the firm’s thoughts and actions
Teaching Suggestions We need to explain first the concept of strategic intent
concept and the important of business strategy formulation with porters generic strategies (cost leadership, differentiation, focus).
Then explain the concept of development of a firm’s competitive advantage and analyzing the strengths and weakness of the firm and using the strengths to utilize the opportunities in the market and attacking the weakness and safe grading the firm from the external threats through right business strategy. We can also explain the product life cycle concepts and the steps need to be taken when the product is in decline stage. By using role play supported by the felicitator we can explain the concepts.
References Azhar kazmi, Business policy and strategic management concepts
and applications Baker & hart, Product strategy and management, second addition,
Pearson. Harsh V. Verma,Service Marketing, Second Edition Philip Kotler, Marketing Management, Pearson. Vipin Gupta, Kamal Gollakota, R. Srinivasan, Business Policy and
Strategic Management Concepts and Applications
About the Author
K. Satya Subram, Vice president, 34-93, F-1, KNR Residency, Vivekanada Puram, Sainikpuri, Secundrabad -500094, PH: 09441041921 E-Mail: [email protected]
Declaration I certify that the case study does not incorporate any material previously submitted for a degree in any university and that to the best
of my knowledge and belief it does not contain any material previously published or written by another person where due reference is not made in the text.
I also certify that the case study has been composed by myself and that all the work is my own (Sd.) K. Satya Subram

SUBSCRIPTION FORM
Name:
Mailing Address:
Tel. No. Fax (if any):
E-mail:
Payment Particulars: (DD/ NEFT Details):
(Subscription can be paid as per the rates given hereunder either through a DD taken on a bank
located in Hyderabad, Andhra Pradesh, India or through the direct deposit in or transfer to the
account given hereunder in the core banking system.)
Subscription Rates
Period Indian Foreign
One Year Rs: 1500 $100
Two Years Rs. 2400 $160
Three Years Rs. 3600 $240
Details of the Bank Account for direct deposit or transfer of the Subscription Amount
Account Holder Name of the Bank and Address Account Details
Managing Editor,
Management Today,
GokarajuRangaraju Institute of
Engineering and Technology,
Bachupally, Kukatpally,, Hyderabad-500090
Andhra Bank,
Nizampet Road
2-32 Sanghamitra School,
Nizampet Road,
Hyder Nagar, Kukatpally, Hyderabad
Account No: 151210100045930
CUST.ID: 36139839
Swift Code: ANDBINBB003
IFSC Code: ANDB0001512
Mailing Address: Prof. K.V.S.Raju, Managing Editor, Management Today, Department of Management Studies, GokarajuRangaraju Institute of Engineering and Technology,
Bachupally, Kukatpally, Hyderabad, Andhra Pradesh, India, PIN – 500090 Tel: +91-40-65864440, 65864441, Fax: +91-40-230408060, Mobile No: +91-9949655559,
Website: http://www.griet.ac.in, E-mail: [email protected]
Place: Date: (Signature of Subscriber)

Under the aegis of Gokaraju Rangaraju Institute of Engineering & Technology, Hyderabad
COPYRIGHT TRANSFER FORM
(Duly filled in and signed copyrights transfer form should accompany the paper submitted for publication in Management Today)
Title of the Paper:
Author(S):
Address (es):
All the author(s) hereby agree for the following:
1. I/we hereby declare that this paper is a product of original research work carried on by
me/us. 2. I/we am/are responsible for plagiarism or copyright violation if any.
3. Copyright rights of this work/paper are hereby transferred to Management Today. The
transferred rights include information rights to electronic media, translation rights,
adaptation rights and utilization rights of the above mentioned paper.
4. This work or a substantial part of this has not been published elsewhere and is not
currently under consideration for publication anywhere and in any language.
5. This work shall not contravene upon the rights of any third party.
Name of Author(s) : Signature(s)
Date: