Embed Size (px)
Citation preview

1
APPENDIX3:SOUTHERN KZNAND
EASTERNCAPEANNUALPROGRESSREPORT
CA Farmer Innovation Programme for smallholders.
Period: March -September 2019
FarmerCentredInnovationinConservationAgricultureinthe
EasternCapeandSouthernKZNregionsofKwaZulu-Natal
Compiled by:
Erna Kruger, Mazwi Dlamini and Temakholo
Mathebula
September 2019

2
Project implemented by:
Mahlathini Development Foundation
Promoting collaborative, pro-poor agricultural innovation.
Contact: Erna Kruger (Founder and Director)
Address: 2 Forresters Lane, Pietermaritzburg, 3201, KZN
Email: [email protected]
Cell: 0828732289
Time of operation: 2003-2019
Legal status: NPC
BEE status: 4. – Certificate available.
Funded by:

3
Contents
Contents ............................................................................................................................... 3
Executive Summary .............................................................................................................. 4
Background and Organisational Information ......................................................................... 4
Key activities: March-September 2019 .................................................................................. 7
Financial summary ............................................................................................................ 7
Progress ............................................................................................................................ 8
Overall trial design process ................................................................................................. 11
Year 1: ......................................................................................................................... 11
Year 2: ......................................................................................................................... 12
Year 3: ......................................................................................................................... 13
Possible agrochemical spraying regime options ........................................................... 13
Soil health ........................................................................................................................... 13
SKZN Soil health results .................................................................................................. 15
Soil health scores for Matatiele ........................................................................................ 18
PLFA results for SZN and EC ...................................................................................... 20
Progress per area of implementation .................................................................................. 22
Introduction ..................................................................................................................... 22
SKZN and EC late season monitoring and yields. ........................................................... 22
Ofafa ............................................................................................................................ 25
Ofafa Annaul group review; 13 August 2019 ............................................................... 27
Introduction ..................................................................................................................... 27
Madzikane ................................................................................................................... 28
Ngongonini ................................................................................................................... 30
Plainhill ............................................................................................................................ 32
Matatiele ...................................................................................................................... 34
Cover crops ........................................................................................................................ 37
VSLAs (Village Savings and Loan Associations) ................................................................. 41
Senzokuhle share out meeting (Madzikane); 20 June 2019 ......................................... 42
Stakeholder interaction- Innovation platforms ..................................................................... 43
Issues, successes and recommendations ........................................................................... 44
Budget summary by August 2019 ...................................................................................... 45

4
Executive Summary Seventy-nine (75) of 110 participants have planted their farmer level trials across 11 villages,
with limited support for inputs from the KZN LandCare unit. Summer cover crop and livestock
fodder farmer level experimentation have been included for a selection of the villages. Staff and
Local Facilitators (8), have received training and mentoring in the new and updated monitoring
processes. Local facilitators are taking on much more responsibility and this bodes well for
sustainability of this process.
Three awareness days have been run in SKZN; one in Nokweja, in November 2018 with 66
participants, one in Umzumbe (68 participants) and one in Harding (82 participants) in
conjunction with LandCare and KZNDARD. In addition, MDF attended stakeholder forum
meetings for the Harry Gwala District Extension forum and the Ubuhlebezwe LED forum and
ran one introductory workshop for a new group in Springvalley.
Rain-gauges and run-off plots have been installed for a selection of participants in Madzikane
and Spring Valley and soil fertility (15 repeat samples and 9 new samples) and soil health (7
participants) samples have been taken and analysed.
The use of the e-survey (Pendragon) for crop growth monitoring has made a huge difference in
terms of easier access to monitoring information and along with a good schedule of monitoring,
around 22 farmers across 6 of the 13 villages have been included in the monitoring process.
The relationships with KZNDARD and LandCare have been strengthened considerably, to a
point where collaborative action is now possible. Donation of a 4 row planter and boom sprayer
has recently been made to Madzikane. In addition to the annual LandCare support to this
programme, which includes planters and inputs.
Production this season has however been the worst since this site’s inception, due to extreme
weather variability in this region, with only an average of 39% of participants managing to
harvest.
Background and Organisational Information Mahlathini Development Foundation (2003-2019) is one of the only NGOs in South Africa
focussing on promoting collaborative pro-poor agricultural innovation. As such, MDF is a
specialist NGO working in the fields of participatory research, training and implementation,
focussing on agroecological approaches.
Introduction of CA into any farming system requires the creation of a process and environment
of continuous innovation, learning and change in a number of different areas, including social,
economic, environmental and agronomic considerations. In the smallholder context it requires
the design, introduction and facilitation of a reasonably complex IS (innovation system)
approach by the implementers, and of practice, labour and resources (including natural and
financial resources) by the farmer that has system wide implications. There is an interplay of a
number of different factors, all of which need to be integrated, thus requiring a well-designed
and facilitated IS approach.
The IS model applies a family of approaches and methodologies, such as the Farmer Field School
(FFS) approach and participatory monitoring & evaluation (PM&E), to facilitate awareness,

5
learning, implementation and research all together. The key voluntary participants of this
process are farmers from a locality or village who should be organised into learning groups
(farmers generally are already organised into structures such as savings and credit groups,
associations or cooperatives). A number of farmers in that group volunteer to undertake on-
farm experimentation, which creates an environment where the whole group learns throughout
the season by observations and reflections of the trials’ implementation and results. They
compare various CA treatments with their standard practices, which are planted as control
plots. This provides an opportunity to explore all aspects of the cropping system, its socio-
economic context and feasibility, as well as the grain and legume value chain in the area. The
whole value chain is considered: input supply, production aspects, harvesting and storage,
processing and marketing
Horizontal expansion (scaling out) from village nodes to surrounding farmers and villages in the
area, working with organised farmer groups (or IPs) in collaboration with stakeholders in the
region has shown great promise for expansion of interest in and longer term sustainability of
the implementation of CA practices among smallholders. It means that a number of villages in
close proximity become involved and this provides an opportunity for organising farmers
around issues in the value chain such as bulk buying, transport, storage and marketing. It
creates an option to set up farmer service centres at central nodes that can provide easy access
to inputs and services. The model also provides for learning over a period of time, which has
proven essential to allow each participant farmer to experiment with and master/adapt the CA
principles for at least 4 years. The more experienced farmers become mentors to the new
entrants and some undertake the role of local facilitation and support to their villages and
groups. It also provides a platform where other farmers and interested parties in the area can
engage and become involved

6
SELECTION AND COMMUNITY LEVEL PROCESS
PRE-CONDITION; Farmers active in maize production with some level of social organisation
1. Entry into community; through word of mouth from community members (individual and group
requests), government officials, other service organisations,
2. Set up introductory meetings at community level, including authorities, to introduce CA and the
process:
- Set up learning or interest group (20-30 people)
- Members of learning group volunteer for farmer led experimentation (usually 9-12
members in the first year), while the rest of the group learns alongside them
- These members agree to do a CA trial alongside their control (normal way of planting)
- Trials are usually 100,400 or 1000m2 (small areas to reduce risk)
- The programme provides inputs for the trial, the inputs for control and all labour are
provided by the farmer (the risk of implementing the new idea initially sits with the
programme not the farmers. From the 2nd year onwards the farmers pay a standard 30%
subsidy towards the costs of inputs for their trials)
- Farmers are trained in the implementation of CA; pre-planting spraying (use of knapsack
sprayers) and field preparation, use of herbicides, layout of plots and planting in basins and
rows using a range of no-till tools (hand planters, animal drawn planters and or two row
tractor-drawn planters). The choice of implements depends on the scale of farming and
farmers’ choice. Aspects such as top dressing, weeding and pest control are covered during
the season as well.
- The first-year trial layout is pre-determined through the programme – to include close
spacing, inter cropping and different varieties of maize (choice of traditional OPV or hybrid
seed- according to farmer preferences) and legumes (sugar beans, cowpeas)
- From the 2nd year onwards farmers start to add their own elements to the experimentation
depending on their learning, questions and preferences. Cover crops (both summer and
winter) and crop rotation options are introduced.
- Researcher managed “trials” are also set up at individual homesteads, to work alongside
the more enthusiastic and committed participants and to explore issues such as soil health,
carbon sequestration soil fertility, water productivity, moisture retention, run-off and specific
aspects of the CA system – such as seeding and seeding rates of cover crops etc.
- As a minimum, 2-4 learning sessions per season in the learning group are held each year,
building in complexity and content. 1 review session for the season and one planning
session to plan experimentation for the upcoming season
- Planters and knapsack sprayers are provided to the learning group to share, manage and
maintain
- Setting up of VLSA’s (village savings and loan associations), farmer centres and joint
harvesting, storage and milling options are promoted
3. Each season farmers days are organised in each area, jointly with the learning groups, CA forums
and innovation platforms are promoted where all stakeholders in a region join these forums to share,
discuss and plan together. This includes role players such as DARD, Social Development, Land
Care, Local and District Municipalities, Agribusiness service providers, NGOs

7
In this season (2018-2019) we have continued to focus on the following elements of the model,
namely:
a) Support farmers who are in their 1st, 2nd and 3rd season,
b) Conscious inclusion of crop rotation to compare with intercropping trials
c) Inclusion of summer cover crops in the crop rotation trials
d) Continuation with experimentation with winter cover crops, but planted in separate
plots rather than in-between maize
e) Mulching as a form of ground cover
f) Initiation of nodes for farmer centres that can offer tools, input packs and advice
g) Village Savings and Loan Associations, small business training and initiation of
marketing cooperatives
Key activities: March-September 2019 Implementation has continued in three areas (Matatiele, Creighton, and Ixopo) in 11 villages.
One new village was brought on board this season. Support for the 3 existing VSLAs has
continued and included small business development training. The stakeholder forum in
Madzikane has been continued and
four farmers days have been held.
In addition, stakeholder forums
have been attended for Harry
Gwala DM and Ubuhlebezwe LM
and annual review and planning
meetings are in progress. One new
group has been brought on board
in Spring Valley.
Figure 1: Delivery of Lime provided by
LandCare (DARD) for the SKZN groups at the
Harry Gwala Development Agency, for
distribution to the villages in September
2019.
Financial summary
Table 1 below outlines the budget for the SKZN&EC project area.
Table 1: Budget outline for the SKZN&EC project area 2018-2019.
KZN Midlands Milestones: Farmer Centred Innovation in CA. October
2018- September 2019
BUDGET
Milestones/
Outputs
Key activities OUTCOMES/ DELIVERABLES
Capital Equipment R37 434,00
Farmer
experimentation
Bergville
Administration and sundries
travel accommodation, admin, publications, monitoring and evaluation
R117 120,00
8
Farmer centred innovation systems
farmer experimentation, researcher managed experimentation, savings groups, farmer centres…
R524 548,00
Innovation platforms Stakeholder meetings, platform building and events
R16 245,00
Sub - TOTAL: Oct 2018-Sept 2019 R695 347,00
For this area, additional financial support was obtained for the KZNDARD LandCare unit. For
SKZN&EC the farmer level subsidies were introduced. A small number of longer-term
participants did pay in their subsidies. These were combined with the Bergville project farmer
subsidies to relieve some of the financial pressure for that site, given the large number of
smallholders involved there.
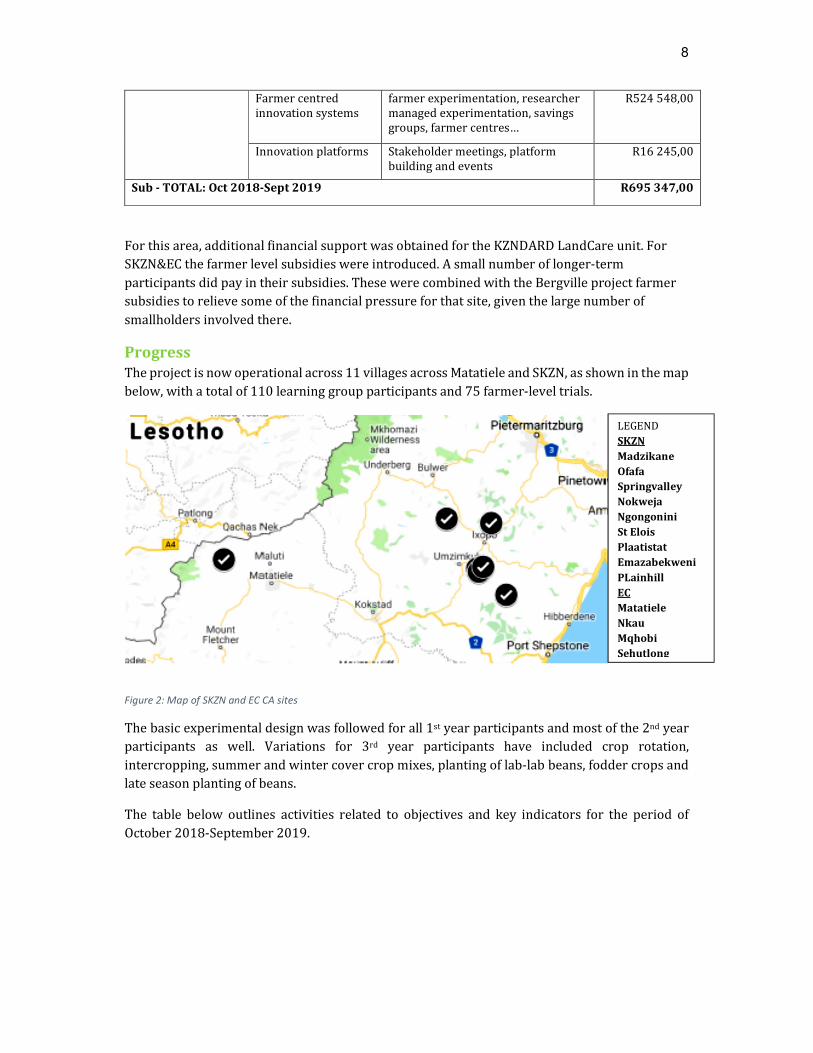
Progress
The project is now operational across 11 villages across Matatiele and SKZN, as shown in the map
below, with a total of 110 learning group participants and 75 farmer-level trials.
Figure 2: Map of SKZN and EC CA sites
The basic experimental design was followed for all 1st year participants and most of the 2nd year
participants as well. Variations for 3rd year participants have included crop rotation,
intercropping, summer and winter cover crop mixes, planting of lab-lab beans, fodder crops and
late season planting of beans.
The table below outlines activities related to objectives and key indicators for the period of
October 2018-September 2019.
LEGEND
SKZN
Madzikane
Ofafa
Springvalley
Nokweja
Ngongonini
St Elois
Plaatistat
Emazabekweni
PLainhill
EC
Matatiele
Nkau
Mqhobi
Sehutlong

9
Table 2: SUMMARY OF PROGRESS (OCTOBER 2018-SEPTEMBER 2019) RELATED TO OBJECTIVES AND KEY ACTIVITIES
Objectives Key activities Summary of progress % completion and comment
1. Document
lessons
learned
Documentation for
learning and
awareness raising:
Farmer Field School
methodology and process
reports
Farmer level learning
materials; manuals – isiZulu,
English (re-print)
Project reports (monthly, 6
monthly and yearly).
Articles and promotional
material to engage
stakeholders in the broader
environment.
Sharing of information through various innovation platforms and processes; including the internet, social and networking platforms and conferences
- To be done at end of season (100% complete) - in use, but, no reprint done - Monthly reports (March-Sept 2019) and annual report (100% complete) - Not done yet (0% complete) -Nokweja, Umzumbe and Harding farmers day ( Oct, Nov 2018 and Jan 2019), MDF Website updated, (100% completion)
Final report - 6 monthly interim reports -. Final report at end of project (100% completion)
2 Increase
focus and
efficiency of
CA systems,
scale out
sustainable
farming
systems
scenarios and
build social
platforms
Farmer centred
innovations
systems research
Scale out using
information
systems approach.
1st , 2nd , 3rd level
experimentation
Develop and manage PM&E
framework; – weekly and
monthly M&E visits
Innovation platform events-
cross visits, conferences,
workshops, meetings,
farmers’ days
Action planning with
innovation platform events;
Major planning event for
experiments
Bi-annual steering committee
meetings
- Undertaken for 13 villages (100% completion) -New VSA methodology, staff training in Quantitative measurements, pendragon e-survey for crop monitoring, annual reviews (100% completion) - Participation in KZN CA Forum (Aug 2019), KZNDEA CC summit (Aug 2019), Harry Gwala District extension forum (June 2019) and Ubuhlebezwe LED forum (May, July 2019), (100% completion) -Yearly reviews and planning (focus groups and individual interviews for all learning groups and Springvalley introductory w/s for new participants (100% completion) -September 2019 (50% completion)

10
A performance dashboard is indicated below. This provides a snapshot of performance according
to suggested numbers and outputs in the proposal.
Table 3: PERFORMANCE DASHBOARD; SEPTEMBER 2019
Outputs Proposed (March 2018) Actual (Sept 2019)
Number of areas of operation 4 4 Number of villages active 13 11 No of 1st level farmer experiments 45 6 No of 2nd level farmer experiments 70 51 No of 3rd level experiments 10 18 No of local facilitators 5 5 No of direct beneficiaries 125 110 (75) Participatory M&E process Yes Yes Soil samples 43 25
The table below summarises the planned and actual farmer trial implementation for the 2018-
2019 planting season. Seventy-five (75) of these farmers, across 11 villages, planted trials
(around 75% of participants). The season was quite dry to start with and a number of
participants had patchy germination as a result. Of those who planted only 36 managed to
harvest maize (48%) and only 25 participants managed to harvest beans (33%). This has been
the worst year in terms of production for the SKZN site, since its inception.
Table 4: SUMMARY OF FARMER INNOVATION NUMBER AND AREAS PLANTED PER VILLAGE IN THIS CA PROCESS; EASTERN CAPE, 2018-
2019
Area Village 2018
total
2018
1st
level
2017
2nd
level
2016
3rd
level
2015
4th
level
Experimentation Comments; incl
planters used.
Matatiele Sehutlong 4 (3) 1 2 Summer cover crops, crop rotation, OPVs, winter cover crops, intercropping
Bulelwa Dzingwa – local facilitator for Nkau and Sehutlong. She has continued to manage the CA experimentation in Matatiele- continuing with a smaller group of participants
Nkau 7 (4) 4 2 1 Summer cover crops, crop rotation, OPVs, winter cover crops, intercropping
Mqhobi 3 (2) 1 2 Intercropping – new village and group
Khutsong 1 (1) 1 Summer cover crops, crop rotation, OPVs, winter cover crops, intercropping
Tsoloane Mapheele Animal drawn planters used here in larger areas
Creighton Madzikane Farmers Assocation
10 (6)
2 8 Intercropping (beans and cowpeas), late season beans and cover crops
Partnership KwaNalu. Local facilitator: Mr CD Xaba

11
Ixopo Ofafa 8 (5) 8 Intercropping, summer and winter cover crops,
Local facilitator; Mr Ndlovu. Area is hilly and steep with variable to bad soils
Emazabekweni 5 (4) 5 Local Facilitator; Mr B Dlamini. Local homestead based fields.
Springvalley 6 (5) 6 Intercropping, summer and winter cover crops,
Local Facilitator; Mr B Dlamini. Local homestead based fields. Area is hilly and steep with variable soils
Plaatistat 15 (6)
3 12 Intercropping, summer and winter cover crops,
Here there are larger fields- need for a tractor drawn planter.
Nokweja 5(2) 6 4 Intercropping, summer and winter cover crops,
Local facilitator, Mr Mkhize. They are also working in larger fields with DARD and grains FDP
Nokweja (top) 8 (8) 8 Intercropping, summer and winter cover crops,
Local facilitator, Mr Mkhize. They are also working in larger fields with DARD and grains FDP
St Elois 15 (4)
12 Intercropping, summer and winter cover crops,
Expansion area from Nokweja supported by Mr Mkhize the LF
PlainHill 11 (9)
13 Intercropping, summer and winter cover crops,
Expansion area from Nokweja supported by Mr Mkhize the LF
Ngongonini 16 (16)
3 13 Intercropping, summer and winter cover crops,
Expansion area from Nokweja supported by Mr Mkhize the LF
TOTAL 13 110 (75)
20 62 31 4 Total area
planted to
trials~ 4 ha
Overall trial design process As this is an existing ‘technology’ the farmer level experimentation is in essence an adaptation
trial process.
Year 1: Experimental design is pre-defined by the research team (based on previous implementation in
the area in an action research process with smallholders). It includes a number of different
aspects:

12
• Intercropping of maize, beans and cowpeas • Introduction of OPV and hybrid varieties for comparison (1 variety of maize and beans
respectively) • Close spacing (based on Argentinean model) • Mixture of basin and row planting models • Use of no-till planters (hand held and animal drawn) • Use of micro-dosing of fertilizers based on a generic recommendation from local soil
samples • Herbicides sprayed before or at planting • Decis Forte used at planting and top dressing stage for cutworm and stalk borer • Planting of cover crops; winter mix in Autumn
Experimental design includes 2 treatments; planter type (2) and intercrop (2). See the diagram
below.
Figure 3:Expample of plot layout for the 1st level farmer trials
The basic process for planting thus includes: Close spacing of tramlines (2 rows) of maize
(50cmx50cm) and legumes (20cmx10cm) intercropped, use of a variety of OPV and hybrid seed,
weed control through a combination of pre planting spraying with herbicide and manual
weeding during the planting season and pest control using Decis Forte, sprayed once at planting
and once at top dressing stage.
Year 2: Based on evaluation of experiment progress for year 1, includes the addition of options that
farmers choose from. Farmers also take on spraying and plot layout themselves:
• A number of different OPV and hybrid varieties for maize • A number of different options for legumes (including summer cover crops) • Planting method of choice • Comparison of single crop and inter cropping planting methods • Use of specific soil sample results for fertilizer recommendations • Early planting • Own choices
P L O T 1 : H a n d H o e P L O T 2 : P l a n t e r
M a i z e 1 , b e a n 1 M a i z e 2 , B e a n 1 M a i z e 1 , b e a n 1 M a i z e 2 , B e a n 1
M a i z e 1 , B e a n 2 M a i z e 2 , B e a n 2 M a i z e 1 , B e a n 2 M a i z e 2 , B e a n 2
P L O T 3 : O R r e p e a t p l o t 1 a n d 2 P L O T 4 :
H a n d h o e P l a n t e r H a n d h o e P l a n t e r
M a i z e 1 , c o w p e a M a i z e 1 , c o w p e a M a i z e 1 , D o l i c h o sM a i z e 1 , d o l i c h o s
M a i z e 2 , C o w p e a M a i z e 2 , C o w p e a M a i z e 2 , D o l i c h o sM a i z e 2 , D o l i c h o s
10
m o
r 5
m
1 0 m o r 5 m

13
Year 3: Trials are based on evaluation of experimentation process to date; to include issues of cost
benefit analysis, bulk buying for input supply, joint actions around storage, processing and
marketing. Farmers design their experiments for themselves to include some of the following
potential focus areas:
• Early planting; with options to deal with more weeds and increased stalk borer pressure.
• Herbicide mix to be used pre and at planting (Round up, Dual Gold, Gramoxone) • A pest control programme to include dealing with CMR beetles • Intercropping vs crop rotation options • Spacing in single block plantings • Use of composted manure for mulching and soil improvement in combination with
fertilizer,. • Soil sample results and specific fertilizer recommendations • Planting of dolichos and other climbing beans • Summer and winter cover crops; crop mixes, planting dates, management systems,
planting methods (furrows vs scatter) • Seed varieties; conscious decisions around POVs, hybrids and GM seeds • Cost benefit analysis of chosen options
Possible agrochemical spraying regime options 1. Roundup 2 weeks before planting- if there has been some rain and weeds. Dual Gold at
planting (or just after planting with Decis Forte/Kemprin).
2. Gramoxone at planting (just before or after planting) with or without Dual Gold and Decis
Forte/Kemprin– Dual Gold does not work on dry soil (Followed by heavy rain)
Soil health This season’s soil health samples were taken for 5 participants, across four villages (Madzikane,
Ofafa, Spring Valley and Ngongonini). For the 2 participants for whom SH samples were
collected last year as well, care was taken to ensure that samples were taken in the same plots
as before.
The intention is to compare the soil health characteristics for a number of cropping options
within the CA trials, with conventionally tilled mono-cropped control plots, over time.
The Haney soil health tests (as analysed by Soil Health Solutions in the Western Cape and Ward
Laboratories in the USA) provides insight into microbial respiration and populations in the soil,
organic and inorganic fractions of the main nutrients N, P and K, and assessment of organic
carbon percentage organic matter (%OM). An overall soil health score (SH) is also provided for
each sample.
Haney Haney Haney Haney Soil health tests parametersSoil health tests parametersSoil health tests parametersSoil health tests parameters1111
These analyses are benchmarked against natural veld for each participant, due to high local
variation in soil health properties, measured at different times. The veld scores provide for high
benchmarks to compare the cropping practices against.
1 Haney/Soil Health Test Information Rev. 1.0 (2019). Lance Gunderson, Ward Laboratories Inc.

14
Soil Respiration 1-day CO2-C: This result is one of the most important numbers in this soil test
procedure. This number in ppm is the amount of CO2-C released in 24 hours from soil microbes
after soil has been dried and rewetted (as occurs naturally in the field). This is a measure of the
microbial biomass in the soil and is related to soil fertility and the potential for microbial
activity. In most cases, the higher the number, the more fertile the soil.
Microbes exist in soil in great abundance. They are highly adaptable to their environment and
their composition, adaptability and structure are a result of the environment they inhabit. They
have adapted to the temperature, moisture levels, soil structure, crop and management inputs,
as well as soil nutrient content. Since soil microbes are highly adaptive and are driven by their
need to reproduce and by their need for acquiring C, N, and P in a ratio of 100: 10: 1 (C:N:P), it is
safe to assume that soil microbial activity is a dependable indicator of soil health. Carbon is the
driver of the soil nutrient-microbial recycling system.
Water extractable organic C (WEOC): It essentially measures the release of sugars (liquid
carbon) from root exudates, plus organic matter degradation. This number (in ppm) is the
amount of organic C extracted from the soil with water. This C pool is roughly 80 times smaller
than the total soil organic C pool (% Organic Matter) and reflects the energy source feeding soil
microbes. A soil with 3% soil organic matter when measured with the same method
(combustion) at a 0-3 inch sampling depth produces a 20,000 ppm C concentration. When the
water extract from the same soil is analysed, the number typically ranges from 100-300 ppm C.
The water extractable organic C reflects the quality of the C in the soil and is highly related to
the microbial activity. On the other hand, % SOM is about the quantity of organic C. In other
words, soil organic matter is the house that microbes live in, but what is being measured is the
food they eat (WEOC and WEON).
If this value is low, it will reflect in the C02 evolution, which will also be low. So less organic
carbon means less respiration from microorganisms, but again this relationship is unlikely to be
linear. The Microbially Active Carbon (MAC = WEOC / ppm CO2) content is an expression of this
relationship. If the percentage MAC is low, it means that nutrient cycling will also be low. One
needs a %MAC of at least 20% for efficient nutrient cycling.
Water extractable organic N (WEON): Consists of Atmospheric N2 sequestration from free
living N fixers, plus organic matter degradation. This number is the amount of the total water
extractable N minus the inorganic N (NH4-N + NO3-N). This N pool is highly related to the water
extractable organic C pool and will be easily broken down by soil microbes and released to the
soil in inorganic N forms that are readily plant available.
Organic C:N ratio: This number is the ratio of organic C from the water extract to the amount of
organic N in the water extract. This C:N ratio is a critical component of the nutrient cycle. Soil
organic C and soil organic N are highly related to each other as well as the water extractable
organic C and organic N pools. Therefore, we use the organic C:N ratio of the water extract since
this is the ratio the soil microbes have readily available to them and is a more sensitive indicator
than the soil C:N ratio. A soil C:N ratio above 20:1 generally indicates that no net N and P
mineralization will occur. As the ratio decreases, more N and P are released to the soil solution
which can be taken up by growing plants. This same mechanism is applied to the water extract.
The lower this ratio is, the more organisms are active and the more available the food is to the

15
plants. Good C:N ratios for plant growth are <15:1. The most ideal values for this ratio are
between 8:1 and 15:1.
Soil Health Calculation: This number is calculated as 1-day CO2-C/10 plus WEOC/50 plus
WEON/10 to include a weighted contribution of water extractable organic C and organic N. It
represents the overall health of the soil system. It combines 5 independent measurements of the
soil’s biological properties. The calculation looks at the balance of soil C and N and their
relationship to microbial activity. This soil health calculation number can vary from 0 to more
than 50. This number should be above 7 and increase over time.
Some of the inter relationships between these variables are explored below
SKZN Soil health results
For this area, the soil quality is generally fair to good, with local variations depending on
historical soil management practices and topography, which is hilly with steep slopes in some
instances.
Soils in this area have a comparatively high organic matter content and soil health scores are
good. This season, due to the prevailing hot and dry conditions for the most of the season
microbial activity has been dampened, but soil health scores are still high. Average yields
obtained ranging from around 1,2-3,5t/ha do not compare well to the yield potential for these
areas, which is much higher
The figure below outlines the soil health parameters and scores for the 4 villages tested.
Figure 4: Soil health scores for 4 villages in SKZN; 2018-2019
Note: The Conventional control plot for Madzikane was the homestead field for Mr Xaba, which is not indicative of
the soil conditions in the fields, quite a distance away and will thus not be included in this analysis
From the figure above the following comments can be made:
ContM
M+B VeldCont
MM+B Veld
ContM
M+BM+C
PVeld
ContM
M+BM+C
PVeld
Ngongonini Ofafa Springvalley Madzikane
Average of % OM 9,0 8,9 10,9 3,2 3,5 5,9 6,2 6,2 6,5 6,9 5,6 5,0 5,3 8,2
Average of CO2 - C, ppm C 107,6125,2109,3 48,2 63,3 241,2119,3109,1148,8116,9 89,3 57,8 81,0 260,0
Average of Organic C ppm C 119,0140,0132,0 87,0 173,0270,0141,0132,0161,0175,0254,5157,5183,0280,0
Average of Organic N ppm N 9,1 10,0 7,8 8,9 13,9 15,2 11,4 9,9 13,0 10,5 13,2 12,4 14,1 19,9
Average of C:N ratio 13,1 14,0 16,9 9,8 12,4 17,8 12,4 13,3 12,4 16,7 15,5 12,8 13,0 14,0
Average of Soil health calculation (new) 12,3 14,2 12,5 7,5 11,2 24,1 13,9 12,7 16,9 14,3 14,4 10,2 13,2 26,2
0,0
50,0
100,0
150,0
200,0
250,0
300,0
Soil health scores for SKZN; 2018-2019

16
Soil health scores for the CA maize and bean intercropped plots (M+B) are higher than
the conventional control plots (Cont M)
Soil health scores for the CA maize and cowpea intercropped plots (M+CP) are higher
than the M+B plots.
The higher soil health scores are related to higher organic C, Organic N and microbial
respiration (CO2 -C) in all cases; which indicates a build-up of organic C, N and micro-
organisms in the CA intercropped plots, when compared to conventional tillage.
For the two villages, heading inland from the Umkomaas river, which were generally
drier and hotter than the two villages in the Highflats region (closer to the coast), the
microbial respiration was much lower than the organic C in the soil. Thus, the
percentage microbially active carbon (%MAC) for these two villages (Ofafa and
Madzikane) was between 28-55% as compared to the 82-92% MAC for the Highflats
villages (Ngongonini and Springvalley). This dampening effect of heat and dryness of
soil on microbial activity has been noticed previously in dry seasons. It is also related to
a lower organic matter content in the soil of around 3,5-5% in Ofafa and Madzikane
respectively as compared to 6,5-9% in Ngongonin and Springvalley.
In summary, soil health conditions for soils in SKZN are good, with high organic matter content
and the CA M+CP intercrop has allowed for the greatest increase in organic C and N and
microbial respiration.
If one looks a little more in detail at the availability of N in the soil, it can also be seen that the
CA M+CP provides for the highest levels of immediate release N and potential savings in
application for inorganic N, as shown in the figure below
Figure 5: Availability of organic N and Rand value of inorganic N saved for SKZN; 2018/19
ContM
M+B VeldCont
MM+B Veld
ContM
M+B M+CP VeldCont
MM+B M+CP Veld
Ngongonini Ofafa Springvalley Madzikane
Average of Soil health calculation (new) 12,3 14,2 12,5 7,5 11,2 24,1 13,9 12,7 16,9 14,3 14,4 10,2 13,2 26,2
Average of Soil aggregates 41 41 38 15 15 38 28 33 34 33 42 40 35 39
Average of N Immediate release 20,0 22,0 17,0 20,0 31,0 34,0 26,0 22,0 29,0 24,0 29,5 28,0 31,5 44,5
Average of R value of Org N 228,00 251,00 196,00 223,00 349,00 381,00 286,00 248,00 326,00 263,00 330,00 311,00 353,50 498,00
0,0
100,0
200,0
300,0
400,0
500,0
600,0Availability of Organic N 2018/19; SKZN

17
From the figure above the following comments can be made:
The average Rand value of inorganic N saved for the Cont M plots is R 267/ha (48%
saving), for the M+B plots is R289/ha (52%) and for the M+CP plots is R340/ha (60%).
N recommendations for these sites is 40-60kgN/ha, (~R560/ha). This indicates a 12%
decrease in the need for inorganic N fertilizers for the Ca M+CP intercrops when
compares to conventional mono-cropped maize.
When comparing soil health scores for two of the five participants across two seasons, it is
expected that soil health scores will increase form year to year, on the basic assumption that the
CA cropping system builds up soil organic C and N content. The figure below compares the
results for Mr Xaba from Madzikane and Mr Mkhize from Ngongonini
Figure 6: Comparison of soil health scores in SKZN foe 2017/18 and 2018/19
From this figure it can be seen that the expected increase in organic C and N has indeed been
achieved for Mr Xaba, indicating an incremental build-up of soil health for his CA
implementation. The same is however not the case for Mr Mkhize from Ngongonini, where a
definite decrease in organic C and N was noted. It is assumed that these differences are due to
livestock grazing on residue; which is uncontrolled for Mr Mkhize, but is manged by Mr Xaba to
ensure some residue cover remains post grazing.
CD Xaba CD Xaba Mandla Mkhize Mandla Mkhize
2017 2018 2017 2018
Madzikane Ngongonini
%OM 6 6,1 5,4 8,95
CO2 - C(ppm) 57 121,38 126,9 114,03
Organic C (ppm) 176 202,5 175 130,33
Organic N (ppm) 15,8 13,43 14,2 8,97
C:N ratio 11,1 13,35 12,3 14,67
Soil health calculation 10,8 15 15,5 13
0
50
100
150
200
250
Comparison of SH scores 2017/18 and 2018/19; SKZN

18
Soil health scores for Matatiele
SH parameters for Matatiele were taken for 5 participants across four villages, all of whom have
been involved in the CA experimentation process for a minimum of 3 years.
Figure 7: Soil health scores for Matatiele participants; 2018/19
For Matatiele the soil health scores are generally substantially lower than for SKZN, indicative of
both the sandy infertile soils (low % OM, low microbial respiration) in the area and the high
weather variability.
From the figure above, the following comments can be made:
The soil health scores for the CA maize and bean (M+B) intercropped plots are higher
than the conventionally cropped maize (Cont M), linked to higher microbial respiration
(CO2-C), organic C and organic N content. Despite a high level of variation between the
sites, this trend is now clear throughout the sites where this process is being
implemented (SKZN, Bergville and Midlands)
Comparison of SH scores across seasons for Matatiele is expected to reveal an incremental trend
of increase of soil health scores, or at least a stabilisation of the scores. Soil health scores for 3
participants have been compared across four seasons.
Veld M+B M+B Veld M+B Cont M Veld M+B Cont M M+B Cont M
BulelwaDzingwa
BulelwaDzingwa
Mamolekeng
Lebuoa
MatshepoFufu
MatshepoFufu
MatshepoFufu
ThapeloRamanyal
i
ThapeloRamanyal
i
ThapeloRamanyal
i
TsaloaneMaphelee
TsaloaneMaphelee
% OM 5,1 3,4 3 2,9 2,7 2,4 2,7 2,3 2,2 0,8 0,7
CO2 - C, ppm C 34,4 34,3 39,3 61,2 43,4 34,5 60,5 37 37,7 16,9 14,4
Organic C ppm C 210 155 202 181 154 119 180 143 136 80 87
Organic N ppm N 14,4 10,5 11,8 11,5 12 10,1 12,7 12 11,6 6,1 8,4
C:N ratio 14,6 14,8 17,1 15,7 12,8 11,8 14,2 11,9 11,7 13,1 10,4
Soil health calculation (new) 9,1 7,6 9,2 10,9 8,6 6,9 10,9 7,8 7,7 3,9 4
0
50
100
150
200
250
Soil health scores for Matatiele;2018/19
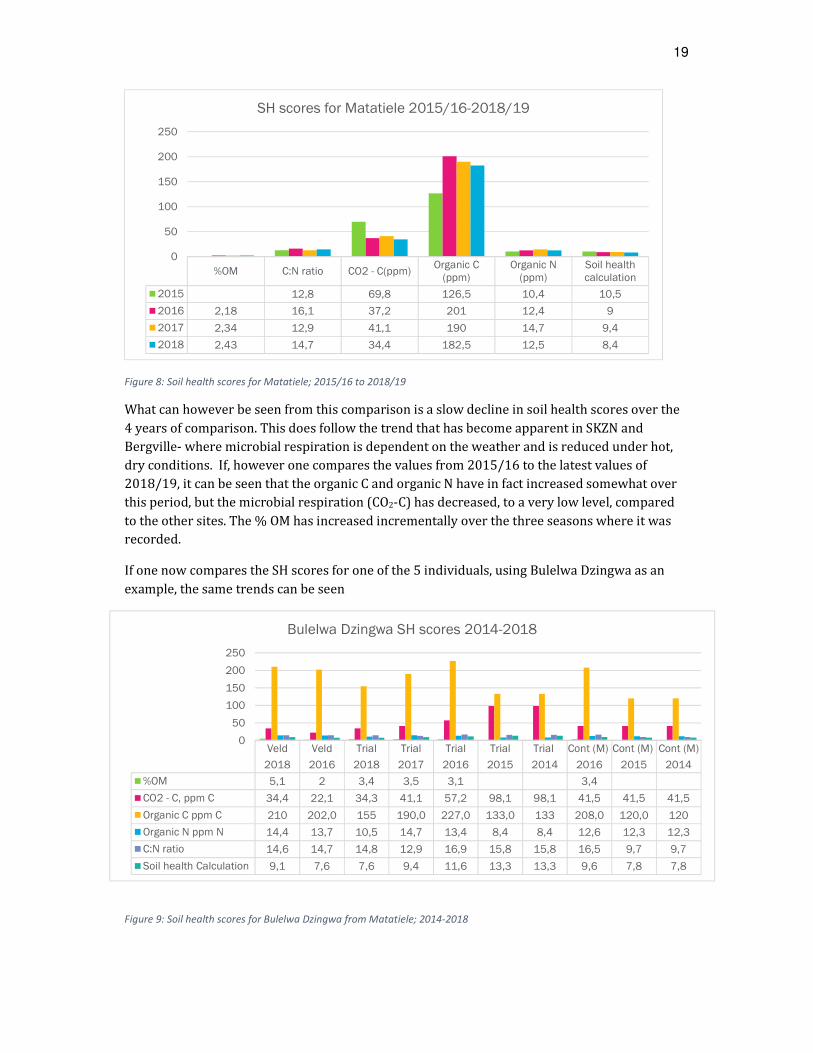
19
Figure 8: Soil health scores for Matatiele; 2015/16 to 2018/19
What can however be seen from this comparison is a slow decline in soil health scores over the
4 years of comparison. This does follow the trend that has become apparent in SKZN and
Bergville- where microbial respiration is dependent on the weather and is reduced under hot,
dry conditions. If, however one compares the values from 2015/16 to the latest values of
2018/19, it can be seen that the organic C and organic N have in fact increased somewhat over
this period, but the microbial respiration (CO2-C) has decreased, to a very low level, compared
to the other sites. The % OM has increased incrementally over the three seasons where it was
recorded.
If one now compares the SH scores for one of the 5 individuals, using Bulelwa Dzingwa as an
example, the same trends can be seen
Figure 9: Soil health scores for Bulelwa Dzingwa from Matatiele; 2014-2018
%OM C:N ratio CO2 - C(ppm)Organic C
(ppm)Organic N
(ppm)Soil healthcalculation
2015 12,8 69,8 126,5 10,4 10,5
2016 2,18 16,1 37,2 201 12,4 9
2017 2,34 12,9 41,1 190 14,7 9,4
2018 2,43 14,7 34,4 182,5 12,5 8,4
0
50
100
150
200
250
SH scores for Matatiele 2015/16-2018/19
Veld Veld Trial Trial Trial Trial Trial Cont (M) Cont (M) Cont (M)
2018 2016 2018 2017 2016 2015 2014 2016 2015 2014
%OM 5,1 2 3,4 3,5 3,1 3,4
CO2 - C, ppm C 34,4 22,1 34,3 41,1 57,2 98,1 98,1 41,5 41,5 41,5
Organic C ppm C 210 202,0 155 190,0 227,0 133,0 133 208,0 120,0 120
Organic N ppm N 14,4 13,7 10,5 14,7 13,4 8,4 8,4 12,6 12,3 12,3
C:N ratio 14,6 14,7 14,8 12,9 16,9 15,8 15,8 16,5 9,7 9,7
Soil health Calculation 9,1 7,6 7,6 9,4 11,6 13,3 13,3 9,6 7,8 7,8
0
50
100
150
200
250
Bulelwa Dzingwa SH scores 2014-2018

20
From this figure it can be seen that the soil health scores for Bulelwa’s CA trail plots are higher
than her controls, mostly due to higher Organic C values in the trial plots. The soil health scores
do however decrease each season.
The CA process in Matatiele is succeeding in maintaining soil health and soil fertility at a
reasonably stable, albeit low, value. It is not clear whether remedial strategies related to
cropping options (diversification, rotation and intercropping) can effect a major change in the
short and medium term in this site. It is suggested that an injection of large volumes of organic
matter would in fact be the only way to effect a noticeable change in the short terms.
PLFA results for SZN and EC The interplay between different types of microorganisms in the soil provide a further indication
of soil health and can pinpoint issues.
PLFA (Phospholipid fatty acid) analysis of the microbial populations in the samples provides a
breakdown of the type of organisms present; bacteria, fungi and protozoa, as well as their
relative abundance. This is based on the different and distinguishable biochemical structures
and processes for these organisms
Figure 10: Microbial populations from PLFA analysis for SKZN and EC; 2018-2019
Madzikane
Madzikane
Matatiele Matatiele Matatiele Matatiele Matatiele Matatiele
Control Trial m+b Trial Control Trial Veld Control Trial
C.D Xaba Mamolekeng Lebuoa Thapelo Ramanyali Tsoloane Mapheele
Average of Arbuscular Mycorrhizal 277 123 75 133 85 162 8 20
Average of Saprophytes 1034 331 182 307 157 447 37 83
Average of Actinomycetes biomass 665 246 365 366 304 510 95 97
Average of Rhizobia 228 21 0 26 0 30 0 0
Average of Protozoa biomass 74 13 7 18 10 28 0 0
Average of Fungi 1310 453 257 440 243 609 45 103
Average of Bacteria biomass 4062 1696 1823 2078 1580 2985 488 600
Average of Undifferentiated 3958 1419 2180 2355 1473 2442 586 638
0500
10001500200025003000350040004500
Microbial populations for SKZN and EC; 2018/19

21
Figure 11: reference table for values of microbial populations to determine an overall mode for the soils in question (pc
soilhealthsolutions.com)
Looking at the figure above and the reference table of values the following can statements can
be made:
• Arbuscular Mycorrhiza: These fungi live in a synergistic relationship with plant roots
and are the main organisms facilitating the liquid carbon and nutrient flow between the
soil and the plants.
o Madzikane: The soils for Mr Xaba, fall within the stable to regenerative modes,
which indicate good soil health. His control sample this year was taken from his
homestead plot and as is generally the case soil health of plots closer to the
homestead are considerably higher than for fields further away. His trial plot
results (123ppm) are thus lower than his control results (277ppm).
o Matatiele: CA trial plots for Mrs Lebueoa (75ppm) and Mr Ramanyali (85ppm)
fall within the progression and stable modes of soil health respectively. Mrs
Lebueoa’s crop growth and yields have been substantially higher than Mr
Rmanayali’s , but her general soil health is lower. Mycorrhiza populations for her
control plots (123ppm) are significantly higher than those for her trial plot. Mr
zmapheele from Khutsong is farming on extremely infertile soils, as indicated by
the generally low microbial values in his control plot and the very low presence
of Mycorrhiza (8ppm). Here is CA trial plot shows a significant improvement
(20ppm), although the value is still low and indicates a slow improvement in the
quality of his soil through his persistent efforts over the last 5 years
• In general, the microbial populations are highest for Mx Xaba (Madzikane) and Mrs
Lebueoa (Matatiele), also indicated through their higher yields and is a result of longer
term good soil management practices, rather than an outcome of CA.
• Rhizobial and Actinomycete populations are low throughout the CA trial plots and the
ratio of bacteria to fungi is high- indication that most of these soils fall in the progression
mode and still lean towards a low microbial diversity and a system that promotes the
growth of bacteria over fungi
This is discussed in a little more depth below.
In analysis of the microbial populations there is an expectation of increase in the fungal biomass
when compared to bacteria, gram positive bacteria when compared to gram negative and
predator species when compared to prey.
Soil Health
Index SHI
CO2-C
Respiration
ppm over 24
hours
Water
Extractable
Organic
Carbon
(WEOC)
ppm
Soil Organic
Matter %
Total
Microbial
Biomass
Total
Fungal
Biomass
Microbial
Active
Carbon
MAC %
Saprophytic
Fungi
Biomass
Mycorrhiza
e (VAM)
Biomass
Water Extractable
Organic N WEON ppm
Protozoa
BiomassRhizobia Biomass Diversity Index
< 4 < 20 < 80 < 1 < 1000 < 50 < 15 < 50 < 20 < 8 < 10 < 20 < 1
4 - 7 20 - 50 80 - 150 1 - 2 1000 - 2000 50 - 100 15 - 30 50 - 100 20 - 80 8 - 15 10 - 20 20 - 80 1 -1.2
7 - 10 50 - 100 150 - 280 2 - 5 2000 - 4000 100 - 300 30 - 70 100 - 300 80 - 150 15 - 20 20 - 50 80 - 120 1.2 - 1.6
> 10 > 100 > 280 > 5 > 4000 > 300 > 70 > 300 > 150 > 20 > 50 > 120 > 1.6
Survival mode
Progression mode
Stable mode
Regenerative mode

22
Figure 12: ratios of different organism types for SKZN and EC; 2018-2019
From the figure above it can be seen that the ratios of fungi to bacteria are generally quite low
for both Madzikane (SKZN) and Matatiele (EC), but is very low for the latter. The only way to
improve these conditions in the short term would be to substantially increase the amount of
organic matter in the soil. Both areas will require an injection of either compost and or manure
as the build up of organic matter and microbial populations through the cropping system and
diversification of crops is a rather slow process. The very high ratio of gram +ve to gram -ve
bacteria in Matatiele is a matter for concern as the gram-ve bacteria are more likely to be
disease causing organisms and linked to the extremely low ratio of predators vs prey in these
soils indicate a high load of disease causing organisms in these soils.
A remedial strategy using large quantities of composted chicken litter is being explored as an
option
Progress per area of implementation
Introduction
Planting for the 2018/19 growing season commenced in the last week of November 2018 and
inputs were delivered to the nine villages in Southern KZN; Nokweja, St Elios, eMazabekweni,
Plainhill, Ngongonini, Spring Valley, Plaatistat, Ofafa and Madzikane as well as Matatiele (Nkau,
Sehutlong, and Khutsong). Due to late rains and extreme heat, planting began very late this
season – mid December-mid January. The Local Facilitators have played an important role in
ensuring that participants were ready, with inputs provided and assisted in the spraying and
layout of trials.
As planting was late, monitoring of crop growth was also delayed. Some monitoring, using the
newly set up e-survey format (Pendragon) has been undertaken for a selection of participants
and below some of the late season monitoring and yields are reported upon
SKZN and EC late season monitoring and yields.
The table below summarises the yields for the CA trial and control plots.
Madzikane Matatiele
Average of Fungi:Bacteria 0,29 0,16
Average of Gram(+):Gram(-) 0,57 2,11
Average of Predator:Prey 0,14 0,01
0,00
0,50
1,00
1,50
2,00
2,50
PLFA results SKZN and EC; ratios of different organism types; 2018/19

23
Table 5: SKZN yields for CA trial and control plots; 2018/19
Village, area Maize Yield ave (t/ha) Bean yield ave (t/ha) Cowpea yield ave (t/ha)
CA trial Control CA trial CA trial
Madzikane 2,9 4,2 0,4 0,2
Plainhill 2,2 1,1 0,6 0,5
Ngongonini 2,9 0,8 0
St Elois 2,3 0,6 0
Emazabekweni 2,7 4,0 0,5 0
Springvalley 5,0 5,9 0,7 0,5
Ofafa 3,3 1,8 0,3 1,0
Matatiele 3,6 0 1,0
Average 2,6 3,4 0,6 0,6
This season yields have been quite low, with the CA trial plots offering lower yields than the
conventional control plots for maize. Bean and cowpea yields were also quite low at around
0,6t/ha respectively.
Maize varieties planted include Sahara, PAN 53 and SC701. Bean and cowpea varieties were
Gadra and mixed brown respectively.
Continuously changing weather patterns present bigger challenges each year. It’s proving a
more and more difficult task to pinpoint the exact planting date and farmers are opting to plant
twice or more in a season to increase chances of yield. The late start of rains either saw poor
germination and growth of crops and/or rot, mainly legumes intercropped with the maize.
Maize is the most important crop in the areas we work with, it is an important staple that is
used as a basis for almost all daily meals, drinks and brews. It also serves as livestock and
chicken feed in the continuously degrading and limited grazing areas with poor to no animal
control.
Below is a chart indicating the overall production of maize across the villages, for the 2017/18
and 2018/19 seasons. Madzikane and Painhill specifically, saw a drop in total production of
around 50%, which has been attributed to lower rainfall in this area. For the villages situated
around Highflats, closer to the coast an increase in overall production has been noted; namely St
Elois, Ngongonini, Spring Valley and Ofafa

24
Figure 13: Maize yields in SKZN and EC for the 2017-2018 and 2018-2019 seasons.
In addition, yields in the villages are also highly variable, as depicted in the figure below for both
seasons. For each season, there are those who obtain extremely low yields, or none at all and
then some people in the same village who manage to obtain high yields (between 4-8t/ha). This
has to do with the specific land use management and physical conditions for each farmer and
will be discussed in a little more detail in the following sections.

25
Figure 13: Individual participant yields in the SKZN villages for the 2018/18 and 2018/19 seasons.
Ofafa This area has shallow and hard soils with signs of organic matter depletion in certain areas,
given the hilly nature of the terrain and obvious signs of erosion on the slopes, making it hard
for crops to grow well. For the past two years however, things seem to be changing for the
Figure 14: Overall maize production in the SKZN villages across two seasons; 201718 and 2018/19
0,001,002,003,004,005,006,007,008,00
Eric
Mill
ion
Them
bekile
Baw
inile
Cosm
os
EB
Msiz
akali
ND
Nom
buyi
selo
Vakushile
Buyi
sile
Cin
geni
Mbila
ne
Nobuhle
Nokw
anda
Nto
mbifuth
i
Sandile
Sebenzi
le
Phath
izile
Vele
phi
Zim
ange
le
Fis
ani
Lin
diw
e
Mbongw
a
Nom
bule
lo
Phili
siw
e
Sth
abis
o
Zam
ekile
Zondani
Bakhulu
mile
Bongin
hla
nhla
Duduzi
le
Lett
a
Mzi
kayi
se
Nom
nta
so
Hla
nganani
Joseph
Mkhanyi
si
EMAZ MADZ NGONG OFAFA PLAIN SPRING ST ELIOS
Yie
ld (ha)
Axis Title
SKZN MAIZE YIELDS 2017SKZN MAIZE YIELDS 2017SKZN MAIZE YIELDS 2017SKZN MAIZE YIELDS 2017----2018201820182018
0123456789
Eric
Mill
ion
Them
bekile
Baw
inile
Cosm
os
Nom
buyi
selo
Vakushile
Buyi
sile
Cin
geni
Mbila
ne
Nobuhle
Nokw
anda
Nom
aw
eth
u
Nto
mbifuth
i
Sandile
Sebenzi
le
Path
eni
Phath
izile
Vele
phi
Zim
angele
Fis
ani
Lin
diw
e
Nom
bule
lo
Phili
siw
e
Sth
abis
o
Zam
ekile
Zondani
Bakhulu
mile
Bongin
hla
nhla
Duduzi
le
Lett
a
Nom
nta
so
Hla
nganani
Jose
ph
Mkhanyi
si
Phum
zile
Them
bile
EMAZ MADZ NGONG OFAFA PLAIN SPRING ST ELIOS
Yie
ld (t/
ha)
SKZN MAIZE YIELDS 2018SKZN MAIZE YIELDS 2018SKZN MAIZE YIELDS 2018SKZN MAIZE YIELDS 2018----2019201920192019
Figure14: Left, Phatheleni Ndlovu's tall maize and right, Velephi Hadebe's maize-cowpea intercrop plot

26
better with crops showing improved responses to the micro dosing of fertilizer and surface
maintenance application of lime as well as the crop diversification, linked to CA. Specifically,
Velephi Hadebe and Phathisile Ndlovu have their hopes renewed in the CA process as they saw
taller maize with stronger roots with both legume yields in beans and cowpeas.
The CA process has now influenced their control plots which are now another version of CA and
no longer the traditional version. When asked why this is, Phatheleni Nldovu responded “it’s
been since childhood since I last saw maize this tall, neighbours couldn’t tell if I was home or not
and I’d be in my maize plot.” She arguably is the participant with the greatest improvements,
across the southern KZN region.
This positive response of soils to the CA process has sparked the interests of a youthful lady
who represents her mother Zimangele Thusi. This young lady is unemployed with a young child
to take care of as her mother is at work during the week. Her involvement is proving beneficial
to the group as she keeps records for the group; planting dates, weather events and helps them
separate yields. She is intending to be more involved in the process assuming the role of the
local facilitator, taking over from Mandla Ndlovu who has since withdrawn. The pensioners
have held on to the process and things seem to be lightening up and they think they can still
produce maize despite the roller-coaster ride in weather patterns with temperature rises and
shortened, intense rainy seasons.
Ofafa is mountainous with steep slopes, which can have devastating effects on the top soil (by
erosion) and crop germination, and Phatheleni Ngcobo certainly experience this. Mrs Ngcobo is
below the compacted communal access road, that sees water running straight into her fenced
household creating small channels cutting down her field. This continues to be a problem every
summer with flash foods
and intense rains washing
her seed, fertilizer and
lime to the bottom of the
field. This has led to very
patchy germination of
both maize and legumes
and poor growth of
whatever manages to
survive. Her soils cannot
hold any water as there is
almost no residue cover,
low organic matter and
cover crops with poor
performance.
Figure 15: Phathisile Ngcobo's
steep slope field

27
Ofafa Annaul group review; 13 August 2019 Information for the section below comes from the discussion with the Ofafa participants and
indicates their assessment of their farming conditions.
Introduction
The shallow soils of the area, characterized by fairly poor organic content in crop fields, have
made it hard for crops to prosper. Experience has clearly indicated that ploughing further
degrades soils as opposed to rebuilding it and this was evident in exceptionally poor
germination and stunted growth. In their first year in the process, trials in Ofafa did not perform
well at all but farmers were willing to give it another try as conventional tillage has left them
with exceptionally poor to no yields at all. The second season was better than the first with
crops showing responses to fertility and acidity amendments. Their crops grew taller, healthier
and stronger and participants had much improved yields. The 2018/2019 season was even
better with Phatheleni Ndlovu exceeding her expectations at 8,5t/ha of maize. Generally, the
area did very well this year, doubling maize yields from 3,07 in 2017/2018 to 6,46 in the
2018/2019 season.
2018/19 Season
Feedback from the farmers revealed that crops did well with maize and cowpeas having good
yields. The exception was with beans mainly due to unfavourable weather conditions, beans had
good initial growth and experienced too much rains later in the season which led to a lot of rot.
Farmers are concerned with the poor performance of beans, especially as a protein source that
is rather expensive at the shops.
Cover crops
The cover crops were planted very late in Ofafa and farmers associate the poor seasonal
performance of cover crops to lack or rains after planting. Participants were supplied with a
winter master mix for relay planting in their maize plots. The cover crops did not thrive, but
some growth of the fodder radish was achieved. Zimangele Thusi and Phatheleni Ndlovu
cooked and ate the green broadleaves of the raddish and fed watery tubers to their goats and
cattle. The rest of the group is aware of the role these crops can play in their soils; replenishing
fertility reducing erosion.
Storage
Participants are in desperate need of storage drums to keep their yields away from rats eating
their stored maize.
Labour
Planting is manageable; participant’s plant individually and feel that group planting causes
conflict and problems. A number of youth are interested in joining the process. Most of them are
unemployed with a lot of time on their hands and interests in taking up agricultural related
work as both means to an end and career. The inclusion of young people has potential for
establishing a local farmer centre which was explained to the group sparking interest. This
centre however, will be linked to one of the existing learning group members as this serves to
provide knowledge and experience as well as affordable inputs. Currently there is no access to

28
inputs other than the nearest town, Ixopo. Locally seed is sold between farmers at R30 and R20
for two mugs of beans and maize seed respectively. Farmers in general do not buy any fertilizer
and use kraal manure from their kraals and from neighbours, for those who do have livestock.
Savings
Farmers do not save for farming; they only struggle for cash when the time for planting comes.
Again, the growth of the learning group may well echo the need for collective saving and buying
of inputs. Savings groups could do a lot for agriculture in the area as well as general household
needs. The idea of stokvels is not foreign in the area and the culture of saving and collective
efforts could be resuscitated for the benefit of both the old and young.
Discussion on fertilizer use, cover crops and general observations.
The farmers have observed major differences since they started farming with CA. They recall
that in their first year they had very poor yields and the yields have been improving year after a
year. They observed that the use of fertilizer as well as LAN has led to the provision of essential
nutrients available to the crops hence the increasing yields they are having. They also observed
faster growth in maize in the past season. Farmers are aware that there are different types of
fertilizer and appreciate the importance of having soils tested. They are however of the view
that Gramoxone promotes growth of weeds that compete with their food crops. It is rather a
case of using this herbicide so as to plant as soon as possible; after rains weeds grow fast and
then Gramoxone is applied as a contact herbicide, immediately before planting. With Roundup
there is a waiting period. Some participating farmers saved cover crop seed and will be
replanting them. Stray livestock however continues to be a threat as they invade fields with
cover crops still growing.
Table 6. Comparison between the control and experiment fields
Controls Trials
Drier soils Moist soils Light reddish soils Darker soils Pale stalk and leaves Dark green stalk and leaves Poor yields Better yields Less residue More residue
Thandiwe Hadebe, who uses kraal manure on her control plot, reckons that her yields are
almost the same between her trial and control due to the consistent organic matter with
nutrients that she pumps into her soils. Here she was attesting to the crucial role manure plays
in soil fertility enhancement. In the meeting we had a new participant who will be planting this
coming season. Sayinile Nsindane also grows maize for her households and keeps pigs that she
feeds maize that she mills at the Amble Inn Hotel in Ixopo, costing her R20 per 20L. She is
hoping the CA process will improve her yields and will help her sustain and grow her piggery.
Madzikane
Madzikane is one of the few areas with organized farmers. This year however, saw a significant
decrease in yields of both the maize and legume crops. Mrs Vakashile Gambu and Cosmas Xaba
managed good looking maize for both their trial and control plots and are selling their maize to
local community members. To date Mr Xaba has sold over 40 bags (50kg) of maize from his

29
harvest. He is selling his bags at R140 each,
meaning thus far he has made about R6000
already. He adds an additional R10 to deliver
bags to his customers and issues discounts with
big orders. He still has quite a lot of maize left to
thresh on his recently purchased thresher; he
reckons he can still sell close to 50 bags of maize.
But for the season, he only managed just over
1t/ha, which was one of the lowest yileds for the
area, with Mrs Shozi getting the highest yield at
close to 6t/ha.
The Madzikane Farmers Association members all
sell their maize locally and at the same price as
Mr Xaba. The prices they sell at are agreed upon in their famer’s association after having
researched local maize and tonnage prices. They also keep some of their harvest for their sheep,
cattle and traditional chickens. As part of the diversification of his livelihood, Xaba is now
looking to buy a mill to process maize into maize meal. The idea here is that people will bring
their own maize for milling at a fee as well as milling his own maize and selling it off as maize
meal. They are very much confident in the quality of their maize and do not doubt that it will fly
off the shelves as maize is an important part of people’s daily lives; food, feed, making amagewu,
traditional beer and so on.
Alongside is a chart showing
maize yields for the association
members.
The high yileds for the control
plots for Mrs gambu and Mr Xaba
this season, will need to be
discounted, as they are not a
direct comparison. As
mentioned, it has been difficult
to find appropriate control plots
for farmers, as they do not
practices conventional tillage in their fields alongside the CA, having chosen to use CA
throughout. The control plots this season were homestead plots, a distance away from the fields
that were ploughed, but in hind sight this option does not work well either – as the fertility
management in the homestead plots appears to be obviously better than that in the fields and
can not be directly compared.
Figure 16: CD Xaba's maize in traditional storage
Figure 17: Madzikane Farmers
Association maize yield distribution
2018/2019 season

30
Ngongonini Ngongonini was no exception to the dry start and heavy rains towards the end of the season.
This saw poor germination of crops with beans and cowpea suffering the most. Despite an
unfavourable start to the season the Ngongonini area still managed to increase yields to just
short of 4 t/ha (3,9ha) from 2018 to the 2019 season.
Generally beans grew well initially, but then either did not pod, or rotted on the vines towards
the end of the season. A number of participants including Sebenzile Mthethwa, Cingeni Kheswa
and Velani Mthethwa, did not see any legume harvests this year and very poor maize harvests...
Nokwanda Mthethwa didn’t get a
good yield this year with most of
her maize in very small cobs
which she was forced to harvest
before drying out due to
livestock set free to roam fields
for stover. These rotted and
germinated in the bags they
were stored in.
Figure 18: Mrs Sebenzile Mthethwa's
maize, mostly rotten
Table 7: Yields for individual Ngongonini participants 2018-2019
NGONGONINI BEANS AND COWPEA YIELDS 2018-2019
Trial Bean Yield Cowpeas
Name Surname Area
(m2)
weight
(kg)
t t/ha Are
a
weigh
t (kg)
t t/ha
1 Nokwanda Mthethwa 100 0 0,000 0,000 100 0 0 0
2 Sebenzile Mthethwa 100 0 0,000 0,000 100 0 0 0
3 Eunice Nkabini 100 4,5 0,005 0,450 100 0 00 0
4 Ntombifuthi Phungula 100 0 0,000 0,000 100 0 0 0
5 Buyisile Kheswa 100 0 0,000 0,000 100 0 0 0
6 Sandile Mncwabe 100 0 0,000 0,000 100 0 0 0
7 Cingeni Kheswa 100 0 0,000 0,000 100 0 0 0
8 Thokozani Kheswa 100 0 0,000 0,000 100 0 0 0
9 Learnard Gamede 100 10,4561
0,010 1,046 100 0 0 0
10 Letheni Mkhize 100 4,568 0,005 0,457 100 0 0 0
11 Mandla Mkhize 300 49,402 0,049 1,647 100 0 0 0
12 Mambili Kheswa 100 3 0,003 0,300 100 0 0 0
13 Mbilane Mthethwa 100 0 0,000 0,000 100 0 0 0
14 Noma Shezi 100 10 0,010 1,000
Total 4,899 0,00

31
NGONGONINI MAIZE YIELDS 2018-2019
No Name Surname Experiment Number
of bags
Grain
weight (kg)
area
(m2)
Weight
(t)
weight
(t/ha)
1 Nokwanda Mthethwa Trial 1 20,480 300 0,020 0,683
2 Nobuhle Nkabane Trial (decobbed)
1 40,000 300 0,040 1,333
3 Ntombifuthi Phungula Trial (decobbed)
1 43,664 300 0,044 1,455
4 Sebenzile Mthethwa Trial (decobbed)
0 0,000 200 0,000 0,000
5 Mbilane Mthethwa Trial (decobbed)
1 40,000 300 0,040 1,333
6 Cingeni Kheswa Trial (decobbed)
2 100,000 300 0,100 3,333
7 Sandile Mncwabe Trial (decobbed)
0 0,000 300 0,000 0,000
8 Buyisile Kheswa Trial (decobbed)
3 120,299 300 0,120 4,010
9 Nomawethu Shezi Trial (decobbed)
1 200,000 300 0,200 6,667
10 Control decobbed
1 100,000 300 0,100 3,333
11 Mandla Mkhize Trial 5 134,720 300 0,135 4,491
Average Yield 2,913
Figure 159: Mandla Mkhize’s maize and bean
yields. The maize was mouldy and continued to
rot in storage
EmazabekweniEmazabekweniEmazabekweniEmazabekweni
Emazabekweni is one area where MDF has had a bit of a challenge gaining traction for a number
of reasons. Firstly, some participants dropped out of the programme after being told that MDF
does not plough or plant for them but they would have to do the work. Secondly, some people
did not have fencing and feared livestock would damage their crops, hence they withdrew.
Thirdly, involvement in agriculture has seen a gradual decline over time. This season has been
quite a challenging one for the community, with the unpredictable weather patterns making it
tricky deciding on the planting time, which many conceding that deciding on when to plant is
becoming more of a gamble. Nonetheless, out of eight participants, five received inputs and four
people planted.
Million Ngubane is a very hard working farmer who has definitely seen things change for the
better. Mr Ngubane is retired and now lives with his wife and children. He decided to go into
farming full time after he stopped working and has not looked back since. When harvesting, he
counted 28x 20 litre buckets of maize cobs which consisted of 40 cobs each. The average

32
weight/bucket was 12.350 kg for his trial. For the control (PAN 6479 seed saved from last
season), Mr Ngubane said he got 35 x 20 litre buckets with an average weight of 11 kg. For
beans he obtained a yield of 22 kg, which was very impressive considering the fact it was a hot
season and the rains came later than usual.
Table 8: Emazabekweni individual participants yields; 2018-2019
Plainhill
Plainhill is one of the four new groups established in 2017. The group started with nine
members but now has twelve as three new participants have joined. The group’s response to
experimenting with CA has been positive with all members having planted in 2017/18 as well
as in the current growing season. There is an improvement in the appearance of both maize and
legumes this season and the farmers believe this is due to the application of dolomitic lime.
EMAZABEKWENI YIELDS 2018-2019
Name Surname Plot Maize yields (t/ha) Bean yields
(t/ha)
No of
bags
Grain
weight
(kg)
area
(m2)
Weight
(t)
weight
(t/ha)
Million Ngubane Trial 30 252,413 500 0,252 5,048 0,631
Million Ngubane Control 40 322,011 800 0,322 4,025
Qiniso Mchunu Trial 1 10,008 200 0,010 0,500 0,426
Eric Latha Trial 0 52,197 200 0,052 2,610 0,518
Average Yield Trial 2,720 0,525
Figure 20: Mr Million Ngubane from Emazabekweni

33
PLAINHILL YIELDS 2018-2019
Maize yields (t/ah) Bean yields
(t/ha)
Name Surname Experiment Number
of bags
Grain
weight
(kg)
area
(m2)
Weight
(t)
weight
(t/ha)
Philisiwe Sosibo Trial 0 0,000 300 0,000 0,000 0,54
Sthabiso Dlamini Trial 1 14,420 300 0,014 0,481 0
Zamekile Dalmini Trial 6 67,925 300 0,068 2,264 0,75
Nombulelo Ndlovu Trial 8 122,858 300 0,123 4,095 1,5
Zondani Chonco Trial 0 59,612 300 0,060 1,987 0,41
Control 0 62,391 400 0,062 2,080
Lindiwe Chonco Trial (decobbed)
0 0,000 300 0,000 0,000 0,92
1 5,452 300 0,005 0,182
Fisani Ndlovu Trial (decobbed)
0,000 300 0,000 0,000
Average Yield control 1,131
Average Yield trial 2,207 0,58
Figure 21:Fisani Ndlovu, oOndani Chonco and Khonzeni Chonco with their bean and cowpea harvests

34
Matatiele
Sekhutlong Sekhutlong Sekhutlong Sekhutlong
This season was once again a difficult one for Matatiele. This has
had a negative impact on the growth and expansion of CA in the
area as we haven’t managed to get that ‘wow’ effect for people
to be drawn into the process. The late start of rains saw very
poor germination of crops which resulted in very poor yields
with Matsepo Futhu in Sekhutlong getting absolutely no yield
whatsoever. On the contrary, her neighbour Mamolelekeng
Lebeuoa saw good growth of crops and a very promising yield
for the season despite her maize suffering a bacterial infection.
Mamolelekeng’s field has been suffering from cob or tassel
smut, that is both soil and wind borne.
Figure 22: Mamolelekeng’s CA maize plot with cob smut in evidence.
This disease spreads rapidly in the area once spotted and can compromise the entire crop.
Crops such as cover crops and beans can break the cycle of this disease. We are in the process of
sourcing chicken manure which has been suggested as another option to look at.
Malerato Lebueoa is directly opposite to Mamolelekeng and is very much concerned that her
crops may well get this disease potentially compromising her maize production livelihood and
income generation. Malerato grows maize for both eating and selling to those who do not have
maize, she also uses her yellow maize to make traditional brews that she sells at her house
among other cold beverages. These are the only three remaining participants in Sekhutlong
villages as others eventually gave up
the process due to extremely poor
results.
Malerato has been doing well for the
past two seasons but she has also
seen a decline in her maize this year
and foresees a lower yield. Malerato
hired out labour to cut and pile her
maize and consequently her trial and
control maize was mixed together.
making it difficult to work out yields
for the season.
Figure 23: Malerato standing next to her pile of
maize

35
KhutsongKhutsongKhutsongKhutsong
Simon Tsoloane Mapheele is the one long standing participant still hoping that the CA process
will eventually see improvement in his soils and crops. He has tried different planters, different
planting times, rotations and intercrops but he is yet to see good yields.
Figure 24: Clockwise from top left; stand and growth of maize was patchy and disappointing. The cover crop mixes grew
better and provided some cover
The ‘beach-sand’ for soil that he plants on needs a lot more time and consistent effort to pump
in organic matter and foster some life into the soils. This year, unfortunately, he did not see any
yields of both maize and beans. His cover crops only made it through his irrigation efforts. He is
however still able to generate some income from milling local maize that people bring in bags.
Matatiele review session, 8th August 2019
The meeting was held at Nompumelelo Mbhobo’s home. She is a 1st year participant who
spontaneously adopted CA asking for leftover seed from the facilitator Bulelwa Dzingwa.
Highlights
Generally, the season was not good, on the basis of late onset of rains, resulting in poor
germination. Crops that germinated had very little rains and thus growth was not the best
either. Noluthando Pili definitely feels that lack of rains were responsible for the bad
performance of the trials this season. Upon receiving rain, legumes quickly grew big and bushy
with cowpeas growing very well but never forming pods while beans rotted. Noluthando only
managed a 5kg bean yield from her 100m² plot.
Participants have tried both yellow and white maize varieties in the past and have observed that
yellow maize does not grow as well as white maize and is more susceptible to rot. Some
participants however still would prefer to plant yellow maize as there is a better local market in
the area.
Participants have found using Gramoxone as a herbicide prior to planting to be much less
effective than the Round-up/ Dual gold mix used in the first few seasons. On average,

36
participants weeded two and a half times this season. Blackjack dominates the field making it a
very hard task to harvest even. The weeds were strongly rooted and competed heavily with
crops. Generally, control plots did not have as much of a weed problem as trials and here
participants think that the application of fertilizer and intercropping increases fertility and
weed growth. They have now recognised that waiting until the weeds seed prior to weeding has
increased weed problems in their fields.
Participants present, all belong to Village Savings and Loan Association (VSLAs), but only one
member occasionally takes out loans to purchase seed and pay labour to clear weeds, sow seed
or harvest. The maize she harvests in her plots is milled in town costing R90 per 80kg bag. This
lasts the family for at least a month, as they send some for herders in the mountains.
Changes in weather conditions
The harsh weather conditions have had a negative impact on the availability of food. Increased
variability of rains has seen poor germination and crop growth coupled with washing away of
seed in some instances. As a result of this, they would like to try planting beans two to three
times in a season i.e. late September, early in November and also late in January, to spread the
risk. Planting of the maize-bean, maize-cowpea intercrops will commence on November 15th,
ending on the last day of the month of November. Farmer participants also want to try out
hybrids as they say that hybrids are the way to go and have proven to be able to withstand high
temperatures, stalk borer and diseases.
A cropping calendar was designed with participants to explore different planting times and
crops depending on the weather conditions. It was a little difficult to do, as participants do not
keep records and already some have stopped growing a range of crops due to dry conditions.
Table 9:Crop calendar for wet, dry and normal seasons as understood by the Matatiele participants
Month
Wet season Dry season Normal season
January
Cabbage, spinach,
mustard
Beans, Cabbage, spinach,
mustard, rappa
Cabbage, spinach,
mustard
February
Cabbage, spinach,
mustard
Cabbage, spinach,
mustard
Cabbage, spinach,
mustard
March
Cabbage, spinach,
mustard
Cabbage, spinach,
mustard
April
Cabbage, spinach,
mustard
Cabbage, spinach,
mustard
May
Cabbage, spinach,
mustard
Peas
June
Peas
Peas
July
Peas
Peas
August
Peas, potatoes, sweet
potatoes
Peas, green beans,
potatoes, sweet potatoes
September
Potatoes
Potatoes
Potatoes, green beans
October
Maize, beans
Potatoes
Potatoes, rappa, tomatoes,
brinjals, green pepper,
green beans

37
November
Maize, beans
Maize, beans
Maize, beans, rappa,
butternuts
December
Maize, beans Maize, beans Cabbage,
spinach, mustard
Maize, beans, butternuts
Farmer centre
Sourcing of inputs is a yearly struggle where farmers travel to town buying seed and fertilizer
on the streets. Although the participants recognise the value of having a local farmer centre, not
just for access to inputs, but also as a place where newcomers could be provided with advice
and mentoring, they do not feel motivated to start one themselves. They fear that they will
become a target for theft.
Conclusion
The small group of women are still keen on trying ways to stand up against changing weather
conditions as their families depend on farming for food, feed and income generation. They still
are not prepared to plant bigger fields due to the high risks of crop failure, but want to try any
means necessary to maintain this livelihood; trying new varieties and different planting times
and designs.
Cover crops Cover crops were distributed to most participants, in the form of sunflower for summer over
crops and the winter cover crops mix, for both SKZN and Matatiele. Only a small proportion of
the participants actually planted the cover crops, given the adverse weather conditions and
even fewer harvested seed from these crops. Below are a few examples where the cover crops
did well.
Nompumelelo Mbhobho (Matatiele)
Figure25: Mrs Mbhobho with her 25kg
sunflower harvest and Bulelwa Dzingwa
the local facilitator
Mrs Mbhobho is a 53 year old
unemployed woman who attended
the open day held in Moqhobi last
year. She then started her CA
experimentation process this
season. Early on in December, Mrs
Mbhobho planted a five plot trial
(5m x 5m); sunflower sole plot,
maize-sunflower, two maize-
cowpea plots and a maize only plot.
Her maize germinated and grew
well, but she received no harvests form beans or cowpeas. Mrs Mbhobho has harvested a 25kg
bag of sunflowers from her sunflower and maize-sunflower plots. She plans to mix this with
yellow maize and sell it locally to those who keep traditional chickens.

38
She also planted a control alongside the trial where she has 30m x fourteen lines of traditional
maize with 20m of maize-cowpea making her total control size 50m x 10m (500m²). From this
plot she harvested 7,45kg of cowpea that she plans to keep for the family seeing they did not get
any beans. This plot was planted beginning of November with horse manure worked into the
soil before planting.
Ocean Khokhotho
This gentleman is the only one who managed to plant in Mqhobi (Matatiele) this season. His
trial didn’t germinate well, but grew well thereafter with nice strong tall maize. Sunflowers did
not do well and Mr Khokhotho doesn’t have any yields for beans and cowpea for the season. On
a small plot by the fence, his black oats and radishes grew very well. He will be cutting this and
carrying to where he keeps his sheep.
Simon Tsolaone Mapheelle’s never ending efforts
Mr Tsoloane has been with the program since its very first year of introduction in 2013 in the
north eastern part of Eastern Cape, Matatiele. When he returned from work in the mines,
agriculture presented a good opportunity to be self-employed. Maize production would see him
generate an income from selling the staple maize in his local area of Khauoe. However, sandy
Figure26: Nompumelelo's plots
Figure 27: Left and centre, cover crops struggling with weeds and right, cover crop by the fence doing very well

39
soils with little to no organic matter coupled with erratic rains and high temperatures proved to
be a big problem. CA has not had the expected effect for this gentleman but promises enough
future in farming for him to continuously look at different options within his farming system. Mr
Tsoloane has tried both minimum tillage and conventional tillage alongside each other to see
what promises a better future for him and he has opted for CA going into the future.
In recent years he has been using the animal drawn minimum tillage planter allowing him to do
bigger plots a lot faster than before. The issue of residue retention and or cover is still a big
issue, as there is just never close to enough. After two years of doing this and with his maize not
showing much improvement, he began doubting the planter, voicing concerns of fertilizer and
seed depths and whether the planter was really planting.
2018/2019 season
On the 28th of December 2018, Mr Tsoloane decided to go back to basics using hoes to open up
basins, adding lime and micro-dosing with fertilizer. He hired local labour in two young men
that were helping him work his plot.
Figure 28: Tsoloane's plot marked with lime where
basins were dug
His plot was visited on the 4th of March 2019,
about three months after planting; showing
poor germination and growth for most of the
plot. The section on the side of his field, next to
the peach trees has always performed a lot
better. This is due to a different management
strategy for this plot historically, as it as used
for vegetable production and received much
higher levels of manure and organic matter.
Tsoloane then decided to put in beans where there were spaces in an attempt to provide cover
but his beans didn’t do any better.
Figure 28: Tsoloane maize germination and growth; showing good growth next to the fence and bad germination and
growth for the rest of his plot.

40
When beans failed to cover the bare soils, he then sowed in winter cover crops as a relay. His
cover crops germinated and grew well and help provide cover for the soil. Tsoloane frequently
waters his cover crops
through a pipe diverted
from the municipal
water mainline.
Watering his plot has
proved very beneficial
for his cover crops
Tsoloane has been also
experimenting with Teff
in a plot adjacent to the
CA trial plot and this
plot also sees some
watering from time to
time. This plot has been
planted in an attempt
to regenerate his soils
and also provide more
nutritious feed for his
cattle. Tsoloane has cut
about nine bags of Teff
and this will be fed to
cattle and calves.
Figure 30: Teff cut and
bagged
Conclusion
CA, as a farming system has opened up more livelihood opportunities for Tsoloane; he is now
able to grow and harvest a range of fodder for his livestock. He also now plans to meticulously
harvest manure; specifically urine, from his livestock for increasing organic matter and nutrient
content in his soils. In combination, increased levels of manure application and cover crops,
have the potential to regenerate his soils, that will help to establish cash crops more
successfully.
Figure 29: Tsoloane's winter
cover crops
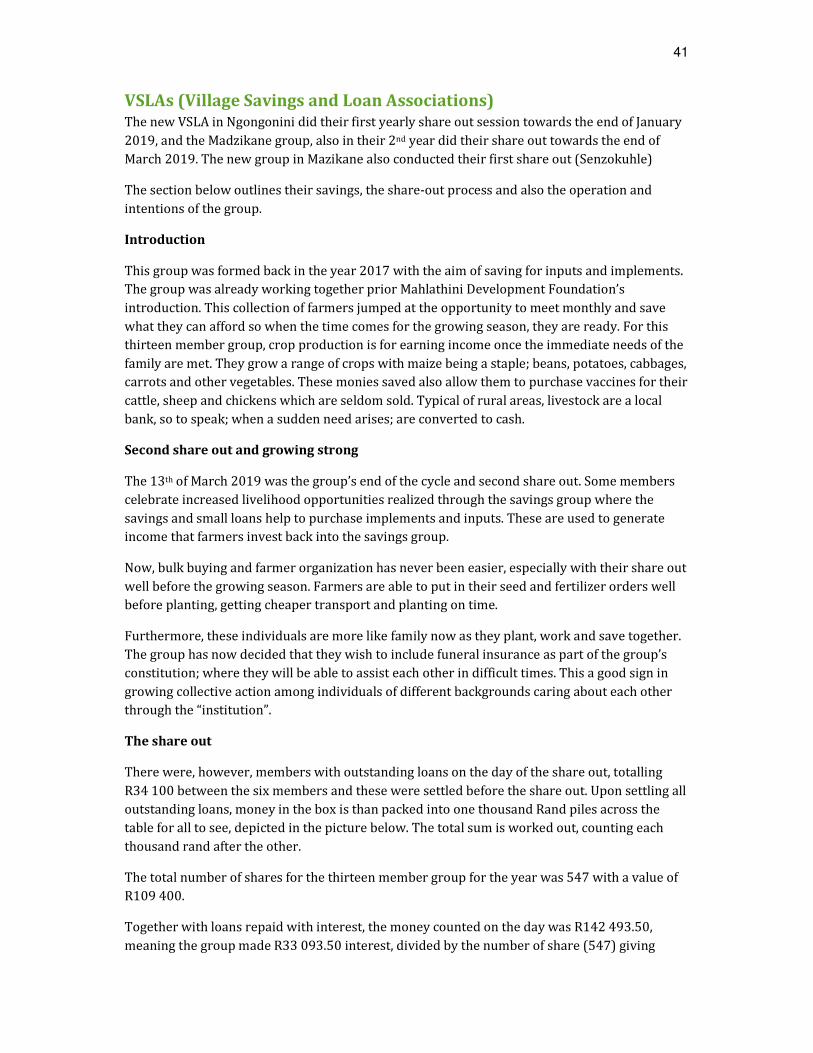
41
VSLAs (Village Savings and Loan Associations) The new VSLA in Ngongonini did their first yearly share out session towards the end of January
2019, and the Madzikane group, also in their 2nd year did their share out towards the end of
March 2019. The new group in Mazikane also conducted their first share out (Senzokuhle)
The section below outlines their savings, the share-out process and also the operation and
intentions of the group.
Introduction
This group was formed back in the year 2017 with the aim of saving for inputs and implements.
The group was already working together prior Mahlathini Development Foundation’s
introduction. This collection of farmers jumped at the opportunity to meet monthly and save
what they can afford so when the time comes for the growing season, they are ready. For this
thirteen member group, crop production is for earning income once the immediate needs of the
family are met. They grow a range of crops with maize being a staple; beans, potatoes, cabbages,
carrots and other vegetables. These monies saved also allow them to purchase vaccines for their
cattle, sheep and chickens which are seldom sold. Typical of rural areas, livestock are a local
bank, so to speak; when a sudden need arises; are converted to cash.
Second share out and growing strong
The 13th of March 2019 was the group’s end of the cycle and second share out. Some members
celebrate increased livelihood opportunities realized through the savings group where the
savings and small loans help to purchase implements and inputs. These are used to generate
income that farmers invest back into the savings group.
Now, bulk buying and farmer organization has never been easier, especially with their share out
well before the growing season. Farmers are able to put in their seed and fertilizer orders well
before planting, getting cheaper transport and planting on time.
Furthermore, these individuals are more like family now as they plant, work and save together.
The group has now decided that they wish to include funeral insurance as part of the group’s
constitution; where they will be able to assist each other in difficult times. This a good sign in
growing collective action among individuals of different backgrounds caring about each other
through the “institution”.
The share out
There were, however, members with outstanding loans on the day of the share out, totalling
R34 100 between the six members and these were settled before the share out. Upon settling all
outstanding loans, money in the box is than packed into one thousand Rand piles across the
table for all to see, depicted in the picture below. The total sum is worked out, counting each
thousand rand after the other.
The total number of shares for the thirteen member group for the year was 547 with a value of
R109 400.
Together with loans repaid with interest, the money counted on the day was R142 493.50,
meaning the group made R33 093.50 interest, divided by the number of share (547) giving

42
R60.50/ share. This
than means the
newly calculated
share value with
interest is now
R260.50 as captured
in the picture below.
Each member’s
shares for the year
are than multiplied
by the new share
value and members
receive their savings
inclusive of interest
accumulated.
Figure 31: Calculation of
outstanding loans and
then laying out of share
out monies.
Conclusion
The group is still keen to carry on having seen the important role savings play in their
livelihoods. This group of farmers has their own “bank” where they source money for investing
in enterprises with great potential to yield profits in acceptable turnaround time. The also saved
on the day of the share out as well, this is their third cycle now.
Senzokuhle share out meeting (Madzikane); 20 June 2019
Introduction
Senzokuhle Savings Group was the last of the new groups to
share out for their first cycle of savings. The group worked
quite well considering the challenges they faced, with some
members skipping meetings or leaving the group all together.
The reason for this was that the group members who started
the group did not know each other previously and lived far
apart hence it was not easy for them to build trust in the
beginning. Nonetheless, the members that remained showed
unwavering dedication and persevered until the end as they
were curious to see whether there is really anything to
savings.
Figure 32: The Senzokuhle group share out
Distribution of Funds
The meeting went very well except some members were concerned that the people who
received the most money, did not take out any loans but benefited the most. The team then
explained that the group should always keep in mind that savings is not necessarily a money

43
making scheme ,but a vehicle to promote financial planning and more responsible spending
towards constructive things such as farming inputs.
Table 10: Share out summary for the Senzokuhle VSLA, June 2019
Stakeholder interaction- Innovation platforms Given the difficulties of the season, late planting and disruption of the timing in terms of
harvesting, open days were not held in this area, during this 6 month period. Some attention
was given to interactions with Government based stakeholders and the following meetings were
attended:
• Harry Gwala District Extension forum (DARD) – 6 June 2019
• Ubuhlebezwe LED forum meeting (24 June 2019), as well as an Agricultural forum w/s
(25 July 2019).
In addition, meetings have been held with the Umngeni Resilience Programme (UKZN and
Umngungundlovu DM) to explore collaborative options. This resulted in a presentation by MDF
at the Ukulinga Howard Davis Memorial Symposium 19 August 2019, hosted by UKZN entitled
“A smallholder level decision support system improves resilience to climate change”, where
some of our work in CA was presented.
A relationship has been set up with the Umvoti LM in Greytown. It is expected that we may
assist with the introduction of CA to more maize growing communities in the region.
Funding has been obtained from Nedbank to assist all MDF staff, interns and lead farmers to
attend the No-Till Club’s annual conference at Drakensville (3-5 September 2019) entitled”
Getting conservation agriculture working for your farm”.
Work has commenced, assisted by Mr Nqe Dlamini from StratAct, to initiate three agricultural
cooperatives for the programme (Madzikane, Swayimane and Bergville).
A CA introductory meeting was held for a new interest group in Spring Valley (202 July 2019).
No Surname Name Total
Shares
New Share
Value
Total Income
received
1 Shozi Mrs 58 R121 R7,018.00
2 Mncwane Mrs 4 R121 R484.00
3 Gazu CA 4 R121 R484.00
4 Mbwanja NA 25 R121 R3,025.00
5 Mbanjwa S 27 R121 R3,267.00
6 Xaba Sbu 17 R121 R2,057.00
7 Zulu NA 26 R121 R3,146.00
8 Mtolo Mrs 24 R121 R2,904.00
9 Maduna NA 24 R121 R2,904.00
10 Sosibo BA 36 R121 R4,356.00
TOTAL R29,645.00

44
In addition, three research partnerships have been put in place for the coming season: • ARC Potchefstroom; Dr Belinda Janse van Rensburg – “The impact of conservation
agriculture on maize ear rots and resultant mycotoxin production in commercial and
smallholder farming systems” and • Cedara, Agricultural crop Research Services; Dr Alan Manson – “Strip cropping options
for introduction of fodder crops into CA farming systems for smallholders” and • AGT Foods; Mr Simon Hodgson – “Introduction of new cover crops into smallholder CA
farming systems”.
Issues, successes and recommendations 1. Options for increased diversification with crops that are drought tolerant and able to
survive in low fertility soils need to be aggressively pursued, as are options of soil
erosion control to curtail run-off.
2. Work with short season maize varieties that are resistant to the common soil fungal
pathogens and cob rots needs to be tried out.
3. Options for adding substantial quantities of organic matter, through manure and large-
scale composting need to be considered.
4. Livestock integration through fodder production options, supplementation and
diversification of cover crops planted is seen as an important component of the CA
system, specifically in the light of continued and worsening climate variability.
5. Setting up or marketing cooperatives for those learning groups that are ready for this
step has been initiated for Madzikane and Swayimane. This is seen as an important step
in the commercialisation process.
6. Those villages and learning groups where little traction has been achieved will be
provided with minimal support in the coming season to enable the consolidation of this
research process in more active communities.
7. There is an interest in these areas to also invest in locally run and managed micro-maize
milling operations.
8. Those participants involved in the small business development training are mostly
interested in expanding their very small- scale poultry production – given that more
maize, sunflower, millet, sorghum and Sunnhemp seed for example is now available
locally though their CA production processes.

45
Budget summary by August 2019
Date of transaction Type of transaction Amount ( R )
2018/10/26 Monthly expenses 57 629,03
2019/01/22 Monthly expenses 54 720,77
2019/02/28 Monthly expenses 68 516,48
2019/03/29 Monthly expenses 39 896,19
2019/04/30 Monthly expenses 60 708,63
2019/05/31 Monthly expenses 59 855,08
2019/06/30 Monthly expenses 42 884,45
2019/07/01 Monthly expenses 57 507,40
2019/07/01 Monthly expenses 2 070,00
2019/07/31 Monthly expenses 47 493,76
TOTAL AUG 2019 491 281,79
![[XLS] · Web viewSTR 20015 STR 30105 STR 30115 STR 30123 STR 30125 STR 30130 STR 40090 ORİ STR 40115 STR 41090 ORİ STR 44115 STR 45111 STR 50020 STR 50103A STR 50112 STR 50113A](https://img.pdfslide.us/doc/110x75/5ad04b0c7f8b9a1d328e1e93/xls-viewstr-20015-str-30105-str-30115-str-30123-str-30125-str-30130-str-40090.jpg)


![Introduction to KZ mechanism[File: Viewgraphs New/KibbleZurek/KZ- MechanismIntro.ai]](https://img.pdfslide.us/doc/110x75/5697bf9c1a28abf838c9308b/introduction-to-kz-mechanismfile-viewgraphs-newkibblezurekkz-mechanismintroai.jpg)

![Introduction to KZ mechanism[File: Viewgraphs New/KibbleZurek/KZ-MechanismIntro.ai]](https://img.pdfslide.us/doc/110x75/56815aa3550346895dc82c1d/introduction-to-kz-mechanismfile-viewgraphs-newkibblezurekkz-mechanismintroai-56b57e9f70291.jpg)