Embed Size (px)
Citation preview
3rd QUARTER FY 2014 EARNINGS PRESENTATION
January 30, 2014
23rd Quarter FY 2014 Earnings Presentation January 30, 2014
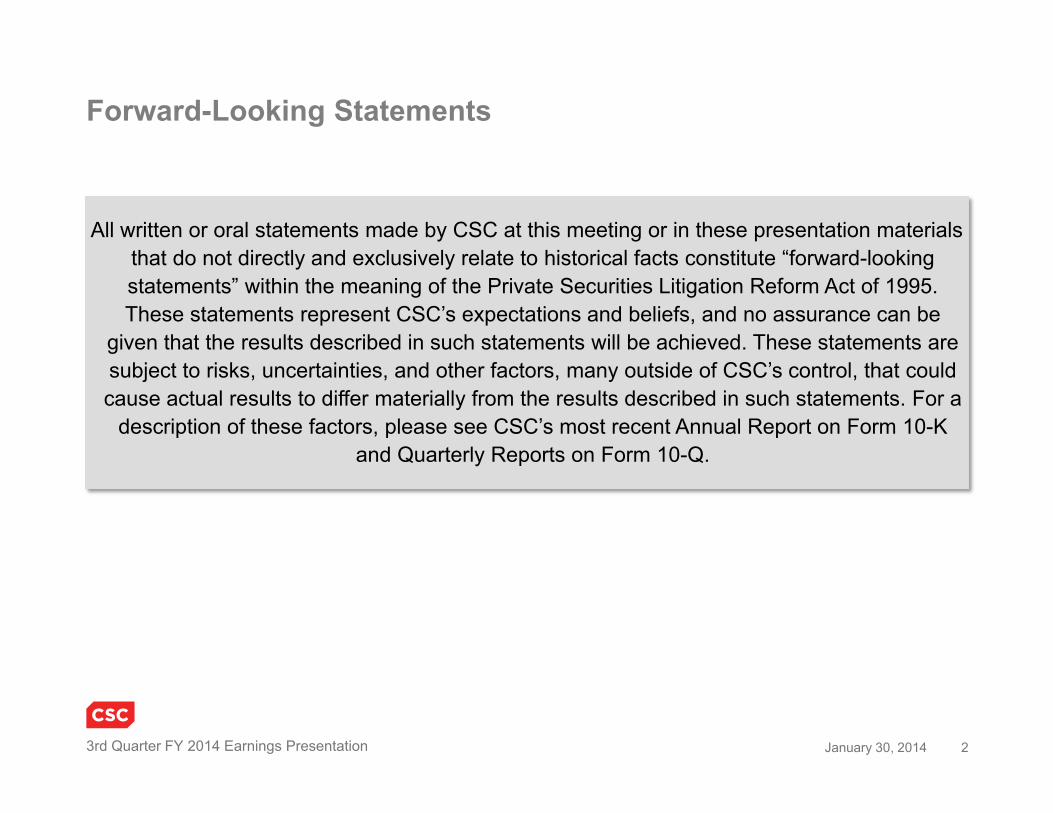
Forward-Looking Statements
All written or oral statements made by CSC at this meeting or in these presentation materials that do not directly and exclusively relate to historical facts constitute “forward-looking statements” within the meaning of the Private Securities Litigation Reform Act of 1995. These statements represent CSC’s expectations and beliefs, and no assurance can be
given that the results described in such statements will be achieved. These statements are subject to risks, uncertainties, and other factors, many outside of CSC’s control, that could cause actual results to differ materially from the results described in such statements. For a
description of these factors, please see CSC’s most recent Annual Report on Form 10-K and Quarterly Reports on Form 10-Q.

33rd Quarter FY 2014 Earnings Presentation January 30, 2014
Non-GAAP Reconciliations
This presentation includes certain non-GAAP financial measures, such as operating income, operating margin, earnings before interest and taxes (EBIT), EBIT margin, free cash flow,
and capital expenditures. These non-GAAP financial measures are not meant to be considered in isolation or as a substitute for results prepared in accordance with
accounting principles generally accepted in the United States (GAAP). A reconciliation of non-GAAP financial measures included in this presentation to the most directly comparable
financial measure calculated and presented in accordance with GAAP accompanies this presentation and is on our website at www.csc.com. CSC management believes that these
non-GAAP financial measures provide useful information to investors regarding the Company’s financial condition and results of operations as they provide another measure of the Company’s profitability and ability to service its debt, and are considered important
measures by financial analysts covering CSC and its peers.

3rd QUARTER FY 2014 EARNINGS PRESENTATION
Mike LawrieChief Executive Officer

53rd Quarter FY 2014 Earnings Presentation January 30, 2014
Sequential growth in the commercial business
Cost takeout continues to drive margin expansion
Repositioning to lead in next-generation IT services
NPS performing in line with expectations
Key Messages
*EPS from Continuing Operations
Raising FY 2014 EPS* target to $3.80 – $3.90

3rd QUARTER FY 2014 EARNINGS PRESENTATION
Paul SalehChief Financial Officer

73rd Quarter FY 2014 Earnings Presentation January 30, 2014
3rd Quarter Results
FY14 FY13 FY14 FY13
Revenue ($M) $ 3,228 $ 3,536 $ 9,669 $ 10,692
Adjusted Growth in cc* (6.9%) (7.5%)
Operating Income ($M) 316 260 963 673
Operating Margin 9.8% 7.4% 10.0% 6.3%
EBIT ($M) 255 197 749 479
EBIT Margin 7.9% 5.6% 7.7% 4.5%
Income from Continuing Operations ($M) 151 114 442 251
EPS from Continuing Operations $ 0.98 $ 0.71 $ 2.83 $ 1.52
Bookings ($B) $ 3.3 $ 2.9 $ 10.3 $ 11.1
Q3 YTD
*Adjusted for divestiture of Australian IT staffing business in FY13

83rd Quarter FY 2014 Earnings Presentation January 30, 2014
$3.5**$4.5
YTD FY13 YTD FY14
$6.1
NPS 30%
GIS36%
GBS34%
Global Business Services (GBS)
Q3 FY14 Q3 FY13
Revenue ($M) $ 1,109 $ 1,220
YoY Growth – GAAP (9.1%)– Adjusted cc* (4.4%)
Operating Income ($M)– As reported 134 101
– Adjusted for restructuring 141 112
Operating Margin % – As reported 12.1% 8.3%– Adjusted for restructuring 12.7% 9.2%
Bookings ($B) $ 2.0 $ 1.2
$3,491 $3,233
YTD FY13 YTD FY14
7.1%*10.9%
YTD FY13 YTD FY14
OI Margin %Revenue ($M) Bookings ($B)Year to DateDecline in cc 7.2%
*
*Adjusted for divestiture of Australian IT staffing business in FY13**Adjusted for two large commercial awards
Two Large
Awards

93rd Quarter FY 2014 Earnings Presentation January 30, 2014
$2.2* $2.4
$0
$1
$2
$3
YTD FY13 YTD FY14
$2.5
Global Infrastructure Services (GIS)
Q3 FY14 Q3 FY13
Revenue ($M) $ 1,154 $ 1,191 YoY Growth – GAAP (3.1%)– cc (2.5%)
Operating Income ($M)– As reported 82 58 – Adjusted for restructuring 86 63 Operating Margin % – As reported 7.1% 4.9%
– Adjusted for restructuring 7.5% 5.3%
Bookings ($B) $ 0.7 $ 1.1
NPS 30%
GIS36%
GBS34%
$3,557 $3,425
YTD FY13 YTD FY14
3.3%
7.6%
YTD FY13 YTD FY14
Decline in cc 3.0% OI Margin %Revenue ($M) Bookings ($B)Year to Date
*Adjusted for one large commercial award
LargeAward

103rd Quarter FY 2014 Earnings Presentation January 30, 2014
$2.5$2.4*
$0$1$1$2$2$3$3$4$4
YTD FY13 YTD FY14
North American Public Sector (NPS)
Q3 FY14 Q3 FY13
Revenue ($M) $ 990 $ 1,157
YoY Growth – GAAP (14.4%)
Operating Income ($M)
– As reported 116 131 – Adjusted for restructuring 116 133
Operating Margin %
– As reported 11.7% 11.3%– Adjusted for restructuring 11.7% 11.5%
Bookings ($B) $ 0.6 $ 0.6
DoD 61%Civil 34%Other 5%
NPS 30%
GBS34%
GIS36%
$3,530$3,095
YTD FY13 YTD FY14
10.4%12.7%
YTD FY13 YTD FY14
Large Renewal
OI Margin %Revenue ($M) Bookings ($B)Year to Date
$3.4
*Adjusted for one large NPS renewal

113rd Quarter FY 2014 Earnings Presentation January 30, 2014
Financial Highlights
($M) Q3 FY14 YTD FY14
Share Repurchases2.4M shares 7.3M shares
$125 $354
Dividends $29 $89
Capital to Shareholders
Cash Flow Performance
($M)
Free Cash Flow $324 $401
Cap Ex — including Capital Leases $221 $658Cap Ex as a % of Revenue 6.8% 6.8%
Q3 FY14 YTD FY14
Liquidity($M) Q3 FY14 Q3 FY13
Cash and Cash Equivalents $2,284 $2,198
Debt-for-Debt Exchanges $40 -

123rd Quarter FY 2014 Earnings Presentation January 30, 2014
~$195M $300M – $325M~$80M
~$120M
COST TAKEOUT• Contract management discipline• Supply chain and procurement• Workforce optimization• Enterprise overhead reduction
REINVESTMENTS• Customer-committed savings• Business transformation
– Enterprise Finance and HR systems– Sales and go-to-market initiatives
• Restructuring
Cost Takeout Update
Q3 FY14
~$415M $500M – $550M
YTD FY14 Target

133rd Quarter FY 2014 Earnings Presentation January 30, 2014
Revenue
EPS from Continuing Operations $3.80 – $3.90
Free Cash Flow ~$600 million
Mid-single-digit decline• Commercial — slightly down• NPS — low-double-digit decline
Summary — FY14 Targets

3rd QUARTER FY 2014 EARNINGS PRESENTATION
Supplemental Information

153rd Quarter FY 2014 Earnings Presentation January 30, 2014
$B FY13 FY14
North American Public SectorNPSGlobal Business ServicesGBS Global Infrastructure ServicesGIS
New Business Bookings
163rd Quarter FY 2014 Earnings Presentation January 30, 2014
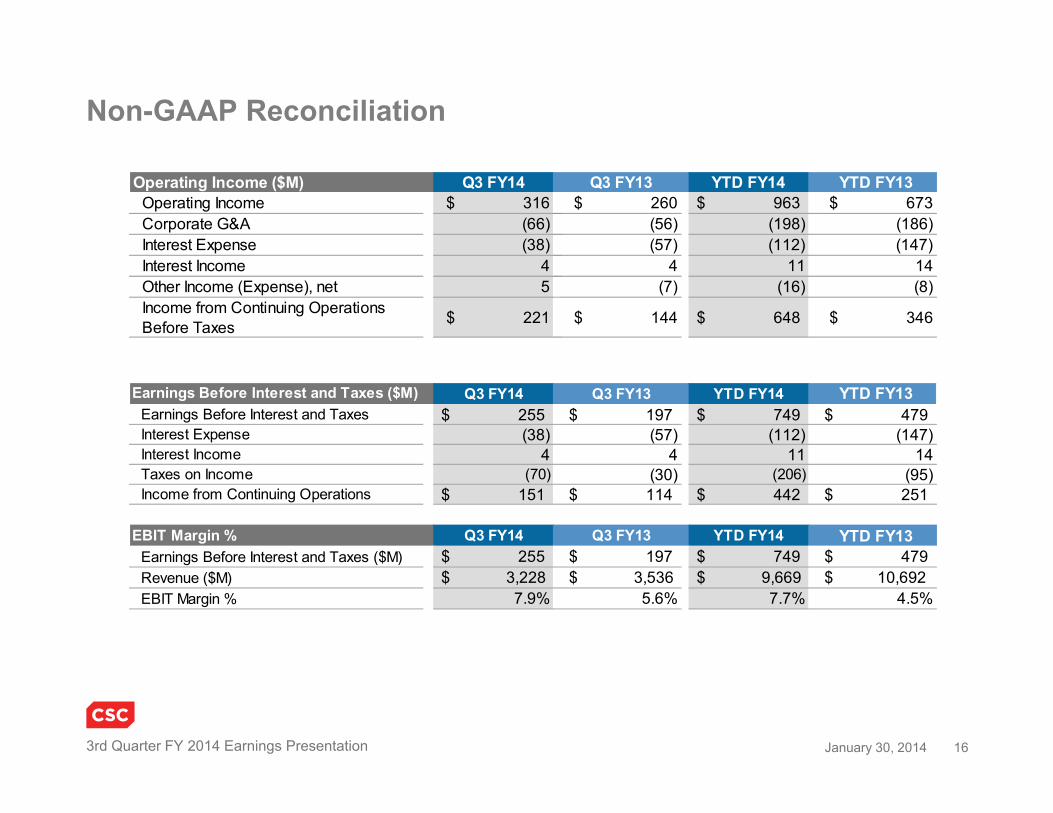
Non-GAAP Reconciliation
Q3 FY14 Q3 FY13 YTD FY14 YTD FY13Earnings Before Interest and Taxes $ 255 $ 197 $ 749 $ 479 Interest Expense (38) (57) (112) (147)Interest Income 4 4 11 14 Taxes on Income (70) (30) (206) (95)Income from Continuing Operations $ 151 $ 114 $ 442 $ 251
Q3 FY14 Q3 FY13 YTD FY14 YTD FY13Earnings Before Interest and Taxes ($M) $ 255 $ 197 $ 749 $ 479 Revenue ($M) $ 3,228 $ 3,536 $ 9,669 $ 10,692 EBIT Margin % 7.9% 5.6% 7.7% 4.5%
Earnings Before Interest and Taxes ($M)
EBIT Margin %
Operating Income ($M) Q3 FY14 Q3 FY13 YTD FY14 YTD FY13Operating Income $ 316 $ 260 $ 963 $ 673 Corporate G&A (66) (56) (198) (186)Interest Expense (38) (57) (112) (147)Interest Income 4 4 11 14 Other Income (Expense), net 5 (7) (16) (8)Income from Continuing Operations Before Taxes $ 221 $ 144 $ 648 $ 346

173rd Quarter FY 2014 Earnings Presentation January 30, 2014
Adjusted Operating Income
$M Operating Income
Restructuring Costs
Adjusted Operating
Income
Adjusted Operating
MarginGBS $ 134 $ 7 $ 141 12.7%GIS 82 4 86 7.5%NPS 116 - 116 11.7%Corporate & Eliminations (16) - (16)Total $ 316 $ 11 $ 327 10.1%
$M Operating Income
Restructuring Costs
Adjusted Operating
Income
Adjusted Operating
MarginGBS $ 101 $ 11 $ 112 9.2%GIS 58 5 63 5.3%NPS 131 2 133 11.5%Corporate & Eliminations (30) 8 (22)Total $ 260 $ 26 $ 286 8.1%
Q3 FY14
Q3 FY13

183rd Quarter FY 2014 Earnings Presentation January 30, 2014
$M Q3 FY14 Q3 FY13Cost of Services (excluding restructuring costs) $ 2,362 $ 2,767 Percentage of Revenue 73.2% 78.2%SG&A (excluding Corp. G&A) 288 215 Percentage of Revenue 8.9% 6.1%Depreciation and Amortization 251 268 Percentage of Revenue 7.8% 7.6%Restructuring Costs 11 26 Percentage of Revenue 0.3% 0.7%Operating Costs 2,912 3,276 Percentage of Revenue 90.2% 92.6%Corporate G&A 66 56 Percentage of Revenue 2.0% 1.6%
Components of Operating Costs
193rd Quarter FY 2014 Earnings Presentation January 30, 2014
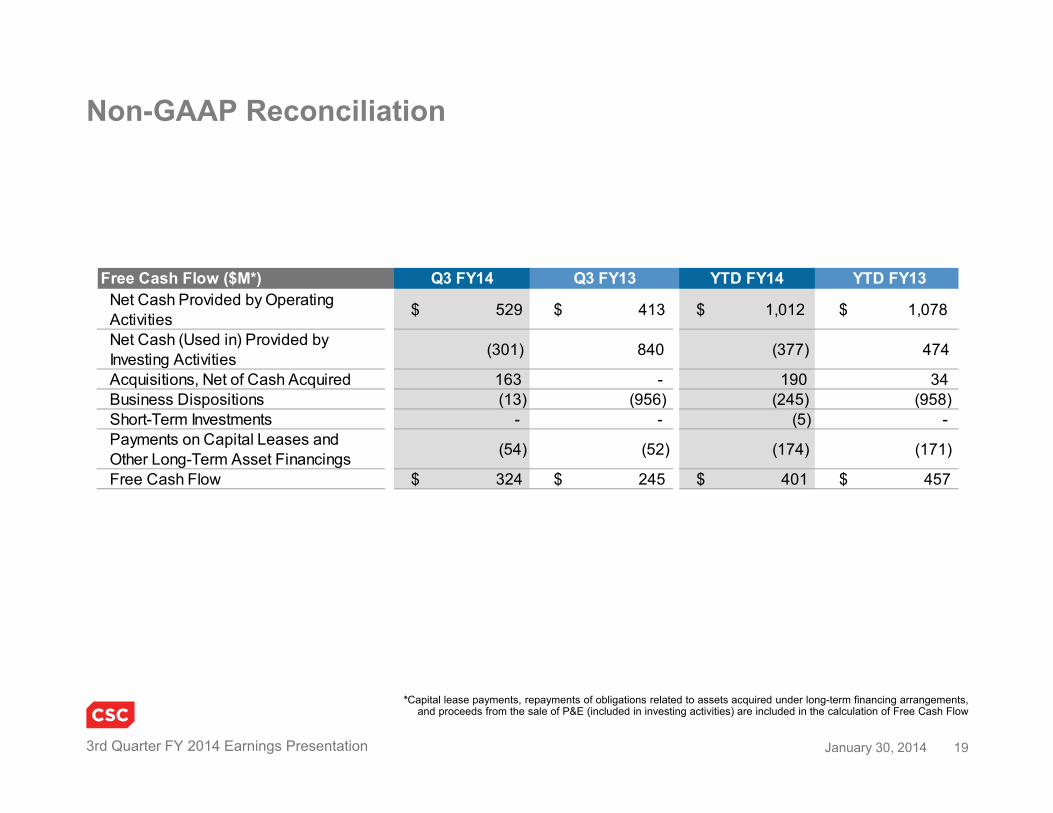
Non-GAAP Reconciliation
*Capital lease payments, repayments of obligations related to assets acquired under long-term financing arrangements, and proceeds from the sale of P&E (included in investing activities) are included in the calculation of Free Cash Flow
Free Cash Flow ($M*) Q3 FY14 Q3 FY13 YTD FY14 YTD FY13Net Cash Provided by Operating Activities $ 529 $ 413 $ 1,012 $ 1,078
Net Cash (Used in) Provided by Investing Activities (301) 840 (377) 474
Acquisitions, Net of Cash Acquired 163 - 190 34 Business Dispositions (13) (956) (245) (958)Short-Term Investments - - (5) - Payments on Capital Leases and Other Long-Term Asset Financings (54) (52) (174) (171)
Free Cash Flow $ 324 $ 245 $ 401 $ 457

203rd Quarter FY 2014 Earnings Presentation January 30, 2014
3rd Quarter Selected Cash Flow Items
$MNet Income $ 146 $ 513 Depreciation and Amortization 251 268 Change in Working Capital 92 301 Loss/(Gain) on Dispositions 3 (700) Other 37 31 Operating Cash Flow 529 413
Capital Expenditures (167) (156) Business Dispositions 13 956 Acquisitions (163) - Other 16 40 Investing Cash Flow (301) 840
Capital Leases and Other Financing (54) (52) Business Dispositions (13) (956) Acquisitions 163 - Free Cash Flow $ 324 $ 245
Q3 FY14 Q3 FY13

213rd Quarter FY 2014 Earnings Presentation January 30, 2014
• Operating Cost: Equal to the sum of (1) cost of services, (2) segment SG&A excluding Corporate G&A, (3) depreciation and amortization, and (4) restructuring costs
• Operating Income: Revenue minus Operating Cost• Operating Income Margin: Operating Income as a percentage of Revenue• Earnings Before Interest and Taxes: Revenue minus cost of services, selling, general and
administrative expenses, depreciation and amortization, restructuring costs, and other income (expense)
• Earnings Before Interest and Taxes Margin: Earnings Before Interest and Taxes as a percentage of Revenue
• Free Cash Flow: Equal to the sum of (1) operating cash flows, (2) investing cash flows, excluding business acquisitions and dispositions, and investments (including short-term investments and purchase or sale of available-for-sale securities), and (3) payments on capital leases and other long-term asset financings
• Capital Expenditures: Equal to sum of net purchases of property, plant, and equipment, outsourcing contracts, and software
Non-GAAP and Other Definitions

3rd QUARTER FY 2014 EARNINGS PRESENTATION
Thank You


![Earnings Presentation for Quarter 3 of FY 2016 for Investors [Company Update]](https://img.pdfslide.us/doc/110x75/577c87a11a28abe054c4c539/earnings-presentation-for-quarter-3-of-fy-2016-for-investors-company-update.jpg)