Embed Size (px)
Citation preview

3rd Quarter 2017 Earnings CallOctober 24, 2017

3rd Quarter 2017 Earnings Call
Forward Looking Statements
All financial and percentage comparisons in this presentation are made to the same quarter of the previous year, unless otherwise stated. This presentation utilizes non-GAAP
measures of performance for comparisons of results for the quarter of 2017 versus the third quarter of 2016 for Carlisle Brake and Friction (“CBF”) segment EBIT and EBIT margin,
consolidated EBIT and EBIT margin, consolidated Income from Continuing Operations and Diluted Earnings per Share from Continuing Operations, all of which are presented to
exclude the third quarter 2016 goodwill and intangible asset impairment charges at CBF. Management believes adjusted results more accurately portray the ongoing operational
performance and fundamentals of the underlying business and present a more useful comparison between current results and results in prior operating periods. Management also
uses the non-GAAP financial measures in making financial, operating and planning decisions and in evaluating the Company’s performance. See the financial exhibits to the third
quarter 2017 earnings release for a reconciliation of these measures to the most directly comparable GAAP measures.
Also, certain ratios related to our Revolving Credit Facility of Earnings before Interest, Income Taxes, Depreciation and Amortization (“EBITDA”), Free Cash Flow, Net Debt, Net Debt
to EBITDA ratio, and Net Debt to Capital Ratio are not measures of financial performance under US GAAP. Our Revolving Credit Agreement allows us to exclude non-cash
impairment charges in the computation of EBITDA. See the appendix to this presentation for a reconciliation of these measures to the most directly comparable GAAP measures.
Throughout the presentation each non-GAAP measure is denoted with an *.
Use of Non-GAAP Financial Measures
This presentation contains forward-looking statements within the meaning of the Private Securities Litigation Reform Act of 1995. Forward-looking statements generally use
words such as “expect,” “foresee,” “anticipate,” “believe,” “project,” “should,” “estimate,” “will,” “plans,” “forecast,” and similar expressions, and reflect our expectations concerning
the future. It is possible that our future performance may differ materially from current expectations expressed in these forward-looking statements, due to a variety of factors
such as: increasing price and product/service competition by foreign and domestic competitors, including new entrants; technological developments and changes; the ability to
continue to introduce competitive new products and services on a timely, cost-effective basis; our mix of products/services; increases in raw material costs which cannot be
recovered in product pricing; domestic and foreign governmental and public policy changes including environmental and industry regulations; threats associated with and efforts
to combat terrorism; protection and validity of patent and other intellectual property rights; the successful integration and identification of our strategic acquisitions; the cyclical
nature of our businesses; and the outcome of pending and future litigation and governmental proceedings. In addition, such statements could be affected by general industry and
market conditions and growth rates, the condition of the financial and credit markets, and general domestic and international economic conditions including interest rate and
currency exchange rate fluctuations. Further, any conflict in the international arena may adversely affect general market conditions and our future performance. We refer you to
the documents we file from time to time with the Securities and Exchange Commission, such as our reports on Form 10-K, Form 10-Q and Form 8-K, for a discussion of these
and other risks and uncertainties that could cause our actual results to differ materially from our current expectations and from the forward-looking statements contained in this
press release. We undertake no obligation to update any forward-looking statement.
2

2017 Q3 Highlights
3rd Quarter 2017 Earnings Call
Financial Summary
($ millions, except per share amounts) Q3 ’17 Q3 ‘16 Δ
Net Sales $1,089.1 $991.0 +9.9%
Income from Continuing
Operations, net of Tax$86.4 -$9.5 +1,009.5%
Adjusted Income from Continuing
Operations, net of Tax*$86.4 $113.1 -23.6%
Diluted EPS $1.37 -$0.15 1,013.3%
Adjusted Diluted EPS* $1.37 $1.74 -21.3%
EBIT $142.9 $36.4 +292.5%
Adjusted EBIT* $142.9 $177.9 -19.6%
Special Items After-Tax on EPS $0.25 $0.03 +733.3%
Free Cash Flow $125.2 $143.8 -12.9%
3
• Record quarterly sales ‒ CCM sales growth above favorable non-
residential market growth rates
‒ CBF experienced strong top-line growth
‒ Acquisition growth of 5.3%
‒ CIT performance exceeded expectations
• Adjusted Income from Continuing
Operations declined 23.6%* to $86.4M‒ Acquisition costs, facility rationalization
and plant restructuring projects pre-tax of
$20M
‒ Rising raw material costs at CCM of $15M
‒ Volume decline at CIT of $6M Announced Acquisition of Accella Performance
Materials for $670M on October 2nd

$991.0
Q3 '16 Volume/Price Acq F/X Q3 '17
3rd Quarter 2017 Earnings Call
2017 Q3 Sales Bridge
Organic by Segment
Construction Materials +7%
Interconnect Technologies -9%
FoodService Products +1%
Fluid Technologies +4%
Brake & Friction +28%
+4.4%
+5.3% +0.2%
4
in $ Millions
$1,089.1

18.0%
13.1%
+1.3% -1.0%+0.7%
+0.3% -4.6%
-1.6%
Q3 '16 Volume/Price Mix COS Acq Raw Materials/ Special Items Q3 '17
3rd Quarter 2017 Earnings Call
2017 Q3 Adjusted EBIT Margin
EBIT: $177.9 Million* EBIT: $142.9 Million
5
Other Operating
Costs

3rd Quarter 2017 Earnings Call
Carlisle Construction Materials
• Q3 Notable Commercial Items:
− U.S. Commercial Roofing up 7.9%
− Global sales up 12%
• EBIT:
− Margin down 340 bps to 19.4%
− Rising raw material costs
− Higher freight costs
− Acquisition costs
− Offset by higher volume and COS savings
6
(in millions)
Three Months Ended September 30,
Acquisition
Effect Price / Volume
Effect Exchange Rate Effect 2017 2016 Change %
Net sales $ 640.2 $ 578.2 10.7 % 2.9 % 7.4% 0.4 %
EBIT $ 124.2 $ 132.0 (5.9 )%
EBIT margin 19.4 % 22.8 %
Special items $ 2.8 $ —

3rd Quarter 2017 Earnings Call
Carlisle Interconnect Technologies
• Q3 Notable Commercial Items:
− Business stabilized in Q3
− Test & Measurement and Medical up double digits
− SatCom ramp in line with expectations
• EBIT:
− Lower sales volume and unfavorable mix
− Facility rationalization and restructuring costs
− Margin decline partially offset by COS
7
Sequentially Revenue up 4% and EBIT margins up 220 bps
(in millions)
Three Months Ended September 30,
Acquisition
Effect Price / Volume
Effect Exchange Rate Effect 2017 2016 Change %
Net sales $ 210.8 $ 218.2 (3.4 )% 5.8 % (9.2 )% — %
EBIT $ 25.7 $ 42.2 (39.1 )%
EBIT margin 12.2 % 19.3 %
Special items $ 4.2 $ 2.4

3rd Quarter 2017 Earnings Call
Carlisle FoodService Products
8
• Q3 Notable Commercial Items:
‒ 9th consecutive quarter of year-over-year organic sales growth
‒ San Jamar added $22.9M
• EBIT:
‒ San Jamar contributed $2.8M including $3.0M of amortization expense
‒ Margin decline partially offset by COS
• Integration of San Jamar on track
(in millions)
Three Months Ended September 30,
Acquisition
Effect Price / Volume
Effect Exchange Rate Effect 2017 2016 Change %
Net sales $ 86.7 $ 63.0 37.6 % 36.4 % 1.2% — %
EBIT $ 11.6 $ 9.0 28.9 %
EBIT margin 13.4 % 14.3 %

3rd Quarter 2017 Earnings Call
Carlisle Fluid Technologies
• Q3 Notable Commercial Items:
− Americas and EMEA up high single digits
− Systems sales down high single digits due to timing in Asia Pacific
• EBIT:
− Restructuring and Footprint Rationalization charges
− Continued investments to support global growth strategy
− Margin decline partially offset by COS
• Announced appointment of Shelley Bausch to President
9
(in millions)
Three Months Ended September 30,
Acquisition
Effect Price / Volume
Effect Exchange Rate Effect 2017 2016 Change %
Net sales $ 70.9 $ 69.0 2.8 % — % 3.8% (1.0 )%
EBIT $ 0.1 $ 9.5 (98.9 )%
EBIT margin 0.1 % 13.8 %
Special items $ 8.1 $ —

3rd Quarter 2017 Earnings Call
Carlisle Brake & Friction
• Q3 Notable Commercial Items:
− Construction up 37.4%
− Mining up 52.9%
− Agriculture up 31.9%
− Aircraft down 6.4%
• EBIT:
− Footprint rationalization continues
• Optimistic bottom of cycle has been reached
10
(in millions)
Three Months Ended September 30,
Acquisition
Effect Price / Volume
Effect Exchange Rate Effect 2017 2016 Change %
Net sales $ 80.5 $ 62.6 28.6 % — % 27.7% 0.9 %
EBIT $ 1.2 $ (141.3 ) 100.8 %
Adjusted EBIT $ 1.2 $ 0.2
EBIT margin 1.5 % (225.7 )%
Adjusted EBIT margin 1.5 % 0.3 %
Special items $ 1.0 $ —

2017 Special Items – Pre-Tax
3rd Quarter 2017 Earnings Call11
Restructuring, Facility Rationalization and Other Acquisition Related Costs
$ millions Q1 Q2 Q3 Q4 Forecast2017 FY
Forecast
CCM $0.6 $0.3 $2.8 ~$0.0 ~$3-4
CIT $4.3 $5.6 $4.2 ~$3-4 ~$17-18
CFS $3.7 $0.5 $0.0 $0.0 ~$4
CFT $0.5 $0.5 $8.1 ~$3-4 ~$12-13
CBF $0.3 $1.7 $1.0 ~$1-2 ~$4-5
CORP $1.3 $0.4 $4.0 ~$0-1 ~$5-6
TOTAL $10.7 $9.0 $20.1 ~$7-10 ~$45-50

3rd Quarter 2017 Earnings Call
Focused on Capital Structure Optimization as of 9/30/17
• Cash on Hand of $147.6M
• $815M available under revolver
• $69.0M capital returned YTD to
shareholders in quarterly dividends
• Repurchased $266M of shares YTD
• Currently 2.1M in additional share
buybacks authorized
• Net Debt to Cap ratio of 21%*
• Net Debt to EBITDA of 1.1x*
• EBITDA to Interest of 24.1x*2020 2022
Senior
Note
$250M
5.125%
Senior
Note
$350M
3.75%
Debt Maturity Schedule
12
3rd Quarter 2017 Earnings Call
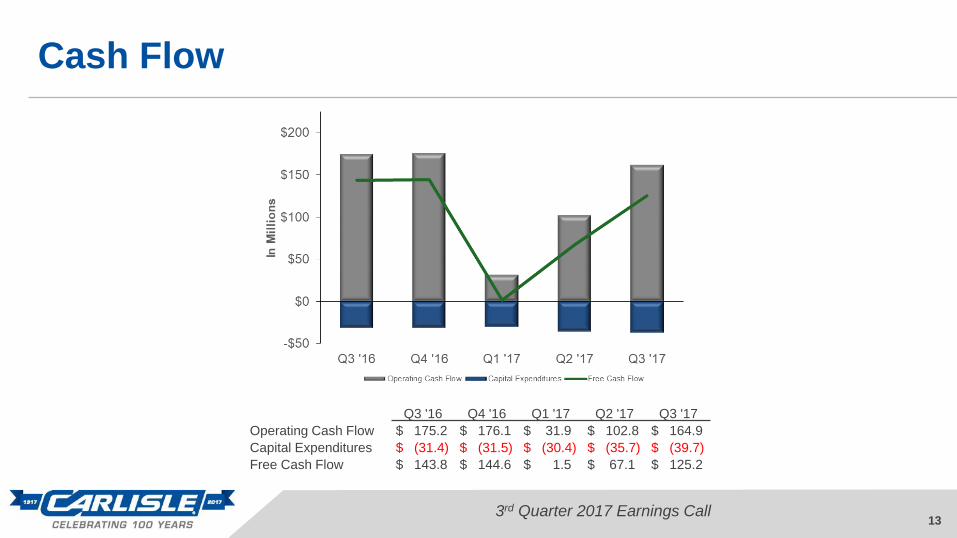
Cash Flow
13
Q3 '16 Q4 '16 Q1 '17 Q2 '17 Q3 '17
Operating Cash Flow $ 175.2 $ 176.1 $ 31.9 $ 102.8 $ 164.9
Capital Expenditures $ (31.4) $ (31.5) $ (30.4) $ (35.7) $ (39.7)
Free Cash Flow $ 143.8 $ 144.6 $ 1.5 $ 67.1 $ 125.2

2017 Outlook
3rd Quarter 2017 Earnings Call14
• Total sales growth of high single digits
‒ CCM: up high single digits
‒ CIT: down low to mid-single digits
‒ CFS: up approximately 40%, inclusive
of San Jamar
‒ CFT: up mid-single digits
‒ CBF: up mid-teens
• Corporate Expense ~$70M
• Depreciation & Amortization
~$160M
• Capital Expenditures ~$150M
• Free cash flow conversion ~100%
• Interest Expense ~$28M
• Tax rate ~34%

Q&A
15

Appendix
16

3rd Quarter 2017 Earnings Call
Reconciliation of GAAP to Non-GAAP Measures
17
Net Debt to Capital RatioLeverage Ratios under Credit Agreement
($ in Millions except for Ratios) LTM 9/30/2017
Net income $327
Income tax expense (continuing and discontinued) 159
Interest expense 28
Depreciation and amortization 157
Non-cash stock based compensation expense 12
Acquisition - San Jamar 6
Non-cash goodwill impairment -
EBITDA per Revolving Credit Agreement $689
Short term debt including current maturities $0
Long term debt 785
Total Debt $785
Less: Cash in excess of $151 -
Debt per Revolving Credit Agreement 785
Net Debt to EBITDA 1.1 x
EBITDA to Interest 24.1 x
1 If the outstanding balance on the revolving credit facility is $0, Cash in excess of $15 million is deducted from Debt.
$185 million outstanding on 9/30/17.
($ in Millions except for Ratios) Capital
Total Debt $785 Net Debt 637
Less: Cash 148 Total shareholders' equity 2,436
Net Debt 637 Total Capital (Net of Cash) 3,073
Net Debt to Capital 21%