Embed Size (px)
Citation preview

3Q2011 Results
Baoshan Iron & Steel Co.,Ltd.
October 2011
The following presentation distributed herewith includes forward-looking statements. All statements, other than statements of historical facts, that address activities, events
or developments that Baoshan Iron & Steel Co.,Ltd.(Baosteel) expects or anticipates will or may occur in the future are forward-looking statements.
Baosteel’s actual results or developments may differ materially from those indicated by these forward-looking statements as a result of various factors and uncertainties, including but not limited to price fluctuations, actual demand, exchange rate fluctuations, competition and other risks and factors beyond our control.
Disclaimer
I. Operation Results
II. Industry Dynamics
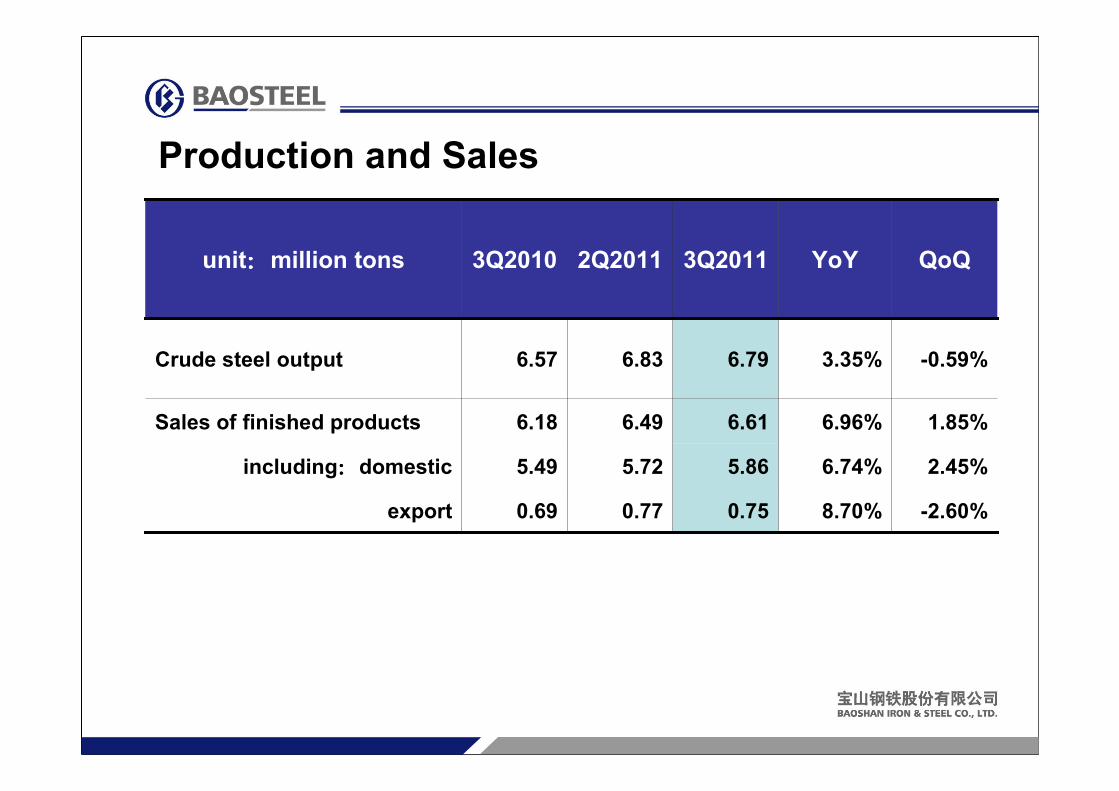
Production and Sales
unit::::million tons 3Q2010 2Q2011 3Q2011 YoY QoQ
Crude steel output 6.57 6.83 6.79 3.35% -0.59%
Sales of finished products 6.18 6.49 6.61 6.96% 1.85%
including::::domestic 5.49 5.72 5.86 6.74% 2.45%
export 0.69 0.77 0.75 8.70% -2.60%
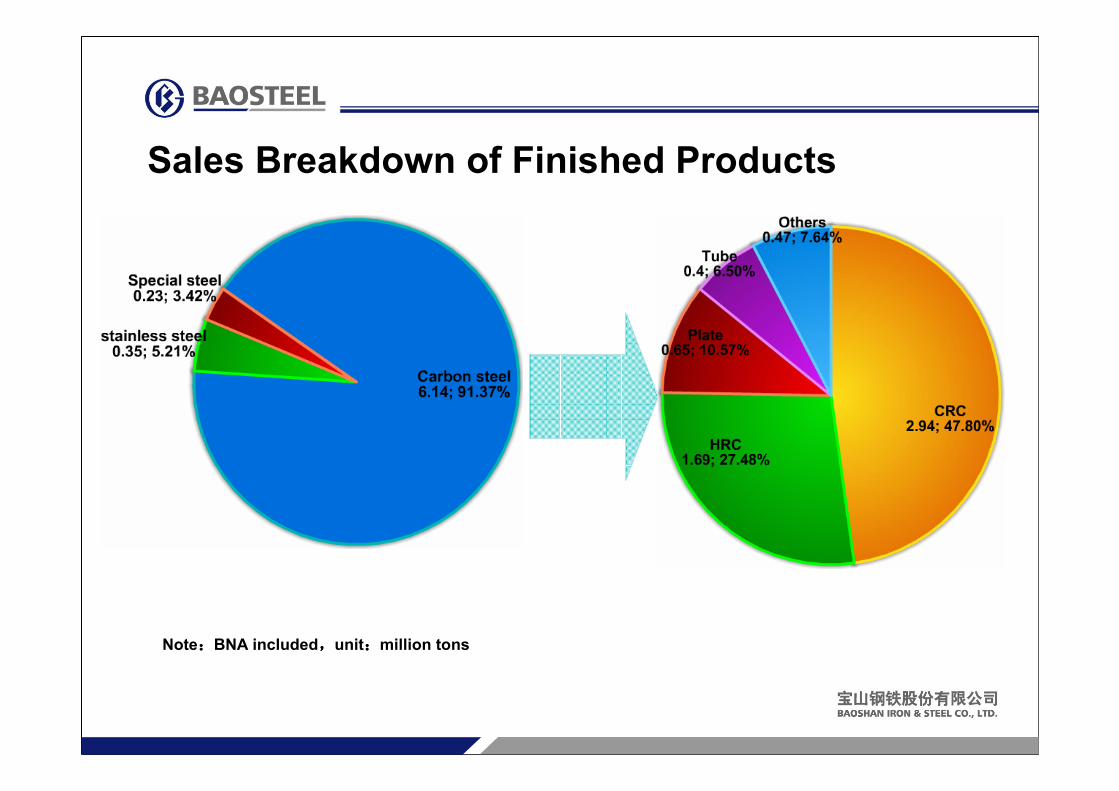
Sales Breakdown of Finished Products
Note::::BNA included,,,,unit::::million tons
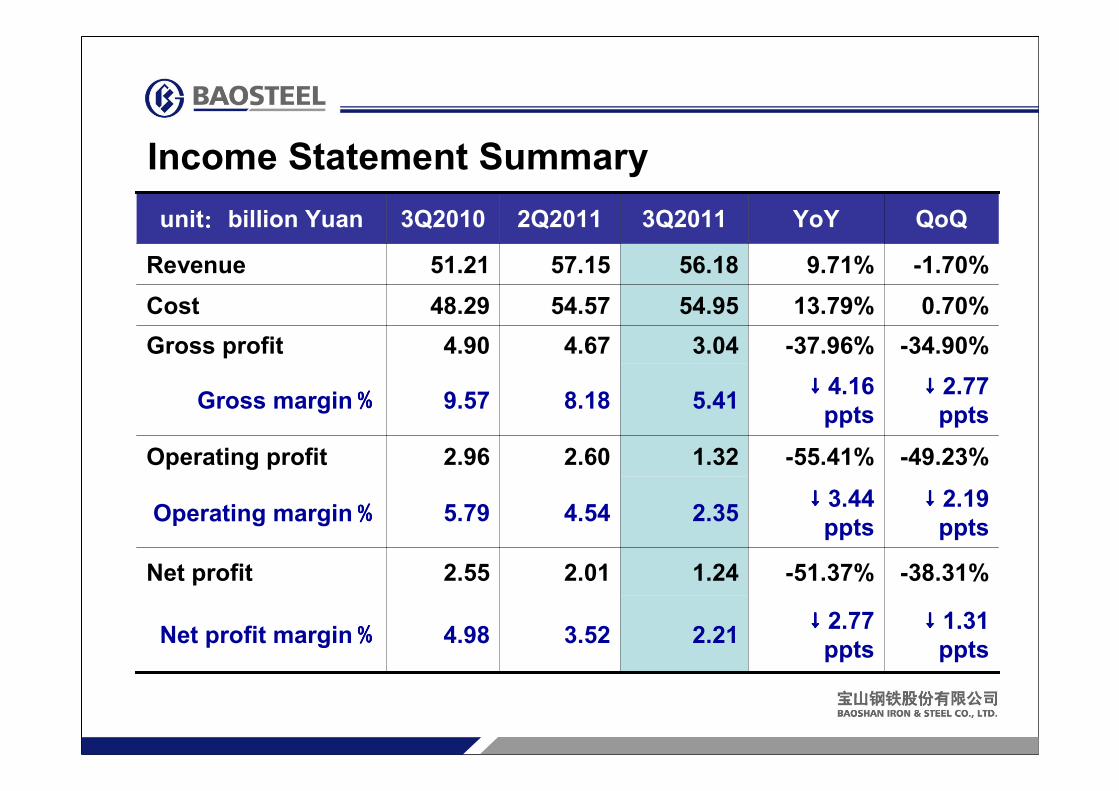
Income Statement Summary
unit::::billion Yuan 3Q2010 2Q2011 3Q2011 YoY QoQ
Revenue 51.21 57.15 56.18 9.71% -1.70%
Cost 48.29 54.57 54.95 13.79% 0.70%
Gross profit 4.90 4.67 3.04 -37.96% -34.90%
Gross margin%%%% 9.57 8.18 5.41↓↓↓↓4.16
ppts
↓↓↓↓2.77
ppts
Operating profit 2.96 2.60 1.32 -55.41% -49.23%
Operating margin%%%% 5.79 4.54 2.35↓↓↓↓3.44
ppts
↓↓↓↓2.19
ppts
Net profit 2.55 2.01 1.24 -51.37% -38.31%
Net profit margin%%%% 4.98 3.52 2.21↓↓↓↓2.77
ppts
↓↓↓↓1.31
ppts
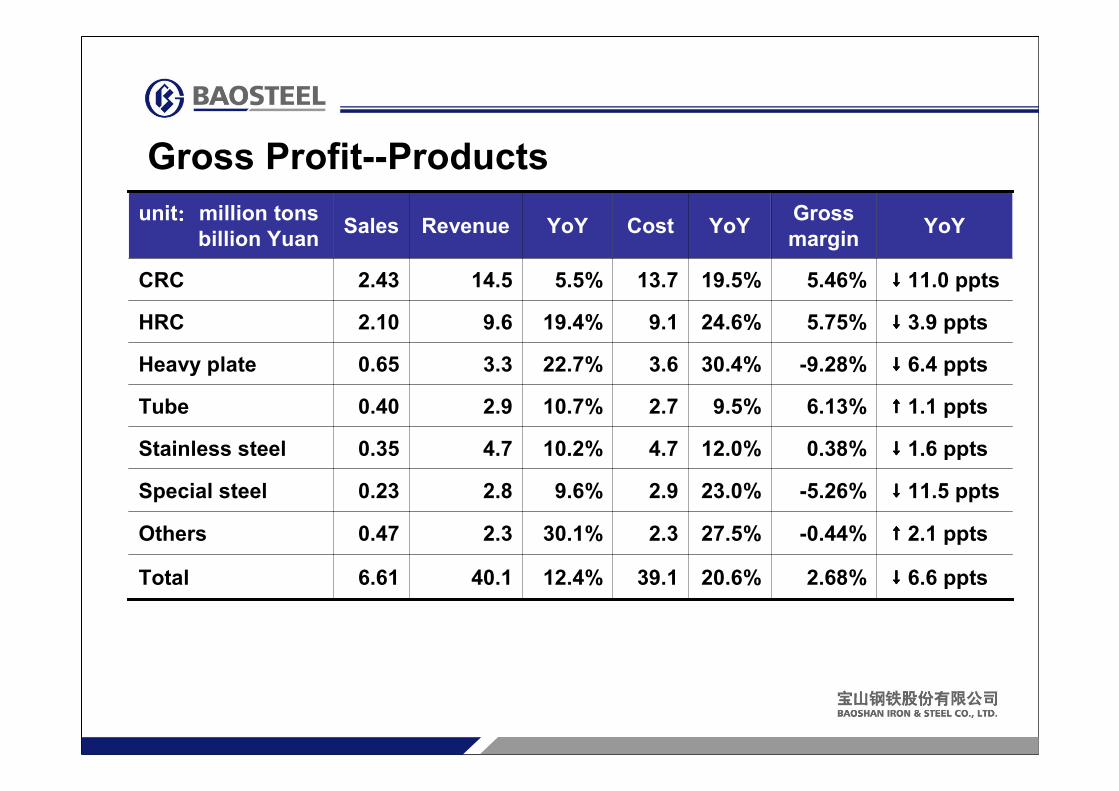
unit::::million tons
billion YuanSales Revenue YoY Cost YoY
Gross
marginYoY
CRC 2.43 14.5 5.5% 13.7 19.5% 5.46% ↓↓↓↓11.0 ppts
HRC 2.10 9.6 19.4% 9.1 24.6% 5.75% ↓↓↓↓3.9 ppts
Heavy plate 0.65 3.3 22.7% 3.6 30.4% -9.28% ↓↓↓↓6.4 ppts
Tube 0.40 2.9 10.7% 2.7 9.5% 6.13% ↑↑↑↑1.1 ppts
Stainless steel 0.35 4.7 10.2% 4.7 12.0% 0.38% ↓↓↓↓1.6 ppts
Special steel 0.23 2.8 9.6% 2.9 23.0% -5.26% ↓↓↓↓11.5 ppts
Others 0.47 2.3 30.1% 2.3 27.5% -0.44% ↑↑↑↑2.1 ppts
Total 6.61 40.1 12.4% 39.1 20.6% 2.68% ↓↓↓↓6.6 ppts
Gross Profit--Products
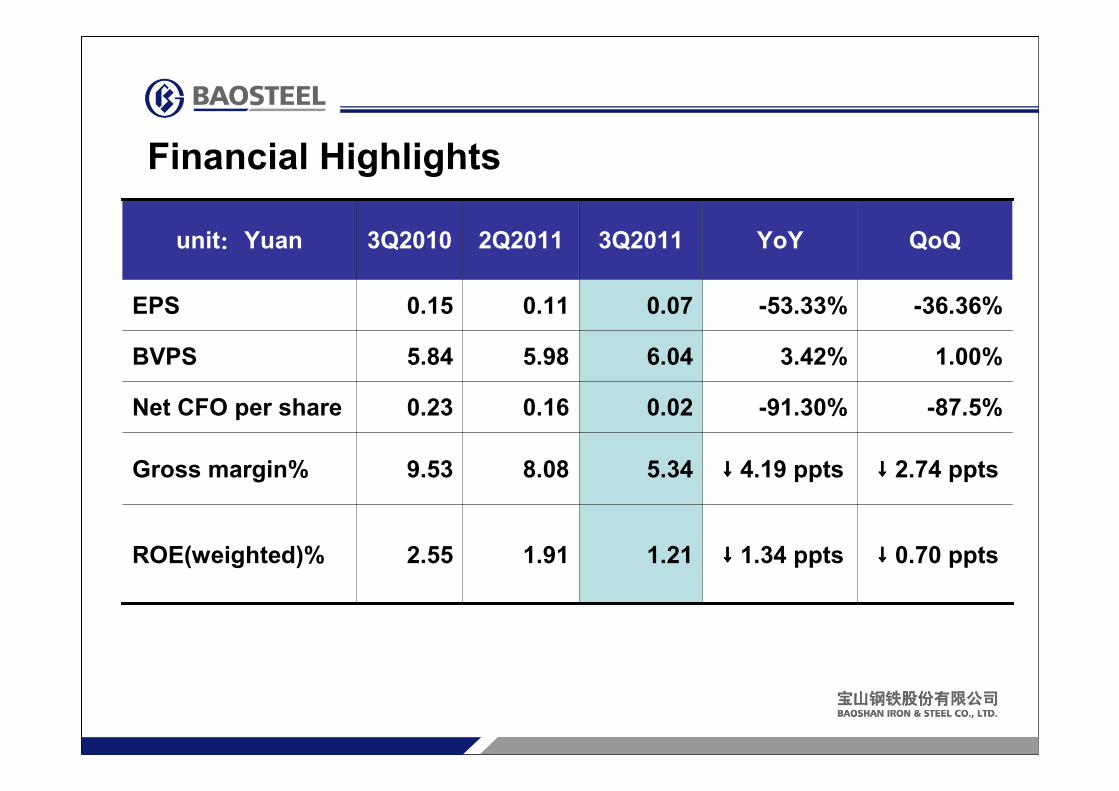
unit::::Yuan 3Q2010 2Q2011 3Q2011 YoY QoQ
EPS 0.15 0.11 0.07 -53.33% -36.36%
BVPS 5.84 5.98 6.04 3.42% 1.00%
Net CFO per share 0.23 0.16 0.02 -91.30% -87.5%
Gross margin% 9.53 8.08 5.34 ↓↓↓↓4.19 ppts ↓↓↓↓2.74 ppts
ROE(weighted)% 2.55 1.91 1.21 ↓↓↓↓1.34 ppts ↓↓↓↓0.70 ppts
Financial Highlights
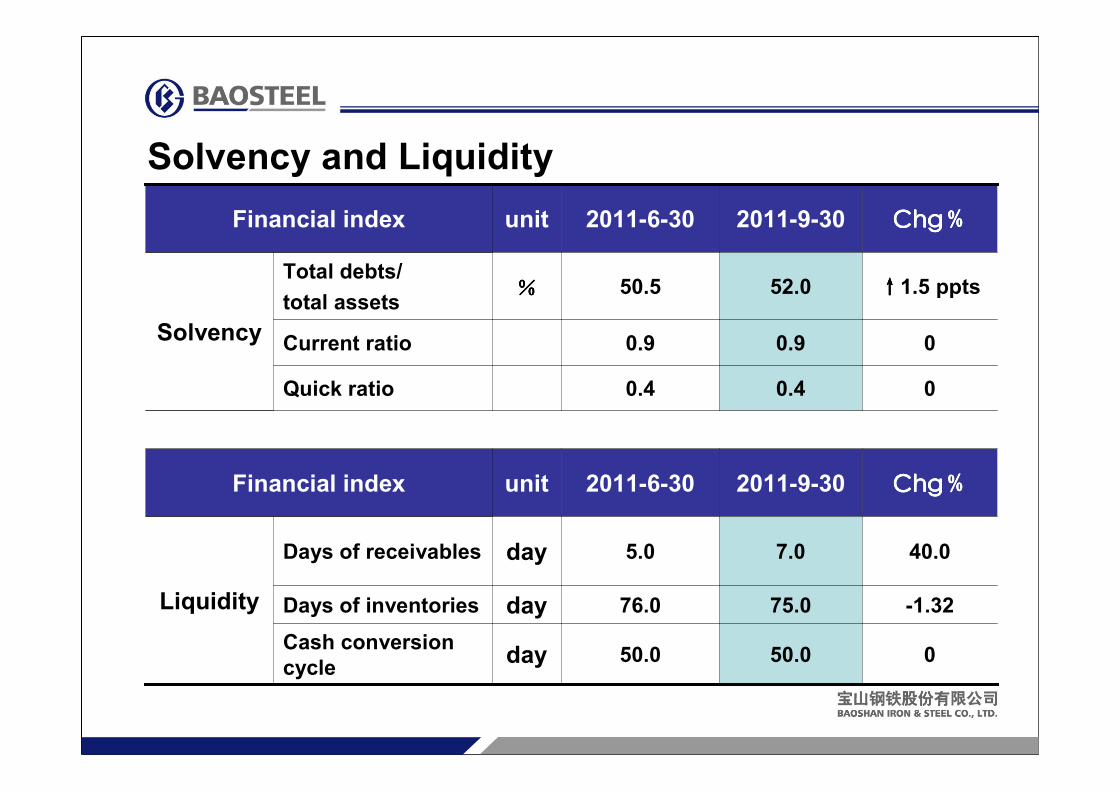
Financial index unit 2011-6-30 2011-9-30 ChgChgChgChg%%%%
Solvency
Total debts/
total assets%%%% 50.5 52.0 ↑↑↑↑1.5 ppts
Current ratio 0.9 0.9 0
Quick ratio 0.4 0.4 0
Financial index unit 2011-6-30 2011-9-30 ChgChgChgChg%%%%
Liquidity
Days of receivables day 5.0 7.0 40.0
Days of inventories day 76.0 75.0 -1.32
Cash conversion
cycleday 50.0 50.0 0
Solvency and Liquidity
I. Operation Results
II. Industry Dynamics
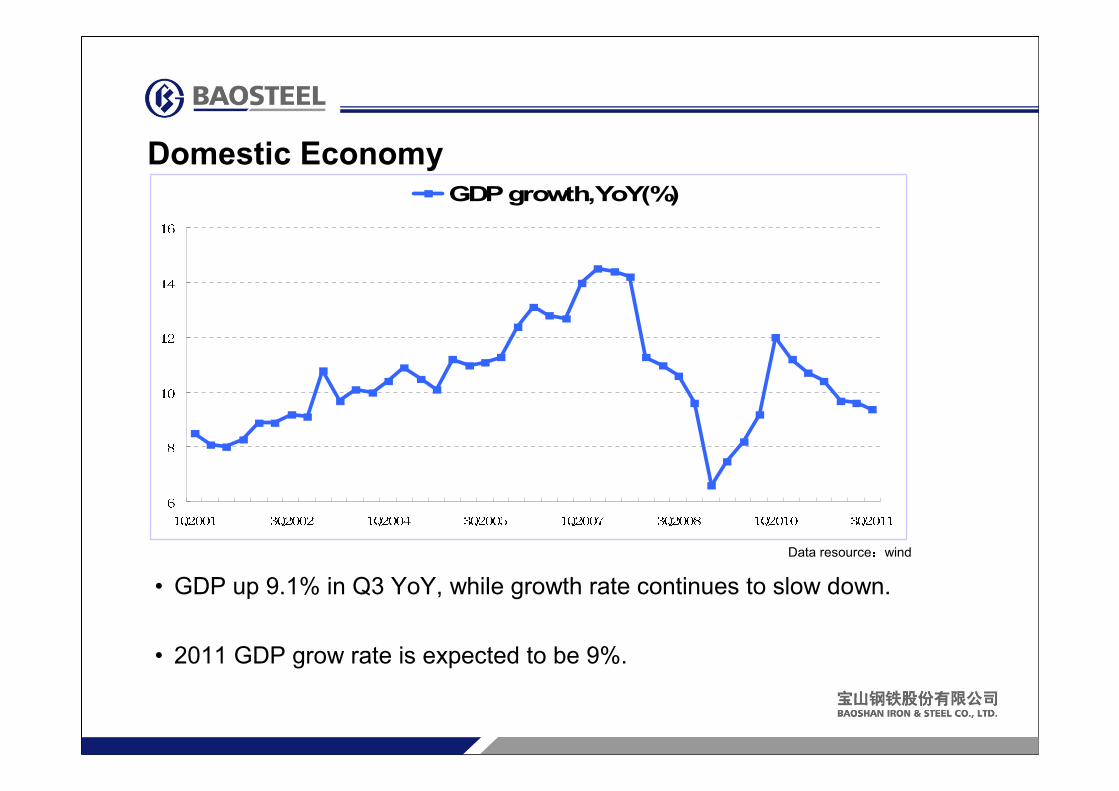
Domestic Economy
• GDP up 9.1% in Q3 YoY, while growth rate continues to slow down.
• 2011 GDP grow rate is expected to be 9%.
Data resource:wind
6810121416
1Q2001 3Q2002 1Q2004 3Q2005 1Q2007 3Q2008 1Q2010 3Q2011
GDP growth,YoY(%)
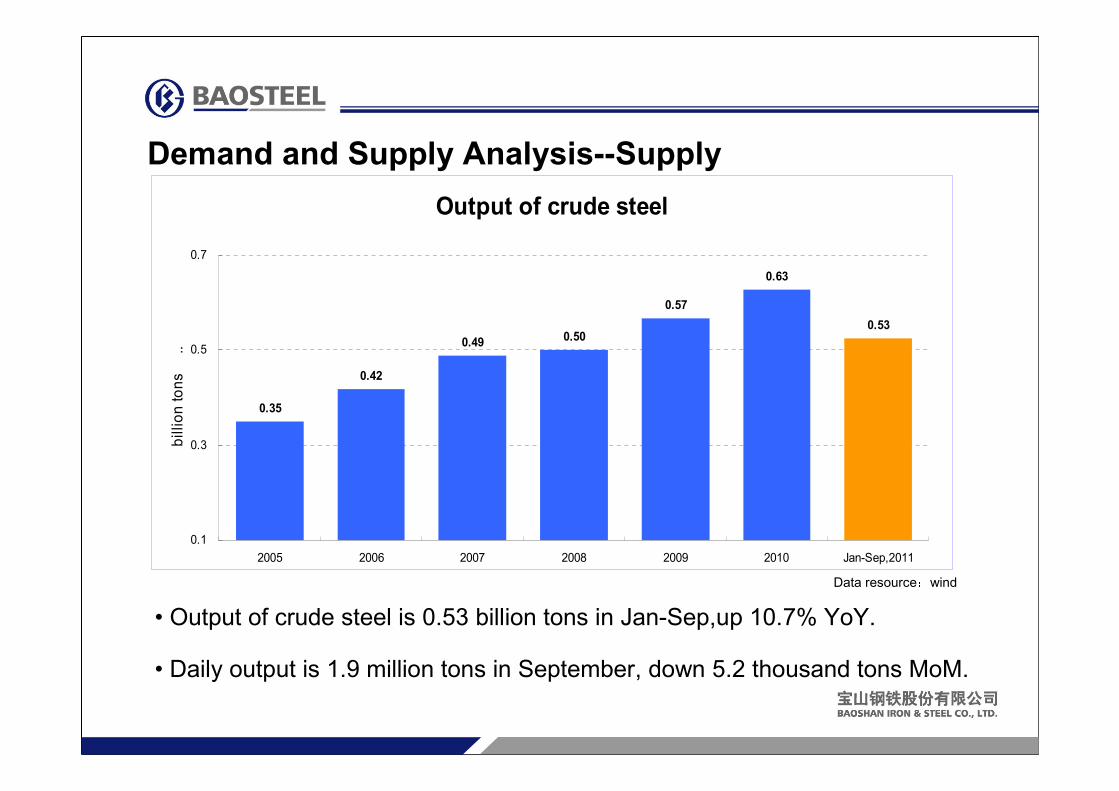
Demand and Supply Analysis--Supply
• Output of crude steel is 0.53 billion tons in Jan-Sep,up 10.7% YoY.
• Daily output is 1.9 million tons in September, down 5.2 thousand tons MoM.
Data resource:wind
Output of crude steel
0.35
0.42
0.49 0.50
0.57
0.63
0.53
0.1
0.3
0.5
0.7
2005 2006 2007 2008 2009 2010 Jan-Sep,2011
billion tons ..
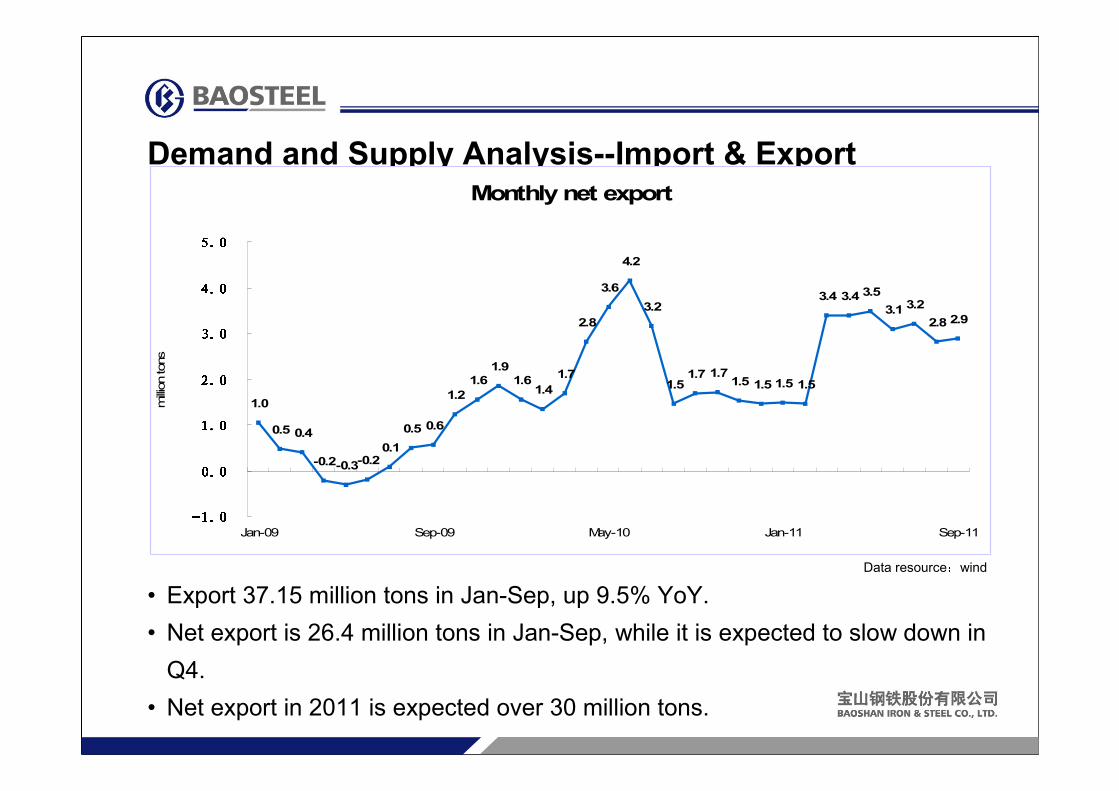
Demand and Supply Analysis--Import & Export
• Export 37.15 million tons in Jan-Sep, up 9.5% YoY.
• Net export is 26.4 million tons in Jan-Sep, while it is expected to slow down in
Q4.
• Net export in 2011 is expected over 30 million tons.
Data resource:wind
Monthly net export
1.0
0.5 0.4
-0.2-0.3-0.20.1
0.5 0.6
1.2
1.6
1.9
1.61.4
1.7
2.8
3.6
4.2
3.2
1.51.7 1.7
1.5 1.5 1.5 1.5
3.4 3.4 3.5
3.1 3.2
2.8 2.9
-1.0-1.0-1.0-1.00.00.00.00.01.01.01.01.02.02.02.02.03.03.03.03.04.04.04.04.05.05.05.05.0
Jan-09 Sep-09 May-10 Jan-11 Sep-11
million tons ..
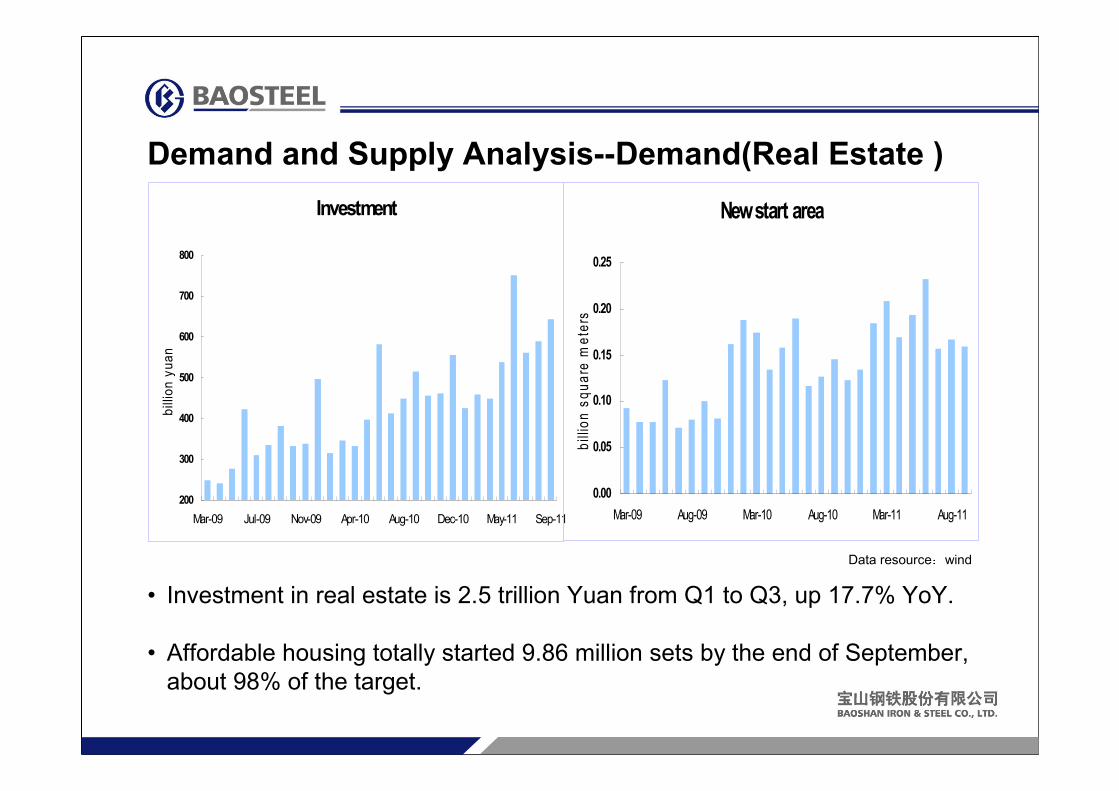
Demand and Supply Analysis--Demand(Real Estate )
• Investment in real estate is 2.5 trillion Yuan from Q1 to Q3, up 17.7% YoY.
• Affordable housing totally started 9.86 million sets by the end of September,
about 98% of the target.
Data resource:wind
New start area
0.00
0.05
0.10
0.15
0.20
0.25
Mar-09 Aug-09 Mar-10 Aug-10 Mar-11 Aug-11
billion s
quare
mete
rs ...
Investment
200
300
400
500
600
700
800
Mar-09 Jul-09 Nov-09 Apr-10 Aug-10 Dec-10 May-11 Sep-11
billio
n yuan ..
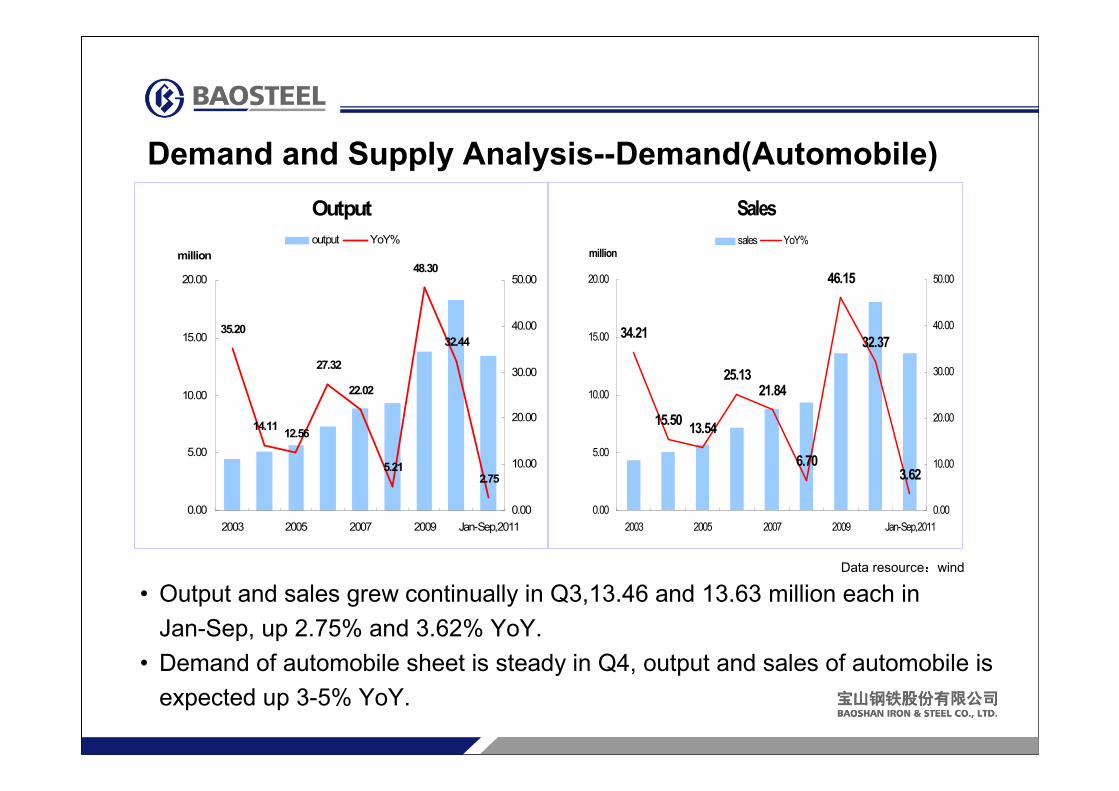
Demand and Supply Analysis--Demand(Automobile)
• Output and sales grew continually in Q3,13.46 and 13.63 million each in
Jan-Sep, up 2.75% and 3.62% YoY.
• Demand of automobile sheet is steady in Q4, output and sales of automobile is
expected up 3-5% YoY.
Data resource:wind
Output
35.20
14.1112.56
27.32
22.02
5.21
48.30
32.44
2.75
0.00
5.00
10.00
15.00
20.00
2003 2005 2007 2009 Jan-Sep,2011
million
0.00
10.00
20.00
30.00
40.00
50.00
output YoY%
Sales
34.21
15.5013.54
25.1321.84
6.70
46.15
32.37
3.62
0.00
5.00
10.00
15.00
20.00
2003 2005 2007 2009 Jan-Sep,2011
million
0.00
10.00
20.00
30.00
40.00
50.00
sales YoY%
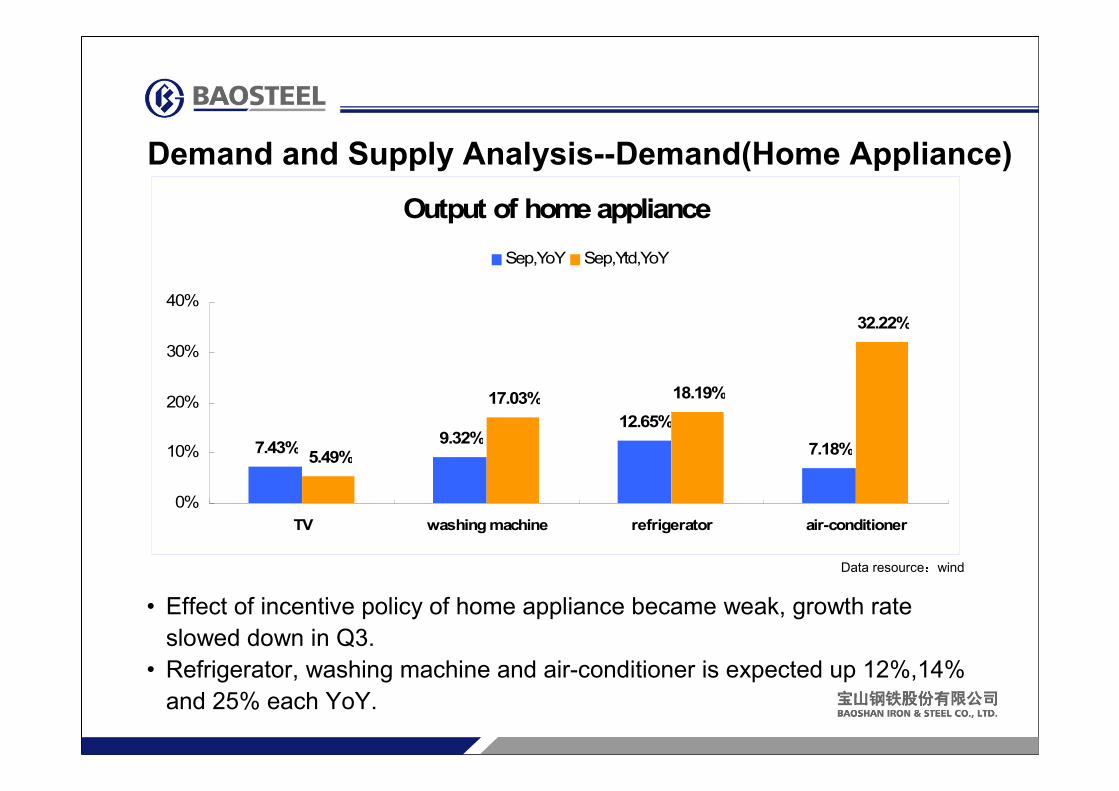
Demand and Supply Analysis--Demand(Home Appliance)
• Effect of incentive policy of home appliance became weak, growth rate
slowed down in Q3.
• Refrigerator, washing machine and air-conditioner is expected up 12%,14%
and 25% each YoY.
Data resource:wind
Output of home appliance
7.43%9.32%
12.65%
7.18%5.49%
17.03% 18.19%
32.22%
0%
10%
20%
30%
40%
TV washing machine refrigerator air-conditioner
Sep,YoY Sep,Ytd,YoY
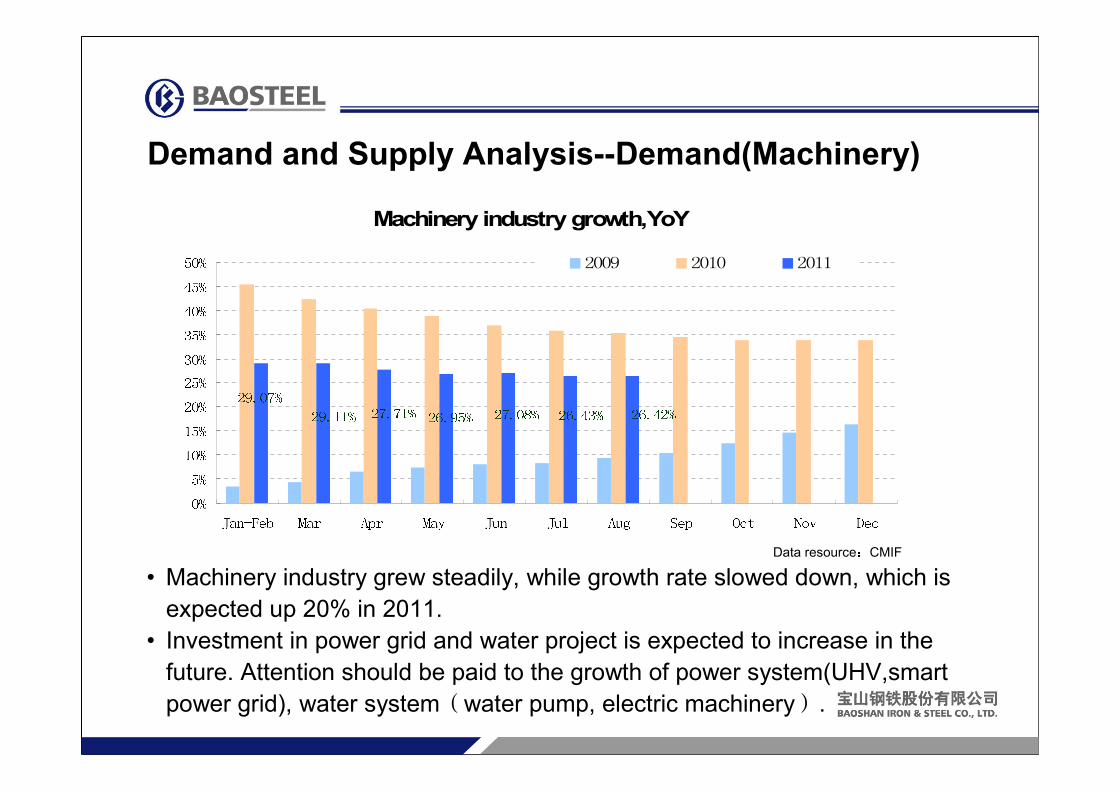
Demand and Supply Analysis--Demand(Machinery)
• Machinery industry grew steadily, while growth rate slowed down, which is
expected up 20% in 2011.
• Investment in power grid and water project is expected to increase in the
future. Attention should be paid to the growth of power system(UHV,smart
power grid), water system(water pump, electric machinery).
Data resource:CMIF
Machinery industry growth,YoY
26.42%26.43%27.08%26.95%27.71%29.11%29.07%0%5%10%15%20%25%30%35%40%45%50%
Jan-Feb Mar Apr May Jun Jul Aug Sep Oct Nov Dec
2009 2010 2011
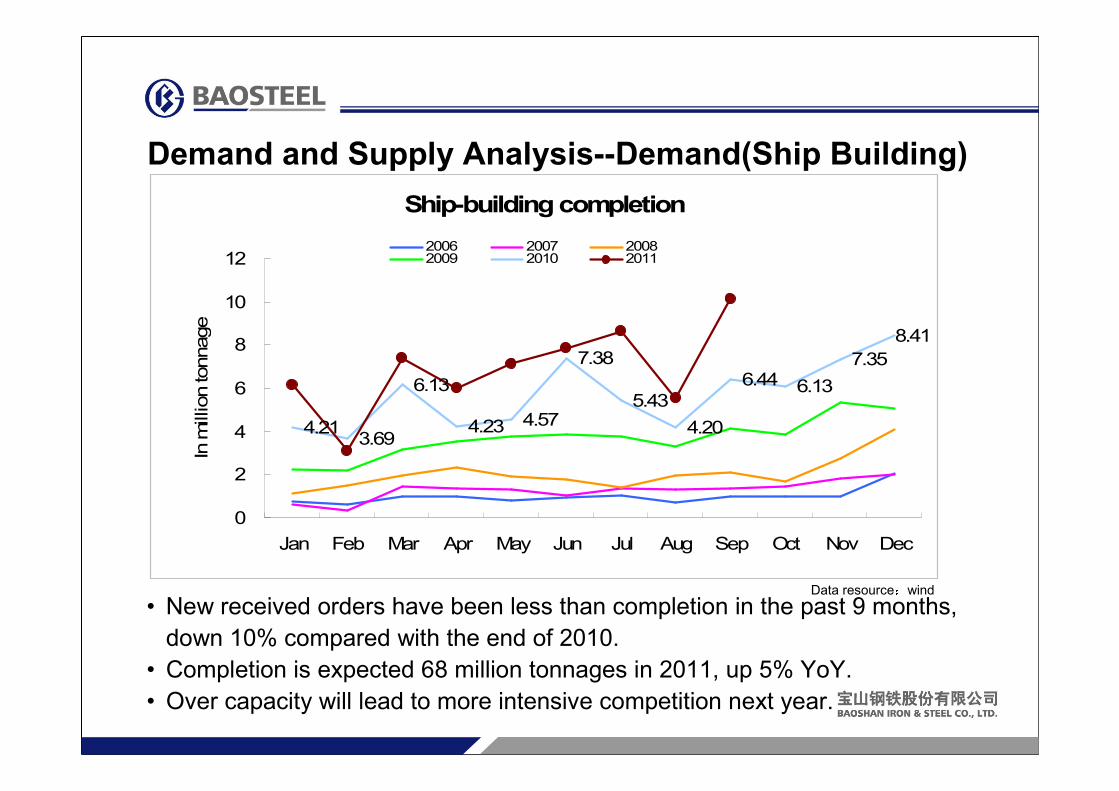
Demand and Supply Analysis--Demand(Ship Building)
• New received orders have been less than completion in the past 9 months,
down 10% compared with the end of 2010.
• Completion is expected 68 million tonnages in 2011, up 5% YoY.
• Over capacity will lead to more intensive competition next year.
Data resource:wind
Ship-building completion
8.41
7.35
6.136.44
4.20
5.43
7.38
4.574.23
6.13
3.694.21
0
2
4
6
8
10
12
Jan Feb Mar Apr May Jun Jul Aug Sep Oct Nov Dec
In million tonnage ....
2006 2007 20082009 2010 2011
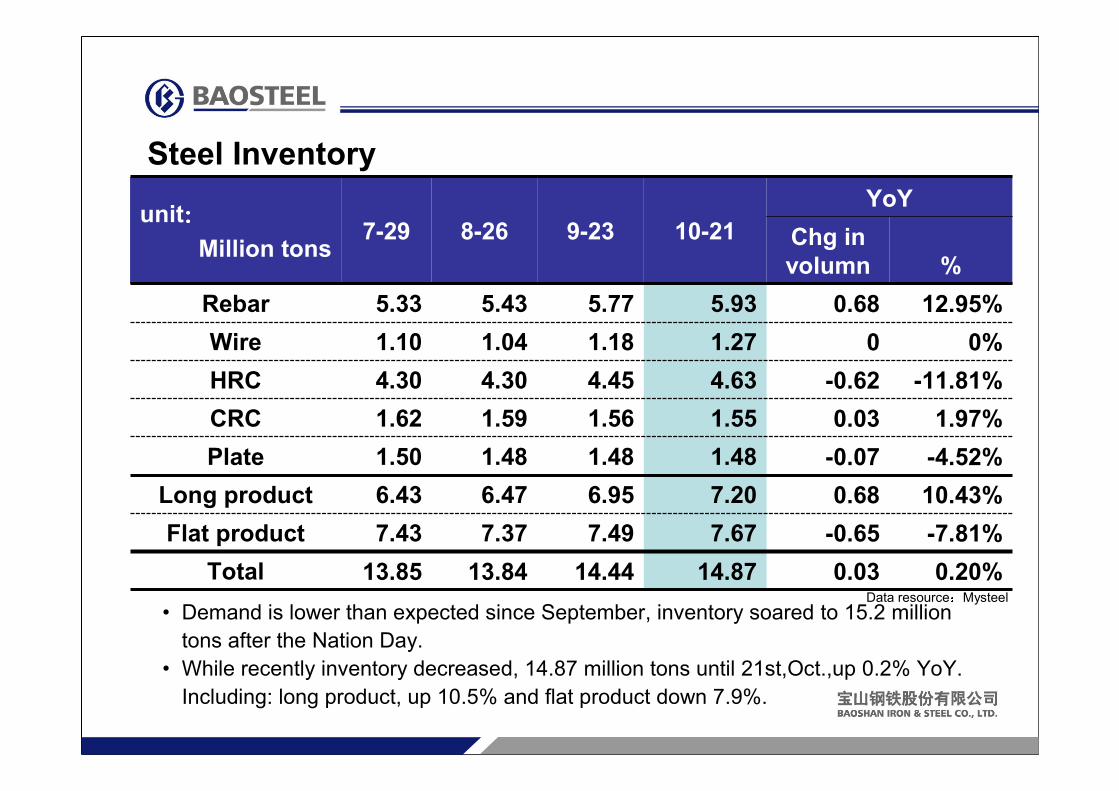
Steel Inventory
• Demand is lower than expected since September, inventory soared to 15.2 million
tons after the Nation Day.
• While recently inventory decreased, 14.87 million tons until 21st,Oct.,up 0.2% YoY.
Including: long product, up 10.5% and flat product down 7.9%.
unit::::
Million tons7-29 8-26 9-23 10-21
YoY
Chg in
volumn %
Rebar 5.33 5.43 5.77 5.93 0.68 12.95%
Wire 1.10 1.04 1.18 1.27 0 0%
HRC 4.30 4.30 4.45 4.63 -0.62 -11.81%
CRC 1.62 1.59 1.56 1.55 0.03 1.97%
Plate 1.50 1.48 1.48 1.48 -0.07 -4.52%
Long product 6.43 6.47 6.95 7.20 0.68 10.43%
Flat product 7.43 7.37 7.49 7.67 -0.65 -7.81%
Total 13.85 13.84 14.44 14.87 0.03 0.20%Data resource:Mysteel
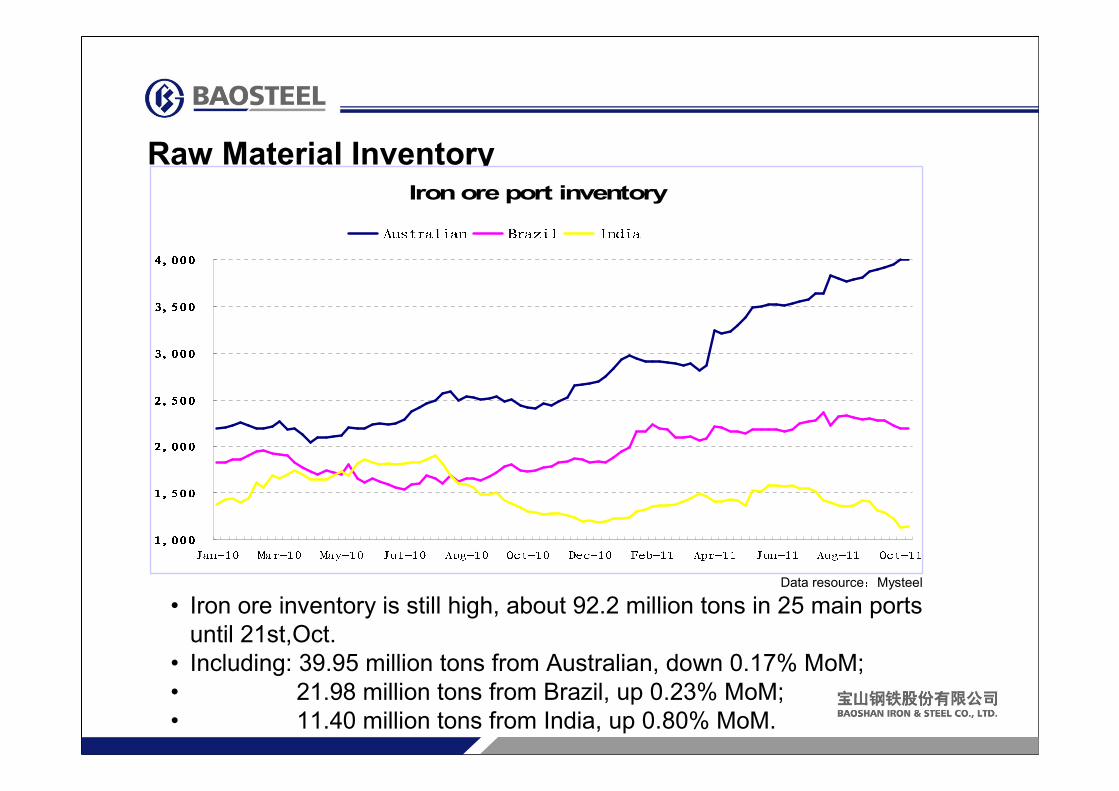
Raw Material Inventory
• Iron ore inventory is still high, about 92.2 million tons in 25 main ports
until 21st,Oct.
• Including: 39.95 million tons from Australian, down 0.17% MoM;
• 21.98 million tons from Brazil, up 0.23% MoM;
• 11.40 million tons from India, up 0.80% MoM.
Data resource:Mysteel
Iron ore port inventory
1,0001,0001,0001,0001,5001,5001,5001,5002,0002,0002,0002,0002,5002,5002,5002,5003,0003,0003,0003,0003,5003,5003,5003,5004,0004,0004,0004,000
Jan-10 Mar-10 May-10 Jul-10 Aug-10 Oct-10 Dec-10 Feb-11 Apr-11 Jun-11 Aug-11 Oct-11
Australian Brazil India
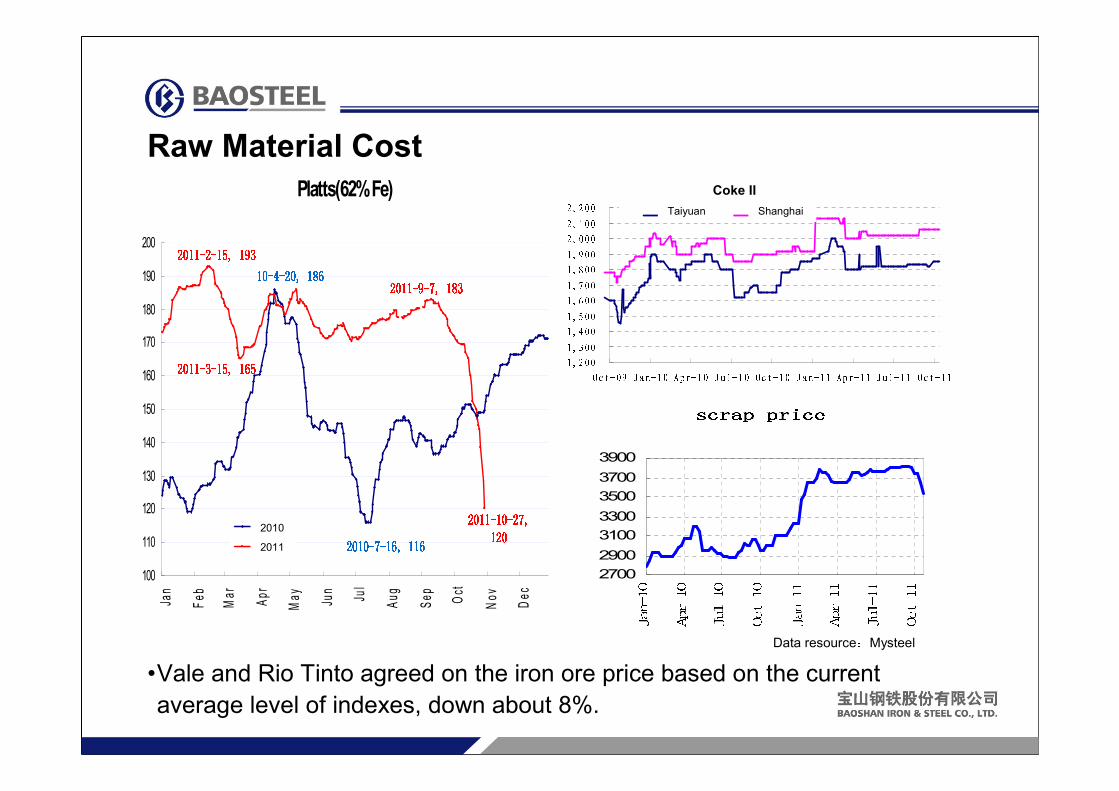
Raw Material Cost
•Vale and Rio Tinto agreed on the iron ore price based on the current
average level of indexes, down about 8%.
二级冶金焦价格二级冶金焦价格二级冶金焦价格二级冶金焦价格1,2001,3001,4001,5001,6001,7001,8001,9002,0002,1002,200
Oct-09 Jan-10 Apr-10 Jul-10 Oct-10 Jan-11 Apr-11 Jul-11 Oct-11太原 上海
scrap pricescrap pricescrap pricescrap price2700
2900
3100
3300
3500
3700
3900
Jan-10 Apr-10 Jul-10 Oct-10 Jan-11 Apr-11 Jul-11 Oct-11Data resource:Mysteel
Platts(62% Fe)
2010-7-16, 1162010-7-16, 1162010-7-16, 1162010-7-16, 116
10-4-20, 18610-4-20, 18610-4-20, 18610-4-20, 186
2011-10-27,2011-10-27,2011-10-27,2011-10-27,120120120120
2011-9-7, 1832011-9-7, 1832011-9-7, 1832011-9-7, 1832011-3-15, 1652011-3-15, 1652011-3-15, 1652011-3-15, 1652011-2-15, 1932011-2-15, 1932011-2-15, 1932011-2-15, 193
100
110
120
130
140
150
160
170
180
190
200
Jan
Feb
Mar
Apr
May Jun
Jul
Aug
Sep Oct
Nov
Dec
2010年2011年2010
2011
Taiyuan Shanghai
Coke II
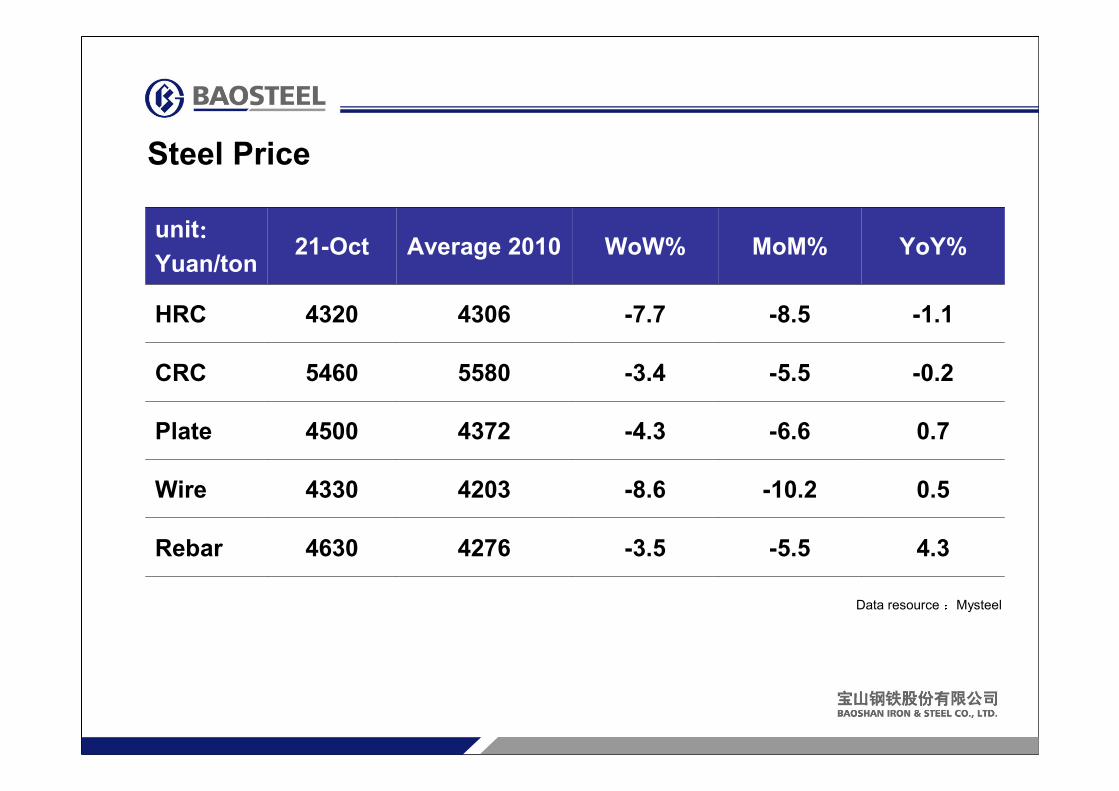
Steel Price
unit::::
Yuan/ton21-Oct Average 2010 WoW% MoM% YoY%
HRC 4320 4306 -7.7 -8.5 -1.1
CRC 5460 5580 -3.4 -5.5 -0.2
Plate 4500 4372 -4.3 -6.6 0.7
Wire 4330 4203 -8.6 -10.2 0.5
Rebar 4630 4276 -3.5 -5.5 4.3
Data resource:Mysteel

• Iron ore price decreased since September, which weakened support of cost to the
steel price.
• Demand of most industries(except automobile) has been weak recently, caused
the decline of steel price.
Market Trend
3000
3400
3800
4200
4600
5000
5400
5800
6200
6600
Jan-09 Mar-09 May-09 Jul-09 Sep-09 Nov-09 Jan-10 Mar-10 May-10 Jul-10 Sep-10 Nov-10 Jan-11 Mar-11 May-11 Jul-11 Sep-11热轧3.0冷轧1.0螺纹20Ⅲ级 300040005000600070008000900010000
Jan-09 Apr-09 Jul-09 Oct-09 Jan-10 Apr-10 Jul-10 Oct-10 Jan-11 Apr-11 Jul-11 Oct-11冷轧1.0镀锌1.0彩涂0.476硅钢600
Data resource:Mysteel
HR3.0
CR1.0
Rebar20III
CR1.0
Galvanized1.0
Prepainted0.476
silicon600