Embed Size (px)
Citation preview
3Q20Results
Presentation

2
EDP Partnership - ESG Commitment
+100
-574t
3,518

3
Awards

4
74,70485,027 84,259 85,963
52,271
75,23065,531
68,639
4,124
4,331
3,9343,718
27,731
46,566
131,099
164,588
153,724158,320
2016 2017 2018 2019 3Q19 3Q20
Fleet Management Rent a Car Rent a Car - Franchises
Fleet
Fleet Composition (# of vehicles)
CAGR (2016-2019) +81.1%
+3.0%

5
329.0
859.4
2,944.83,151.9
4,562.2
3,163.42,814.9
1,008.01,373.6
352.3525.2
1,408.81,621.2
2,518.5
1,865.62,219.8
711.8
1,177.7
2016 2017 2018 2018 Combined 2019 9M19 9M20 3Q19 3Q20
Cars Acquisition Car Sales Revenues
(23.3)
1,536.01,530.7
334.2195.9
2,043.7
1,297.8
296.2
595.0
2019: Acquisition of NTC Serviços Ltda.
90.0
2020: Acquisition of Zetta Frotas
90.049.0
9,122
19,747
68,70272,849
97,948
70,370
51,140
20,497 21,283
12,40216,710
42,38648,394
64,564
47,88556,408
17,905
28,717
2016 2017 2018 2018 Combined 2019 9M19 9M20 3Q19 3Q20
Cars Purchased Cars Sold
(3,280)3,037
26,316 24,455 22,485
33,384
(6,894)2,592
4,455
(5,268)
2019: Acquisition of NTC Serviços Ltda.
4,455
2,.598
2020: Acquisition of Zetta Frotas
Fleet Investment
Net Investment (R$ million)
Net Investment (# of vehicles)
(54.2)%
(33.9)%

6
4,6297,032
12,759
17,098
11,498
18,841
3,904
8,996
195.1309.6
575.0709.0
471.0
1,105.8
153.3
557.0
-2000,0
-1500,0
-1000,0
-500,0
0,0
500,0
1000,0
0
5.000
10.000
15.000
20.000
25.000
2016 2017 2018 2019 9M19 9M20 3Q19 3Q20
# of Vehicles Global Value (R$ million)
86.496.1
124.9
175.4
195.8
45.255.2
2016 2017 2018 2019 2020 4Q19 4Q20
Fleet Management(1/2)
Commercial Pipeline
New Hires: Future Revenue Generation
# Cars in Dispute (thousand)
Increased demand for Fleet Management resulted in a record of the Global Value and number of vehicles contracted, and the pipeline of cars in dispute in 4Q20.
+22.0%
(1) Para Novas Contratações, não são consideradas as renovações de contratos.
+134.8%
+263.4%
+63.9%
+130.4%
Record
Record
+11.7%
Record
Record
Record

7
402.4522.9
930.61,017.1
1,214.5
903.6 949.9
316.0 346.5
2016 2017 2018 2018Combined
2019 9M19 9M20 3Q19 3Q20
8,33511,179
20,64722,624
25,374
18,950 19,750
6,461 6,821
1,597 1,546 1,489 1,483 1,597 1,591 1,590 1,623 1,679
-2.000
-1.500
-1.000
-500
0
500
1.000
1.500
-3.000
2.000
7.000
12.000
17.000
22.000
27.000
32.000
37.000
42.000
2016 2017 2018 2018 Combined 2019 9M19 9M20 3Q19 3Q20
# of Daily Rentals (thousand) Average Monthly Rate (R$)
97.9% 98.0% 97.9% 98.0%
9M19 9M20 3Q19 3Q20
Fleet Management(2/2)
Number of Daily Rentals (thousand) and Average Monthly Rate (R$)
Net Revenue from Fleet Management (R$ Million)
CAGR (2016-2019) +44.5%
+5.1%
+9.7%
Occupancy Rate
(Rented Fleet as % of Operating Fleet)
+0.1 p.p.+0.1 p.p.
+3.5%
+5.6%
+4.2%
(0.0)%
CAGR (2016-2019) +44.9%
Record
Record
Record
Record
Record
8
12,40216,710
48,394
64,564
47,88556,408
17,905
28,717
28.4 31.4 33.539.0 39.0 39.4 39.8 41.0
-40,0
-30,0
-20,0
-10,0
0,0
10,0
20,0
30,0
40,0
50,0
-
10.000
20.000
30.000
40.000
50.000
60.000
70.000
80.000
90.000
100.000
2016 2017 2018 Combined 2019 9M19 9M20 3Q19 3Q20
# of Cars Sold Average Price of Cars Sold
5.0 5.1
2.4 2.3 1.7 1.3 0.5 0.5
4.4 4.5
5.8 5.7 4.22.9
1.5 1.3
1.5 1.92.8 3.1 2.2
1.9
0.9 0.9
2.52.7 3.3 3.5 2.6
2.2
1.0 1.1
13.4 14.2 14.3 14.6 10.78.3
3.9 3.8
2016 2017 2018 2019 9M19 9M20 3Q19 3Q20
Up to 3 years From 4 to 8 years From 9 to 12 years More than 12 years
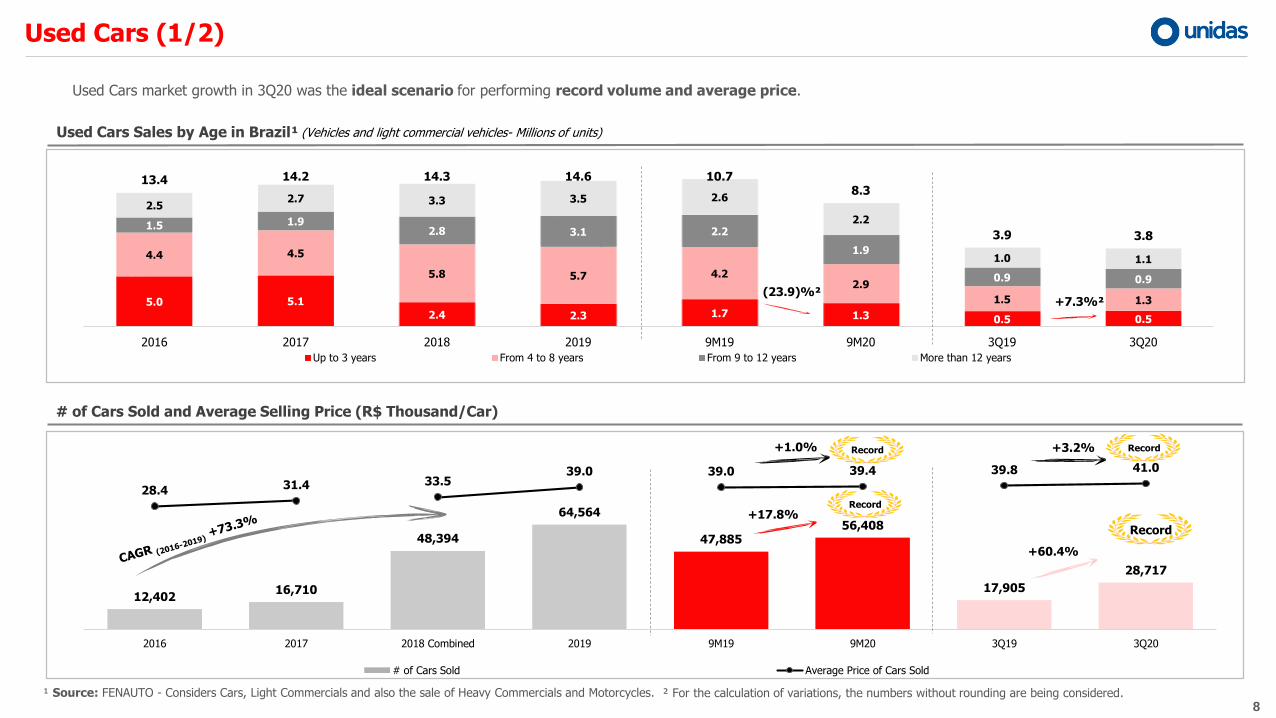
Used Cars (1/2)
Used Cars Sales by Age in Brazil¹
¹ Source: FENAUTO - Considers Cars, Light Commercials and also the sale of Heavy Commercials and Motorcycles. ² For the calculation of variations, the numbers without rounding are being considered.
(Vehicles and light commercial vehicles- Millions of units)
(23.9)%²+7.3%²
Used Cars market growth in 3Q20 was the ideal scenario for performing record volume and average price.
# of Cars Sold and Average Selling Price (R$ Thousand/Car)
+1.0% +3.2%
+60.4%
+17.8%
Record
Record
Record Record
9
11 23
58
83 77 90
21
18 19
19
3
4
6
119
13
14
27
85
112 105
122
-10
10
30
50
70
90
110
130
2016 2017 2018 2019 3Q19 3Q20
Retail - Own Stores Retail - Franchises Wholesale
352.3525.4
1,411.31,621.2
2,518.5
1,866.3
2,219.8
711.8
1,177.7
0,0
500,0
1.000,0
1.500,0
2.000,0
2.500,0
3.000,0
3.500,0
2016 2017 2018 2018 Combined 2019 9M19 9M20 3Q19 3Q20
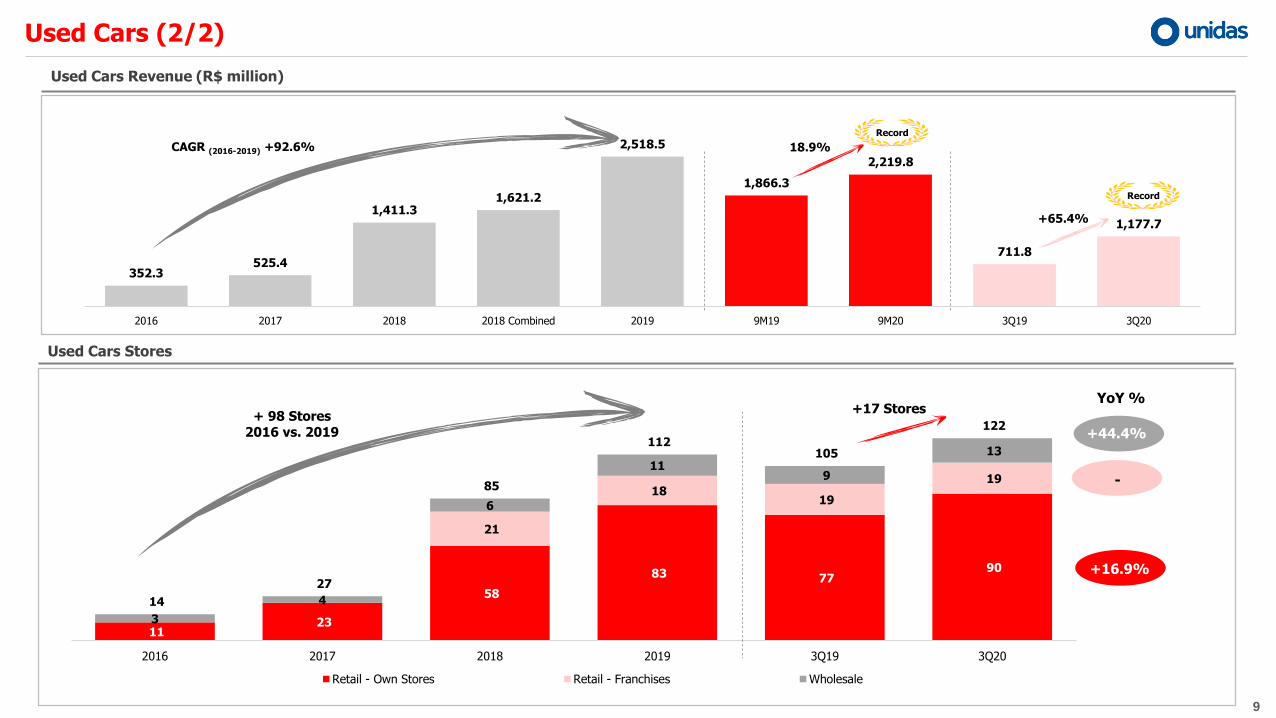
Used Cars (2/2)
+65.4%
Used Cars Revenue (R$ million)
CAGR (2016-2019) +92.6% 18.9%
Used Cars Stores
+ 98 Stores2016 vs. 2019
+17 Stores
+16.9%
-
+44.4%
YoY %
Record
Record

10
81.5%83.7%
78.8% 78.0%75.7%
79.7%
2016 2017 2018 2019 3Q19 3Q20
73.571.7
74.370.9
69.2
61.9
2016 2017 2018 2019 3Q19 3Q20
4,797
6,486
8,554
14,199
10,061
12,184
3,578 4,089
2016 2017 2018 2019 9M19 9M20 3Q19 3Q20
Number of Daily Rentals growing double digits and high occupancy rate. Prices equal to or greater than pre-COVID prices on all customer types. Lower averagerate reflects only mix more exposed to monthly rentals.
Rent a Car (1/2)
Number of Daily Rentals (Excluding franchises, thousand)
+21.1%CAGR (2016-2019) +43.6%
Average Daily Price (R$)
(10.6)%
Occupancy Rate
(Rented fleet as % Operational Fleet)
+4.0 p.p.
+14.3%
11
324.5
424.4
578.7
913.1
649.9 684.6
223.9 229.3
2016 2017 2018 2019 9M19 9M20 3Q19 3Q20
99 104 121 132 130 168
128 112 89 76 78
54
227216 210 208 208
222
2016 2017 2018 2019 3Q19 3Q20
Own Stores Franchises
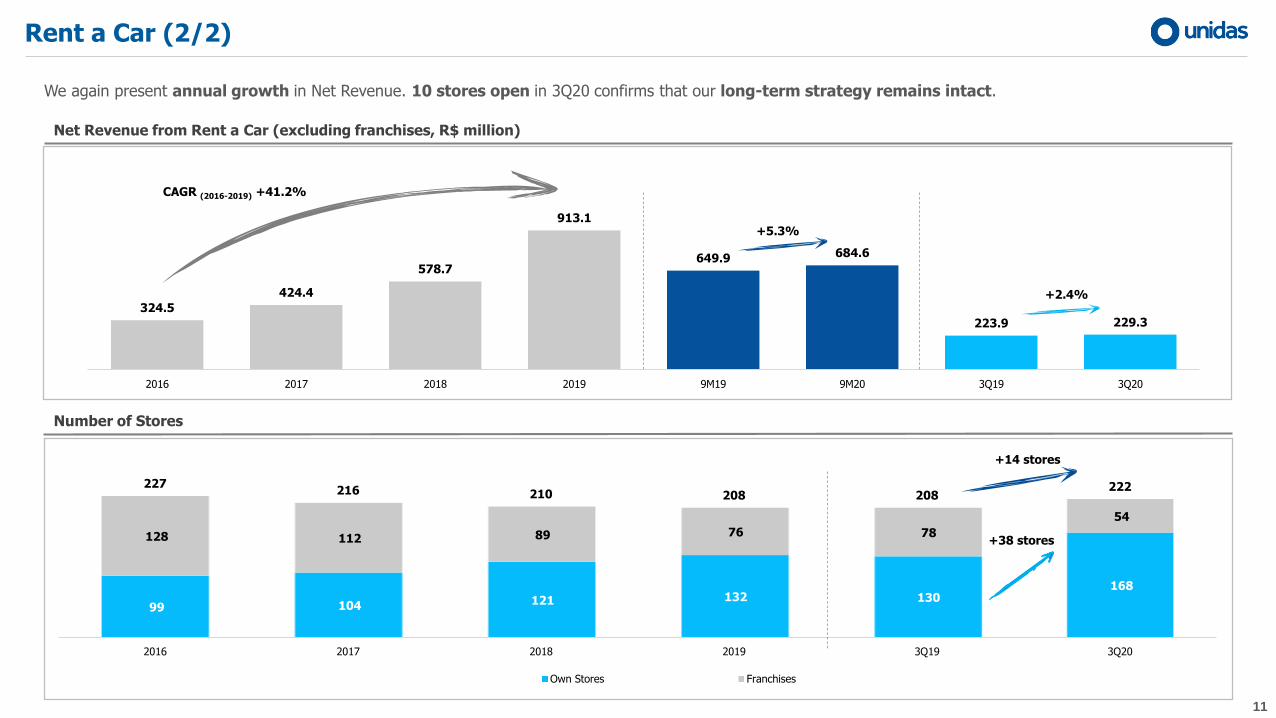
Rent a Car (2/2)
We again present annual growth in Net Revenue. 10 stores open in 3Q20 confirms that our long-term strategy remains intact.
Net Revenue from Rent a Car (excluding franchises, R$ million)
CAGR (2016-2019) +41.2%
+2.4%
+5.3%
Number of Stores
+14 stores
+38 stores
12
-11.811.9 42.1 67.8 32.5 28.2 57.8 10.3 53.0
260.6
333.0
603.5664.7 787.5
587.8 615.1
206.9 232.9
187.7
284.7
445.5
318.0 217.6
110.1 82.9
248.8
345.0
833.3
1,017.2
1,265.5
934.0890.6
327.4 368.8
61.8%66.0%
59.4% 62.4%58.6% 59.2%
53.7%59.8%
63.6%
-100,0%
-80,0%
-60,0%
-40,0%
-20,0%
0,0%
20,0%
40,0%
60,0%
-100,0
100,0
300,0
500,0
700,0
900,0
1.100,0
1.300,0
1.500,0
1.700,0
2016 2017 2018 2018 Combined 2019 9M19 9M20 3Q19 3Q20
Used Cars Fleet Management Rent-a-Car + Franchises Recurring Rental Margin
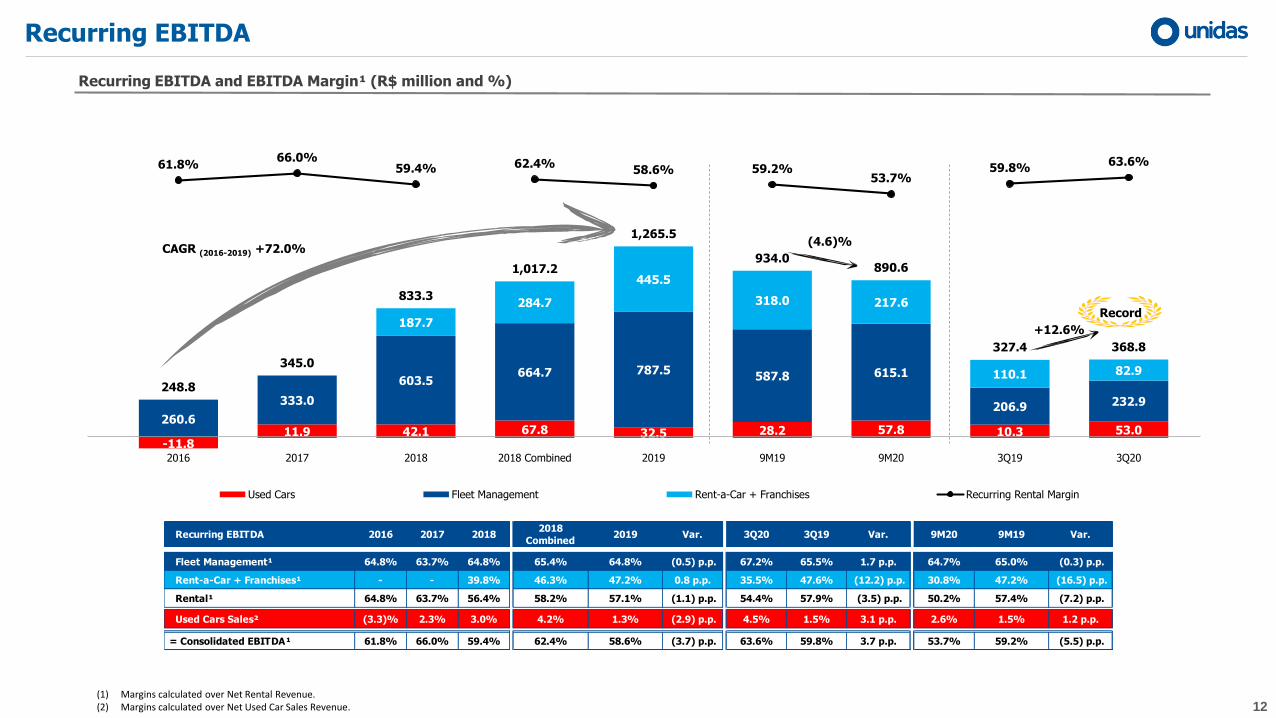
Recurring EBITDA
Recurring EBITDA and EBITDA Margin¹ (R$ million and %)
(1) Margins calculated over Net Rental Revenue.(2) Margins calculated over Net Used Car Sales Revenue.
CAGR (2016-2019) +72.0%(4.6)%
+12.6%
Record
Recurring EBITDA 2016 2017 20182018
Combined2019 Var. 3Q20 3Q19 Var. 9M20 9M19 Var.
Fleet Management¹ 64.8% 63.7% 64.8% 65.4% 64.8% (0.5) p.p. 67.2% 65.5% 1.7 p.p. 64.7% 65.0% (0.3) p.p.
Rent-a-Car + Franchises¹ - - 39.8% 46.3% 47.2% 0.8 p.p. 35.5% 47.6% (12.2) p.p. 30.8% 47.2% (16.5) p.p.
Rental¹ 64.8% 63.7% 56.4% 58.2% 57.1% (1.1) p.p. 54.4% 57.9% (3.5) p.p. 50.2% 57.4% (7.2) p.p.
Used Cars Sales² (3.3)% 2.3% 3.0% 4.2% 1.3% (2.9) p.p. 4.5% 1.5% 3.1 p.p. 2.6% 1.5% 1.2 p.p.
= Consolidated EBITDA¹ 61.8% 66.0% 59.4% 62.4% 58.6% (3.7) p.p. 63.6% 59.8% 3.7 p.p. 53.7% 59.2% (5.5) p.p.

13
150.3216.8
553.0644.4
797.2
584.8
465.7
202.7 234.1
37.4% 41.5% 39.4% 39.5% 36.9% 37.1%28.1%
37.1% 40.3%
-100,0%
-80,0%
-60,0%
-40,0%
-20,0%
0,0%
20,0%
40,0%
60,0%
-
200,0
400,0
600,0
800,0
1.000,0
1.200,0
2016 2017 2018 2018 Combined 2019 9M19 9M20 3Q19 3Q20
Consolidated Recurring EBIT Recurring Rental Margin
Recurring EBIT
Recurring EBIT and EBIT Margin¹ (R$ Million and %)
(1) Margins calculated over Net Rental Revenue
(20.4)%
+15.4%
CAGR (2016-2019) +74.4%
Record
Recurring EBIT 2016 2017 20182018
Combined2019 Var. 3Q20 3Q19 Var. 9M20 9M19 Var.
Fleet Management¹ 37.4% 41.5% 43.9% 44.4% 41.8% (2.7) p.p. 51.2% 42.2% 8.9 p.p. 41.9% 41.6% 0.3 p.p.
Rent-a-Car + Franchises¹ - - 30.7% 31.3% 30.7% (0.6) p.p. 24.3% 30.0% (5.7) p.p. 9.5% 31.0% (21.5) p.p.
= Consolidated EBIT¹ 37.4% 41.5% 39.4% 39.5% 36.9% (2.5) p.p. 40.3% 37.1% 3.3 p.p. 28.1% 37.1% (9.0) p.p.

14
114.5 125.1
290.7335.2 350.2
266.0211.5
91.5 69.9
28.5%23.9%
20.7% 20.5%16.2% 16.9%
12.8%16.7%
12.0%
-40,0%
-30,0%
-20,0%
-10,0%
0,0%
10,0%
20,0%
30,0%
0
100
200
300
400
500
600
2016 2017 2018 2018 Combinado 2019 9M19 9M20 3Q19 3Q20
28.967.7
203.4233.6
348.8
250.0210.5
86.0124.2
7.2%
12.9% 14.5% 14.3% 15.2% 15.9%12.7%
15.7%21.4%
-30,0%
-20,0%
-10,0%
0,0%
10,0%
20,0%
-50
50
150
250
350
450
550
2016 2017 2018 2018 Combined 2019 9M19 9M20 3Q19 3Q20
Recurring Net Income Recurring Net Margin
Financial Result and Net Income
Recurring Financial Result
Recurring Net Income
R$ million as % Rental Revenue
R$ million as % Rental Revenue
(15.8)%
(23.7)%
(20.5) %
+44.4%
Record
Record
15
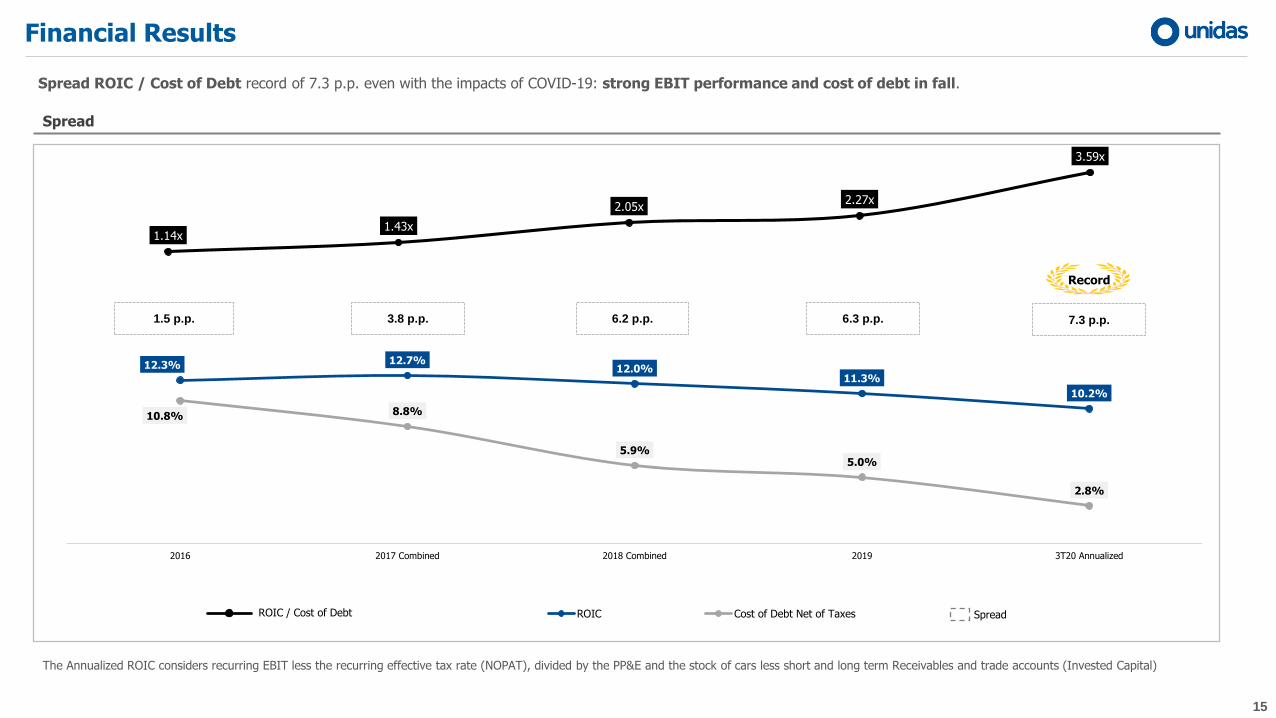
Financial Results
Spread
The Annualized ROIC considers recurring EBIT less the recurring effective tax rate (NOPAT), divided by the PP&E and the stock of cars less short and long term Receivables and trade accounts (Invested Capital)
Spread ROIC / Cost of Debt record of 7.3 p.p. even with the impacts of COVID-19: strong EBIT performance and cost of debt in fall.
12.3% 12.7%12.0%
11.3%
10.2%
10.8% 8.8%
5.9%5.0%
2.8%
2016 2017 Combined 2018 Combined 2019 3T20 Annualized
ROIC Cost of Debt Net of Taxes
1.5 p.p. 3.8 p.p.
Spread
6.2 p.p. 6.3 p.p.
1.14x1.43x
2.05x2.27x
3.59x
ROIC / Cost of Debt
7.3 p.p.
Record
16
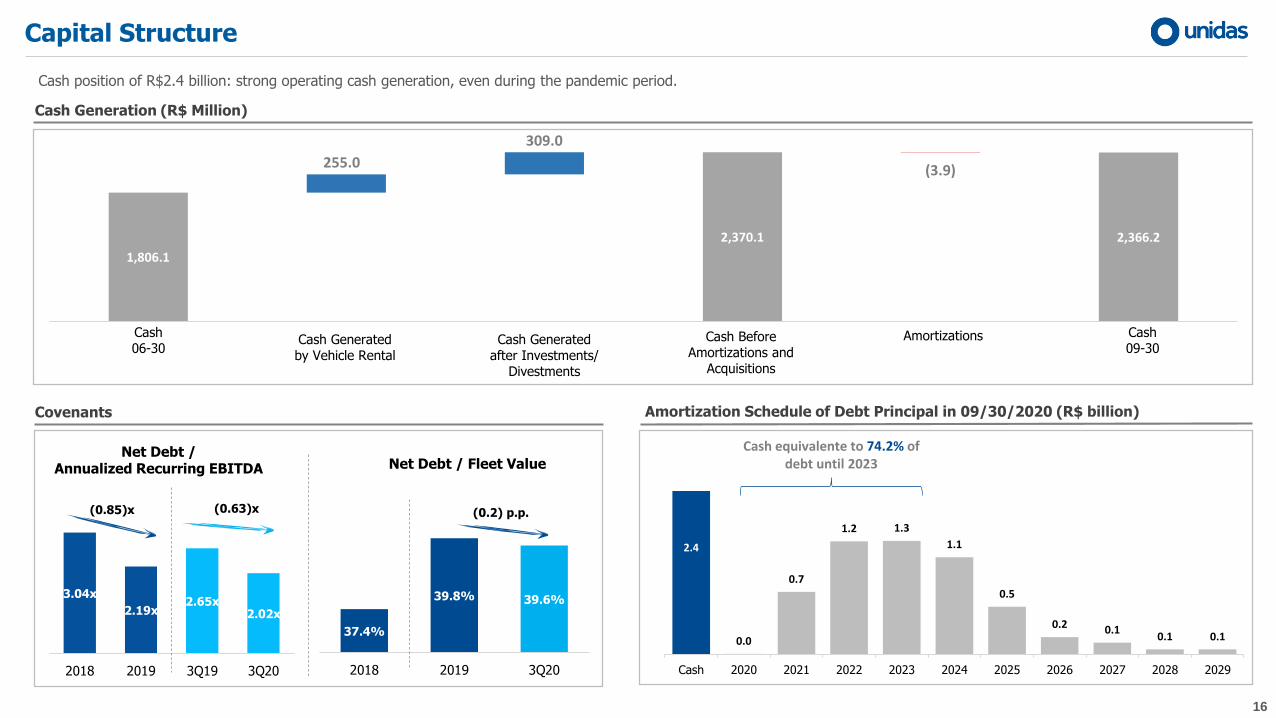
2.4
0.0
0.7
1.2 1.3
1.1
0.5
0.2 0.10.1 0.1
Cash 2020 2021 2022 2023 2024 2025 2026 2027 2028 2029
1,806.1
2,370.1 2,366.2
255.0
309.0
(3.9)
Caixa 30-06 Caixa Gerado Pelo Aluguel deVeículos
Caixa Gerado ApósInvestimentos/Desinvestimentos
Caixa Antes de Amortizações eAquisições
Amortizações Caixa 30-09
37.4%
39.8% 39.6%
36, 0%
36, 5%
37, 0%
37, 5%
38, 0%
38, 5%
39, 0%
39, 5%
40, 0%
2018 2019 3Q20
3.04x
2.19x2.65x
2.02x
2018 2019 3Q19 3Q20
Capital Structure
Amortization Schedule of Debt Principal in 09/30/2020 (R$ billion)
Cash position of R$2.4 billion: strong operating cash generation, even during the pandemic period.
Covenants
Cash Generation (R$ Million)
Cash equivalente to 74.2% ofdebt until 2023
Net Debt /Annualized Recurring EBITDA Net Debt / Fleet Value
(0.85)x (0.63)x (0.2) p.p.
Cash06-30
Cash Generatedby Vehicle Rental
Cash Generatedafter Investments/
Divestments
Cash BeforeAmortizations and
Acquisitions
Amortizations Cash09-30

Q&A
Legal Notice - The statements contained in this document related to business prospects, projections of operating and financial results and those related to Unidas' growth prospects are merelyprojections and, as such, are exclusively based on management’s expectations of future business. These expectations depend, substantially, on market conditions, the performance of the Brazilianeconomy, the sector and international markets and, therefore, are subject to change without prior notice
ri.unidas.com.br/en
Contact: [email protected]