Embed Size (px)
Citation preview
3Q FY 2019-20FINANCIAL RESULTS17th January 2020

2
Forward Looking Statements
This presentation contains forward-looking statements which may be identified by their use of words like
“plans,” “expects,” “will,” “anticipates,” “believes,” “intends,” “projects,” “estimates” or other words of similar
meaning. All statements that address expectations or projections about the future, including, but not limited
to, statements about the strategy for growth, product development, market position, expenditures, and
financial results, are forward-looking statements.
Forward-looking statements are based on certain assumptions and expectations of future events. The
companies referred to in this presentation cannot guarantee that these assumptions and expectations are
accurate or will be realized. The actual results, performance or achievements, could thus differ materially
from those projected in any such forward-looking statements. These companies assume no responsibility to
publicly amend, modify or revise any forward looking statements, on the basis of any subsequent
developments, information or events, or otherwise.

3
3Q FY20 – Key Highlights
Industry leading diversified portfolio helped overcome macro challenges
➢ Highest ever net profit of ₹ 11,640 crore despite cyclical trough in petrochemical margins
▪ Key product (PE, PP, PX) margins at 8-10 year trough levels
➢ Consolidated segment EBITDA at ₹ 23,500 crore, growth led by consumer businesses and refining
▪ Strong refining segment performance with EBITDA up 15% QoQ
▪ Consumer business EBITDA up 12% QoQ
➢ Consumer businesses now at 37% of consolidated segment EBITDA
➢ Retail business - 15th consecutive quarter of Revenue and Profit growth
➢ Digital Services - Gross addition of 37 Mn subscribers, continuing to be operator of choice

Consolidated Financial Results : 3Q FY20
Net profit growth led by robust refining and consumer businesses operating performance
➢ QoQ revenue growth led by
▪ Higher refining throughput (+8%)
▪ Robust growth in consumer businesses
➢ QoQ double digit EBITDA growth for:
▪ Refining (+15%) – favorable margins
▪ Retail (+17%) – store expansion and SSG
▪ Digital Services (+10%) – Subscriber addition
and improved ARPU
➢ Petrochemicals EBITDA down 19% QoQ
▪ Margin pressure across product chains
4
➢ Standalone net profit at ₹ 9,585 crore, up 7.4% YoY
2Q FY20 (in ` Crore) 3Q FY20 3Q FY19% Change
Y-o-Y
% Change
Q-o-Q
164,769 Turnover 168,858 171,300 -1.4% 2.5%
23,169 Segment EBITDA 23,500 22,449 4.7% 1.4%
11,262 Net Profit 11,640 10,251 13.5% 3.4%

Consolidated EBITDA: 3Q FY20 vs. 3QFY19
Structural growth momentum in consumer businesses offsetting cyclical petrochemical slowdown
➢ YoY Segment EBITDA up 4.7%
➢ Recovery in GRM ($9.2 vs. $8.8/bbl) led to YoY
growth in EBITDA
➢ Petrochemicals EBITDA impacted by new
supplies and soft global demand
➢ Consumer business EBITDA up 49% YoY
▪ Retail margin expansion by 140 bps to 6.7%
▪ Strong subscriber addition in Jio
5
22,449681 2,344
4471,047
1,767347 23,500
15000
17000
19000
21000
23000
25000

Consolidated Segment EBITDA Mix: 3Q FY20 vs. 3Q FY19
Consumer businesses contribution at 37% (vs. 26%)
6
3Q FY19 3Q FY20
R&M26%
Petchem43%
Oil & Gas2%
Retail8%
Digital Services18%
Media & Others3%
R&M28%
Petchem31%Oil & Gas
0.27%
Retail12%
Digital Services25%
Media & Others4%

7
Refining & Marketing – Segment Performance
➢ Segment EBITDA up 15% QoQ and 11% YoY
➢ Premium over Singapore GRM at $ 7.6/bbl, 11-Year high
▪ Weak FO cracks impacted Singapore margins
▪ Optimized yields to benefit from favorable margins
➢ Crude throughput of 18.1 MMT, maximized to capture
favorable margin environment
➢ 1,394 fuel retail outlets
▪ TPO at 342 KLPM (up 9% YoY)
▪ Strong YoY volume growth: HSD (+11%) / MS (+15%)
vs. industry growth of (+0.2%) / (+7.1%)
Superior product mix and high asset utilization underpinned strong earnings
5,849 5,659 6,530
8.89.4 9.2
0
2
4
6
8
10
-
2,000
4,000
6,000
8,000
3Q FY19 2Q FY20 3Q FY20EBITDA (` crore) GRM ($/bbl)
➢ India oil demand up 3.2% YoY
▪ Demand for MS up 7.1%, LPG up 15%,
ATF up 2.4%

Petrochemicals – Segment Performance
➢ Segment EBITDA down 19% QoQ and 24% YoY
➢ Operating performance impacted by weak margins
▪ Product realizations lower by 1%-10% in high feedstock
price environment – Naphtha (+13%), Ethane (+8%)
➢ RIL performance aided by:
▪ Sales mix optimization - higher domestic sales vis-à-vis
exports
▪ Marginally higher production at 9.9 MMT
▪ Optimized light-feed cracking in weak naphtha cracking
environment
Maintained high asset utilization and tight inventory control to mitigate low margins
9,596 8,927
7,252
21.0
23.2
19.6
0
6
12
18
24
-
3,000
6,000
9,000
12,000
15,000
3Q FY19 2Q FY20 3Q FY20
EBITDA (` crore) EBITDA Margin (%)
8
➢ Polyester and polymer demand remained
healthy
Oil & Gas Segment Performance
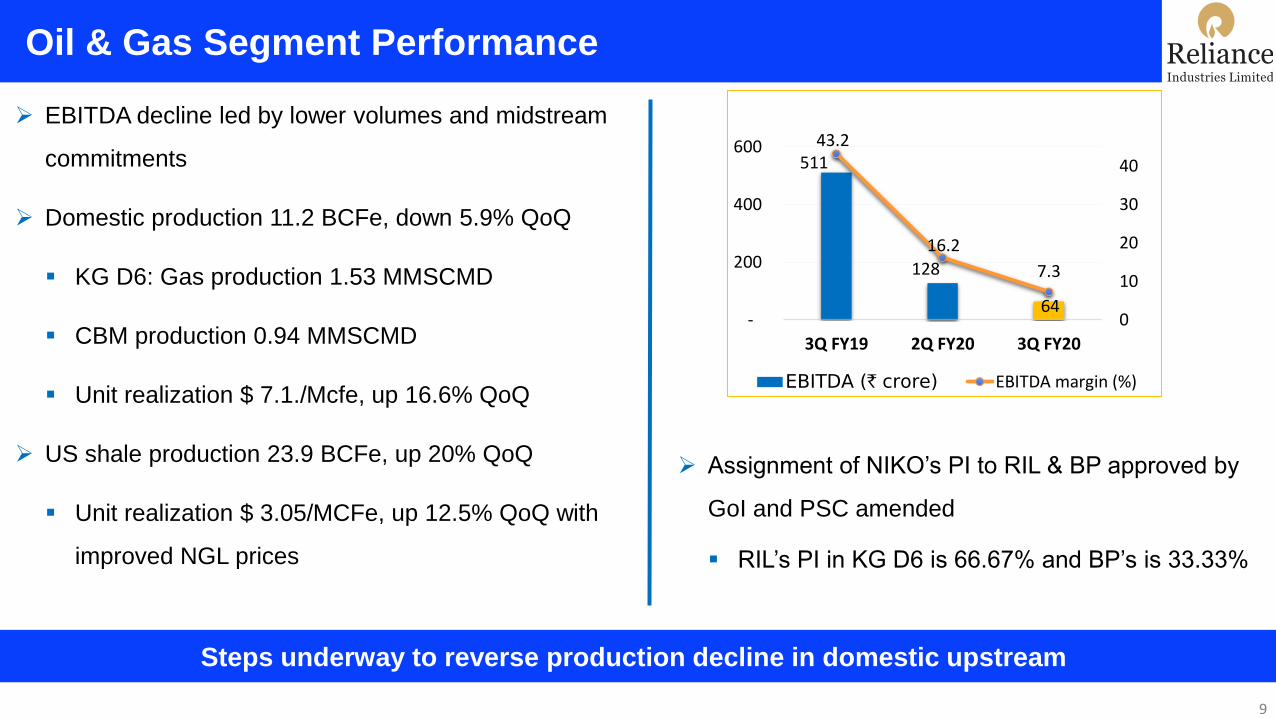
Steps underway to reverse production decline in domestic upstream
➢ EBITDA decline led by lower volumes and midstream
commitments
➢ Domestic production 11.2 BCFe, down 5.9% QoQ
▪ KG D6: Gas production 1.53 MMSCMD
▪ CBM production 0.94 MMSCMD
▪ Unit realization $ 7.1./Mcfe, up 16.6% QoQ
➢ US shale production 23.9 BCFe, up 20% QoQ
▪ Unit realization $ 3.05/MCFe, up 12.5% QoQ with
improved NGL prices
9
511
128
64
43.2
16.2
7.3
0
10
20
30
40
-
200
400
600
3Q FY19 2Q FY20 3Q FY20
EBITDA (` crore) EBITDA margin (%)
➢ Assignment of NIKO’s PI to RIL & BP approved by
GoI and PSC amended
▪ RIL’s PI in KG D6 is 66.67% and BP’s is 33.33%

Retail Segment Performance
Operating leverage, festive season driving EBITDA growth
➢ 15th straight quarter of revenue, profits growth in-tandem
➢ Turnover at ₹ 45,327 crore, up 27% YoY, 10% QoQ
➢ EBITDA at ₹ 2,727 up 62% YoY, 17% QoQ
▪ EBITDA margin up 140 bps YoY
➢ Revenue growth led by 37% surge in CE, F&L, Grocery
▪ EBITDA margin at 9.6% vs 8.0% last year, contributing
87% of overall EBITDA
➢ Operating leverage with strong LFL growth and
efficiencies contribute to EBITDA margin improvement
1,680
2,322
2,727 5.3
6.36.7
0
3
6
-
1,000
2,000
3,000
4,000
3Q FY19 2Q FY20 3Q FY20
EBITDA (` crore) EBITDA Margin (%)
10
➢ Number of stores 11,316
▪ Added 456 stores with focus on Tier 2 / small towns
▪ 26.3 million sq.ft across 6,900 towns and cities

Digital Services Segment Performance
Healthy financials; strategy in place to accelerate the growth engine
11
*Gross Revenue is value of Services inclusive of GSTStandalone Resultsfigures in Rs crore, unless otherwise stated
➢ Jio continues to be the Operator of Choice with subscriber
base of 370 million as of Dec-19
▪ Gross addition of 37.1 Mn in 3Q FY20
➢ Jio becomes net recipient of access charges within two
months of implementation of IUC tariffs
▪ Significant improvement in traffic mix
➢ Reported ARPU of ₹ 128.4 (including IUC revenue)
▪ Healthy per capita usage at 11.1GB and 760 mins per month
➢ Strong EBITDA growth, 8% QoQ and 38% YoY
▪ Industry leading EBITDA margins of 40.1%

Refining &Marketing
12

Performance Highlights
Optimized crude sourcing and higher volumes led strong refining performance
(₹ crore) 3QFY19 2QFY20 3QFY20
Revenue 111,738 97,229 103,718
GRM ($/bbl) 8.8 9.4 9.2
EBITDA 5,849 5,659 6,530
EBITDA
Margin (%)5.2% 5.8% 6.3%
Throughput
(MMT)18.0 16.7 18.1
13
➢ Strong QoQ operating performance for the refining segment
▪ Premium over Singapore at $ 7.6/bbl
▪ Stretched crude throughput to capture favorable margins
▪ Optimized advantaged feedstock sourcing, minimizing Crude
basket cost
➢ Maximized Middle Distillate pool in view of firm MD cracks;
started producing premium VLSFO blend stock for bunker
➢ Petro retail YoY volume growth – HSD (+11%) / MS (+15%)
➢ Won ”India Manufacturing Excellence Award” 2019 for DTA
refinery and “Future Ready Factory” award by Frost and Sullivan

Business Environment and Macro Trends
14
Growing geopolitics tensions and OPEC+ cuts supporting oil price
➢ Brent averaged $63.3/bbl in 3QFY20 up
1.3 $/bbl QoQ
Crude Supply
Refining
Dynamics
Macro and
geopolitics
− OPEC+ additional 500 kb/d cuts up to 1Q’20
− Growing US supplies resulting in lighter
global slate
− Phase 1 US-China trade agreement
− Middle East geopolitical tensions
− Continuing Iran and Venezuela sanctions
− IMO spec change
− Supply from new refineries in Asia
− Freight market disruption
Crude
Differentials
− Widening light – heavy and sweet – sour
differentials
− Limited supply of heavy sour crudes
High, 69.4
Low, 57.850
55
60
65
70
75
80
1-A
pr-
201
9
16
-Ap
r-2
01
9
1-M
ay-2
01
9
16
-May
-20
19
31
-May
-20
19
15
-Ju
n-2
01
9
30
-Ju
n-2
01
9
15
-Ju
l-2
01
9
30
-Ju
l-2
01
9
14
-Au
g-2
01
9
29
-Au
g-2
01
9
13
-Sep
-20
19
28
-Sep
-20
19
13
-Oct
-20
19
28
-Oct
-20
19
12
-No
v-2
01
9
27
-No
v-2
01
9
12
-Dec
-20
19
27
-Dec
-20
19
$/b
bl
Dubai Brent Average Brent

Global Refining Margins Environment
RIL’s GRM outperforming Singapore margin by $ 7.6/bbl over a period
➢ Steep decline in FO cracks impacted GRMs across regions
➢ Singapore margins further impacted by soft middle distillate
cracks
▪ Incremental supplies from China impacted diesel cracks
➢ Europe and US margins declined QoQ on the back of lower
gasoline and middle distillate cracks
▪ Seasonally lower gasoline demand
▪ Shippers bid-up VLSFO due to initial favorable economics
➢ Significant outperformance over Singapore GRM due to
weak Fuel Oil cracks
Global Refining Margins
Source: Reuters, RIL
15
4.3
5.9
13.0
8.8
6.5 6.9
16.2
9.4
1.7
4.4
13.8
9.2
0
2
4
6
8
10
12
14
16
18
Singapore Europe US RIL
3Q FY19 2Q FY20 3Q FY20
$/b
bl

16
Refinery Product Margins
Early signs of IMO driven disruption seen in HSFO cracks
11.7
16.2 15.8
-7.8
-0.5
12.915.4
13.9
-2.2
-19.7-25
-20
-15
-10
-5
0
5
10
15
20
Gasoline Gasoil Jet Kero Naphtha Fuel Oil
$/b
bl
2Q FY20 3Q FY20➢ Mid-distillates weakened QoQ
▪ Rising supply with 600 kbd start-up in Asia
▪ Limited support from IMO related bunker demand
▪ Soft India diesel demand
➢ Gasoline strengthened on tightness in high octane
barrels during the quarter
➢ FO cracks declined as sales and storage shifted from
HSFO to 0.5% bunker fuels
➢ Naphtha crack improved on tight M.E. supply
▪ Return of several regional Naphtha crackers from
planned maintenance
▪ Favorable support from strong LPG prices

17
Robust Domestic Fuel Demand Growth
Gasoline driving transportation fuel demand in India, to support retail volume growth
7.0
21.4
2.1
7.5
21.4
2.1
-
5
10
15
20
25
MS HSD ATF
Q3 FY19 Q3 FY20
7.1%
2.4%
MM
T
➢ India oil product demand grew 3.2% in 3Q FY20
▪ Preference for petrol cars, improving road infrastructure
and rural connectivity driving MS demand
▪ Pickup in tourist movement post festive season
provided support to ATF demand
MM
T
➢ Exports sales remained in line Y-o-Y basis
➢ Strong traction in retail and bulk fuel sales
through RIL network
Source: PPAC
Domestic Demand Y-o-Y RIL refinery product sales Y-o-Y0.2% 10.8
4.6
2.4 2.0
10.6
4.6
2.21.5
0
2
4
6
8
10
12
Exports Captive TransportationFuel
OtherDomestic
Q3 FY19 Q3 FY20

Domestic Marketing
Driving growth through strengthened network and increased customer base
➢ Strong YoY volume growth: HSD (+11%) / MS (+15%) vs. Industry growth of 0.2% / 7.1%
➢ Growth driven by focus on large Fleet Customers (25% YoY), Fleet Aggregators (114% YoY)
➢ E-Com Network increased to 690 ROs; Over 290% YoY volume growth
18
➢ Driving ATF volumes via new customer acquisition and higher share from existing customers
➢ Improved ATF network competitiveness through logistical and supply source optimization
➢LPG segment up 37% YoY with new customers and increasing penetration in new markets
➢14% YoY volume growth in bulk sales against industry de-growth of 0.7%;
➢ Maintained priority partner position with railways; 20% YoY growth in Non-Railway sector
➢ Renewed focus on Cement, Infra segment resulted in 27% YoY volume growth in sector sales

IMO 2020 – Significant Opportunity for Complex Refiners
IMO 2020 impact on refining
➢ IMO implementation has had a limited impact on the market in 3Q FY20
▪ Steep decline in HSFO cracks (-$19.2/bbl Q-o-Q fall)
▪ No improvement in Gasoil crack as VLSFO remained preferred compliant fuel over MGO
▪ VLSFO trading at strong premium, with drawdown in VLSFO inventory, MGO demand to pick up
▪ Middle Distillate inventories remained below 5 years average level
19
RIL Preparedness for IMO changes
➢ Feedstock sourcing being optimized to take advantage of changing market
➢ Widening of crude blend window to process opportunity blends and SRFOs
➢ Niche grades being launched in Middle Distillates and VLSFO to meet the changing market requirement
➢ Higher throughput DHT and Coker operation being planned
➢ Supplemental fuel mix being optimized with change in market scenario

R&M Business Outlook
20
− Large capacity additions
1.4 mb/d (2019) and 1.2
mb/d (2020)
− Reduced heavy crude
supply due to sanctions
− Growing freight rates on
the back of IMO spec
change and geopolitical
concerns
− Oil demand to grow by
1.0 mb/d (2019) and
1.2 mb/d (2020)
− Continued Middle East
Geopolitical tensions
− Uncertainty over future
of US China trade
deals
− Brexit uncertainties
− Refined products demand
growth from Emerging Market
Economies
− Gasoil demand growth as
compliant bunker fuel
− Discount on sour crudes and
feedstocks
− Tightening Gasoline
specifications
− RIL is well placed to take
advantage of emerging
market scenarios by
▪Enhanced coker capacity
▪Versatile and flexible kit in
terms of feedstock and
products
▪Maximizing distillate yields
Challenges Macro trends Refining drivers Positioning
Constructive outlook with IMO spec change and stable demand growth

PetrochemicalsPolymers & Polyesters
21

Financial and Operating Performance
Source: RIL internal estimates 22
(₹ crore) 3QFY19 2QFY20 3QFY20
Production
(MMT)9.7 9.9 9.9
Revenue 45,619 38,538 36,909
EBITDA 9,596 8,927 7,252
EBITDA
Margin (%)21.0% 23.2% 19.6%
➢ Challenging operating environment
➢ Regional product margins weakened QoQ
▪ Higher feedstock price environment during the quarter
▪ Large incremental supplies in weak global demand environment
▪ QoQ margin lower across product categories down 6% - 43%
➢ Healthy domestic demand for polymers and polyester
➢ RIL performance aided by:
▪ Sales mix optimization - higher domestic sales vis-à-vis exports
▪ Marginally higher production
▪ Optimized light-feed cracking in weak naphtha cracking environment
Feedstock advantage and healthy domestic demand supported performance

Our Competitive Edge
23
Strong
technical
know-how,
customer
services and
laboratory
Widespread
grade basket
along with
different
technologies
Strong
supply chain
network
(road,
railways,
coastal)
Integration
and feed
flexibility
resulting in
leading cost
position
Present in
close
proximity to
all major
consumption
hubs
Strong
pan-India
network of
channel
partners
Key Success
Factors for
Leadership Position
in Petrochemical
1
2
3 4
5
6

Executing for Superior Margins
24
Feed flexibility and optimisation
◼ Ability to optimize between: ethane vs.
naphtha
◼ During the quarter, high naphtha and low
ethane prices gave opportunity to optimise
Deep Customer Connect
◼ New small customers addition: 4000+ new
customers added in PE
◼ Minimal exports in PTA and MEG
◼ Double digit sales growth in key products 1 2
3
Grade Optimisation & placement
◼ Maximized sales of specialty polyester
◼ Geographical diversification of PX contracts
◼ POY value maximization through tolling
RIL achieved highest ever quarterly domestic sales in 3QFY20
Business Environment 3Q FY20
Source: RIL internal estimates 25
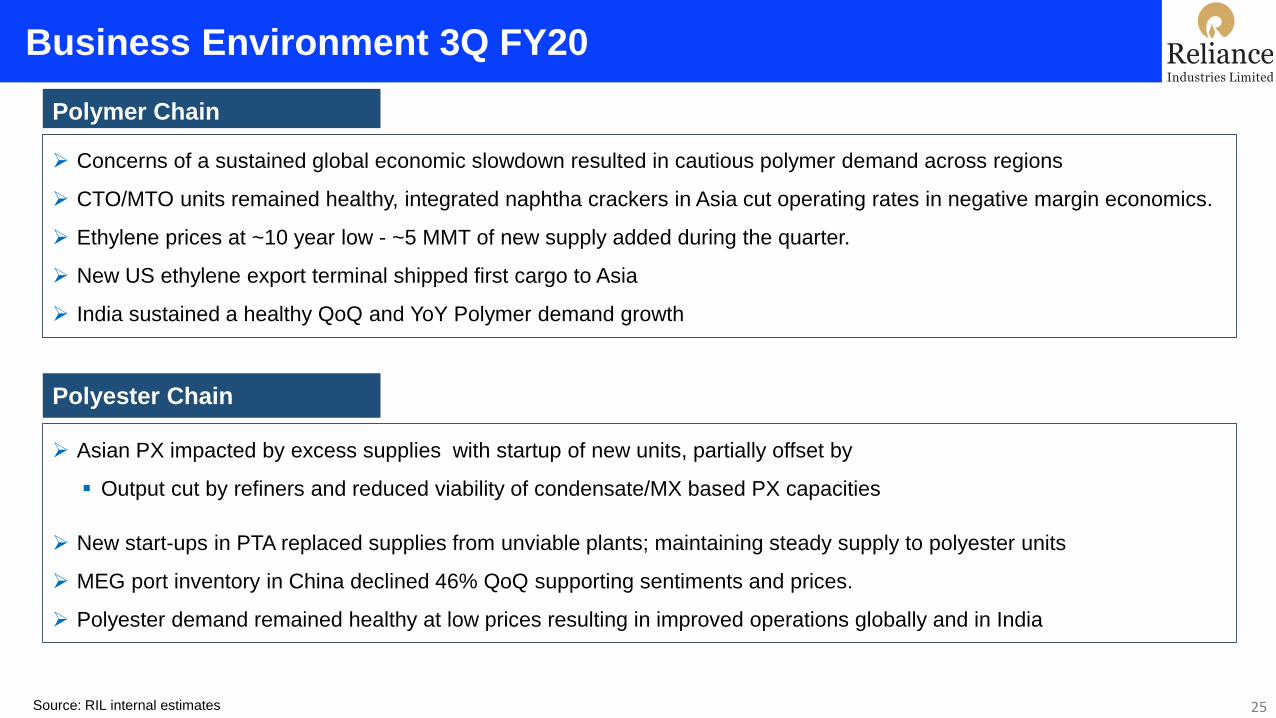
Polymer Chain
➢ Concerns of a sustained global economic slowdown resulted in cautious polymer demand across regions
➢ CTO/MTO units remained healthy, integrated naphtha crackers in Asia cut operating rates in negative margin economics.
➢ Ethylene prices at ~10 year low - ~5 MMT of new supply added during the quarter.
➢ New US ethylene export terminal shipped first cargo to Asia
➢ India sustained a healthy QoQ and YoY Polymer demand growth
Polyester Chain
➢ Asian PX impacted by excess supplies with startup of new units, partially offset by
▪ Output cut by refiners and reduced viability of condensate/MX based PX capacities
➢ New start-ups in PTA replaced supplies from unviable plants; maintaining steady supply to polyester units
➢ MEG port inventory in China declined 46% QoQ supporting sentiments and prices.
➢ Polyester demand remained healthy at low prices resulting in improved operations globally and in India

Polymers
26

(Source: Platts, ICIS, IHS Markit)
➢ PE margins down 30% QoQ – strong feedstock price and supply glut
▪ PE declined 7% against 13% increase in naphtha price
➢ Ramp up of low cost ethane based US crackers started in 1Q/2Q
accelerated price deterioration
▪ Net PE exports from US increased by ~2.6 MMT in CY2019
▪ US Exports to key South Asian markets have grown substantially
(YoY >130%)
➢ Trade truce and tariff reversals between US and China supported
price revival towards quarter end – positive for industry fundamentals
➢ Healthy PE demand growth in India fueled by packaging, higher
cement production, and city water distribution projects
Polyethylene
27
HDPE-Naphtha
590
419
292
0
200
400
600
800
3Q FY19 2Q FY20 3Q FY20
$/M
T
HDPE-Naphtha 5 Year Avg
* South Asian countries considered for trade statistics – Malaysia, Vietnam,
Singapore, India, Thailand, Indonesia
(Source: Platts, ICIS)
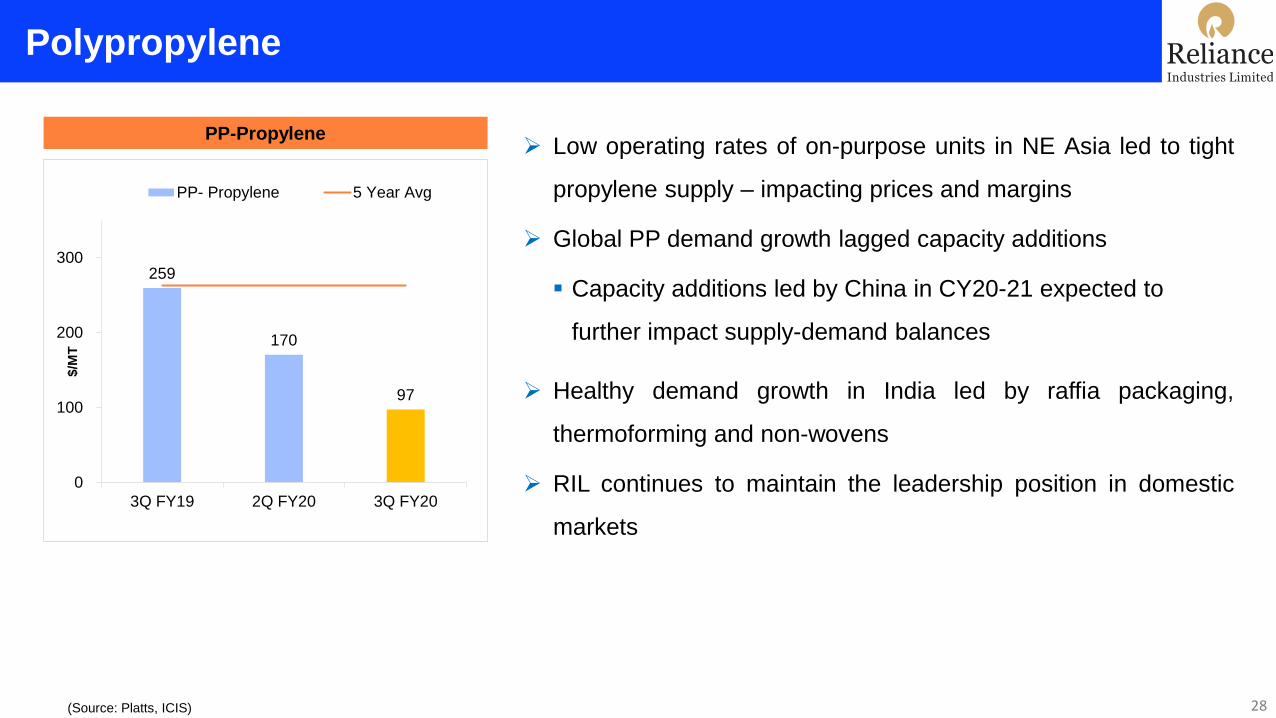
PP-Propylene➢ Low operating rates of on-purpose units in NE Asia led to tight
propylene supply – impacting prices and margins
➢ Global PP demand growth lagged capacity additions
▪ Capacity additions led by China in CY20-21 expected to
further impact supply-demand balances
➢ Healthy demand growth in India led by raffia packaging,
thermoforming and non-wovens
➢ RIL continues to maintain the leadership position in domestic
markets
Polypropylene
28
259
170
97
0
100
200
300
3Q FY19 2Q FY20 3Q FY20
$/M
T
PP- Propylene 5 Year Avg

(Source: Platts, ICIS)
PVC-EDC - Naphtha➢ PVC margins softened marginally with firm naphtha
▪ PVC and EDC prices softened by 4%, 8% QoQ
➢ Global demand growth sustained despite trade wars and regional
economic challenges
▪ China to add ~3 MMT new PVC capacity by CY21
➢ Healthy demand revival in India post monsoon driven by pipes
used in infrastructure and irrigation sectors
PVC
29
410
499 468
0
200
400
600
3Q FY19 2Q FY20 3Q FY20
$/M
T
PVC-Naphtha-EDC 5 Year Avg

➢ Healthy polymer demand despite economic
concerns
▪ Policy push and budgetary allocation for
infrastructure, agri sectors driving growth
▪ Smart city and water pipeline projects
boosting demand for PE and PVC pipes
30
Domestic Market and RIL Production
RIL
Production
(KT)
3Q FY19 2Q FY20 3Q FY20 9M FY19 9M FY20
PP 763 744 744 2163 2200
PE 571 535 584 1621 1665
PVC 155 201 207 534 604
TOTAL 1489 1480 1534 4318 4468
➢ RIL Polymer production up by 3% YoY and 4% QoQ
▪ Record high PE production post reliability
shutdown in ROGC LLDPE plant
Policy push led to healthy demand in India

Business Outlook – Polymer Chain
31
➢ New export terminal and ethane based crackers
in US driving global supply glut of ethylene
➢ PP supply-demand to stay long in medium term
▪ Demand growth to absorb the supply additions
over next 3-4 years
➢ Increasing import of low cost PE from US to Asia
likely to maintain margin pressure
➢ Global commitment to create a circular economy
for plastics
➢ Phase 1 trade deal between US and China likely
to boost regional polymer demand
➢ India will continue to lead global polymer demand
growth driven by
▪ Structural changes in workforce mix and
urbanization
▪ Policy initiatives aimed at agri and infrastructure
growth
➢ E-commerce sector in Asia Pacific is poised to
grow at ~25% CAGR over CY18-23
▪ To boost regional polymer demand for innovative
packaging solutions
Challenges Opportunities

Polyester Chain
32

Integrated Polyester Margin
0
100
200
300
400
500
600
700
800
900
3Q FY19 2Q FY20 3Q FY20
$/M
T
PX delta for PES PTA delta for PES
MEG delta for PES Wt. Avg PES delta
5 Yr Avg Chain Term Delta
*Last 5 year Avg Margin
RIL integrated operations helped weather market volatility
Polyester Chain Margins Under Pressure
33
463
819
617
➢ Chain margins significantly below 5-Year average
➢ Large capacity additions of PX and PTA in China major
contributor to lower chain delta
▪ Strong naphtha further impacted chain margins
➢ MEG markets also affected by volatility across the chain
➢ PET delta impacted amidst seasonal lull

(Source: Platts, ICIS)
MEG-NaphthaPX-Naphtha PTA-PX
547
306255
0
100
200
300
400
500
600
$/M
T
PX-Naphtha 5 Year Avg
374
224204
0
200
400
600
$/M
T
MEG-Naphtha 5 Year Avg
184 179
110
0
50
100
150
200
$/M
T
PTA-PX 5 Year Avg
➢ PX deltas impacted by large new supplies (4.8 MMT), partially offset by lower condensate/MX runs and diversion of feedstock
for gasoline blending
➢ PTA deltas declined sharply with 6 MMTA of new supply; plant shutdowns, firm polyester operating rates supported operations
➢ MEG prices firmed amidst curtailed output, fall in Chinese port inventory (-46% QoQ) and firm Naphtha
▪ QoQ MEG delta down 9%. However, non-naphtha based MEG producers benefitted due to differential in feed prices
Fiber Intermediates Delta Scenario
34

(Source: Platts, ICIS)
PSF-PTA/MEGPOY-PTA/MEG PET-PTA/MEG
208
308
257
0
50
100
150
200
250
300
350
$/M
T
POY-PTA/MEG 5 Year Avg
131
167
140
0
50
100
150
200
250
$/M
T
PSF-PTA/MEG 5 Year Avg
170155
132
0
50
100
150
200
250
300
350
$/M
T
PET-PTA/MEG 5 Year Avg
➢ Lower price impacted margins but coupled with low inventory led to higher sales and operating rates
➢ Seasonal lull and fluctuations in feedstock impacted PET deltas
Polyester Delta Scenario
35
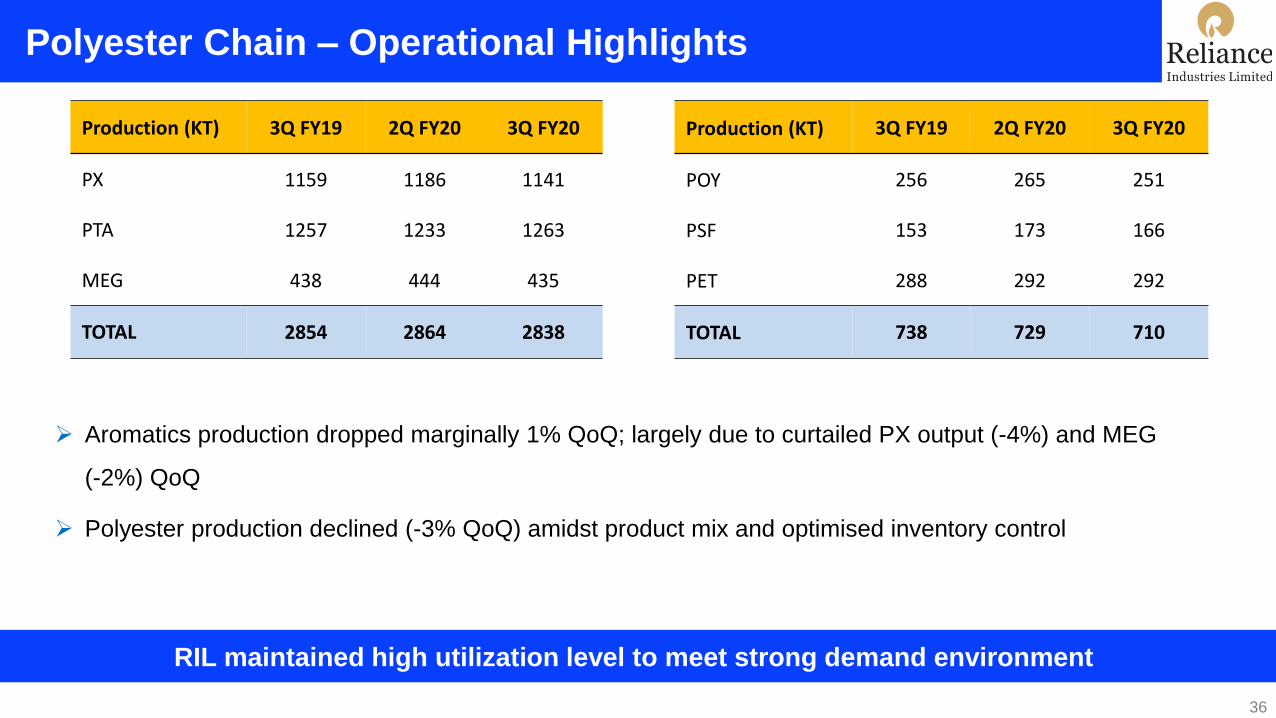
➢ Aromatics production dropped marginally 1% QoQ; largely due to curtailed PX output (-4%) and MEG
(-2%) QoQ
➢ Polyester production declined (-3% QoQ) amidst product mix and optimised inventory control
Production (KT) 3Q FY19 2Q FY20 3Q FY20
PX 1159 1186 1141
PTA 1257 1233 1263
MEG 438 444 435
TOTAL 2854 2864 2838
Production (KT) 3Q FY19 2Q FY20 3Q FY20
POY 256 265 251
PSF 153 173 166
PET 288 292 292
TOTAL 738 729 710
RIL maintained high utilization level to meet strong demand environment
Polyester Chain – Operational Highlights
36

➢ PX markets to remain well-supplied with start-up of new capacities. Ramp-up of units to guide market dynamics
▪ All major expansions factored into the market sentiments already
➢ PTA markets likely to face capacity overhang. Profitability of high cost producers to guide demand-supply
scenario
➢ MEG markets to remain oversupplied with startup of new capacities. Acceptability of new coal-based MEG to
guide market sentiments.
➢ Planned shutdowns during Chinese New Year Holidays and low Polyester stocks likely to keep sentiments
healthy in the near term
➢ 4Q FY’20 is traditionally strong demand season for Indian polyester markets, especially PET with resurgence of
summer demand
➢ Ban of PET flakes imports to support domestic virgin PSF industry
➢ RIL continues to promote sustainability through its product range of ‘green-fibres’
Business Outlook – Polyester Chain
37

Oil & Gas
38

Domestic E&P - Production Update
3Q FY20 (JV Production) KG D6 Panna Mukta CBM
Gas Production (Bcf) 4.96 11.27 3.05
Oil Production (mmbbl) - 0.84 -
Gas realization ($/mmbtu) 3.23 (GCV) 5.73 (NCV) 6.70(GCV)
Oil realization ($/bbl) - 61.7 -
Note: RIL share of total domestic production at 11.2 BCFe
KG D6
➢ Average Gas production from D1D3 field for the quarter is 1.53 MMSCMD with 3 wells flowing
➢ Field is in a late life stage with challenges associated with sand & water ingress
Panna Mukta
➢ Average production for the quarter for gas is 3.9 MMSCMD and ~10,340 BOPD for Oil
➢ PSC of PMT expired on 21st Dec 2019
➢ Panna-Mukta field facilities and operations safely handed over to GoI nominee – ONGC
CBM
➢ Produced 86.25 MMSCM (Average 0.94 MMSCMD) of Gas in 3Q FY20
➢ 232 wells are flowing with steady production of ~0.95 MMSCMD 39

KG D6: R Cluster Development on Track for First Gas in Mid-2020
➢ Fabrication & Testing of all components (XMT, Subsea Structures, Umbilicals,
Control System) completed
➢ First offshore installation campaign (Dec’18–May’19) completed successfully:
▪ Deepest gas evacuation pipeline in India laid in ~2000m water depth, tied to
Risers at Control Riser Platform (CRP)
▪ MEG pipelines, Umbilicals and foundation for structures installed
➢ Second offshore installation Campaign commenced
▪ Three out of five infield flowlines, Subsea Structures installed –
▪ R-DWPLEM weighing 340 MT installed in 1,922 m WD (Deepest in India);
▪ CRP Topside Modification works commenced
➢ Drilling & Lower Completion: All 6 wells completed; Upper completion and
Clean-up completed for 2 out of 6 wells successfully
➢ Onshore Terminal: modification and testing work ongoing to make it ready to
receive R-Cluster Gas40

Other Updates
KGD6 – Other Project Updates
➢ Satellite Cluster
▪ Top hole drilling completed for 3 out of 5 wells
▪ First Offshore Installation Campaign being taken up along with R Cluster installation campaign:
➢ Foundations of subsea structures installed
➢ 16” pipeline - installation planned by end Jan 2020
➢ MJ Development –
▪ Engineering ongoing for Subsea Production Systems (SPS), Floating Production Storage Offload (FPSO) and
Subsea Installation.
▪ First phase of Drilling to commence in 4Q FY20
➢ Assignment of NIKO’s PI to RIL & BP is approved by GoI and PSC is amended
▪ RIL’s PI in block KG D6 is 66.67% and BP’s is 33.33%
CBM: Phase-II –With the start-up of additional Gas Gathering Station, 67 wells will be put on production progressively
41

R Cluster: Xmas Tree
42
XMT, 71 tons in weight. 6 such structures to be installed on sub-sea wells for regulating gas production
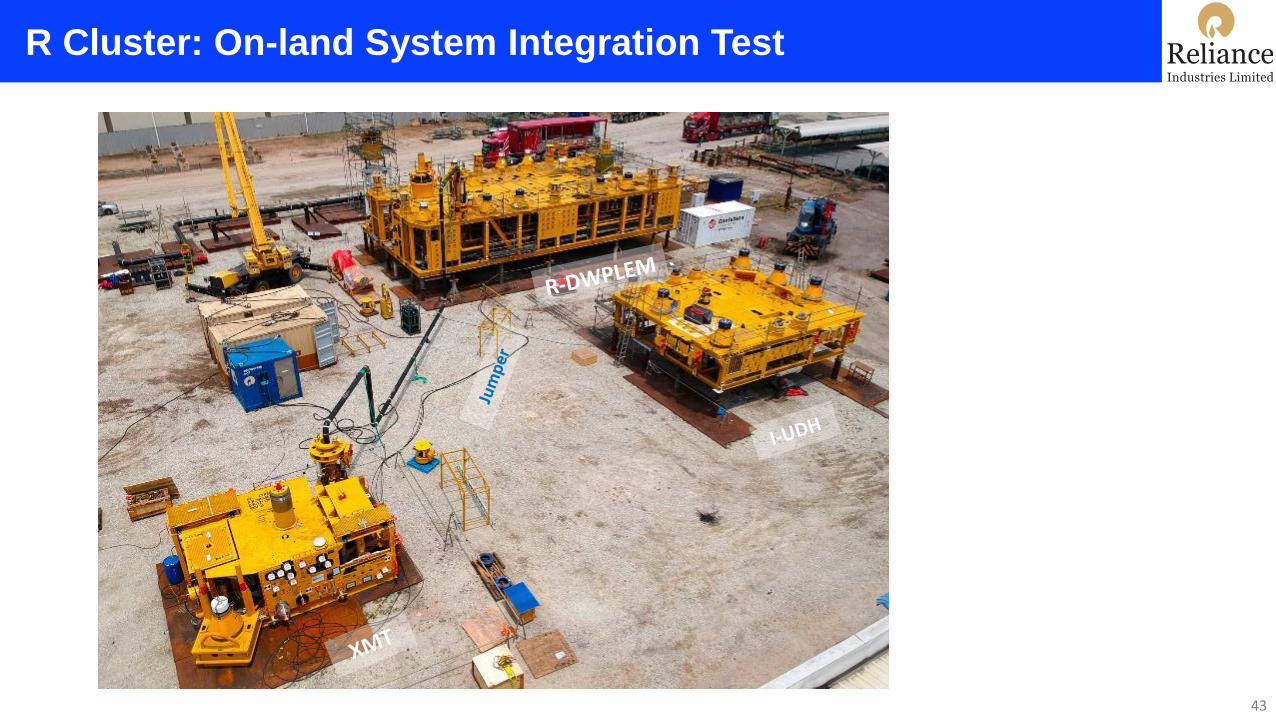
R Cluster: On-land System Integration Test
43
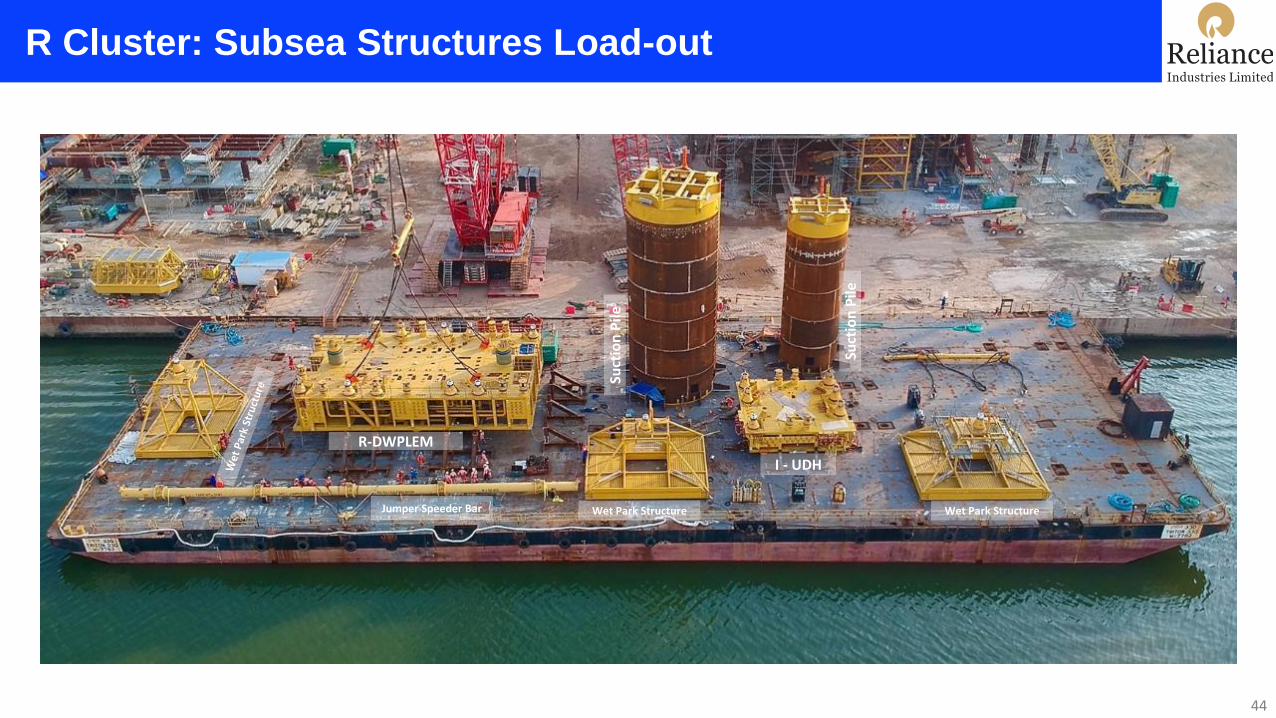
R Cluster: Subsea Structures Load-out
44
R-DWPLEM
I - UDH
Suct
ion
Pile
Wet Park Structure Wet Park StructureJumper Speeder Bar
Suct
ion
Pile

R Cluster: Installation Vessels
45
Pipeline Installation Vessel: DLV2000 Deepwater Pipeline Installation Vessel: Audacia
Diving Support Vessel – Kreuz Challenger Construction Vessel: Southern Ocean
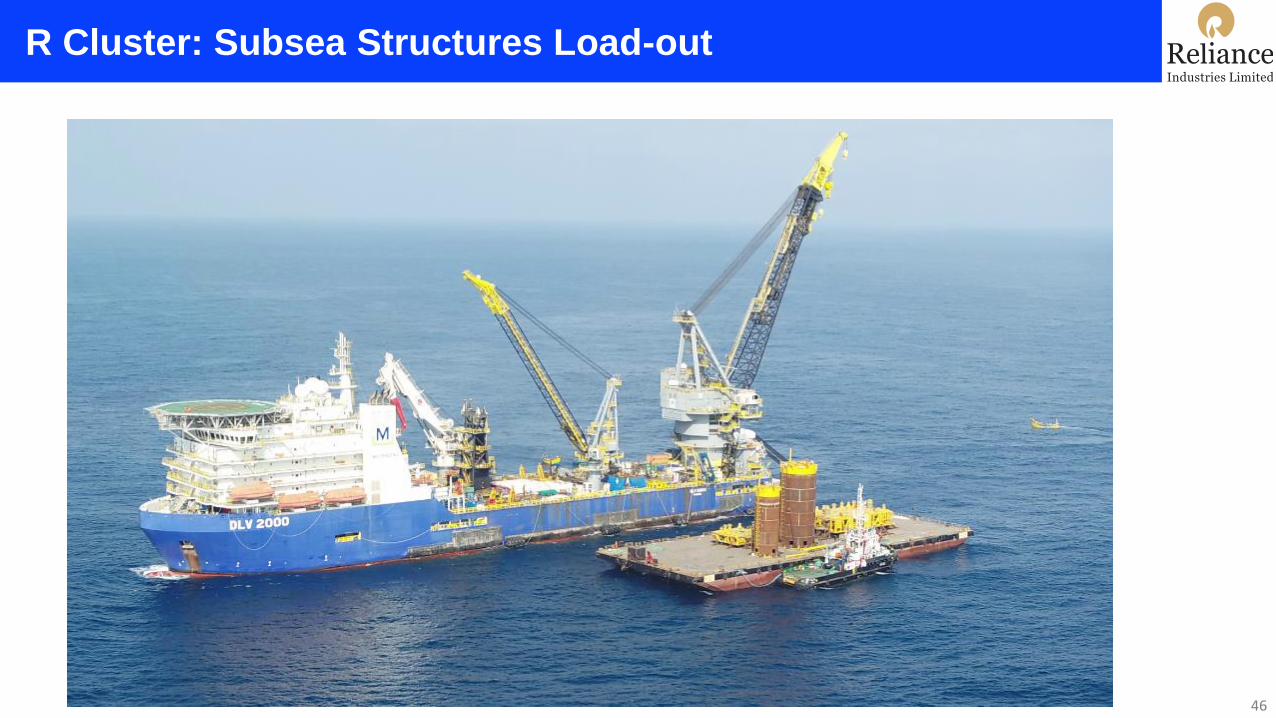
R Cluster: Subsea Structures Load-out
46

R Cluster: Rig DDKG1 - XMT Installation
47

R Cluster: Pipeline Installation
48

R Cluster: Structure (R-DWPLEM) Installation
49
DWPLEM, weighing 340 Metric Ton, installed in 1,922 m water depth – Deepest in India

R Cluster: Structure (I-UDH) Installation
50

R Cluster: Riser Installation
51
Longest dual riser (108 m) ever installed in
Indian waters

US Shale - Business Performance
52
➢ Volumes higher 20% QoQ as new wells put on
production in both the assets (8 in Marcellus and 13
in Eagle Ford). More volumes expected in 1QCY20
➢ Blended realization 12% higher QoQ and 28% lower
YoY. Commodity realizations improved mainly for
NGLs
➢ Revenue of $64 MM and EBITDA of $(7) MM;
improved by $18 MM and $12 MM respectively QoQ
➢ Good operational performance in terms of costs,
production and cycle time in Eagle Ford
➢ Development activity slowed down in Marcellus JV

53

Reliance Retail – Key Highlights
54
Continues to scale new heights
➢ Another quarter of highest ever revenues and EBITDA
➢ 15th straight quarter of revenue and profits growth in-tandem
➢ Strong and broad based performance across Consumer Electronics, Fashion & Lifestyle and Grocery
▪ Double-digit growth, double-digit LFL and margin expansion across consumption baskets
➢ Operating leverage and efficiencies contribute to sustained EBITDA margin improvement
➢ Crossed 11,000 store milestone with rapid store expansion; opened over 1,000 stores in 9M FY20

Results Highlights
55
Sustained strong revenue and profit growth
3QFY20 3QFY19% Change
wrt 3QFY19Metric 9MFY20 9MFY19
% Change
wrt 9MFY19
45,327 35,577 27% Segment Gross Revenue 1,24,725 93,903 33%
40,660 31,798 28% Segment Net Revenue 1,11,871 83,738 34%
2,727 1,680 62% Segment EBITDA 7,098 4,278 66%
6.7% 5.3% +140 bps Segment EBITDA Margin (%) 6.3% 5.1% +120 bps
➢ Strong growth across consumption baskets in a challenging market environment
➢ LFL and new store openings contribute to balanced growth across segments
➢ Consumer Electronics, Fashion & Lifestyle and Grocery deliver higher growth at 36% Y-o-Y
▪ EBITDA margin at 9.6% vs 8.0% last year, contributing 87% of overall EBITDA
➢ 9M FY20 surpasses full year FY19 profit numbers
All Figures in Rs Crore
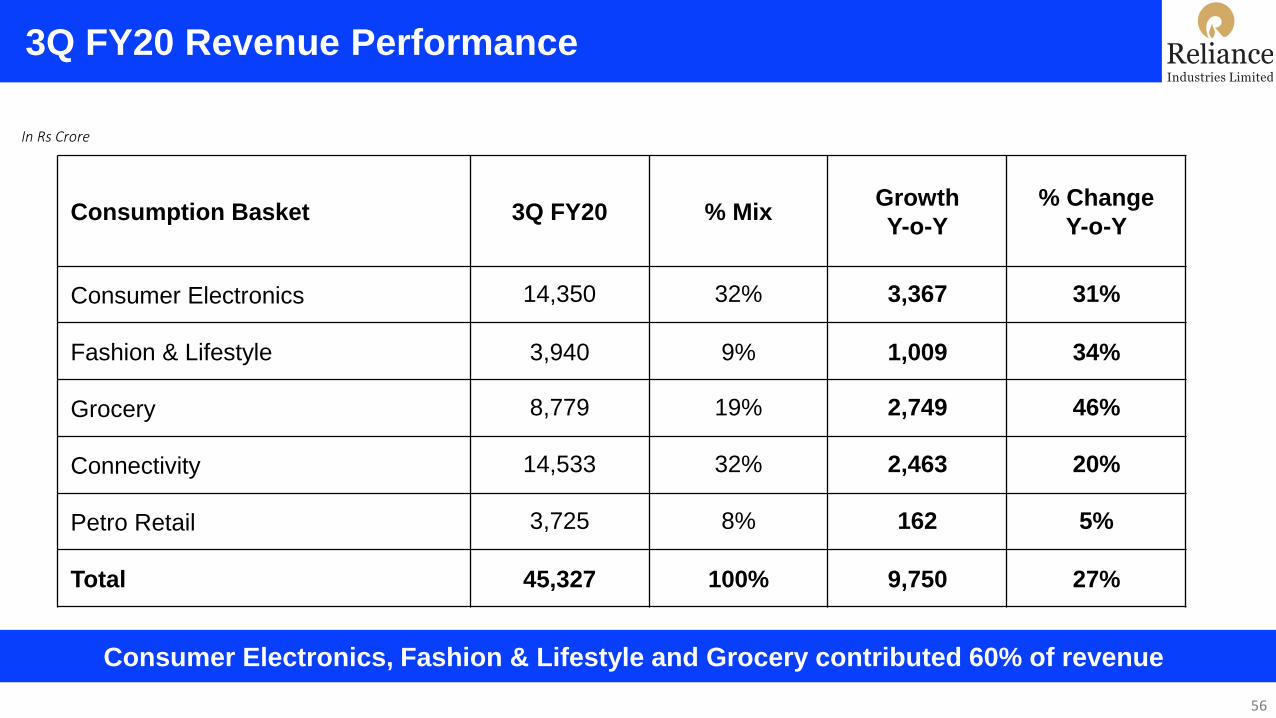
3Q FY20 Revenue Performance
56
Consumer Electronics, Fashion & Lifestyle and Grocery contributed 60% of revenue
Consumption Basket 3Q FY20 % MixGrowth
Y-o-Y
% Change
Y-o-Y
Consumer Electronics 14,350 32% 3,367 31%
Fashion & Lifestyle 3,940 9% 1,009 34%
Grocery 8,779 19% 2,749 46%
Connectivity 14,533 32% 2,463 20%
Petro Retail 3,725 8% 162 5%
Total 45,327 100% 9,750 27%
In Rs Crore

Widest Customer Reach
57
117 mm Registered customers
176 mm Footfalls
165,000+ Transaction every hour
Growth of 43% Y-o-Y
Growth of 26% Y-o-Y
Growth of 18% Y-o-Y

Unmatched Operating Scale
58
450 mm units of grocery sold
51 mm Garments sold
5 mm units of electronics sold
Growth of 13% Y-o-Y
Growth of 44% Y-o-Y
Growth of 50% Y-o-Y

Sustaining Track Record of Growth & Profit
59
Recorded 15 consecutive quarters of sustained revenue and profit growth
5,646 6,666 8,079 8,688 10,332
11,571
14,646
18,798
24,183
25,890
32,436 35,577
36,663
38,196
41,202
45,327
221 240 264 333 366 398 444 606
1,086 1,206
1,392
1,680
1,923 2,049
2,322
2,727
4Q 1Q 2Q 3Q 4Q 1Q 2Q 3Q 4Q 1Q 2Q 3Q 4Q 1Q 2Q 3Q
FY 2016-17 FY 2017-18
EBITDA
Gross Sales
Sales growth of
74% CAGR*
EBITDA growth of
95% CAGR*
* Annualised CAGR for 15 quartersFY 2018-19 FY 2019-20
₹ Crores

Key Drivers of Revenue Growth
60
Consumer centric approach
➢ Opened 456 stores with high focus on expansion in Tier 2 and smaller
towns
➢ Diverse portfolio and wide assortment with compelling value driving
increase in footfalls
➢ Impactful consumer offers and instore activations resulted in strong
sales during the festive period
➢ Segmentation of formats enabling driving customer engagement and
store productivity
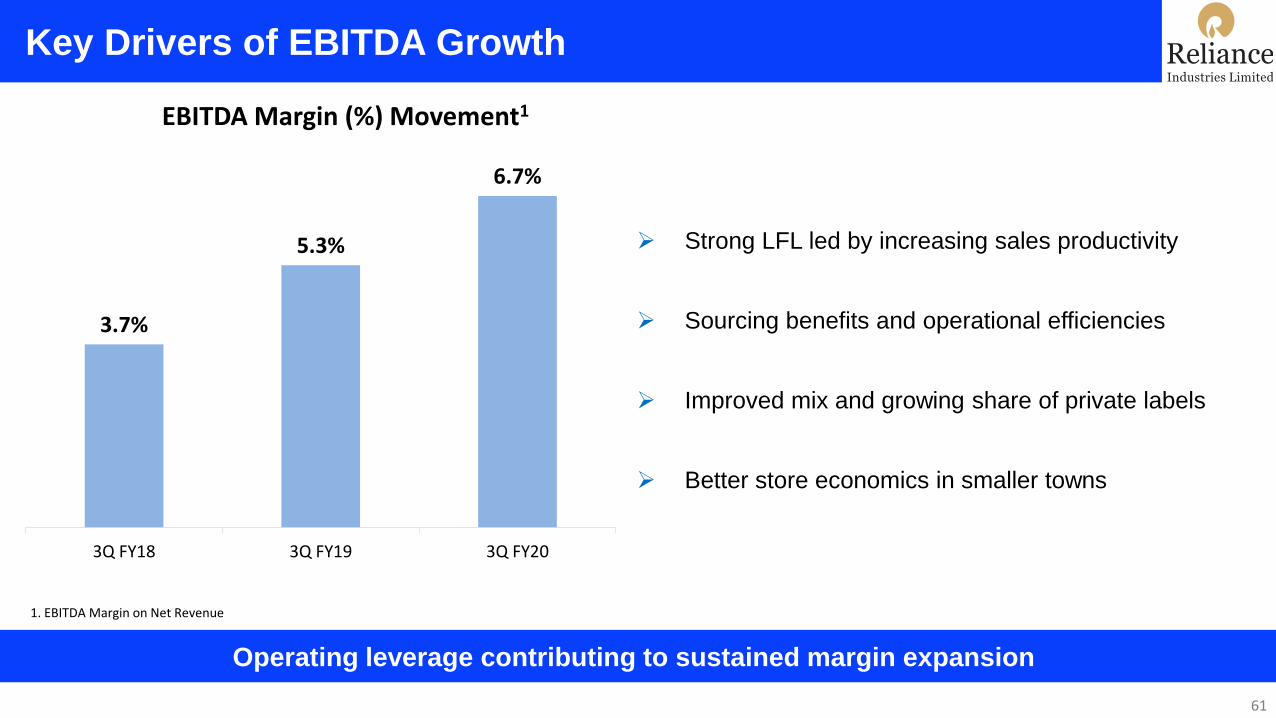
Key Drivers of EBITDA Growth
61
Operating leverage contributing to sustained margin expansion
3.7%
5.3%
6.7%
3Q FY18 3Q FY19 3Q FY20
EBITDA Margin (%) Movement1
➢ Strong LFL led by increasing sales productivity
➢ Sourcing benefits and operational efficiencies
➢ Improved mix and growing share of private labels
➢ Better store economics in smaller towns
1. EBITDA Margin on Net Revenue

Reliance Retail Store Network
62
Store openings across consumption baskets
Total North South West East
Consumer
Electronics8,397 1,965 2,036 2,303 2,093
Fashion & Lifestyle 2,196 523 855 510 308
Grocery 723 105 295 237 86
Total Store Count 11,316 2,593 3,186 3,050 2,487
Total Area (mm
Sqft)26.3 5.0 10.1 7.2 4.1
3Q FY20 9M FY20
160 395
243 544
53 118
456 1,057
1.9 4.3
Store Additions

63
Performance By Consumption Baskets

Consumer Electronics
64
8,300+ Stores
140 ResQ Service Centers
6,900+ Cities
65 Mn+ Footfalls in 3Q FY20

Performance Highlights – Consumer Electronics
65
Consumer offers and financing drive strong 14% LFL growth ahead of market
➢ 160 stores added in the quarter; Digital crossed 400 store milestone
➢ Focus on gaming range of laptops drives 2x growth
➢ Exclusive offline One Plus TV launch; Strong iPhone sales
➢ Jio Phone offer at Rs 699, drives robust offtake
➢ Accelerated growth at over 40% across Tier 2 and smaller Towns
➢ Exclusive partnerships on consumer financing; contributing over half of sales
➢ Strong festive season performance

Festive Sales Update
66
Outperforming broader market across categories
➢ Registered strongest Diwali season
▪ Over 7,000 customers served every hour
▪ Sold 300 TVs, 180 Washing Machines, 120 Refrigerators every hour
➢ Recorded high double-digit LFL growth across all regions
➢ Enhanced customer experience through faster checkouts and financing turnaround

Fashion & Lifestyle
67
2,100+ Stores
400+ Cities
50 Mn+ Footfalls in 3Q FY20
~50 International Partner Brands
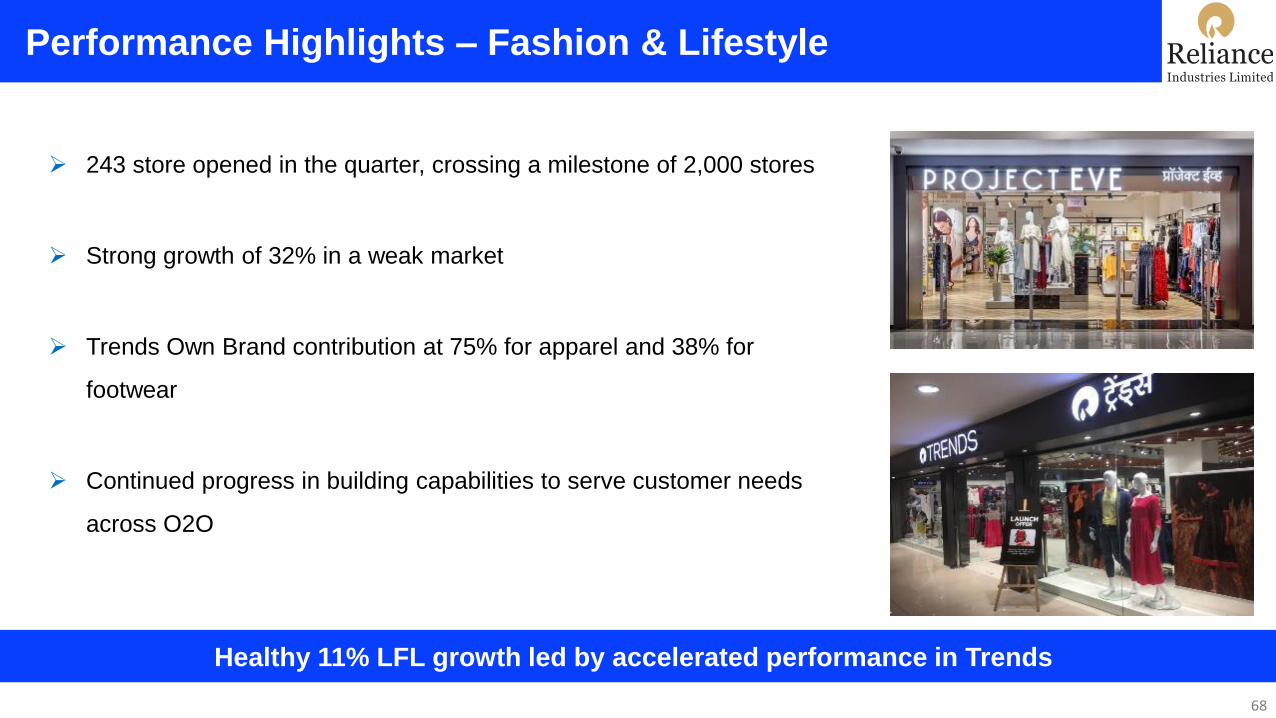
Performance Highlights – Fashion & Lifestyle
68
Healthy 11% LFL growth led by accelerated performance in Trends
➢ 243 store opened in the quarter, crossing a milestone of 2,000 stores
➢ Strong growth of 32% in a weak market
➢ Trends Own Brand contribution at 75% for apparel and 38% for
footwear
➢ Continued progress in building capabilities to serve customer needs
across O2O

Performance Highlights – Trends and Footwear
69
Consolidating position as India’s largest Fashion & Lifestyle Retail Chain
➢ 174 new stores added in the quarter
➢ Trends Small Town Stores continues to extend its presence across
Tier 3 towns, with over 100 stores now serving 2mm+ customers
➢ Trends Women garnering strong customer traction; new winter-
fusion wear range well received
➢ Endless aisle kiosks in 750 stores contribute 33% to O2O business
➢ ‘Drop at Store with Cash Refund’ & ‘Pick at Store’ now in Bangalore
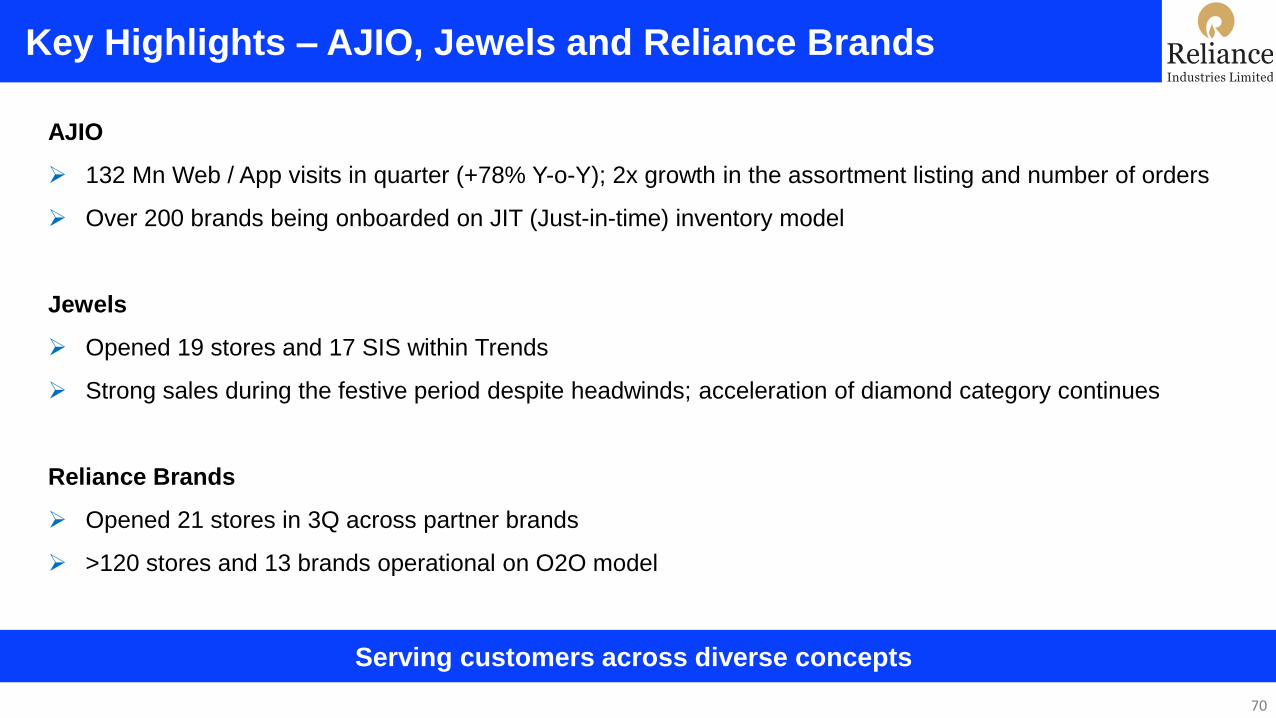
Key Highlights – AJIO, Jewels and Reliance Brands
70
Serving customers across diverse concepts
AJIO
➢ 132 Mn Web / App visits in quarter (+78% Y-o-Y); 2x growth in the assortment listing and number of orders
➢ Over 200 brands being onboarded on JIT (Just-in-time) inventory model
Jewels
➢ Opened 19 stores and 17 SIS within Trends
➢ Strong sales during the festive period despite headwinds; acceleration of diamond category continues
Reliance Brands
➢ Opened 21 stores in 3Q across partner brands
➢ >120 stores and 13 brands operational on O2O model

Impactful Activations Across F&L
71
Consolidating position as India’s largest Fashion & Lifestyle Retail Chain

Grocery
72
700+ Stores
14% share of Own Brands
160+ Cities
61 Mn+ Footfalls in 3Q FY20

Performance Highlights – Grocery
73
12% LFL driven by strong festive season sales
➢ 53 new stores added in the quarter
➢ Launch of new concept – Smart Point, one stop, multi-purpose store
➢ Strong revenue growth in Staples, Fresh and Dairy
➢ Collaboration with vendors leads to FMCG portfolio growth of >25%
➢ Value apparel now in 100 SMART stores contributing ~10% of sales
➢ Premiumization of Fresh stores in select catchments initiated
➢ Expanding assortment of premium F&V in select stores

Launch of SMART Point
74
Multi-purpose SMART Point to drive ‘Everyday Savings’ for customers
➢ SMART Point is a smaller avatar of a SMART store with presence in
residential neighborhood with SMART’s price promise
➢ Serving every day multi-purpose needs of consumers:
➢ Grocery
➢ Pharmacy
➢ Assisted e-commerce
➢ Unparalleled execution - Concept to launch in <45 days
➢ 18 stores launched Navi Mumbai, Thane and Kalyan in end Dec

Festive Sales Updates
75
Highest Ever festive sales
➢ Strong festive performance; SMART stores grew >60%
➢ Indian Sweets became the largest FMCG category
➢ Strong growth on dry fruits driven by gift packs
➢ Contribution of GM and Apparel at 15% (12% LY) in SMART
➢ Own Brands portfolio doing very well (now 14% contribution to
business)
➢ Differentiated “Mix and Match” promotion across brands

Petro Retail
76
518 Petro Outlets
> 538 mLitres of Fuel sold in 3QFY20
Trans-connect loyalty program

Performance Highlights – Petro Retail Owned Outlets
77
Continues to deliver throughput higher than industry average
➢ 518 owned retail outlets operational as of Dec 31, 2019
➢ Witnessed strong volume growth YoY across petroleum
products
▪ HSD volume grew by 13% Y-o-Y
▪ MS volume grew by 10% Y-o-Y
➢ Launched ‘Driver 1st', India’s first card-less Driver Loyalty
Program for Commercial Vehicle operators
➢ Trans-connect (loyalty program) customers contribute to
over a 3rd of sales

3Q FY20 Summary
78
Sustaining strong track record of performance: Consistent, Competitive, Profitable
➢ Retail registered a strong performance underpinned by consistent strategy, sharp operational execution and a
robust business model
➢ Highest ever revenues and EBITDA in a quarter
➢ In the context of a slowing growth environment, the business delivered robust revenue growth
➢ Strong improvement in operating profit with EBITDA growing at 62% and margin improving +140 bps Y-o-Y
➢ Broad based growth with key Consumption Baskets registering another quarter of double digit growth and margin
improvement in tandem
➢ The business added 456 new stores during the quarter, taking the overall count to 11,316 stores

Reliance Jio Infocomm Limited

Highlights
Sustained growth momentum despite introduction of IUC tariffs
80
1. Jio continues to be the Operator of Choice
▪ Strong gross additions of 37.1 million during the quarter; subscriber base at 370.0 million
2. Becomes net recipient of access charges within 2 months of implementation of IUC tariffs
▪ IUC tariffs introduced in Oct-2019 owing to regulatory uncertainties
▪ Associated elimination of excessively heavy voice users; underlying churn remains stable
Strong financial performance during the quarter
▪ EBITDA of Rs 5,601 crores
▪ ARPU at Rs 128.4 (including access revenue); expected to improve in line with recharge cycle
3. Jio Platforms Limited, a wholly owned subsidiary of RIL to house all digital platforms and
the underlying connectivity businesses, formed
1
2
3
4

Rapid Expansion of Digital Ecosystem
Relentless customer focus, wider network presence and attractive bundling of
digital services to sustain growth
81
Gross adds in 3QFY20 highest in
past five quarters
Customer engagement healthy with monthly
per capita usage of 11.1 GB and 760 mins
Gross Additions on TTM basis (in millions)
Subscribers as of Dec’19
370 million105.8
128.0 132.9138.1 141.3
131.3 135.6
Jun-18 Sep-18 Dec-18 Mar-19 Jun-19 Sep-19 Dec-19

Jio Becomes Net Recipient of Access Charges
Leading to efficient use of network resources
82
During the quarter, Jio introduced IUC tariff
in response to regulatory developments
On expected lines, traffic mix improved
significantly
Associated elimination of excessively
heavy voice users
Elimination of 22 million during the
quarter – primarily excessively heavy voice
users
Change in offnet traffic mix during the
quarter
Outgoing,
61.8%
Incoming,
38.2%
10th October 2019 31st December 2019
Outgoing,
47.5%Incoming,
52.5%
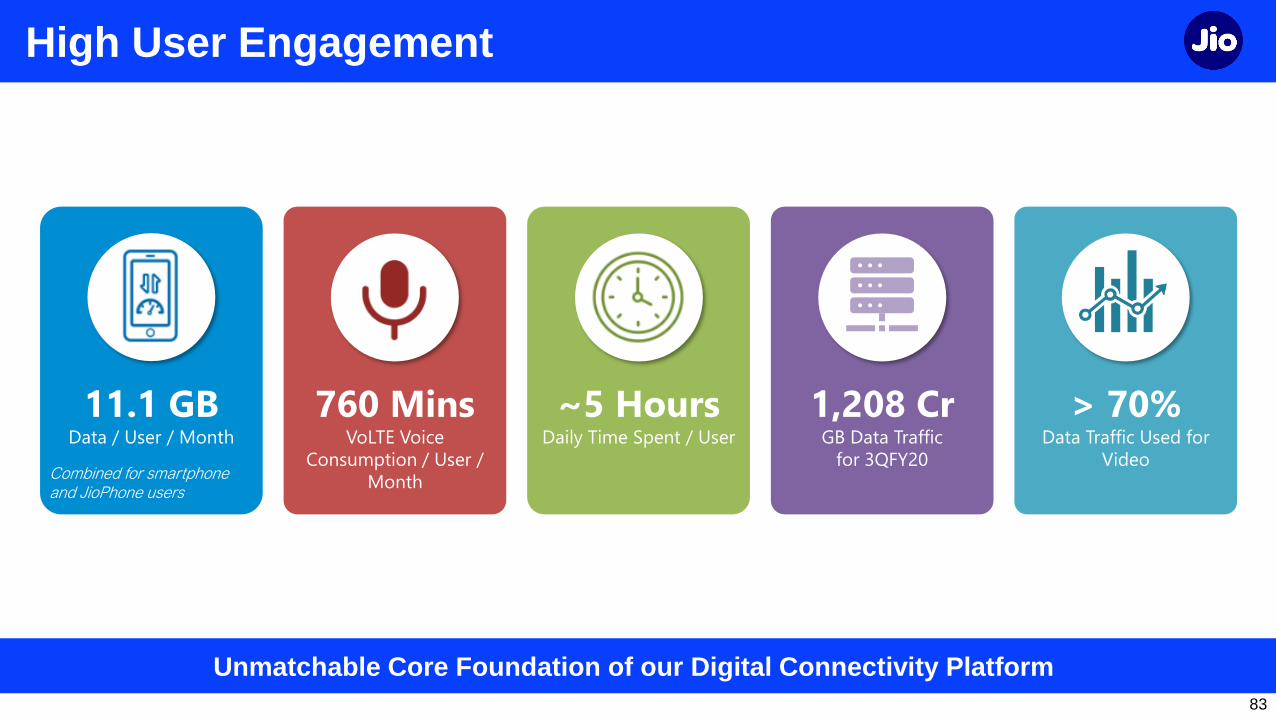
High User Engagement
Unmatchable Core Foundation of our Digital Connectivity Platform
> 70%Data Traffic Used for
Video
760 MinsVoLTE Voice
Consumption / User /
Month
~5 HoursDaily Time Spent / User
11.1 GBData / User / Month
1,208 CrGB Data Traffic
for 3QFY20Combined for smartphone and JioPhone users
83

Jio’s VoWiFi – Seamless Migration From LTE to Wi-Fi
Over 5 million unique users within 7 days
84
➢ Enables Jio subscribers across India to make / receive voice & video calls from any Wi-Fi
environment along with seamless mobility with LTE, at no additional cost
➢ Seamless switch over between VoWiFi and VoLTE
➢ Embedded calling function, no OTT application required
➢ Synergized with major handset OEMs covering over 150 handsets to enable VoWiFi
➢ Offload traffic from cellular network and enhance spectrum efficiency
➢ Boost overall network experience for both indoor and on-the go subscribers

JioFiber offering for Connected Homes
85
Get access to content across Movies + TV shows +
Video on Demand
Unparalleled reach and bouquet of offerings to revolutionize wireline services in the country

JioTV+ | All your videos in One App!
86
Unique interface with unified search experience

Enterprise Opportunity
Uniquely positioned to capture the expanding ICT Market
87
Opportunity
➢ Low ICT spend for enterprises in India compared to
global peers; underpenetrated SMB market
➢ Telcom operators capture an even smaller percentage
of the ICT spend
Jio’s unique value proposition
➢ Bundled and vertical based solutions to tap latent
demand especially in the SMB market
➢ Distinctive digital solutions through partnerships
➢ Converged fixed and mobile services
➢ Unparalleled network reach
Education Call Centre Hospitality
BFSI IT/Technology Healthcare
Logistics RetailProfessional
Services
Manufacturing Media Smart City

Robust Financial Performance
Healthy financials; strategy in place to accelerate the growth engine
88
➢ Strong customer traction sustains double-digit revenue growth
➢ Operational efficiencies and improving traffic mix reflected in improving profitability
Operating Revenue (in Rs crore) EBITDA (in Rs crore)
10,884 11,715
12,383 13,130
13,968
Dec-18 Mar-19 Jun-19 Sep-19 Dec-19
4,053 4,330
4,686 5,166
5,601
Dec-18 Mar-19 Jun-19 Sep-19 Dec-19

89
Structure in place to capture the next surge of growth
Jio Platforms Limited
Reliance Industries
Limited
Jio Platforms Limited
100%
Wireless Home
Broadband
Enterprise
Broadband
Reliance Jio Infocomm Limited
Investments
JioSaavn
Embibe
Jio Platforms Limited houses domain and
technology expertise across verticals –
benefits from presence of Reliance Group
in these verticals – and has Jio apps
RJIL is the licensed connectivity business, offering connectivity
services across wireless and wireline technologies

InvIT Update
Brookfield and affiliates will invest Rs 25,215 crore in Tower InvIT
➢ Binding agreements entered into with Brookfield Infrastructure Partners LP and its
institutional partners for investment in the units to be issued by the Tower InvIT
▪ At Closing of the Transaction, Tower InvIT will own 100% of the issued and paid up
equity share capital of Reliance Jio Infratel Private Limited, the tower SPV
▪ Closing of the transaction expected shortly
➢ Finalisation of transaction terms with investors for the Fibre InvIT in progress

Appendix

Key Operating Metrics
92
➢ Strong gross adds at 37.1 million –
highest in past five quarters
➢ Elimination of excessively heavy voice
users; underlying churn remains stable
➢ Per capita usage healthy at 11.1 GB and
760 mins per user per month
Key operating metrics trending well despite industry events
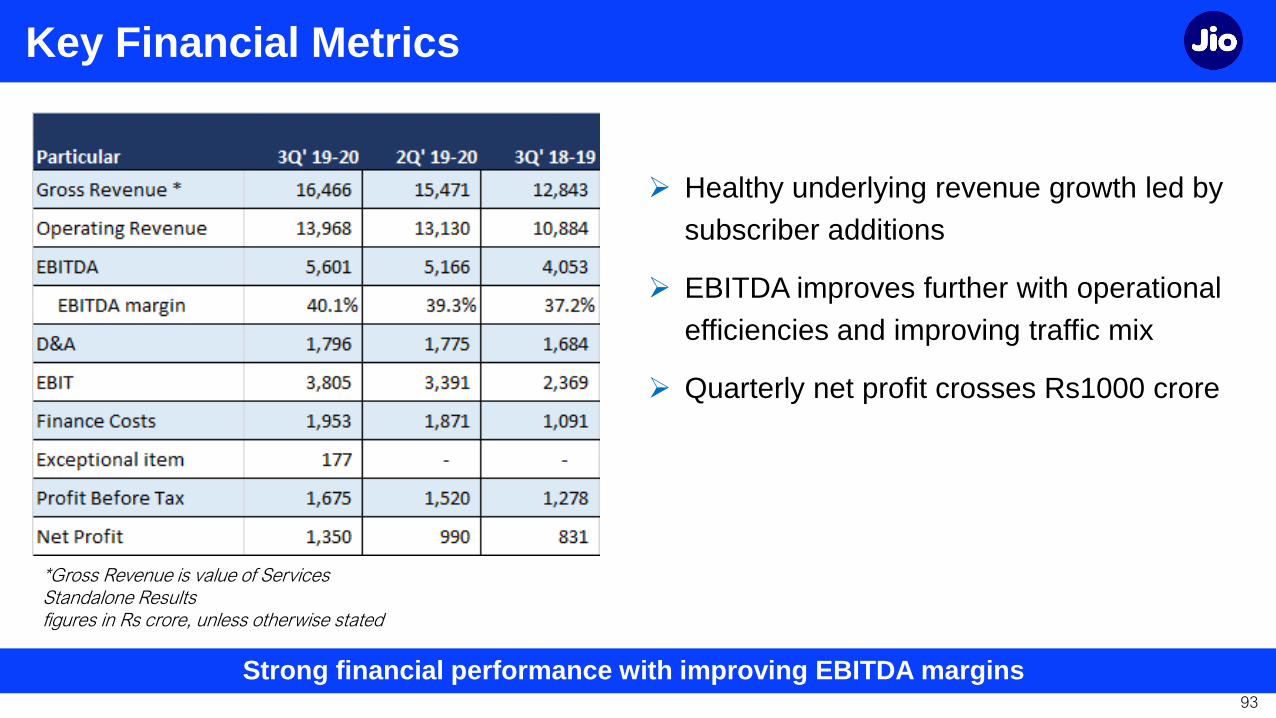
Key Financial Metrics
93
➢ Healthy underlying revenue growth led by
subscriber additions
➢ EBITDA improves further with operational
efficiencies and improving traffic mix
➢ Quarterly net profit crosses Rs1000 crore
*Gross Revenue is value of ServicesStandalone Resultsfigures in Rs crore, unless otherwise stated
Strong financial performance with improving EBITDA margins

Growth is Life . . . .
94