Embed Size (px)
Citation preview

February 2012
3M™ LEADCHECK™ SWABS QUALITATIVE SPOT TEST KIT FOR LEAD IN PAINT
Prepared by Battelle
for
February 2012
3M™ LEADCHECK™ SWABS QUALITATIVE SPOT TEST KIT FOR LEAD IN PAINT
by
Stephanie Buehler and Dale Rhoda, Battelle
Battelle
Columbus, Ohio 43201

ii
Acknowledgments
The authors wish to acknowledge the support of all those who helped plan and conduct the
verification test, analyze the data, and prepare this report. We also would like to thank Al
Liabastre, ret. U.S. Army Center for Health Promotion and Preventive Medicine; Larry Franklin,
Centers for Disease Control and Prevention, Coordinating Center for Environmental Health and
Injury Prevention, National Center for Environmental Health, Lead Poisoning Prevention
Branch; and Manashi Nath, Assistant Professor, Department of Chemistry, Missouri University
of Science and Technology for their careful review of this verification report. Quality assurance
oversight was provided by Zachary Willenberg, Battelle.

iii
Contents Page
Acknowledgments........................................................................................................................... ii
List of Abbreviations and Acronyms ............................................................................................. vi
Chapter 1 Background ................................................................................................................... 1
Chapter 2 Technology Description ................................................................................................ 2
Chapter 3 Test Design and Procedures .......................................................................................... 5 3.1 Introduction ..........................................................................................................................5 3.2 Test Facility ..........................................................................................................................6
3.3 Test Procedures ....................................................................................................................6 3.3.1 Test Sample Collection, Storage, and Shipment ....................................................... 8 3.3.2 Test Sample Analysis Procedure .............................................................................. 9
Chapter 4 Quality Assurance/Quality Control ............................................................................. 11 4.1 Quality Control Samples ....................................................................................................11
4.1.1 ICP-AES Blank Sample Results ............................................................................. 11
4.1.2 ICP-AES Matrix Spike Samples and Calibration Verification Standards .............. 11 4.1.3 Test Kit Quality Controls and Blank PEMs ............................................................ 12
4.2 Audits .................................................................................................................................12 4.2.1 Performance Evaluation Audits .............................................................................. 12 4.2.2 Technical Systems Audit ........................................................................................ 13
4.2.3 Audit of Data Quality.............................................................................................. 13
Chapter 5 Statistical Methods ...................................................................................................... 14 5.1 False Positive and False Negative Rates ............................................................................14 5.2 Precision .............................................................................................................................15
5.3 Sensitivity ...........................................................................................................................15
5.4 Modeled Probability of Test Kit Response ........................................................................15 5.4.1 Logistic Regression Model Building Steps.............................................................. 15 5.4.2 Accounting for Measurement Error – SIMEX Background and Intuition .............. 16 5.4.3 SIMEX Input and Analysis ...................................................................................... 17 5.4.4 Goodness of Fit ........................................................................................................ 18
5.5 Matrix Effects .....................................................................................................................19 5.6 Operational Factors ............................................................................................................19
Chapter 6 Test Results ................................................................................................................. 20 6.1 False Positive and False Negative Rates ............................................................................20 6.2 Precision .............................................................................................................................23 6.3 Sensitivity ...........................................................................................................................27 6.4 Modeled Probability of Test Kit Response ........................................................................27
6.5 Matrix Effect ......................................................................................................................34 6.6 Operational Factors ............................................................................................................34

iv
Chapter 7 Performance Summary ................................................................................................ 36
Chapter 8 References ................................................................................................................... 38
Figures
Figure 2-1. 3M™ LeadCheck™ Swabs ......................................................................................... 2
Figure 2-2. 3M™ LeadCheck™ Swabs in Use ............................................................................. 3
Figure 2-3. 3M™ LeadCheck™ Swabs Kit ................................................................................... 4
Figure 6-1. Probability curves that represent test kit results that are both perfect (red line) and
within RRP rule criteria (black solid line). ................................................................................... 31
Figure 6-2. Probability curves with shaded region to denote performance results that meet RRP
rule false positive and negative criteria. Test kits with curves that fall within the white region
and avoid the shaded region meet the RRP rule. .......................................................................... 32
Figure 6-3. LeadCheck™ Swabs predicted probability of positive test result (solid lines) with
90% prediction interval (dotted lines)........................................................................................... 33
Tables
Table 3-1. PEMs Testing Scheme for Each Test Kita .................................................................... 8
Table 6-1. The number of panels in each false positive and false negative analysis category .... 21
Table 6-2. LeadCheck™ Swabs false positive results for panels with confirmed lead levels ≤ 0.8
mg/cm2 and false negative results for panels with confirmed lead levels 1.2 mg/cm
2 .............. 22
Table 6-3. LeadCheck™ Swabs false positive results for panels with confirmed lead levels < 1
mg/cm2 and false negative results for panels with confirmed lead levels 1 mg/cm
2 ................. 23
Table 6-4. Actual lead levels and their replicate set labels .......................................................... 24
Table 6-5. The number of panels at each target level and the number in each replicate set bin . 25
Table 6-6. LeadCheck™ Swabs consistency results by operator type, lead type, substrate, and
lead level ....................................................................................................................................... 26
Table 6-7. LeadCheck™ Swabs precision results by lead type and operator type ....................... 27

v
Table 6-8. LeadCheck™ Swabs sensitivity results – lowest lead level for which the kit gave
consistent positive results (mg/cm2) ............................................................................................. 27
Table 6-9. LeadCheck™ Swabs univariate associations between probability of positive response
and explanatory variables ............................................................................................................. 28
Table 6-10. LeadCheck™ Swabs multivariable Stata SIMEX logistic regression parameter
estimates ........................................................................................................................................ 28
Table 6-11. LeadCheck™ Swabs modeled probability of positive test results and upper 95%
prediction bound when lead level = 0.8 mg/cm2........................................................................... 29
Table 6-12. LeadCheck™ Swabs modeled probability of positive test results, lower 95%
prediction bound, and corresponding conservative estimate of the false negative rate when lead
level = 1.2 mg/cm2 ........................................................................................................................ 29
Table 6-13. LeadCheck™ Swabs false positive and negative threshold values (95% confidence)
based on the modeled probability of test results ........................................................................... 34

vi
List of Abbreviations and Acronyms
ASTM American Society for Testing and Materials
CCV continuing calibration verification
COC chain of custody
CRM certified reference material
EPA U.S. Environmental Protection Agency
ESTE Environmental and Sustainable Technology Evaluations
ETV Environmental Technology Verification
ICP-AES inductively coupled plasma-atomic emission spectrometry
LCS laboratory control spike
mg/cm2 milligrams per centimeter squared
mL milliliter
MSDS material safety data sheets
NLLAP National Lead Laboratory Accreditation Program
PE performance evaluation
PEM performance evaluation material
ppb parts per billion
QA quality assurance
QC quality control
QCS quality control sample
RRP Renovation, Repair, and Painting
SOP standard operating procedure
TSA technical systems audit

1
Chapter 1
Background
This report provides results for the performance evaluation of the 3M™ LeadCheck™ Swabs
qualitative spot test kit for lead in paint. For this test, 3M contracted with Battelle. Battelle
served as an independent testing organization to evaluate the performance of the LeadCheck™
Swabs on two substrates, plaster and drywall. First, a test plan was developed, then laboratory
tests were conducted, data were collected and analyzed, and a peer-reviewed report was
prepared. This evaluation was conducted according to rigorous quality assurance (QA) protocols
to ensure that data of known and adequate quality were generated and that the results are
defensible.
This evaluation was conducted in accordance with the Test/QA Plan for Verification of
LeadCheck®, a Qualitative Spot Test Kit for Lead in Paint that was reviewed and approved by
the U.S.Environmental Protection Agency (EPA). This test plan was based on the U.S. EPA
Environmental Technology Verification (ETV) Environmental and Sustainable Technology
Evaluations (ESTE) program test/QA plan1 previously developed, peer-reviewed, and EPA-
approved for the verification testing of qualitative spot test kits for lead in paint.

2
Chapter 2
Technology Description
This report provides results for the testing of the LeadCheck™ Swabs for lead-based paint by
3M™. The following is a description of the LeadCheck™ Swabs, based on information provided
by the vendor. The information provided below was not verified in this test.
3M™ LeadCheck™ Swabs are a self contained kit for the qualitative spot detection of lead in
paint. The swabs have two sealed ampoules, one containing a buffered aqueous solution and the
other containing the proprietary lead indicating dye mixture. The two ampoules are contained by
a plastic tube tipped with a fibrous tip. The swab assembly is surrounded with a protective
cardboard tube. If the glass ampoules are intact, the shelf life of the product is indefinite.
Figure 2-1. 3M™ LeadCheck™ Swabs
To use the 3M™ LeadCheck™ Swabs, the user simply crushes the cardboard at points marked
“A” and “B” and shakes the swab twice. The user, holding the tip down, then squeezes the swab
until a yellow liquid is visible. The user then rubs the swab on the test area for 30 seconds while
continuing to squeeze the tube. If the tip turns red or pink, lead is present. Refer to the
instruction sheet enclosed in each test kit for complete directions.
3M™ LeadCheck™ Swabs are easy to use and self contained. They require no mixing or special
instrumentation. Positive results are typically visible in seconds. 3M™ LeadCheck™ Swabs are
not prone to interference from other metals. The only element that causes the red color is lead.
Since 3M™ LeadCheck™ Swabs are non-toxic, they do not require disposal as hazardous waste.

3
Figure 2-2. 3M™ LeadCheck™ Swabs in Use
3M™ LeadCheck™ Swabs are EPA recognized when used by a certified renovator to determine
if lead-based paint is present on wood and metal. When lead is detected, 3M™ LeadCheck™
Swabs and/or the surface being tested turns pink or red depending on the concentration of lead
present. In the vast majority of test situations results are obtained in less than 30 seconds. When
detecting low levels of lead, or lead chromate containing pigments, results may take longer to
develop. Each kit contains test confirmation cards to verify individual test results.

4
3M™ LeadCheck™ Swabs are available nationwide at home centers, hardware and paint stores
as well as online. 3M™ LeadCheck™ Swabs cost less than $5 per swab and are sold in 2-packs,
8-packs, and contractor packs of 144 swabs.
Figure 2-3. 3M™ LeadCheck™ Swabs Kit

5
Chapter 3
Test Design and Procedures
3.1 Introduction
This test was conducted according to procedures specified in the EPA-approved Test/QA Plan
for Verification of LeadCheck®, a Qualitative Spot Test Kit for Lead in Paint, which was based
on the Test/QA Plan for Verification of Qualitative Spot Test Kits for Lead in Paint.1 Lead-based
paints were commonly used in houses in both interior and exterior applications prior to 1978,
when the US government banned the use of lead-based paint in residential applications. The
term lead-based paint means paint or other surface coatings that contain lead at contents that
equal or exceed a level of 1.0 milligrams per centimeter squared (mg/cm2) or 0.5 percent by
weight.2 This paint still exists in many of these houses across the country. The accurate and
efficient identification of lead-based paint in housing is important to the Federal government, as
well as private individuals living in residences containing such paints. Renovation, repair, and
painting (RRP) activities may disturb painted surfaces and produce a lead exposure hazard. Such
disturbances can be especially harmful to children and pregnant women as lead exposure can
cause neurological and developmental problems in both children and fetuses. In fact, because of
the large amount of pre-1978 housing stock, a report by the President‟s Task Force on
Environmental Health Risks and Safety Risks to Children found that approximately 24 million
US dwellings were at risk for lead-based paint hazards.3
There are lead-based paint test kits available to help home owners and contractors identify lead-
based paint hazards before any RRP activities take place so that proper health and safety
measures can be taken. However, many of these test kits have been found to have high rates of
false positives (i.e., test kit indicates that lead in excess of 1.0 mg/cm2 is present, while in fact
the true lead level is below 1.0 mg/cm2).
4 This test was conducted in response to the call of the
Renovation, Repair, and Painting rule2 for an EPA evaluation and recognition program for test
kits that are candidates to meet the goal of a demonstrated probability (with 95% confidence) of
a false negative response less than or equal to 5% of the time for paint containing lead at or
above the regulated level, 1.0 mg/cm2 and a demonstrated probability (with 95% confidence) of a
false positive response less than or equal to 10% of the time for paint containing lead below the
regulated level, 1.0 mg/cm2. This test incorporated ASTM International‟s E1828, Standard
Practice for Evaluating the Performance Characteristics of Qualitative Chemical Spot Test Kits
for Lead in Paint5 guidelines into the test design.
It should be noted that the ETV ESTE Test/QA Plan for Verification of Qualitative Spot Test Kits
for Lead in Paint1 plan called for wood, metal, drywall and plaster. However, the

6
LeadCheck™ Swabs test is already approved for use on metal and wood. Therefore, with EPA
approval, this test was conducted on drywall and plaster only.
The objective of this test was to evaluate the performance of the LeadCheck™ Swabs for the
detection of lead in paint. This evaluation assessed the capabilities of the lead paint spot test kit
against laboratory-prepared performance evaluation material (PEM) samples and compared the
lead paint test kit results with those of a standard technique, inductively coupled plasma-atomic
emission spectrometry (ICP-AES). Additionally, this test relied on testing staff observations to
assess other performance characteristics of the lead paint test kit. Only qualitative results (e.g.,
detect/non-detect of lead at specified levels) were considered.
The 3M™ LeadCheck™ Swabs kit was tested by evaluating the following parameters:
False positive and false negative rates
Precision
Sensitivity
Modeled probability of test kit response
Matrix effects
Operational factors.
Testing of the 3M™ LeadCheck™ Swabs was conducted from May to September 2011. This
timeframe included testing of the test kit and also completion of all ICP-AES and QC analyses.
False positive and negative rates were determined by comparing test kit responses to actual lead
concentrations of the PEM, as determined through ICP-AES. Precision was determined by
reproducibility of responses for replicate samples. Sensitivity was determined as the lowest
detectable level of the test kit. The modeled probability and matrix effects were determined
using logistic regression models.
Operational factors such as ease of use, operator bias, average cost, average time for kit
operation, helpfulness of manuals, and sustainability metrics such as volume and type of waste
generated from the use of each test kit, toxicity of the chemicals used, and energy consumption
were determined based on documented observations of the testing staff and the Battelle Test
Coordinator. Operational factors were described qualitatively, not quantitatively; therefore, no
statistical approaches were applied to the operational factors.
3.2 Test Facility
Laboratory analyses of the 3M™ LeadCheck™ Swabs were conducted in Battelle laboratories in
Columbus, Ohio. No field testing was conducted during this technology testing.
3.3 Test Procedures
The 3M™ LeadCheck™ Swabs for lead in paint were evaluated against a range of lead
concentrations in paint on various substrates through the use of PEMs. PEMs were 3 inch by 3
inch square panels of drywall or plaster, prepared by Battelle.6 Table 3-1 shows the PEMs

7
prepared for this test kit. Each PEM was coated with either white lead (lead carbonate) or yellow
lead (lead chromate) paint. The paint contained lead targeted at 0.3, 0.6, 1.0, 1.4, 2.0, and 6.0
mg/cm2. These lead concentrations were in concordance with target lead levels for the EPA
ETV ESTE verification test of lead paint test kits, which were chosen with input from the
stakeholder technical panel based on criteria provided in EPA‟s lead RRP rule, as well as to
represent potential lead levels in homes. Paint containing no lead (0.0 mg/cm2) was also applied
to each substrate and tested.
Two different layers of paint were applied over the leaded paint. One was a primer designed for
adhesion to linseed oil-based paint and the second coat was a typical interior modern latex paint
tinted to one of three colors: white, red-orange, or grey-black. The topcoat paint manufacturers‟
recommended application thickness was used. Two coats at the recommended thickness were
applied. Details on the PEM production process can be found in Appendix A.
The 3M™ LeadCheck™ Swabs for lead paint was operated by a technical and non-technical
operator. The technical operator was a Battelle staff member with laboratory experience. The
technical operator was trained by a representative of the vendor company in the operation of its
test kit. The same technical operator operated this test kit throughout testing. Because this lead
paint test kit is anticipated to be used by certified remodelers, renovators, and painters, it was
also evaluated by a non-technical operator. The non-technical operator was a certified renovator
with little to no experience with lead analysis. The non-technical operator was provided the
instruction manual, demonstrational video, and other materials typically provided by the vendor
with the test kit for training. The non-technical operator viewed the materials himself to
understand how to operate the test kit. The non-technical operator was also permitted to ask
questions or clarifications of the vendor on the operation of the test kit. This scenario
approximated the training renovators are expected to receive under the RRP rule.
Tests were performed in duplicate on each PEM by each operator, technical and non-technical
(i.e., two samples were taken from each PEM by each operator). Duplicates were tested in
succession by each operator on a given PEM. PEMs were analyzed blindly by each operator in
that the PEMs used for analysis were marked with a non-identifying number. Test kit operators
were not made aware of the paint type, lead level, or substrate of the PEM being tested. PEMs
were tested in random order (i.e., PEMs were placed in plastic bins and the operators arbitrarily
selected a PEM for analysis). To determine whether the substrate material affected the
performance of the test kit, two unpainted PEMs of each substrate were tested using each test kit,
in the same manner as all other PEMs (i.e., per the test kit instructions). Three PEMs at each
lead level, substrate, and topcoat color were prepared for use in this test. In total, 234 painted
PEMs were prepared for use in the test.

8
Table 3-1. PEMs Testing Scheme for Each Test Kita
Lead Type
Lead Level
(mg/cm2) Substrate
PEMs Analyzed Per Test Kit by Topcoat Color
White Red-Orange Grey-Black Total
Control Blank 0 Drywall 3 3 3 9
Plaster 3 3 3 9
0.3
Drywall 3 3 3 9
Plaster 3 3 3 9
0.6
Drywall 3 3 3 9
Plaster 3 3 3 9
White Lead 1.0
Drywall 3 3 3 9
(Lead Carbonate) Plaster 3 3 3 9
1.4
Drywall 3 3 3 9
Plaster 3 3 3 9
2.0
Drywall 3 3 3 9
Plaster 3 3 3 9
6.0
Drywall 3 3 3 9
Plaster 3 3 3 9
Yellow Lead
(Lead Chromate)
0.3 Drywall 3 3 3 9
Plaster 3 3 3 9
0.6 Drywall 3 3 3 9
Plaster 3 3 3 9
1.0 Drywall 3 3 3 9
Plaster 3 3 3 9
1.4 Drywall 3 3 3 9
Plaster 3 3 3 9
2.0 Drywall 3 3 3 9
Plaster 3 3 3 9
6.0 Drywall 3 3 3 9
Plaster 3 3 3 9
Painted PEMs Subtotal 156 156 156 234
Unpainted PEMs Subtotal (2 per each substrate) 4
238 a Actual number of PEMs used to evaluate performance at specific lead levels varied based on actual concentrations observed during analysis
Paint chip samples from each PEM were analyzed by a National Lead Laboratory Accreditation
Program (NLLAP) recognized laboratory, Schneider Laboratories, Inc., using ICP-AES to
confirm the lead level of each PEM used for testing. The paint chip samples for reference
analyses were collected by Battelle according to a Battelle SOP7, which was based on ASTM
E1729.8 The reference analyses confirmed the lead level of each PEM. Lead levels determined
through the reference analysis were used for reporting and statistical analyses.
The procedures for collecting, storing, and shipping test samples are provided below.
3.3.1 Test Sample Collection, Storage, and Shipment
Chips of lead paint were taken from each PEM and sent for ICP-AES analysis at a NLLAP-
recognized laboratory, Schneider Laboratories, Inc. A glass screw-top vial was labeled with the
PEM identification number located on the back of the panel. The number was also recorded on
the Chain of Custody (COC) form. Sampling was performed per the Battelle SOP for collection
of dried paint samples for lead determination. All safety precautions and personal protective
equipment were used. A one inch square, metal template was placed adjacent to the tested area.

9
A utility knife was used to trace around the template. Tweezers and a utility knife were used to
scrape and remove the paint within the one inch area, using caution to minimize introduction of
the substrate into the paint sample. The topcoat and remaining paint were transferred to a
glassine weighing paper with the assistance of a paintbrush. The sample was then transferred
from the glassine paper into a glass vial using the paintbrush. All instruments and templates were
wiped with tissue paper and the bench top was cleaned and gloves were changed between each
sample to minimize contamination. The paint brush was carefully flicked and tapped over a trash
can to remove any residual lead dust. All wipes and gloves were disposed of as lead waste. The
vials were then collected into a zip-top bag and taped up securely for shipping. The bags and
COC were then shipped together using overnight delivery to Schneider Laboratories, Inc.
Paint chip samples were stored at room temperature as received by Schneider Laboratories, Inc.
and then analyzed by ICP-AES. Analytical results were reported to Battelle within 2-3 days.
Sample digests were stored separately by Schneider Laboratories, Inc. at room temperature.
PEMs were stored individually in zip-top bags. The back of each PEM was labeled with an
identifying number. The outside of the zip-top bag was labeled with the same number. Each
PEM was wrapped in a Kimwipe and each zip-top bag was sealed when not in use. The zip-top
bags containing the PEMs were housed in large plastic bins in the laboratory during testing.
3.3.2 Test Sample Analysis Procedure
All components, except for a utility knife, necessary for the operation of the
3M™ LeadCheck™ Swabs were packaged together and ready for use. The test kit contained the
instructions and swabs. A utility knife was needed to prepare the paint sample, but was not
included with the test kit as the vendor presumed it to be readily available from the end user.
In testing of the 3M™ LeadCheck™ Swabs, the PEM was positioned on a vertical holding
device. Two nickel sized half circle slits were made at approximately 5 degrees into substrate.
By doing this, a flap formed which exposed all paint layers. The flaps were folded down,
forming a pocket.
The LeadCheck™ Swab was then activated by crushing ampoules labeled A and B. The reactant
solutions were then gently mixed by shaking the swab a few times. The swab was then
positioned above the pockets and a drop or two of the solution was then squeezed into the pocket
so that all layers of the paint were exposed to the solution. In addition, for PEMS with a red
topcoat of paint, the swab tip was then run along the edge of the folded down flap while avoiding
contact with any plaster or gypsum surfaces, other than the paint. A 30 second timer was
activated and the swab was then placed on a clean surface while the reaction occurred. This was
repeated with a new swab for each test site. If no red or pink color was detected at the end of the
30 seconds on either the PEM or the swab, a drop of the reactant solution was to be placed onto
the test confirmation card (a QC check supplied with the test kit) to validate the accuracy of the
swab. This should turn red immediately. If the indicator card did not turn red, then a new swab
was obtained and a new cut placed on the PEM for a new sample to be tested. In all cases, the
indicator card turned red. If no color was detected on the swab or sampling surface after the
initial 30 seconds, both the swab and the PEM were retained and observed for an extended
period of up to 5 minutes and longer.

10
A sample that generated an instant response (30 seconds or less) was considered to be positive
for lead. If the sample did not generate an instant positive response, it was observed for an initial
time of 5 minutes. If a color change occurred during the 5 minutes, the sample was recorded as
positive for lead and the time of the color change was recorded. If no color change was seen after
5 minutes, the PEM and corresponding swabs were placed in a polyethylene bag and sealed. The
sample was then observed at various times throughout the day for up to 20 hours (overnight) for
any color changes and the results were recorded.
11
Chapter 4
Quality Assurance/Quality Control
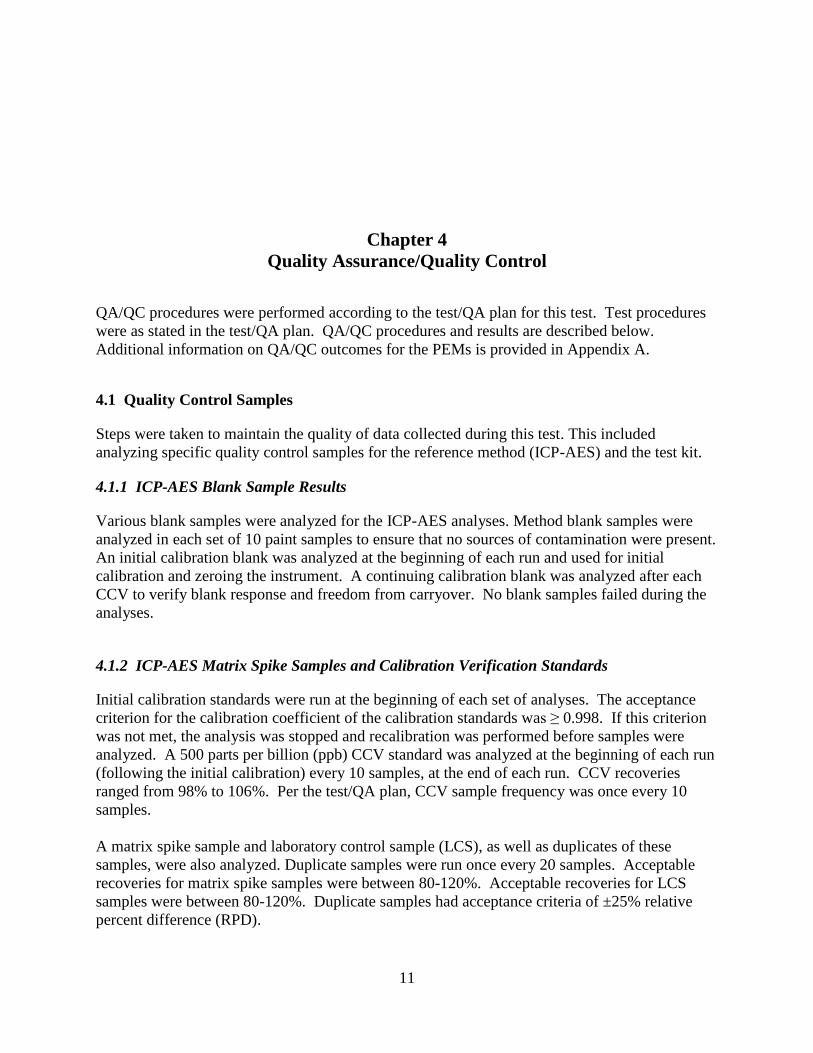
QA/QC procedures were performed according to the test/QA plan for this test. Test procedures
were as stated in the test/QA plan. QA/QC procedures and results are described below.
Additional information on QA/QC outcomes for the PEMs is provided in Appendix A.
4.1 Quality Control Samples
Steps were taken to maintain the quality of data collected during this test. This included
analyzing specific quality control samples for the reference method (ICP-AES) and the test kit.
4.1.1 ICP-AES Blank Sample Results
Various blank samples were analyzed for the ICP-AES analyses. Method blank samples were
analyzed in each set of 10 paint samples to ensure that no sources of contamination were present.
An initial calibration blank was analyzed at the beginning of each run and used for initial
calibration and zeroing the instrument. A continuing calibration blank was analyzed after each
CCV to verify blank response and freedom from carryover. No blank samples failed during the
analyses.
4.1.2 ICP-AES Matrix Spike Samples and Calibration Verification Standards
Initial calibration standards were run at the beginning of each set of analyses. The acceptance
criterion for the calibration coefficient of the calibration standards was ≥ 0.998. If this criterion
was not met, the analysis was stopped and recalibration was performed before samples were
analyzed. A 500 parts per billion (ppb) CCV standard was analyzed at the beginning of each run
(following the initial calibration) every 10 samples, at the end of each run. CCV recoveries
ranged from 98% to 106%. Per the test/QA plan, CCV sample frequency was once every 10
samples.
A matrix spike sample and laboratory control sample (LCS), as well as duplicates of these
samples, were also analyzed. Duplicate samples were run once every 20 samples. Acceptable
recoveries for matrix spike samples were between 80-120%. Acceptable recoveries for LCS
samples were between 80-120%. Duplicate samples had acceptance criteria of ±25% relative
percent difference (RPD).

12
All matrix spike samples were performed as post-digestion spikes as there was insufficient
sample volume to perform a pre-digestion spike. Matrix spike recoveries ranged from 73% to
344%. Three matrix spike samples failed, with recoveries of two above and one below the
specified acceptance criteria. Both of the high matrix spike samples were reanalyzed. After
reanalysis, one sample was within acceptable limits and the other was still high (136%). Overall,
matrix spike results indicated that matrix interferences were not observed. Duplicate samples
were within the specified RPD, except for one sample which had an RPD of 60%. The sample
and duplicate were reanalyzed and were within 25% RPD.
LCS samples were analyzed once every 20 samples. LCS recoveries ranged from 85% to 112%.
The LCS was prepared by spiking a piece of lead-free latex paint. There were no LCS failures.
4.1.3 Test Kit Quality Controls and Blank PEMs
As indicated in Section 3.3.2, a test confirmation card is provided as a positive control sample
for each LeadCheck™ Swab test kit. Per the test kit instructions, this confirmation card is to be
used when a positive response is not immediately obtained from the sample being tested.
Throughout testing, some samples did not give an immediate positive response (within 30
seconds). A test confirmation card was used in those instances. In all cases, the test confirmation
card result was positive, confirming the viability of the swab being used.
Painted PEMs containing no lead, as well as each of the PEM substrates containing no paint,
were also run as part of the test. All samples of PEM substrates containing no paint returned
negative results from the test kit (i.e., no lead was present). However, on the plaster substrates
with no paint, significant foaming was observed at the test site after application of the test
reagent from the swab. The foam itself and the residue left on the plaster from the foam
appeared to have a hint of color, specifically orange-like color, but no red color was observed.
Samples of painted PEMs containing no lead returned mixed results. For the technical operator,
4 out of 36 painted PEMs with no lead returned positive results. For the non-technical operator,
34 out of the 36 painted PEMs with no lead returned positive results.
4.2 Audits
Three types of audits were performed during the test: a performance evaluation (PE) audit of the
reference method measurements made in this test, a technical systems audit (TSA) of the test
performance, and a data quality audit. Audit procedures are described below.
4.2.1 Performance Evaluation Audits
A PE audit was conducted to assess the quality of the reference method measurements made in
the ETV ESTE verification test of lead paint test kits. The same reference laboratory and
measurements were made in this test as in the ETV ESTE verification test of lead paint test kits.
Thus, the PE audit information from the ETV test was applied to this test as confirmation that the
reference method used for the evaluation of the 3M™ LeadCheck™ Swabs was of acceptable
quality.

13
In the ETV test, the reference method PE audit was performed by supplying an independent,
NIST-traceable lead paint standard (Reference Material 8680, panel CB3), to the reference
laboratory. The PE audit samples were analyzed in the same manner as all other samples and the
analytical results for the PE audit samples were compared with the nominal concentration. The
target criterion for this PE audit was in agreement with the analytical result within 20% of the
nominal concentration. The specified acceptable concentration range for the NIST standard panel
was 1.13 – 1.75 mg/cm2 (1.44 ±0.31 mg/cm
2). The PE samples taken from this standard panel
were 1.38, 1.38, 1.19, and 1.31 mg/cm2. The PE audit results met the target criterion. This audit
was performed once at the start of the ETV verification test.
4.2.2 Technical Systems Audit
The Battelle Quality Manager performed one TSA during this test to ensure that the test was
being performed according to the test/QA plan, any published reference methods, and standard
operating procedures. In the TSA, the Battelle Quality Manager reviewed the reference methods
used, compared actual test procedures with those specified or referenced in the test/QA plan, and
reviewed data acquisition and handling procedures. Also in the TSA, the Battelle Quality
Manager observed testing, observed reference method sample preparation and analysis, inspected
documentation, and reviewed technology-specific record books. He also checked standard
certifications and technology data acquisition procedures and conferred with the technical staff.
A TSA report was prepared. There were no findings.
4.2.3 Audit of Data Quality
Prior to using test data to calculate, evaluate, or report results the records of the data were
reviewed by Battelle technical staff who did not generate the test data in question.. A Battelle
technical staff member involved in the test reviewed the data. Datasheets generated by the
operators during testing were reviewed for completeness and errors. The person performing the
review added his/her initials and the date to a hard copy of the record being reviewed. At least
10% of the data acquired during the test, including the ICP-AES results, were audited by
Battelle. Battelle‟s Quality Manager traced the data from the initial acquisition, through
reduction and statistical analysis, to final reporting to ensure the integrity of the reported results.
Minor transcription errors were identified and corrected before the results were used for the
calculations described in Chapter 5. Battelle‟s Quality Manager also reviewed the PEM ICP-
AES results thoroughly to ensure that all data quality indicators, as stated in the test/QA plan,
were followed and that reported results matched the data generated on the instrument. Two of
the 23 total matrix spike results were outside of the acceptance criteria (136% and 73%,
acceptance criteria is 75-125%), but all other QC samples in those specific batches met their
acceptance criteria and therefore the data was not considered questionable.

14
Chapter 5
Statistical Methods
The statistical methods used to evaluate the performance factors listed in Section 3.1 are
presented in this chapter. The 3M™ LeadCheck™ Swabs were evaluated for qualitative results
(i.e., positive/negative responses to samples). All data analyses were based on these qualitative
results. QC samples and unpainted PEM substrates were not included in any of these analyses.
Results are provided in Chapter 6.
5.1 False Positive and False Negative Rates
A false positive response was defined as a positive result when regulated lead-based paint was
not present. False positive rates were assessed on panels with confirmed lead levels at 0.8
mg/cm2
and lower. Consistent with the EPA‟s April 22, 2008 RRP rule2, panels with an ICP-
AES confirmed lead level between 0.8 and 1.0 mg/cm2 were not used in the false positive
analysis.
A false negative response was defined as a negative response when regulated lead-based paint
was present. False negative rates were assessed on panels with confirmed lead levels at 1.2
mg/cm2 and higher. Consistent with the EPA‟s April 22, 2008 RRP rule, panels with an ICP-
AES confirmed lead level between 1.0 and 1.2 mg/cm2 were not used in the false negative
analysis.
The EPA lead paint action level of 1.0 mg/cm2 lead was included for analysis as part of this test
based on its inclusion in the ETV verification test. Though evaluations of test kit performance
based on this level is not in the EPA RRP rule, false positive and negative rates, in addition to
those stated above, were also calculated based on 1.0 mg/cm2 lead. Thus, false positive rates
were assessed on PEMs with confirmed lead levels at 1.0 mg/cm2
and lower and false negative
rates were assessed on PEMs with confirmed lead levels at 1.0 mg/cm2
and higher. For panels
that measure 1.0 mg/cm2, positive results were considered “correct” and negative results were
considered false negative. If the confirmed lead concentration of the PEM was greater than 1.0
mg/cm2 (e.g., 1.1 mg/cm
2), then negative results were considered false negatives. If the
confirmed lead concentration of the PEM was less than 1.0 mg/cm2 (e.g., 0.9 mg/cm
2), then
positive results were considered false positives.
False positive and negative rates were calculated as shown in Equations 1 and 2, respectively:

15
(3)
(4)
2mg/cm 1.0) (or 0.8 below level lead withPEMs of # total
results positive of #Rate Positive False
2mg/cm 1.0) (or 1.2 above level lead withPEMs of # total
results negative of #Rate Negative False
5.2 Precision
Precision was measured by the reproducibility of responses for replicate samples within a group
of PEMs. Precision results were reported as the percentage of consistent responses from all
replicate sets for those paint types (see Equation 3). Responses were considered inconsistent if
25% or more of the replicates differed from the response of the other samples in the same group
of PEMs.
100sets replicate ofnumber total
sets replicate of responses consistent of #results) consistent (%Precision
5.3 Sensitivity
The sensitivity or lowest detectable lead level for each test kit was identified based on the
detection results across all PEM lead levels. The lowest PEM lead level with consistent (>75%)
positive or “detect” responses was considered the lowest detectable level. The identified lowest
detectable lead level was reported and discussed.
5.4 Modeled Probability of Test Kit Response
5.4.1 Logistic Regression Model Building Steps
Logistic regression models were used to determine the probabilities of positive or negative
responses of the test kit at the 95% confidence level, as a function of lead concentration and
other covariates, such as substrate type, lead paint type, operator type, and topcoat color. An
evaluation of the bivariate relationship between the response variable and each candidate
explanatory variable was performed by fitting single covariate logistic models to assess the
predictive ability of each of the PEM parameters. Using the results from these bivariate
analyses, a parsimonious multivariate model was developed, including a set of explanatory
variables which were most predictive of the probability of the test kit response variable. The
potential logistic regression model took the form below:
logit ii XY ))1(Pr(
where Yi is the outcome of the test kit, Xi is a vector of explanatory variables associated with Yi
and β represent a vector of unknown parameters which was estimated with the model. Test
(1)
(2)

16
results that indicated that lead was present were represented with Y=1; negative results were
represented with Y=0. Candidate independent variables associated with the response variable
were lead level (continuous), operator type (categorical), lead type (categorical), substrate type
(categorical), and topcoat color (categorical). Interactions between categorical predictor
variables were also assessed. Categorical covariates were modeled using indicator variables.
SAS‟s PROC LOGISTIC was used to evaluate the association between each explanatory variable
and the probability of a positive test kit result. Then multivariable models were fit using a
backward selection process whereby all explanatory variables were included in the initial model.
In a multi-step backwards elimination process, the variable with the weakest association (highest
Type III p-value) was eliminated from the model until all of the variables that remained had
Type III p-values less than 0.05. The list of variables that remained formed the basis for
evaluating interactions. Measured lead level was retained as an explanatory variable in all
multivariable models. Two-way interactions were tested between all pairs of categorical
explanatory variables that had p-values below 0.05. Interactions were retained in the
multivariable models if their p-values were smaller than 0.05.
5.4.2 Accounting for Measurement Error – SIMEX Background and Intuition
Categorical covariates in this experiment were measured without error, but the lead level
measurements were subject to some measurement error due both to variability inherent in the
measurement (ICP-AES) process and possibly due to spatial heterogeneity in lead concentrations
in paint on the PEMs themselves. The experimental design did not include multiple ICP-AES
analyses per PEM so there is no direct estimate of the variability in measurements for these data.
To account for the uncertainty associated with that error, the final multivariable model for each
test kit was subjected to a simulation and extrapolation (SIMEX) analysis.9-13
A detailed description of SIMEX is beyond the scope of this report, but in short, it is a robust
method of accounting for measurement error. The method requires either replicate measures of
the quantity that is measured with error, or a characterization of the variability in the
measurements. It then estimates what the regression model coefficients would be in the absence
of measurement error. The technique estimates standard errors for the regression model
coefficients using the bootstrap technique. SIMEX analyses were carried out in Stata version
11.1 using the programs described in Hardin et al (2003c).12
The premise of the analysis is that one of the independent variables, namely lead concentration,
has been measured with error. In the logistic regression models considered here, lead
concentration is the only continuous independent variable; all of the other covariates are
categorical. Thus, lead concentration may be considered the „x‟ in a simple linear regression.
The observed variability in „x‟ is comprised of two components, actual variation in lead
concentration and measurement error. If we were able to remove the measurement error then we
would observe less variability in that independent variable.
There are two important points of intuition that will inform expectations about what is seen in the
SIMEX results. First, the data along the x-axis of a scatterplot would “tighten up” if
measurement error were removed. “Tightening up” the independent variable in a regression

17
analysis will result in a steeper slope or a regression coefficient with a larger magnitude. This is a
fundamental consequence of any technique that adjusts for measurement error in the independent
variable in a regression analysis. In the lead paint analysis, steeper logistic regression curves
will result from the SIMEX analysis than would result from a non-SIMEX analysis where lead
levels were considered to be fixed and known.
Second, when the statistical analyses acknowledge and account for the measurement error, then
the regression output prediction intervals may be wider than those for a non-SIMEX analysis
where „x‟ is considered to be fixed and known. For any given predicted value of the outcome
variable, the prediction interval will most likely be wider, or at least not narrower. But for a
fixed value of „x‟, (such as 0.8 or 1.2 mg/cm2) whether the SIMEX prediction intervals are wider
or narrower than the non-SIMEX intervals depends on how much the slopes of the SIMEX and
non-SIMEX regression line differ. For typical logistic regression models, prediction intervals
are very narrow at the extreme low and high asymptotic ends of the x-axis, and only appreciably
wide in the region where the probability of the outcome is not near zero and not near one. So if
the SIMEX analysis has only a moderate impact on the slope then wider prediction intervals
might be observed at 0.8 and 1.2 mg/cm2. But if the slope changes dramatically, then 0.8 or 1.2
mg/cm2 might now be in the part of the prediction curve that is near zero or one and the SIMEX
prediction interval might be dramatically more narrow than a non-SIMEX interval.
Thus, the prediction curves for every SIMEX analysis are expected to be steeper than, or at least
not less steep than, a non-SIMEX analysis. However, the assessment of test kit performance is
based on the upper and lower bounds of prediction intervals at 0.8 and 1.2 .mg/cm2, respectively.
5.4.3 SIMEX Input and Analysis
During pre-production of the PEMs, replicate paint chip samples were analyzed from selected
metal PEMs that served as reference panels (see Appendix A). Three metal panels were
prepared for each lead level and lead type for the pre-production homogeneity testing. Four
paint chip samples, one from each quadrant of the PEM, were taken and analyzed via ICP-AES
for their lead levels. Data are available on the coefficients of variation for these metal PEMs for
both white and yellow lead. These data are shown below in Table 5-1. Though these data did
not come from actual PEMs used during the test, this information was used as a surrogate
measure of homogeneity variability on the PEMs.
For each PEM in the study, nine random pseudo-replicates were generated from a normal
distribution with a mean equal to the confirmed lead concentration for that panel, and a standard
deviation computed from the metal reference PEM data in Table 5-1 and indexed by the panel‟s
lead type and target lead level. The nine measurements were used as inputs to the Stata SIMEX
algorithm as if they were true replicate measurements.

18
Table 5-1. Results from Final Homogeneity Testing for each Set of ETV PEMs
Lead Type Target Lead Level
Mean Levels CoV*
ICP (mg/cm2) ICP
White Lead
0.3 0.38 7.7
0.6 0.69 14.0
1.0 1.09 10.8
1.4 1.49 11.5
2.0 1.91 14.4
6.0 8.34 15.9
Yellow Lead
0.3 0.34 13.2
0.6 0.68 21.7
1.0 1.10 12.1
1.4 1.32 9.1
2.0 2.06 11.7
6.0 3.88 15.4
* Coefficient of Variation (Standard Deviation/Mean x 100)
There are two user-specified parameters for the Stata SIMEX algorithm: 1) the number of
replicate measurements for the covariate measured with error, and 2) the number of bootstrap
samples used to estimate standard errors on regression parameters. In testing not detailed here,
the sensitivity of the SIMEX algorithm to different settings of these parameters was investigated.
It was determined that the qualitative results were not sensitive to the values used in the analysis.
The values used were nine pseudo-replicates per PEM and 199 bootstrap samples, respectively.
The predicted regression curves and associated prediction intervals were generated in the interval
0.0 to 6.0 mg/cm2 using Stata. The relevant prediction bounds (the upper bound at 0.8 mg/cm
2
and lower bound at 1.2 mg/cm2) were assessed and the predicted false positive and false negative
rates based on these prediction bounds were determined.
5.4.4 Goodness of Fit
To assess whether the logistic regression models fit the data well, standardized Pearson residuals
were computed for every observation and those with an absolute value greater than two were
flagged and plotted versus lead level. Standardized Pearson residuals greater than two are
associated with observations that are not well fit by the model. In the logistic regression context,
observations that are not well fit might be those with high lead levels where the kit results were
negative or very low lead levels where the test kit results were positive. In the absence of
categorical variables the standardized Pearson residuals should be normally distributed, so we
would expect approximately 5% of the observations to have residuals with absolute value greater
than two. In this case there are categorical covariates so the residuals are not strictly expected to

19
(5)
(6)
be distributed normally but the proportion of observations with large residuals is still
informative. That proportion is reported in Section 6.4.
5.5 Matrix Effects
The covariate-adjusted logistic regression model described in Section 5.4 was used to assess the
significance of PEM parameters and the interactions among them on the performance of the test
kit. PEM parameters were included in the model as explanatory variables associated with the Yi
response variable.
Comparison of the observed values of the response variable to predicted values obtained from
models with and without the predictor variable in question was the guiding principle in the
logistic regression model. The likelihood function is defined as
)](1.[)()(1
i
n
i
i YYL
where )( iY is the conditional probability of Yi =1 and )](1[ iY is the conditional probability
of Yi =0 given the vector of explanatory variables (X). For purposes of assessing the
significance of a group of p predictor variables (where p can be 1 or more), we computed the
likelihood ratio test statistic, G, as follows:
G = -2 loge [likelihood without the p variables / likelihood with the p variables]
Under the null hypothesis, this test statistic followed a chi-square distribution with p degrees of
freedom. If the test statistic was greater than the 95th percentile of the chi-square distribution,
then the group of variables, taken together, was statistically significant.
5.6 Operational Factors
There were no statistical calculations applicable to operational factors. Operational factors were
determined qualitatively based on assessments from the Operator (both technical and non-
technical) and the Battelle Test Coordinator. Operational factors such as ease of use, operator
bias, average cost, average time for kit operation, and helpfulness of manuals, were determined.
Sustainability metrics such as volume and type of waste generated from the use of each test kit,
toxicity of the chemicals used, and energy consumption are discussed. This discussion is based
on how much waste was generated and what the waste was composed of, information from the
vendor on how the waste should be properly handled, a summary of the pertinent MSDS
information, when available, and noting whether the test kit used batteries, a power supply, or no
energy source was needed. Information on how many tests each kit could perform as well as the
shelf life of the test kit and chemicals used as part of the test kit was also reported.

20
Chapter 6
Test Results
The results for the 3M™ LeadCheck™ Swabs are presented below for each of the performance
parameters.
In this report each PEM is associated with three definitions of lead levels:
Target lead level - the expected concentration of each PEM as outlined in Table 3-1.
These target lead levels were 0, 0.3, 0.6, 1.0, 1.4, 2.0, or 6.0 mg/cm2.
Confirmed lead level - the concentration as measured by the reference laboratory using
ICP-AES analysis.
Closest target lead level - the target level that is closest to the confirmed level. If a panel
has a target lead level of 1.4 mg/cm2 and a confirmed lead level of 1.9 mg/cm
2 then the
closest target level is 2.0 mg/cm2.
Under ideal circumstances the confirmed lead level would equal the target lead level, but this
was sometimes not the case. Analyses where lead level was a categorical variable (i.e.,
consistency, precision, and sensitivity analyses) characterized the panels by their closest target
lead level. Analyses where lead level was a continuous variable (i.e., the false positive/negative
and logistic regression analyses) characterized the panels by their confirmed lead level. Each
analysis described clearly which level was used to characterize the lead level.
6.1 False Positive and False Negative Rates
Observed false positive and negative rates were calculated based on confirmed lead levels as
measured though ICP-AES analysis. For example, if the PEM was confirmed to have a lead
level of 1.4 mg/cm2, and the test kit returned a negative result, this would be considered a false
negative. Table 3-1 details the target lead levels for the PEMs and the number of PEMs that
were anticipated at each lead level. Because of variations in PEM production, the confirmed lead
level of a particular PEM did not always match the target lead level. Table 6-1 compares the
number of PEMs at the confirmed and target lead levels used for the observed false positive and
negative analyses. The data are divided into three categories: those panels eligible for false
positive analysis (lead levels up to and including 0.8 mg/cm2), those excluded from false positive
and false negative analyses (lead levels between 0.8 and 1.2 mg/cm2) and those eligible for false
negative analysis (lead levels 1.2 mg/cm2 and above). If the confirmed lead levels had been
equal to the target lead levels, all of the numbers would lie along the shaded diagonal. Because

21
the confirmed levels sometimes differed significantly from the target levels, (i.e., the target lead
level was at 0.6 mg/cm2 but confirmed near 1.4 mg/cm
2) some panels appear in the off-diagonal
table entries and were therefore included in portions of the analysis other than those for which
they had been targeted.
Table 6-1. The number of panels in each false positive and false negative analysis category
Confirmed Lead Levels
Eligible for False Positive Analysis
Excluded from Analysis
Eligible for False Negative Analysis Total
Target Lead
Levels
Eligible for False Positive Analysis 52 18 20 90
Excluded from Analysis 0 0 36 36
Eligible for False Negative Analysis 1 0 107 108
Total 53 18 163 234
Tables 6-2 and 6-3 list the observed false positive and false negative rates for the
LeadCheck™ Swabs under two sets of conditions:
Table 6-2 shows the observed false positive results for panels with confirmed lead levels
≤ 0.8 mg/cm2 and observed false negative results for panels with confirmed lead levels
1.2 mg/cm2, per the RRP ruling.
2
Table 6-3 shows observed false positive results for panels with confirmed lead levels < 1
mg/cm2 and observed false negative results for panels with confirmed lead levels 1
mg/cm2.
Results for both the technical and non-technical operator are presented. Results are presented as
overall rates (i.e., false positive and negative results across all applicable PEMs combined) and
also false positive and negative rates based on lead paint type (i.e., white or yellow lead),
substrate (i.e., drywall or plaster), and topcoat paint color (i.e., grey red or white).
The overall observed false negative rate for the LeadCheck™ Swabs based on confirmed lead
levels of ≥1.2 mg/cm2 for both the technical and non-technical operators, was 2 false results out
of 651 tests, for a rate of 0.3% (see Table 6-2). In fact, false negative results were only observed
on one PEM; it had yellow lead in a white topcoat on a plaster substrate. The technical operator
obtained a false result both times he tested the paint from that one PEM. Every other result
where the confirmed lead level was ≥1.2 mg/cm2 yielded a positive result. In Table 6-2,
observed false negative rates determined by substrate, lead type, and topcoat color ranged from
0-2% with the majority being at 0%.
Observed false positive rates, for this same RRP rule grouping of the PEMs were significantly
higher. The overall observed false positive rate for the technical operator was 70% while that for
the non-technical operator was 98%. Note that both operators yielded false positive test results
for every test with white lead or yellow lead with concentrations ≤ 0.8mg/cm2. The only

22
negative results in the false positive analysis were for panels that contained no lead and many of
those tests (38/72) were falsely positive as well.
Table 6-2. LeadCheck™ Swabs false positive results for panels with confirmed lead levels
≤ 0.8 mg/cm2 and false negative results for panels with confirmed lead levels 1.2 mg/cm
2
LeadCheck™ Swabs
False Positivesi False Negativesii
Technical Operator
Non-technical Operator
Technical Operator
Non-technical Operator
Overall 76/108 = 70% 104/106 = 98% 2/325 = 1% 0/326 = 0%
None 4/36 = 11% 34/36 = 94% NA NA
White 36/36 = 100% 34/34 = 100% 0/166 = 0% 0/166 = 0%
Yellow 36/36 = 100% 36/36 = 100% 2/159 = 1% 0/160 = 0%
Drywall 38/54 = 70% 52/54 = 96% 0/162 = 0% 0/162 = 0%
Plaster 38/54 = 70% 52/52 = 100% 2/163 = 1% 0/164 = 0%
Grey 28/40 = 70% 36/38 = 95% 0/106 = 0% 0/108 = 0%
Red 22/30 = 73% 30/30 = 100% 0/114 = 0% 0/114 = 0%
White 26/38 = 68% 38/38 = 100% 2/105 = 2% 0/104 = 0%
iFalse positives on PEMs with confirmed lead levels ≤ 0.8 mg/cm2 iiFalse negatives on PEMs with confirmed lead levels 1.2 mg/ cm2 NA: If the paint did not contain lead then a false negative is not possible, those entries are ‘NA’ (not applicable).
The observed false negative rates for both the technical and non-technical operator using 1.0
mg/cm2 as the deciding concentration (see Table 6-3) were almost identical to those found using
RRP rule concentration limits of ≥1.2 mg/cm2 (see Table 6-2). Although Table 6-3 has larger
false negative denominators than Table 6-2, the numerators are the same; again, the only false
negative results were obtained on both tests that the technical operator made on a single white
plaster panel with yellow lead. False positive patterns similar to those seen in Table 6-2 are
apparent across the different subgroups of interest as shown in Table 6-3. All results < 1.0
mg/cm2 yielded false positive test results if either white lead or yellow lead was present and most
results with no lead present (38/72) yielded false positive results as well.

23
Table 6-3. LeadCheck™ Swabs false positive results for panels with confirmed lead levels
< 1 mg/cm2 and false negative results for panels with confirmed lead levels 1 mg/cm
2
LeadCheck™ Swabs
False Positivesi False Negativesii
Technical Operator
Non-technical Operator
Technical Operator
Non-technical Operator
Overall 94/126 = 75% 122/124 = 98% 2/343 = 1% 0/344 = 0%
None 4/36 = 11% 34/36 = 94% NA NA
White 42/42 = 100% 40/40 = 100% 0/176 = 0% 0/176 = 0%
Yellow 48/48 = 100% 48/48 = 100% 2/167 = 1% 0/168 = 0%
Drywall 48/64 = 75% 62/64 = 97% 0/170 = 0% 0/170 = 0%
Plaster 46/62 = 74% 60/60 = 100% 2/173 = 1% 0/174 = 0%
Grey 34/46 = 74% 42/44 = 95% 0/110 = 0% 0/112 = 0%
Red 28/36 = 78% 36/36 = 100% 0/120 = 0% 0/120 = 0%
White 32/44 = 73% 44/44 = 100% 2/113 = 2% 0/112 = 0%
iFalse positives on PEMs with confirmed lead levels < 1.0 mg/cm2 iiFalse negatives on PEMs with confirmed lead levels 1.0 mg/ cm2 NA: If the paint did not contain lead then a false negative is not possible, those entries are ‘NA’ (not applicable).
Note that the observed false positive and negative rates presented in this section provide a
general representation of the ability of the LeadCheck™ Swabs to correctly identify regulated
lead paint when it is present or absent. The results presented in Table 6-2 provide rates based on
the cut-off concentration (0.8 or 1.2 mg/cm2) as well as all levels evaluated below or above those
concentrations. To evaluate test kit performance based on the RRP rule, lead paint test kits
should have a demonstrated probability (with 95% confidence) of a negative response at or
above the regulated lead level ≤5% of the time. Test kits should also have a demonstrated
probability (with 95% confidence) of a positive response below the regulated lead level ≤10% of
the time. Because the RRP rule also indicated that test kit performance would not be based on
lead levels between 0.8 and 1.2 mg/cm2, the false positive and negative probabilities assessed in
this report were then based around the excluded concentrations (of 0.8 and 1.2 mg/cm2). False
positive and negative rates associated with these criteria are discussed in Section 6.4.
6.2 Precision
To compute precision, it is first necessary to compute the number of replicate sets with consistent
responses. Replicate sets are defined in the test/QA1 plan to be groups of panels with similar

24
lead levels. The target lead levels in this experiment were 0, 0.3, 0.6, 1.0, 1.4, 2, and 6 mg/cm2
but the lead levels that were achieved, as confirmed by ICP-AES, sometimes varied from those
target levels. To assemble replicate sets that represented the target lead levels, the panels were
assigned to the replicate set that was nearest their confirmed lead level. In other words, if a
particular panel was targeted for 0.3 mg/cm2 but was measured to have 0.9 mg/cm
2 then it was
assigned to the replicate set nearest 0.9 mg/cm2, which is the set labeled 1.0 mg/cm
2. Table 6-4
shows the thresholds that defined the replicate set bins as well as the range of measured levels
that fell in each bin.
Table 6-4. Actual lead levels and their replicate set labels
Replicate Set Bin Label (mg/cm2)
(Closest Target Lead Level)
Bin Thresholds
(mg/cm2)
Confirmed Lead Levels In This Bin (mg/cm2)
0 Targeted to have zero lead 0.000-0.001
0.3 0 ≤ Confirmed Lead Level < 0.45 0.042-0.439
0.6 0.45 ≤ Confirmed Lead Level < 0.8 0.459-0.789
1 0.8 ≤ Confirmed Lead Level < 1.2 0.884-1.199
1.4 1.2 ≤ Confirmed Lead Level < 1.7 1.213-1.695
2 1.7 ≤ Confirmed Lead Level < 4 1.701-3.937
6 4 ≤ Confirmed Lead Level 4.120-16.109
Table 6-5 shows the number of panels in which confirmed lead levels fell nearest their target
level and the number of panels whose confirmed levels fell closer to a level other than their
target level. The shaded values along the diagonal of the table are the panels in which measured
levels fell closer to their target than to any of the other targets. If all of the panels had measured
levels that were equal to their target levels, then all of the numbers would lie along the diagonal
of Table 6-5. The numbers off the diagonal represent panels with confirmed lead levels closer to
some other target value. Note, for example, that of the 36 panels that were targeted to have 1.0
mg/cm2 of lead, 0 achieved that level, 12 fell closer to 1.4 mg/cm
2 than 1.0 mg/cm
2, and 24 were
closer to 2.0 mg/cm2 than to any other target level. In the consistency analysis described below,
each panel was grouped into sets labeled with the target level that its measured level fell closest
to, rather than by its target lead level.

25
Table 6-5. The number of panels at each target level and the number in each replicate set
bin
Replicate Set Bin
(Target level that is closest to the panel’s actual measured lead level)
0 0.3 0.6 1 1.4 2 6 Total
Target Lead Level (mg/cm2)
0 18 - - - - - - 18
0.3 - 15 18 3 - - - 36
0.6 - - 1 15 15 5 - 36
1.0 - - - - 12 24 - 36
1.4 - - - - 1 33 2 36
2.0 - 1 - - 1 31 3 36
6.0 - - - - - - 36 36
Total 18 16 19 18 29 93 41 234
Table 6-6 lists consistency results for the LeadCheck™ Swabs by operator type, lead type,
substrate, and lead level. Each table entry lists the number of test results with those
characteristics (N) as well as the proportion of the results that were positive for lead (Pos). Table
entries where the proportion is below 25% or above 75% are „consistent‟, meaning that more
than three-quarters of the results were the same (negative or positive). Table entries where the
proportion of positive results ranges from 25% to 75% are considered to be „inconsistent‟.
Inconsistent entries are shaded in the tables. Overall consistency results across all substrates for
white and yellow lead panels for each operator type are also provided in the last row of Table 6-
6. Results across both operators and lead paint types are provided in the last column of the table.
The consistency of the LeadCheck™ Swabs at particular lead levels was similar across substrates
and operator type. In fact, overall, as shown in the far-right column of Table 6-6, the
LeadCheck™ Swabs provided consistent results for all lead levels for the combined results at 0.0
mg/cm2. The non-technical operator and the technical operator were both consistent at 0.0
mg/cm2, but they were consistent in opposite directions; the non-technical operator consistently
obtained positive test results when there was no lead present while the technical operator
consistently obtained negative results on those same panels. When their results are combined,
therefore, they are inconsistent and therefore shaded in the table. Results for all other levels
were consistently positive 99-100%. Overall consistencies broken down by operator type
showed similar results.

26
(7)
Table 6-6. LeadCheck™ Swabs consistency results by operator type, lead type, substrate,
and lead level
LeadCheck™
Swabs
NON-TECHNICAL TECHNICAL TOTAL
Lead Type None White Yellow Total None White Yellow Total Total
N Pos N os N Pos N Pos N Pos N Pos N Pos N Pos N Pos
DRYWALL
0 18 89%
18 89% 18 11%
18 11% 36 50% 0.3
8 100% 8 100% 16 100%
8 100% 8 100% 16 100% 32 100%
0.6
10 100% 10 100% 20 100%
10 100% 10 100% 20 100% 40 100% 1
8 100% 10 100% 18 100%
8 100% 10 100% 18 100% 36 100%
1.4
14 100% 24 100% 38 100%
14 100% 24 100% 38 100% 76 100% 2
50 100% 38 100% 88 100%
50 100% 38 100% 88 100% 176 100%
6
18 100% 18 100% 36 100%
18 100% 18 100% 36 100% 72 100% 0 18 89%
18 89% 18 11%
18 11% 36 50%
PLASTER
0 18 100%
18 100% 18 11%
18 11% 36 56% 0.3
14 100% 2 100% 16 100%
14 100% 2 100% 16 100% 32 100%
0.6
2 100% 16 100% 18 100%
4 100% 16 100% 20 100% 38 100% 1
8 100% 10 100% 18 100%
8 100% 10 100% 18 100% 36 100%
1.4
14 100% 6 100% 20 100%
14 100% 7 100% 21 100% 41 100% 2
50 100% 48 100% 98 100%
50 100% 46 96% 96 98% 194 99%
6
20 100% 26 100% 46 100%
20 100% 26 100% 46 100% 92 100%
ALL
0 36 95%
36 11%
36 11% 36 53% 0.3
22 100% 10 100% 32 100%
22 100% 10 100% 32 100% 64 100%
0.6
12 100% 26 100% 38 100%
14 100% 26 100% 40 100% 78 100% 1
16 100% 20 100% 36 100%
16 100% 20 100% 36 100% 72 100%
1.4
28 100% 30 100% 58 100%
28 100% 31 100% 59 100% 117 100% 2
100 100% 86 100% 186 100%
100 100% 84 99% 184 99% 370 99%
6
38 100% 44 100% 82 100%
38 100% 44 100% 82 100% 164 100%
N = number of test results in each bin of the table Pos = Proportion of those N test results that were ‘Positive’ for the presence of lead. Lead levels in the left-most column represent the target level closest to the measured level of lead in the panel. Shaded cells represent 'inconsistent' results. i.e., % positive is between 25% and 75%
The consistency results provided in Table 6-6 were used to calculate precision. Precision was
estimated for panels with no lead, white lead, and yellow lead and by type of operator and then
aggregated across both types of operators. For any column in Table 6-6, the precision is simply
the proportion of consistent (unshaded) table entries in the rows for the four different substrates.
The „All‟ rows are not counted in the precision calculation because those table entries are
summaries of the entries for the four substrates. Thus, precision was calculated as:
27
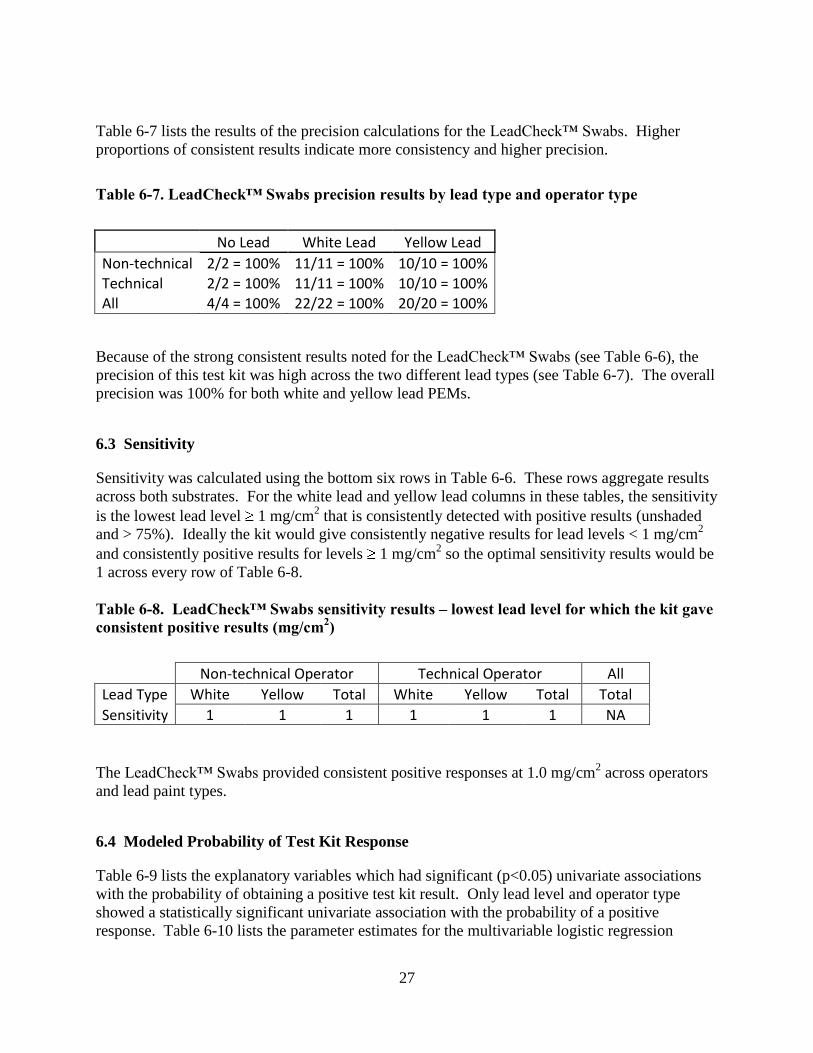
Table 6-7 lists the results of the precision calculations for the LeadCheck™ Swabs. Higher
proportions of consistent results indicate more consistency and higher precision.
Table 6-7. LeadCheck™ Swabs precision results by lead type and operator type
No Lead White Lead Yellow Lead
Non-technical 2/2 = 100% 11/11 = 100% 10/10 = 100% Technical 2/2 = 100% 11/11 = 100% 10/10 = 100% All 4/4 = 100% 22/22 = 100% 20/20 = 100%
Because of the strong consistent results noted for the LeadCheck™ Swabs (see Table 6-6), the
precision of this test kit was high across the two different lead types (see Table 6-7). The overall
precision was 100% for both white and yellow lead PEMs.
6.3 Sensitivity
Sensitivity was calculated using the bottom six rows in Table 6-6. These rows aggregate results
across both substrates. For the white lead and yellow lead columns in these tables, the sensitivity
is the lowest lead level 1 mg/cm2 that is consistently detected with positive results (unshaded
and > 75%). Ideally the kit would give consistently negative results for lead levels < 1 mg/cm2
and consistently positive results for levels 1 mg/cm2 so the optimal sensitivity results would be
1 across every row of Table 6-8.
Table 6-8. LeadCheck™ Swabs sensitivity results – lowest lead level for which the kit gave
consistent positive results (mg/cm2)
Non-technical Operator Technical Operator All
Lead Type White Yellow Total White Yellow Total Total
Sensitivity 1 1 1 1 1 1 NA
The LeadCheck™ Swabs provided consistent positive responses at 1.0 mg/cm2 across operators
and lead paint types.
6.4 Modeled Probability of Test Kit Response
Table 6-9 lists the explanatory variables which had significant (p<0.05) univariate associations
with the probability of obtaining a positive test kit result. Only lead level and operator type
showed a statistically significant univariate association with the probability of a positive
response. Table 6-10 lists the parameter estimates for the multivariable logistic regression

28
models for the Stata SIMEX program. Note that for the LeadCheck™ Swabs the operator type
variable was dropped in the multivariable model after backward selection. That is to say that
after accounting for the influence of lead level, operator type did not have a significant
association with the probability of positive response, so it was included in the multivariable
model.
Table 6-9. LeadCheck™ Swabs univariate associations between probability of positive
response and explanatory variables
Explanatory Variable Significant Univariate Association? Included in Multivariable Model?
Lead Level Yes (p-value < 0.0001) Yes
Lead Type No (p-value = 0.7844) No
Operator Type Yes (p-value < 0.0001) No
Substrate Type No (p-value = 0.9948) No
Topcoat Color No (p-value = 0.3310) No
Table 6-10. LeadCheck™ Swabs multivariable Stata SIMEX logistic regression parameter
estimates
Simulation extrapolation No. of obs = 937 Bootstraps reps = 199
Residual df = 935 Wald F(1,935) = 5.67
Prob > F = 0.0175
Variance Function: V(u) = u(1-u) [Bernoulli]
Link Function : g(u) = log(u/(1-u)) [Logit]
------------------------------------------------------------------------------
| Bootstrap
result | Coef. Std. Err. t P>|t| [95% Conf. Interval]
-------------+----------------------------------------------------------------
lead level | 5.921938 2.487327 2.38 0.017 1.040549 10.80333
constant | .3056037 .3427687 0.89 0.373 -.3670814 .9782887
------------------------------------------------------------------------------
Table 6-11 lists the modeled probability of a positive test result for the LeadCheck™ Swabs
when the lead level is 0.8 mg/cm2 (PREDICTION) along with the upper bound of a 95%
prediction interval (UPPER). That upper bound can be considered to be a worst-case estimate of
the false positive probability when the true lead level is 0.8 mg/cm2 (FALSE POS RATE).
Ideally the numbers in the UPPER/FALSE POS RATE column would be ≤ 10%. Note that the
FALSE POS RATE in Table 6-11 is higher than many of those in Tables 6-2 and 6-3. In those
earlier tables the rates considered panels at a variety of comparatively low lead levels so some
cases should have been easier for the kit to obtain the correct answer. In Table 6-11, the false

29
positive rate is evaluated only at 0.8 mg/cm2 so the rate does not benefit from the comparatively
lower lead concentrations. Evaluating at only this level also ensures that a test kit can adequately
perform at concentrations of lead paint closest to the current regulatory level.
Table 6-11. LeadCheck™ Swabs modeled probability of positive test results and upper
95% prediction bound when lead level = 0.8 mg/cm2
LEAD LEVEL PREDICTION UPPER (FALSE POS RATE)
0.8 99.4% >99.9%
The modeled probability curve results, as shown in Table 6-11, indicate that at 0.8 mg/cm2, there
is no lead level where the upper prediction bound provides a false positive rate of ≤10%.
Table 6-12 lists the modeled probability of a positive test result for the LeadCheck™ Swabs
when the lead level is 1.2 mg/cm2 (PREDICTION) along with the lower bound of a 95%
prediction interval (LOWER). The difference between the lower bound and 100% can be
considered to be a worst-case estimate of the false negative probability when the true lead level
is 1.2 mg/cm2 (FALSE NEG RATE). Ideally, for purposes of the RRP rule, the numbers in the
FALSE NEG RATE column would be ≤ 5%. The results in Table 6-12 predict a false negative
rate for the LeadCheck™ Swabs slightly under 5%.
Table 6-12. LeadCheck™ Swabs modeled probability of positive test results, lower 95%
prediction bound, and corresponding conservative estimate of the false negative rate when
lead level = 1.2 mg/cm2
LEAD LEVEL PREDICTION LOWER FALSE NEG RATE
1.2 >99.9% 95.001% 4.9%
Note that the FALSE NEG RATE in Table 6-12 is higher than those in Tables 6-2 and 6-3. In
the earlier tables, the false negative rates considered panels at a variety of comparatively high
lead levels so some cases should have been easier for the kit to obtain the correct answer. In
Table 6-12, the false negative rate is evaluated only at 1.2 mg/cm2 so the rate does not benefit
from the comparatively higher lead concentrations. Evaluating at only this level also ensures
that a test kit can adequately perform at concentrations of lead paint closest to the current
regulatory level.
As another means of reporting the results for the LeadCheck™ Swabs, a modeled probability
curve was also plotted based on the results of the regression analysis. To better understand the
information being provided in the probability curve, a brief explanation is presented here. Figure
6-1 shows that for the perfect or ideal test kit, the probability of a positive test result would be a
step function. The probability of a positive result would be zero below 1.0 mg/cm2 and 100% at
or above 1.0 mg/cm2. Under the RRP rule, a test kit must yield a demonstrated probability (with
95% confidence) of no more than 10% false positives at lead concentrations below 0.8 mg/cm2

30
and a demonstrated probability (with 95% confidence) of no more than 5% false negatives at
concentrations above 1.2 mg/cm2. Figure 6-1 also shows a performance curve for a hypothetical
test kit that achieves those rates. The upper bound of the 90% prediction interval is at 10% at 0.8
mg/cm2 and the lower bound of the prediction interval is at 95% at 1.2 mg/cm
2.
One way to think of the test kit performance guidelines is in terms of regions of the probability
plots. Figure 6-2 demonstrates this concept. For the kit to be within limits set up by the RRP
rule, the probability curve must trace a path through the white region in the figure and must not
stray into the shaded regions. If the curve crosses the shaded region at the left side of the graph
then there are lead levels < 0.8 mg/cm2 where the false positive rate is > 10%. If the curve
crosses the shaded region at the right side of the graph then there are lead levels > 1.2 mg/cm2
where the false negative rate is > 5%. Either type of intersection between the curve and the
shaded region indicates that the kit does not meet the performance levels stipulated in the RRP
rule.
Note that results for the region between 0.8 and 1.2 mg/cm2 were not discussed in this report.
This is consistent with the RRP rule stipulation that lead concentrations between 0.8 and 1.2
mg/cm2 were not to be considered for the evaluation of the performance of lead paint test kits.
Figure 6-3 shows the predicted probability of obtaining a positive test result using the
LeadCheck™ Swabs along with the bounds of a 90% prediction interval. Note that the upper
and lower bounds of the 90% prediction interval may also be considered to be upper and lower
95% prediction bounds for one-sided inference.
Note that the probability curve and prediction interval all avoid the shaded region above 1.2
mg/cm2. Thus, these data indicate that the false negative rates at levels above 1.2 mg/cm
2 would
be smaller than 5%. The curve passed through the shaded regions at the left side of the graph,
indicating that the false positive rate would be larger than 10% for all lead levels below 0.8
mg/cm2. Those rates are not consistent with the RRP rule.

31
Figure 6-1. Probability curves that represent test kit results that are both perfect (red line) and within RRP rule criteria (black
solid line).
210
100%
80%
60%
40%
20%
0%
Lead Level (mg/cm^2)
Pro
ba
bili
ty o
f P
osit
ive
Re
su
lt
1.20.8
95%
10%
Perfect Kit
Acceptable Kit: Upper 90% Bound (1)
Acceptable Kit
Acceptable Kit: Lower 90% Bound (2)
1 Upper bound is above and left of the "Acceptable Kit" curve
2 Lower bound is below and right of the "Acceptable Kit" curve

32
Figure 6-2. Probability curves with shaded region to denote performance results that meet RRP rule false positive and
negative criteria. Test kits with curves that fall within the white region and avoid the shaded region meet the RRP rule.
210
100%
80%
60%
40%
20%
0%
Lead Level (mg/cm^2)
Pro
ba
bili
ty o
f P
osit
ive
Re
su
lt
1.20.8
95%
10%
Perfect Kit
Acceptable Kit: Upper 90% Bound (1)
Acceptable Kit
Acceptable Kit: Lower 90% Bound (2)
1 Upper bound is above and left of the "Acceptable Kit" curve
2 Lower bound is below and right of the "Acceptable Kit" curve

33
Figure 6-3. LeadCheck™ Swabs predicted probability of positive test result (solid lines) with 90% prediction interval (dotted
lines).
210
100%
80%
60%
40%
20%
0%
Lead Level (mg/cm^2)
Pro
ba
bili
ty o
f P
osit
ive
Re
su
lt
1.20.8
95%
10%

34
Based on the modeled probabilities shown in Figure 6-3, threshold values for false positive and
negative rates were established for the LeadCheck™ Swabs. For the false positive rate, this
threshold value is the lead level, with 95% confidence, below which the LeadCheck™ Swabs
would yield fewer than 10% false positive results. As is evident in Figure 6-3, there is no lead
level where the predicted probaility falls below 10%. For the false negative rate, this threshold
value is the lead level, with 95% confidence, above which the LeadCheck™ Swabs would yield
fewer than 5% false negative results. These threshold values are then the lead levels where the
LeadCheck™ Swabs is predicted to meet the false positive and negative criteria set forth in the
RRP rule4.
Table 6-13. LeadCheck™ Swabs false positive and negative threshold values (95%
confidence) based on the modeled probability of test results
FALSE POSITIVE THRESHOLD
(mg/cm2)
FALSE NEGATIVE THRESHOLD
(mg/cm2)
N/A 1.20
Table 6-13 indicates that overall, across all factors, the false positive rate exceeds that allowed
by the RRP rule even at 0 mg/cm2. The false negative threshold is approximately 1.2 mg/cm
2.
Standardized Pearson residuals were calculated to assess goodness of fit of the logistic regression
models. For the LeadCheck™ Swabs model, 99.1% of the residuals had absolute values smaller
than two.
6.5 Matrix Effect
The matrix effects for the LeadCheck™ Swabs were evaluated with results in Table 6-10. The
variables that were retained in the multivariable logistic regression model each add significant
explanatory power to their respective models. Those variables are significantly associated with
the probability of obtaining a positive test result from the kits tested in this study. The only
variable retained in the model for LeadCheck™ Swabs was lead level.
6.6 Operational Factors
Both the technical and non-technical operator found the instructions for the LeadCheck™ Swabs
to be clear, informative, and easy to follow. Step-by-step instructions were provided with picture
demonstrations of some steps being completed. An instructional video was also provided by the
vendor. This video will be available on the test kit website for viewing by purchasers of the kit.
The non-technical operator received no training from the vendor and relied solely on the test kit
instructions and an instructional video for his understanding of the operation of the test kit. Both
the technical and non-technical operator indicated that after reading the instruction manual and a

35
couple of trial runs, they were prepared to use the test kit. They also noted that they became more
efficient at notching the paint as they tested more samples. The ampoules containing the reactive
solutions within the swabs were easy to crush.
The LeadCheck™ Swabs were provided in bulk for the purposes of this test. However, the
swabs are available in retailer and contractor packs containing various numbers of swabs. The
kit includes swabs, a test confirmation card, and instructions. The testing solution is self-
contained within each swab. The user was expected to supply a utility knife for notching the
paint. The kits should be stored at 40-110 °F and will last indefinitely at these conditions.
The test kit instructions described that appropriate safety precautions should be taken when
working with the test kit, in particular avoiding eye and skin contact. The LeadCheck™ Swabs
kit contains water, tartaric acid, disodium tartrate dehydrate, and lead nitrate. Information on the
hazards of these solutions, the chemicals of concern, the steps that should be taken to avoid
injury and first aid measures were provided in the test kit instructions. These warnings were
provided in large, bold, type that was clearly visible. Both the technical and non-technical
operators followed general laboratory safety procedures and wore a lab coat, protective eyewear,
and gloves at all times. Material safety data sheets (MSDS) sheets for the test kit is provided on
the 3M™ LeadCheck™ Swabs website.
A single swab and possibly a test confirmation card were produced as waste for a single test. No
special disposal conditions were noted in the test kit instructions.
The use of the LeadCheck™ Swabs on drywall and plaster requires a drop or two of reactant
solution be released from the swab into the notched paint pocket that was formed using a utility
knife. Both the technical and non-technical operators had some difficulty getting a drop of the
reactant solution to drop into the notched paint pocket to ensure proper contact with the notched
flap. In some instances the drop would miss the pocket entirely, causing a potential problem as
there are only a limited number of drops available in each swab.
The LeadCheck™ Swabs were generally quick to use. For most positive samples, operation of
the test kit was instantaneous (within 30 seconds) to up to 5 minutes, for one sample for both the
technical and non-technical operator. Over 90% of the non-technical operator‟s positive results
and over 80% of the technical operator‟s positive results were instantaneous. In one instance a
positive response was not noted until 30 minutes after the application of the liquid solution. This
sample was not checked every minute for a color change, so it is possible that a red color
appeared prior to exactly 30 minutes from the start of the test. No power supply was needed for
the operation of the test kit. The 3M™ LeadCheck™ Swabs cost less than $5 per swab and are
sold in 2-packs, 8-swab packs, and contractor packs of 144 swabs.

36
Chapter 7
Performance Summary
The overall observed false positive rate for the LeadCheck™ Swabs on PEMs with confirmed
lead levels of ≤ 0.8 mg/cm2 was 70% for the technical operator and 98% for the non-technical
operator. The overall observed false negative rate on PEMs with confirmed lead levels ≥1.2
mg/cm2 was 1% for the technical operator and 0% for the non-technical operator.
Overall observed false positive rates on PEMs with confirmed lead levels <1.0 mg/cm2 were
75% for the technical operator and 98% for the non-technical operator. False negative rates for
PEMs with confirmed lead levels of ≥ 1.0 mg/cm2 were 1% for the technical operator and 0% for
the non-technical operator.
The LeadCheck™ Swabs provided overall consistent responses (either positive or negative) for
both the technical and non-technical operator for all lead levels except for the combined results
at 0.0 mg/cm2. The non-technical operator and the technical operator were both consistent at 0.0
mg/cm2, but they were consistent in opposite directions; the non-technical operator consistently
obtained positive test results when there was no lead present while the technical operator
consistently obtained negative results on those same panels. When their results are combined,
therefore, they are inconsistent. Across all substrates, lead type, and operator, responses
produced by the LeadCheck™ Swabs on PEMs with confirmed lead levels at all other levels
>0.0 mg/cm2 were consistently positive 99-100% of the time. Results from the LeadCheck™
Swabs test kit indicated 100% precision on PEMs containing no lead and 100% precision on
yellow and white lead PEMs.
The LeadCheck™ Swabs were also sensitive down to 1.0 mg/cm2 lead across both operator types
and lead levels. This is the lowest sensitivity attainable based on the test design. The
LeadCheck™ Swabs did, however, provide positive responses to lead concentrations <1.0
mg/cm2.
Under the RRP rule, a test kit must yield a demonstrated probability (with 95% confidence) of no
more than 10% false positives at lead concentrations below 0.8 mg/cm2 and a demonstrated
probability (with 95% confidence) of no more than 5% false negatives at concentrations above
1.2 mg/cm2 to meet the rule criteria. The modeled probability curve results indicate that at 0.8
mg/cm2, the upper prediction bound does not provide a false positive rate of ≤10%. A false
negative rate of ≤5% is predicted. The actual predicated false negative rate for the LeadCheck™
Swabs is 4.9%.

37
Based on the modeled probabilities, an overall false positive threshold value (i.e., the lead level,
with 95% confidence, below which the test kit would yield fewer than 10% false positive results)
could not be established at any lead level. Similarly, across all factors of significance, a false
negative threshold value (the lead level, with 95% confidence, above which the test kit would
yield fewer than 5% false negative results) of 1.2 mg/cm2 could be established for the
LeadCheck™ Swabs.
Both the technical and non-technical operator found the LeadCheck™ Swabs instructions to be
clear, informative, and easy to follow. Step-by-step instructions were provided with picture
demonstrations of some steps being completed. The ampoules containing the reactive solutions
within the swabs were easy to crush.
The LeadCheck™ Swabs were provided in bulk for the purposes of this test. However, the
swabs are available in retailer and contractor packs containing various amounts of swabs. The
kit includes swabs, a test confirmation card, and instructions. The testing solution is self-
contained within each swab. The user was expected to supply a utility knife for notching the
paint.
A single swab and possibly a test confirmation card were produced as waste for a single test. No
special disposal conditions were noted in the test kit instructions.
The use of the LeadCheck™ Swabs on drywall and plaster require that a drop of activated
solution be released from the swab into the notched paint pocket that was formed with a utility
knife. Both the technical and non-technical operators found it often difficult to predict where the
drop would come out of the swab tip and thus aim the drop correctly to ensure proper contact
with the notched flap. In some instances the drop would miss the pocket entirely. There are a
limited number of drops available for use with each swab.
The LeadCheck™ Swabs were generally quick to use. For most positive samples, operation of
the test kit was instantaneous (within 30 seconds) to up to 5 minutes, for one sample for both the
technical and non-technical operator. Over 90% of the non-technical operator‟s positive results
and over 80% of the technical operator‟s positive results were instantaneous. No power supply
was needed for the operation of the test kit. The 3M™ LeadCheck™ Swabs cost less than $5 per
swab and are sold in 2-packs, 8-swab packs, and contractor packs of 144 swabs.

38
Chapter 8
References
1. Test/QA Plan for Verification of Qualitative Spot Test Kits for Lead in Paint, Battelle,
Columbus, Ohio, March 29, 2010.
2. “Lead Renovation, Repair, and Painting Program Final Rule”, Federal Register, 73:78
(April 22, 2008), p.21692.
3. President‟s Task Force on Environmental Health Risks and Safety Risks to Children.
Eliminating Childhood Lead Poisoning: A Federal Strategy Targeting Lead Paint Hazards.
2000. Washington, DC.
4. NISTIR 6398, “Spot Test Kit for Detecting Lead in Household Paint: A Laboratory
Evaluation,” NIST, May 2000.
5. ASTM E1828, “Standard Practice for Evaluating the Performance Characteristics of
Qualitative Chemical Spot Test Kits for Lead in Paint,” ASTM International.
6. Revised Plan For Development And Production Of Performance Evaluation Materials For
Testing Of Test Kits For Lead In Paint Under The Environmental Technology Verification
Program, Battelle, Columbus, Ohio, September 2008.
7. Standard Operating Procedure for Collection of Dried Paint Samples for Lead Determination,
Battelle, Columbus, OH.
8. ASTM E1729, “Standard Practice for Field Collection of Dried Paint Samples for
Subsequent Lead Determination,” ASTM International.
9. Cook, J. and L. A. Stefanski. 1994. A simulation extrapolation method for parametric
measurement error models. Journal of the American Statistical Association 89: 1314–1328.
10. Hardin, J. W., H. Schmiediche, and R. J. Carroll. 2003a. The simulation extrapolation
method for fitting generalized linear models with additive measurement error. Stata Journal
3(4): 373-385.
11. Hardin, J. W. and R. J. Carroll. 2003b. Measurement error, GLMs, and notational
conventions. Stata Journal 3(4): 328–340.

39
12. Hardin, J. W., H. Schmiediche, and R. J. Carroll. 2003c. The regression-calibration method
for fitting generalized linear models with additive measurement error. Stata Journal 3(4):
360–371.
13. Stefanski, L. A. and J. Cook. 1995. Simulation extrapolation: The measurement error
jackknife. Journal of the American Statistical Association 90(432): 1247–1256.

Appendix A
Performance Evaluation Materials
Summary Information

A-2
List of Abbreviations and Acronyms
ASTM American Society for Testing and Materials
CCV continuing calibration verification
CoV coefficient of variation
CRM certified reference material
DI deionized
EPA U.S. Environmental Protection Agency
ESTE Environmental and Sustainable Technology Evaluations
ETV Environmental Technology Verification
FT film thickness
HVLP high volume/low pressure
ICP-AES inductively coupled plasma-atomic emission spectrometry
ICS interference check sample
ICV initial calibration verification
LCS laboratory control spike
g/L micrograms per liter
L microliters
mg/cm2 milligrams per centimeter squared
mg/kg milligrams per kilogram
mL milliliter
MSDS material safety data sheets
NLLAP National Lead Laboratory Accreditation Program
PEM performance evaluation material
ppb parts per billion
QA quality assurance
QC quality control
RH relative humidity
RPD relative percent difference
SOP standard operating procedure

A-3
Section A1
Preparation of
Performance Evaluation Materials

A-4
Executive Summary
Battelle prepared a batch of performance evaluation materials (PEMs) for use in the evaluation
of the performance of the 3M™ LeadCheck™ Swabs lead paint test kits. These PEMs
encompass two lead types (white lead [lead carbonate] and yellow lead [lead chromate]), two
separate substrates (drywall and plaster), and six lead levels within each lead type (0.3, 0.6, 1.0,
1.4, 2.0, and 6.0 mg/cm2). The goal of the production was to produce panels at a specified lead
level with minimal variability across and within panels.
The PEMs produced for this test were produced in the same manner as those for the EPA ETV
ESTE verification test of lead paint test kits and in accordance with the EPA-approved
test/quality assurance (QA) plan for this evaluation. The study design called for a verification
and homogeneity study involving inductively coupled plasma (ICP) testing of the painted metal
panels to determine applied lead levels. All lead paint layers were applied via drawdown bar,
which enables more precision in the thickness of the paint layer applied.
Verification and homogeneity testing was conducted for all 12 lead paints as well as the one no-
lead control paint. Verification testing determined the formulation and drawdown bar best suited
to yield a particular lead level. Homogeneity test results were assessed for proximity to target
lead levels, lead level range, and variability within and between PEM panels. Verification and
homogeneity testing results were presented to and discussed with EPA prior to use. Paints used
for PEM production either passed verification and homogeneity testing requirements or were
determined, in consultation with EPA, to be acceptable for use.
After completing the verification and homogeneity testing, lead base paint layers were applied
for all 12 sets of lead paints (two lead types by six lead levels) and the no-lead paint. Paint chips
were sampled and analyzed from the metal reference panels within each set of PEMs. The metal
reference panel measurements met target specifications for all sets of PEMs. Each panel was
appropriately labeled and packaged. All reference PEM concentrations and homogeneity results
were reviewed and approved by EPA prior to full-scale production of a set.
Study Design
The initial study design specified production of the ETV ESTE PEMs using six lead levels (0.3,
0.6, 1.0, 1.4, 2.0, and 6.0 mg/cm2), two lead types (white and yellow lead), four substrates
(wood, metal, drywall, and plaster), and three topcoat colors (white, red-orange, and grey-black).
Because the LeadCheck™ Swabs were previously approved for use on metal and wood
substrates, only the drywall and plaster substrates were prepared and analyzed for the purposes
of this test. The PEMs produced for evaluation in this test are presented in Table A-1.

A-5
Table A-1: PEMs Produced for LeadCheck™ Swabs Evaluation
Substrate Preparation
The PEMs included two different substrate types – drywall and plaster. The following bulleted
lists describe the steps taken to prepare each of the types of substrates.
Drywall
• 4″ x 8″ x 3/8″ gypsum drywall sheets were cut into 3″ x 3″ panels.
Plaster
• Two joint compound materials were evaluated for ease of application and smoothness to
ensure the best surface for coating. USG Joint Compound provided the smoothest
surface and was used to coat panels at about 1/32″ thickness.
• A 3″ x 4′ strip of 3/8″ thick gypsum drywall was placed into jig, and then plaster joint
compound was smoothed over top surface to a precise 1/32″ thickness. Plastered drywall
strips were then cut down into 3″ x 3″ panels.
Sealer Application to Drywall and Plaster PEMs
• Stacks of drywall and plaster PEMs were sealed on cut edges with no lead latex
primer/sealer to eliminate dusting.
All panels were then placed in constant temperature and humidity conditioning rooms prior to
coating application.
# Samples Produced by Topcoat Color
Lead Type Lead Level (mg/cm
2) Substrate White Red-Orange Grey-Black Total
Control Blank 0 Drywall 3 3 3 9
Plaster 3 3 3 9
White Lead (Lead Carbonate)
0.3 Drywall 3 3 3 9
Plaster 3 3 3 9
0.6 Drywall 3 3 3 9
Plaster 3 3 3 9
1.0 Drywall 3 3 3 9
Plaster 3 3 3 9
1.4 Drywall 3 3 3 9
Plaster 3 3 3 9
2.0 Drywall 3 3 3 9
Plaster 3 3 3 9
6.0 Drywall 3 3 3 9
Plaster 3 3 3 9
Yellow Lead (Lead Chromate)
0.3, 0.6, 1.0, 1.4, 2.0, 6.0
Drywall Plaster
3 panels per cell for other substrates (same design as White Lead panels)
108
Subtotal - Per Test Kit 78 78 78 234

A-6
Spray Application Facilities and Equipment
Battelle‟s laboratory includes a walk-in spray booth capable of this type of production as well as
air handling equipment and monitors to ensure the safety of Battelle staff. All application of lead
paint layers was performed using drawdown bars in a laboratory flow hood setting. All topcoats
were applied by spray application in the spray booth. Details on the equipment used in these
processes are listed below.
Spray Booth
• 10′ x 10′ x 7.5′ double door spray booth.
• Compressed air supply for spray equipment.
• Spray equipment consists of a high volume/low pressure (HVLP) gravity fed DeVilbiss
spray gun.
• Plastic sheeting covering walls and floor to minimize clean-up time.
Conditioning Rooms
• Constant temperature (75°Farenheit)) and humidity (50% relative humidity [RH])) rooms
for substrate conditioning (the variability in temperature and RH is not tracked in those
rooms).
• Substrates were conditioned both before and after coating application. All substrates were
conditioned a minimum of 48 hours after coating and before bagging and wrapping.
• Plastic covering was placed on the floor to minimize clean-up time after transporting
drying racks from the coating application lab into the conditioning rooms.
Environmental Health and Safety
Battelle developed a health and safety plan related to producing lead-based paint and PEMs
coated with these paints. The plan was approved internally by appropriate environmental safety
and health personnel. Environmental monitoring during paint mixing and spraying activities
determined that lead exposure levels for workers were below Occupational Safety and Health
Administration standards. Some of the components of the safety plan included:
All staff and any visitors were required to have documented hazard communication
training on lead.
• Baseline and post-work blood-lead levels were obtained for those Battelle staff that
conducted the paint mixing and spray painting.
• Respirators were used during leaded paint production.
• Spray application operations staff were required to have a physical, appropriate training,
and to pass a respirator fit test.
The interior of the spray booth was covered with plastic or other material that could be
easily removed and was then disposed of as hazardous waste.
The area in front of the booth was set up as a change-out area where personal protective
equipment, such as coveralls, etc., could be removed without spreading lead outside of
the area.
Warning signs restricting access were posted at the paint booth door.

A-7
Preparation of Linseed Oil Based Leaded Paints
To formulate historically accurate lead-based paints to apply to PEMs, Battelle consulted
Bennett‟s The Chemical Formulary – A Collection of Valuable, Timely, Practical Commercial
Formulae and Recipes for Making Thousands of Products in Many Fields of Industry, Volume
VI.1 The Chemical Formulary had been printed with revisions every year until at least 1998.
Sample formulations from this reference are listed below in Table A-2. Since the paints
produced for the ETV verification of lead test kits were being applied to metal, drywall, plaster
and wood, Battelle used a combination of formulations from Chapter Thirteen – Paint, Varnish,
Lacquer and Other Coatings to ensure adhesion to all substrates. Battelle reviewed the various
relevant historical formulations and developed formulations to apply to the PEMs that would
work best for application to the four substrates being used, i.e. would provide the best adhesion
to the variety of substrates required while achieving desired target lead levels.
Table A-2: Paint Formulations from The Chemical Formulary
Floor Painting and Finishing (p.
281) (for raw wood)
Soft Paste White Lead, 100 lb. Raw Linseed Oil, 3 gal. Turpentine, 2 gal. Liquid Drier, 1 pt.
Plaster, Primer (p. 332)
White Lead, Semi-Paste, 100 lb. Interior Varnish, 4 gal. Linseed Oil, Kettle Bodied, 2 gal. Turpentine, ¾ gal.
Exterior House Paint Pigments
White (p. 328) 35% Leaded Oxide, 45 lb. White Lead, 18 lb. Titanium Dioxide, 15 lb.
Inert, 22 lb. (Battelle used Zinc
Oxide)
In preparing the lead-based paints for the PEMs, Battelle used a combination of raw and boiled
linseed oil to ensure realistic drying time and good adhesion to the variety of substrates. A
variety of other formulas in the reference also mix these two resins.
A similar formulation was also found in Charles Uebele‟s Paint Making and Color Grinding: A
Practical Treatise for Paint Manufacturers and Factory Managers2. The excerpt below explains
the difference in formulation requirements based on the substrate to which the paint will be
applied.
“CHAPTER XXV - DIPPING PAINTS.
Dipping Paints for Wood or Metal require to be made specially for either surface, as that
intended for wood will not always serve the purpose for metal. The paint for wood
requires to contain a pigment that acts as a filler, while tin or smooth sheet iron or steel
does not necessarily need it, in fact, it is best without it for certain metallic surfaces. The
function of a dipping paint is, first of all, to economize in labor, to cover uniformly
any article immersed in it, and to dip freely without leaving fringes of paint at the edges
and dry equally all over the surface thus coated.
Metal Preservative Red may be made by grinding a base of 40 pounds bright red oxide of
95 per cent, purity, 8 pounds red lead, 2 pounds zinc chromate, 25 pounds floated silex or
silica in 25 pounds raw linseed oil thinning same with 5 gallons raw linseed oil, 1 gallon

A-8
hard gum japan and Y% gallon turps. This will produce 12 gallons of paint weighing a
trifle over ll pounds per gallon. By substituting a long stock of hard gum varnish for part
of the 5 gallons raw oil a hard drying product will be the result.”
In support of achieving consistent application of the lead-based paints in terms of film thickness
and lead level, Battelle investigated additions of various elements to mitigate settling and
improve application. Silicon dioxide was selected for this purpose because it was present in pre-
1978 leaded paints, is used for thickening and anti-settling properties in modern paint
formulations, and achieved the most consistent results. Battelle established the historical
precedent for including silica in paints in a technical report submitted to EPA on February 19,
20093.
The primer and topcoats applied to the PEMs on top of the lead-based paints (or base paint for
the no-lead panels) all contain some form of Diatomaceous Silica, as well. The primer and three
topcoats applied are listed below.
Sherwin Williams brand PreRite Bonding Primer
Sherwin Williams Classic 99 Interior Satin Latex color Extra White
Sherwin Williams Classic 99 Interior Satin Latex color 7047 Software (Grey)
Sherwin Williams Accents Interior Satin Latex color 6867 Fireworks (red-orange)
Section 2 of the primer Material Safety Data Sheet (MSDS) specifies that the primer contains 9%
quartz. Quartz is referred to as “Crystalline Silica” in Section 11 of the MSDS. The MSDSs for
the three topcoats specify Cristobalite (CAS 14464-46-1) as an ingredient, which is a synonym
for silicon dioxide and also referred to as Crystalline Silica in Section 11. All panels have some
level of silica in the topcoat layers.
The paint formulations used for this effort were based on historical records. Primary ingredients
included zinc oxide, raw and boiled linseed oil, turpentine, Japan drier, either lead carbonate or
lead chromate, and titanium dioxide (used to balance the levels of lead). Nine different paint
formulations were produced as dictated by the two lead pigments (lead carbonate and lead
chromate) and the six different lead levels in addition to the zero lead level control. The
formulations were designed to consistently achieve the lead levels required when applied at
typical wet film builds.
The paint formulations are shown in Tables A-3 and A-4 below. Since the molecular
compositions of the two lead pigments are different, the formulations have accounted for these
differences by adjusting the load levels. However, the formulations for the 0% lead chromate
and carbonate were the same because no lead pigment was used in either.

A-9
Table A-3. White Lead (Lead Carbonate) Paint Formulations
Materials GW Lot# Supplier 0 Lead 0 Lead % by wt. Gram wt
ZnO 47.3 ZC-X013 The Carry Co. 14.79 59.67% 1491.75
Pb CO3 51 1401047-267 American Elements 0.00 0.00% 0.00
TiO2 37 931407T.12 DuPont 6.16 24.86% 621.56
Linseed Oil 7.8 83734 Recochem Inc. 1.48 5.97% 149.18
Boiled Linseed Oil 7.7 83404 Recochem Inc. 0.15 0.60% 14.92
Turpentine 7.0 83304 Recochem Inc. 2.16 8.70% 217.55
Japan Drier 7.0 PJD 40 Barr 0.05 0.20% 5.04
Total 24.8 100% 2500
Sample reduced to 60% solids, 0% of TS-100 silica added then sprayed to thickness.
Materials GW Lot# Supplier 0.3 Lead 0.3 Lead % by wt. Gram wt
ZnO 47.3 ZC-X013 The Carry Co. 14.85 59.08% 1477.08
Pb CO3 51 1401047-267 American Elements 1.49 5.91% 147.71
TiO2 37 931407T.12 DuPont 4.95 19.69% 492.36
Linseed Oil 7.8 83734 Recochem Inc. 1.49 5.91% 147.71
Boiled Linseed Oil 7.7 83404 Recochem Inc. 0.15 0.59% 14.77
Turpentine 7 83304 Recochem Inc. 2.17 8.62% 215.41
Japan Drier 7 PJD 40 Barr 0.05 0.20% 4.97
Total 25.1 100% 2500
Sample reduced to 60% solids, 0% of TS-100 silica added then sprayed to 3 mils wet.
Materials GW Lot# Supplier 0.6 Lead 0.6 Lead % by wt. Gram wt
ZnO 47.3 ZC-X013 The Carry Co. 14.77 58.45% 1461.22
Pb CO3 51 1401047-267 American Elements 1.77 7.00% 175.11
TiO2 37 931407T.12 DuPont 4.92 19.47% 486.74
Linseed Oil 7.8 83734 Recochem Inc. 1.48 5.86% 146.42
Boiled Linseed Oil 7.7 83404 Recochem Inc. 0.15 0.59% 14.84
Turpentine 7 83304 Recochem Inc. 2.15 8.51% 212.70
Japan Drier 7 PJD 40 Barr 0.03 0.12% 2.97
Total 25.3 100% 2500
Sample reduced to 70% solids, 0.7% of TS-100 silica added then drawdown with # 24 bar.
Materials GW Lot# Supplier 1.0 Lead 1.0 Lead % by wt Gram wt
ZnO 47.3 ZC-X013 The Carry Co. 14.40 55.53% 832.88
Pb CO3 51 1401047-267 American Elements 3.00 11.57% 173.52
TiO2 37 931407T.12 DuPont 4.80 18.51% 277.63
Linseed Oil 7.8 83734 Recochem Inc. 1.44 5.55% 83.29
Boiled Linseed Oil 7.7 83404 Recochem Inc. 0.14 0.56% 8.33
Turpentine 7 83304 Recochem Inc. 2.10 8.10% 121.46
Japan Drier 7 PJD 40 Barr 0.05 0.19% 2.89
Total 25.9 100% 1500
This formulation will be used to produce 0.6% and 1.4% lead levels at different coating thickness.
Materials GW Lot# Supplier 1.4 Lead 1.4 Lead % by wt Gram wt
ZnO 47.3 ZC-X013 The Carry Co. 13.22 50.94% 764.16
Pb CO3 51 1401047-267 American Elements 4.21 16.22% 243.35
TiO2 37 931407T.12 DuPont 4.81 18.54% 278.03
Linseed Oil 7.8 83734 Recochem Inc. 1.44 5.55% 83.24
Boiled Linseed Oil 7.7 83404 Recochem Inc. 0.14 0.54% 8.09
Turpentine 7 83304 Recochem Inc. 2.1 8.09% 121.39
Japan Drier 7 PJD 40 Barr 0.03 0.12% 1.73
Total 26.0 100% 1500
Sample reduced to 70 % solids, 1.5% of TS-100 silica added then drawdown with # 54 bar.
Materials GW Lot# Supplier 2.0 Lead 2.0 Lead % by wt Gram wt
ZnO 47.3 ZC-X013 The Carry Co. 12.88 48.16% 722.42
Pb CO3 51 1401047-267 American Elements 6.08 22.73% 340.98
TiO2 37 931407T.12 DuPont 4.12 15.41% 231.17
Linseed Oil 7.8 83734 Recochem Inc. 1.41 5.28% 79.20
Boiled Linseed Oil 7.7 83404 Recochem Inc. 0.14 0.53% 7.92
Turpentine 7 83304 Recochem Inc. 2.06 7.70% 115.50
Japan Drier 7 PJD 40 Barr 0.05 0.19% 2.80
Total 26.7 100% 1500
Sample reduced to 65% solids, 1.5% of TS-100 silica added then drawdown with #40 bar.
Materials GW Lot# Supplier 6.0 Lead 6.0 Lead % by wt Gram wt
ZnO 47.3 ZC-X013 The Carry Co. 4.70 16.73% 250.89
Pb CO3 51 1401047-267 American Elements 18.10 64.49% 967.34
TiO2 37 931407T.12 DuPont 1.57 5.58% 83.63
Linseed Oil 7.8 83734 Recochem Inc. 1.43 5.09% 76.40
Boiled Linseed Oil 7.7 83404 Recochem Inc. 0.14 0.51% 7.64
Turpentine 7 83304 Recochem Inc. 2.09 7.43% 111.42
Japan Drier 7 PJD 40 Barr 0.05 0.18% 2.67
Total 28.1 100% 1500
Sample reduced to 70% solids, 1% of TS-100 silica added then sprayed to thickness.
1.4% Lead Carbonate Paint Formulation
2.0% Lead Carbonate Paint Formulation
6.0% Lead Carbonate Paint Formulation
0% Lead Carbonate Paint Formulation
0.3% Lead Carbonate Paint Formulation
0.6% Lead Carbonate Paint Formulation
1.0% Lead Carbonate Paint Formulation
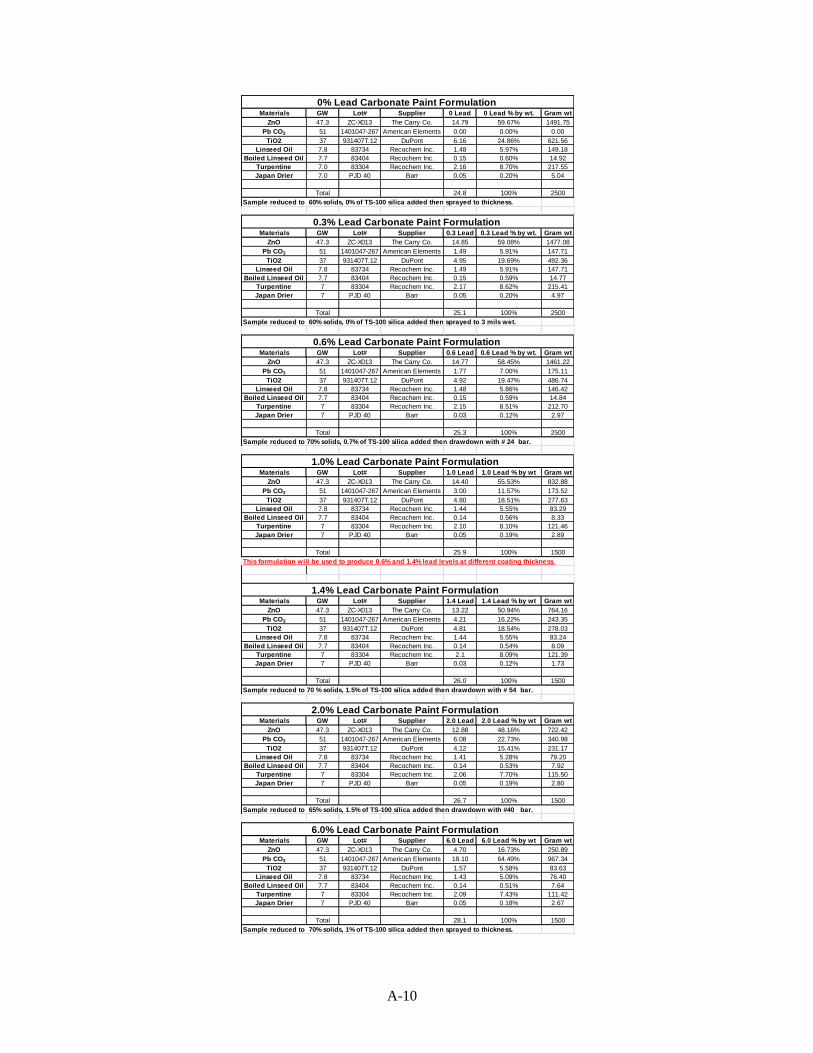
A-10
Materials GW Lot# Supplier 0 Lead 0 Lead % by wt. Gram wt
ZnO 47.3 ZC-X013 The Carry Co. 14.79 59.67% 1491.75
Pb CO3 51 1401047-267 American Elements 0.00 0.00% 0.00
TiO2 37 931407T.12 DuPont 6.16 24.86% 621.56
Linseed Oil 7.8 83734 Recochem Inc. 1.48 5.97% 149.18
Boiled Linseed Oil 7.7 83404 Recochem Inc. 0.15 0.60% 14.92
Turpentine 7.0 83304 Recochem Inc. 2.16 8.70% 217.55
Japan Drier 7.0 PJD 40 Barr 0.05 0.20% 5.04
Total 24.8 100% 2500
Sample reduced to 60% solids, 0% of TS-100 silica added then sprayed to thickness.
Materials GW Lot# Supplier 0.3 Lead 0.3 Lead % by wt. Gram wt
ZnO 47.3 ZC-X013 The Carry Co. 14.85 59.08% 1477.08
Pb CO3 51 1401047-267 American Elements 1.49 5.91% 147.71
TiO2 37 931407T.12 DuPont 4.95 19.69% 492.36
Linseed Oil 7.8 83734 Recochem Inc. 1.49 5.91% 147.71
Boiled Linseed Oil 7.7 83404 Recochem Inc. 0.15 0.59% 14.77
Turpentine 7 83304 Recochem Inc. 2.17 8.62% 215.41
Japan Drier 7 PJD 40 Barr 0.05 0.20% 4.97
Total 25.1 100% 2500
Sample reduced to 60% solids, 0% of TS-100 silica added then sprayed to 3 mils wet.
Materials GW Lot# Supplier 0.6 Lead 0.6 Lead % by wt. Gram wt
ZnO 47.3 ZC-X013 The Carry Co. 14.77 58.45% 1461.22
Pb CO3 51 1401047-267 American Elements 1.77 7.00% 175.11
TiO2 37 931407T.12 DuPont 4.92 19.47% 486.74
Linseed Oil 7.8 83734 Recochem Inc. 1.48 5.86% 146.42
Boiled Linseed Oil 7.7 83404 Recochem Inc. 0.15 0.59% 14.84
Turpentine 7 83304 Recochem Inc. 2.15 8.51% 212.70
Japan Drier 7 PJD 40 Barr 0.03 0.12% 2.97
Total 25.3 100% 2500
Sample reduced to 70% solids, 0.7% of TS-100 silica added then drawdown with # 24 bar.
Materials GW Lot# Supplier 1.0 Lead 1.0 Lead % by wt Gram wt
ZnO 47.3 ZC-X013 The Carry Co. 14.40 55.53% 832.88
Pb CO3 51 1401047-267 American Elements 3.00 11.57% 173.52
TiO2 37 931407T.12 DuPont 4.80 18.51% 277.63
Linseed Oil 7.8 83734 Recochem Inc. 1.44 5.55% 83.29
Boiled Linseed Oil 7.7 83404 Recochem Inc. 0.14 0.56% 8.33
Turpentine 7 83304 Recochem Inc. 2.10 8.10% 121.46
Japan Drier 7 PJD 40 Barr 0.05 0.19% 2.89
Total 25.9 100% 1500
This formulation will be used to produce 0.6% and 1.4% lead levels at different coating thickness.
Materials GW Lot# Supplier 1.4 Lead 1.4 Lead % by wt Gram wt
ZnO 47.3 ZC-X013 The Carry Co. 13.22 50.94% 764.16
Pb CO3 51 1401047-267 American Elements 4.21 16.22% 243.35
TiO2 37 931407T.12 DuPont 4.81 18.54% 278.03
Linseed Oil 7.8 83734 Recochem Inc. 1.44 5.55% 83.24
Boiled Linseed Oil 7.7 83404 Recochem Inc. 0.14 0.54% 8.09
Turpentine 7 83304 Recochem Inc. 2.1 8.09% 121.39
Japan Drier 7 PJD 40 Barr 0.03 0.12% 1.73
Total 26.0 100% 1500
Sample reduced to 70 % solids, 1.5% of TS-100 silica added then drawdown with # 54 bar.
Materials GW Lot# Supplier 2.0 Lead 2.0 Lead % by wt Gram wt
ZnO 47.3 ZC-X013 The Carry Co. 12.88 48.16% 722.42
Pb CO3 51 1401047-267 American Elements 6.08 22.73% 340.98
TiO2 37 931407T.12 DuPont 4.12 15.41% 231.17
Linseed Oil 7.8 83734 Recochem Inc. 1.41 5.28% 79.20
Boiled Linseed Oil 7.7 83404 Recochem Inc. 0.14 0.53% 7.92
Turpentine 7 83304 Recochem Inc. 2.06 7.70% 115.50
Japan Drier 7 PJD 40 Barr 0.05 0.19% 2.80
Total 26.7 100% 1500
Sample reduced to 65% solids, 1.5% of TS-100 silica added then drawdown with #40 bar.
Materials GW Lot# Supplier 6.0 Lead 6.0 Lead % by wt Gram wt
ZnO 47.3 ZC-X013 The Carry Co. 4.70 16.73% 250.89
Pb CO3 51 1401047-267 American Elements 18.10 64.49% 967.34
TiO2 37 931407T.12 DuPont 1.57 5.58% 83.63
Linseed Oil 7.8 83734 Recochem Inc. 1.43 5.09% 76.40
Boiled Linseed Oil 7.7 83404 Recochem Inc. 0.14 0.51% 7.64
Turpentine 7 83304 Recochem Inc. 2.09 7.43% 111.42
Japan Drier 7 PJD 40 Barr 0.05 0.18% 2.67
Total 28.1 100% 1500
Sample reduced to 70% solids, 1% of TS-100 silica added then sprayed to thickness.
1.4% Lead Carbonate Paint Formulation
2.0% Lead Carbonate Paint Formulation
6.0% Lead Carbonate Paint Formulation
0% Lead Carbonate Paint Formulation
0.3% Lead Carbonate Paint Formulation
0.6% Lead Carbonate Paint Formulation
1.0% Lead Carbonate Paint Formulation

A-11
Table A-4. Yellow Lead (Lead Chromate) Paint Formulations
Materials GW Lot# Supplier 0.3 Lead 0.3 Lead % by wt. Gram wt
ZnO 47.3 ZC-X013 The Carry Co. 14.97 60.03% 1500.74
PbCrO4 51 1401047-267 American Elements 1.10 4.40% 110.05
TiO2 37 931407T.12 DuPont 4.99 20.01% 500.25
Linseed Oil 7.8 83734 Recochem Inc. 1.50 6.00% 150.07
Boiled Linseed Oil 7.7 83404 Recochem Inc. 0.15 0.60% 15.01
Turpentine 7 83304 Recochem Inc. 2.18 8.75% 218.86
Japan Drier 7 PJD 40 Barr 0.05 0.20% 5.01
Total 24.9 100% 2500
Sample reduced to 70 % solids, 0.7% of TS-100 silica added then drawdown with #34 bar.
Materials GW Lot# Supplier 0.6 Lead 0.6 Lead % by wt. Gram wt
ZnO 47.3 ZC-X013 The Carry Co. 14.65 57.52% 1437.97
PbCrO4 51 1401047-267 American Elements 2.15 8.44% 211.03
TiO2 37 931407T.12 DuPont 4.88 19.16% 478.99
Linseed Oil 7.8 83734 Recochem Inc. 1.47 5.77% 144.29
Boiled Linseed Oil 7.7 83404 Recochem Inc. 0.15 0.59% 14.72
Turpentine 7 83304 Recochem Inc. 2.14 8.40% 210.05
Japan Drier 7 PJD 40 Barr 0.03 0.12% 2.94
Total 25.5 100% 2500
Sample reduced to 70 % solids, 1.5% of TS-100 silica added then drawdown with #24 bar.
Materials GW Lot# Supplier 1.0 Lead 1.0 Lead % by wt Gram wt
ZnO 47.3 ZC-X013 The Carry Co. 14.40 55.53% 832.88
PbCrO4 51 1401047-267 American Elements 3.00 11.57% 173.52
TiO2 37 931407T.12 DuPont 4.80 18.51% 277.63
Linseed Oil 7.8 83734 Recochem Inc. 1.44 5.55% 83.29
Boiled Linseed Oil 7.7 83404 Recochem Inc. 0.14 0.56% 8.33
Turpentine 7 83304 Recochem Inc. 2.10 8.10% 121.46
Japan Drier 7 PJD 40 Barr 0.05 0.19% 2.89
Total 25.9 100% 1500
This formulation will be used to produce 0.6% and 1.4% lead levels at different coating thickness.
Sample reduced to 70 % solids, 1% of TS-100 silica added then drawdown with #48 bar.
Materials GW Lot# Supplier 1.4 Lead 1.4 Lead % by wt Gram wt
ZnO 47.3 ZC-X013 The Carry Co. 13.21 50.40% 1260.02
PbCrO4 51 1401047-267 American Elements 5.09 19.42% 485.50
TiO2 37 931407T.12 DuPont 4.2 16.02% 400.61
Linseed Oil 7.8 83734 Recochem Inc. 1.44 5.49% 137.35
Boiled Linseed Oil 7.7 83404 Recochem Inc. 0.14 0.53% 13.35
Turpentine 7 83304 Recochem Inc. 2.1 8.01% 200.31
Japan Drier 7 PJD 40 Barr 0.03 0.11% 2.86
Total 26.2 100% 2500
Sample reduced to 70 % solids, 1% of Aerosil 200 silica added then drawdown with #60 bar.
Materials GW Lot# Supplier 2.0 Lead 2.0 Lead % by wt Gram wt
ZnO 47.3 ZC-X013 The Carry Co. 10.90 42.32% 1058.12
PbCrO4 51 1401047-267 American Elements 7.17 27.83% 695.72
TiO2 37 931407T.12 DuPont 3.81 14.81% 370.34
Linseed Oil 7.8 83734 Recochem Inc. 1.49 5.80% 145.00
Boiled Linseed Oil 7.7 83404 Recochem Inc. 0.15 0.58% 14.50
Turpentine 7 83304 Recochem Inc. 2.18 8.46% 211.46
Japan Drier 7 PJD 40 Barr 0.05 0.19% 4.85
Total 25.8 100% 2500
Sample reduced to 70% solids, 1.5% of TS-100 silica added then drawdown with #42 bar.
Materials GW Lot# Supplier 6.0 Lead 6.0 Lead % by wt Gram wt
ZnO 47.3 ZC-X013 The Carry Co. 1.65 5.99% 149.69
PbCrO4 51 1401047-267 American Elements 21.43 77.84% 1946.00
TiO2 37 931407T.12 DuPont 0.55 2.00% 49.90
Linseed Oil 7.8 83734 Recochem Inc. 1.51 5.47% 136.75
Boiled Linseed Oil 7.7 83404 Recochem Inc. 0.15 0.55% 13.68
Turpentine 7 83304 Recochem Inc. 2.20 7.98% 199.43
Japan Drier 7 PJD 40 Barr 0.05 0.18% 4.54
Total 27.5 100% 2500
Sample reduced to 70% solids, 2% of TS-100 silica added then drawdown with #54 bar.
1.4% Lead Chromate Paint Formulation
2.0% Lead Chromate Paint Formulation
6.0% Lead Chromate Paint Formulation
0.3% Lead Chromate Paint Formulation
0.6% Lead Chromate Paint Formulation
1.0% Lead Chromate Paint Formulation

A-12
Materials GW Lot# Supplier 0.3 Lead 0.3 Lead % by wt. Gram wt
ZnO 47.3 ZC-X013 The Carry Co. 14.97 60.03% 1500.74
PbCrO4 51 1401047-267 American Elements 1.10 4.40% 110.05
TiO2 37 931407T.12 DuPont 4.99 20.01% 500.25
Linseed Oil 7.8 83734 Recochem Inc. 1.50 6.00% 150.07
Boiled Linseed Oil 7.7 83404 Recochem Inc. 0.15 0.60% 15.01
Turpentine 7 83304 Recochem Inc. 2.18 8.75% 218.86
Japan Drier 7 PJD 40 Barr 0.05 0.20% 5.01
Total 24.9 100% 2500
Sample reduced to 70 % solids, 0.7% of TS-100 silica added then drawdown with #34 bar.
Materials GW Lot# Supplier 0.6 Lead 0.6 Lead % by wt. Gram wt
ZnO 47.3 ZC-X013 The Carry Co. 14.65 57.52% 1437.97
PbCrO4 51 1401047-267 American Elements 2.15 8.44% 211.03
TiO2 37 931407T.12 DuPont 4.88 19.16% 478.99
Linseed Oil 7.8 83734 Recochem Inc. 1.47 5.77% 144.29
Boiled Linseed Oil 7.7 83404 Recochem Inc. 0.15 0.59% 14.72
Turpentine 7 83304 Recochem Inc. 2.14 8.40% 210.05
Japan Drier 7 PJD 40 Barr 0.03 0.12% 2.94
Total 25.5 100% 2500
Sample reduced to 70 % solids, 1.5% of TS-100 silica added then drawdown with #24 bar.
Materials GW Lot# Supplier 1.0 Lead 1.0 Lead % by wt Gram wt
ZnO 47.3 ZC-X013 The Carry Co. 14.40 55.53% 832.88
PbCrO4 51 1401047-267 American Elements 3.00 11.57% 173.52
TiO2 37 931407T.12 DuPont 4.80 18.51% 277.63
Linseed Oil 7.8 83734 Recochem Inc. 1.44 5.55% 83.29
Boiled Linseed Oil 7.7 83404 Recochem Inc. 0.14 0.56% 8.33
Turpentine 7 83304 Recochem Inc. 2.10 8.10% 121.46
Japan Drier 7 PJD 40 Barr 0.05 0.19% 2.89
Total 25.9 100% 1500
This formulation will be used to produce 0.6% and 1.4% lead levels at different coating thickness.
Sample reduced to 70 % solids, 1% of TS-100 silica added then drawdown with #48 bar.
Materials GW Lot# Supplier 1.4 Lead 1.4 Lead % by wt Gram wt
ZnO 47.3 ZC-X013 The Carry Co. 13.21 50.40% 1260.02
PbCrO4 51 1401047-267 American Elements 5.09 19.42% 485.50
TiO2 37 931407T.12 DuPont 4.2 16.02% 400.61
Linseed Oil 7.8 83734 Recochem Inc. 1.44 5.49% 137.35
Boiled Linseed Oil 7.7 83404 Recochem Inc. 0.14 0.53% 13.35
Turpentine 7 83304 Recochem Inc. 2.1 8.01% 200.31
Japan Drier 7 PJD 40 Barr 0.03 0.11% 2.86
Total 26.2 100% 2500
Sample reduced to 70 % solids, 1% of Aerosil 200 silica added then drawdown with #60 bar.
Materials GW Lot# Supplier 2.0 Lead 2.0 Lead % by wt Gram wt
ZnO 47.3 ZC-X013 The Carry Co. 10.90 42.32% 1058.12
PbCrO4 51 1401047-267 American Elements 7.17 27.83% 695.72
TiO2 37 931407T.12 DuPont 3.81 14.81% 370.34
Linseed Oil 7.8 83734 Recochem Inc. 1.49 5.80% 145.00
Boiled Linseed Oil 7.7 83404 Recochem Inc. 0.15 0.58% 14.50
Turpentine 7 83304 Recochem Inc. 2.18 8.46% 211.46
Japan Drier 7 PJD 40 Barr 0.05 0.19% 4.85
Total 25.8 100% 2500
Sample reduced to 70% solids, 1.5% of TS-100 silica added then drawdown with #42 bar.
Materials GW Lot# Supplier 6.0 Lead 6.0 Lead % by wt Gram wt
ZnO 47.3 ZC-X013 The Carry Co. 1.65 5.99% 149.69
PbCrO4 51 1401047-267 American Elements 21.43 77.84% 1946.00
TiO2 37 931407T.12 DuPont 0.55 2.00% 49.90
Linseed Oil 7.8 83734 Recochem Inc. 1.51 5.47% 136.75
Boiled Linseed Oil 7.7 83404 Recochem Inc. 0.15 0.55% 13.68
Turpentine 7 83304 Recochem Inc. 2.20 7.98% 199.43
Japan Drier 7 PJD 40 Barr 0.05 0.18% 4.54
Total 27.5 100% 2500
Sample reduced to 70% solids, 2% of TS-100 silica added then drawdown with #54 bar.
1.4% Lead Chromate Paint Formulation
2.0% Lead Chromate Paint Formulation
6.0% Lead Chromate Paint Formulation
0.3% Lead Chromate Paint Formulation
0.6% Lead Chromate Paint Formulation
1.0% Lead Chromate Paint Formulation

A-13
Paint Formulation Procedures
The paint samples were produced using standard painting production procedures in the Battelle
laboratories, including pre-mixing, media grinding of pigment and binder resin, and paint
letdown with resin and solvents. This procedure has been used for paint production both in the
laboratory and in commercial paint manufacturing for over 50 years. The equipment utilized in
this procedure includes the following:
Variac that controls the speed of the dispersator
High speed dispersator using a 3” diameter blade on the end of the mixing shaft
Ice bath and ice
Balance
Paint cans
Medium paint filters
Red Devil paint shaker
Following are the detailed steps in the paint formulation procedure:
1. Add enough turpentine to cover mixing blade.
2. Start mixer at low speed.
3. Add zinc oxide slowly for 3-5 minutes, increasing mixing speed as needed to maintain
appropriate grind viscosity as visually evaluated by an operator skilled in the art.
4. Add turpentine as needed to keep the batch rolling.
5. Mix additional 10 minutes after addition of zinc oxide.
6. Add lead pigment slowly for 2-4 minutes, increasing mixing speed as needed.
7. Add turpentine as needed to keep the batch rolling.
8. Mix additional 10 minutes after addition of lead pigments.
9. Add titanium dioxide slowly for 3-5 minutes, increasing mixing speed as needed.
10. Add turpentine as needed to keep the batch rolling.
11. Mix for 60-90 minutes, or until batch viscosity decreases, determined by rolling action of
the batch.
12. Check Hegman, if < 5 continue to mix, and check Hegman every 10 minutes.4
13. When Hegman reaches ≠ or > 5, start the let down, which includes adding all remaining
liquid raw materials after the pigment and extenders have been dispersed adequately.
14. Add boiled and raw linseed oil slowly and decrease mixing speed.
15. Add turpentine to wash out linseed oil container.
16. Mix additional 10 minutes after addition of linseed oils.
17. Add Japan drier drop wise to batch.
18. Mix additional 10 minutes after addition of Japan drier.
19. Tare quart cans.
20. Filter batch with medium paint filters into tared quart cans.
21. Note net weight and log book number of batch on quart cans.
22. Yields about 1½ quarts of lead paint per batch.
23. Allow paint to set overnight.
24. Shake paint with Red Devil paint shaker for about 10 minutes take samples for % solids
check.
25. Check paint solids with moisture balance and record average of three test results on
formulation sheet.

A-14
26. Store paint in aluminum cans in laboratory hood until future use.
Verification and Homogeneity Studies
Various batches of paint were prepared for the initial verification tests – one targeting each lead
level. Each paint was applied via drawdown to 3.5″ x 5″ metal panels attached to a wooden rack.
For each paint type and concentration batch, panels were coated to determine proper film
thickness, formulations, and drawdown bars to use, if applicable, to achieve each desired lead
level. Subsequently, homogeneity panels were coated to investigate ability to achieve target lead
levels and variability within and across panels. Verification and homogeneity studies were
performed on metal panels only due to ease and accuracy of sample extraction, i.e., it was easiest
to obtain a 1 inch square sample from the metal surface which led to the most accurate
measurements of lead content in the sampled area, which was critical for verification purposes.
After drying, paint chip samples were obtained from the metal panels following ASTM E1729.5
Laboratory analysis for lead by inductively coupled plasma-atomic emission spectrometry (ICP-
AES) was planned and conducted at an independent National Lead Laboratory Accreditation
Program (NLLAP)-accredited laboratory, Schneider Laboratories, Inc. ICP-AES testing was
conducted on three panels for each lead level with four samples obtained from each panel,
referred to as Homogeneity Panels since the primary purpose of the samples was to assess
consistency of lead levels across and within panels. The paint chips were digested using EPA
Method 3050B6 and the ICP-AES analysis was conducted following EPA Method 6010C
7 as
well as the Schneider Laboratories, Inc. ICP SOP.8 The laboratory electronically reported lead
level measurements along with quality control (QC) sample results. Laboratory spike and
duplicate results as well as calibration verification sample results were supplied and reviewed for
each batch of samples analyzed. Acceptable recoveries for spike samples ranged from 80% to
120%. Acceptable recoveries for calibration verification samples were 90-110%. Acceptable
duplicate samples had a relative percent difference of 25% or less. There were no QC failures or
problems.
Film thickness measurements were obtained by Battelle for each paint sample taken. Results of
the final batches of homogeneity samples for each set of PEMs are included in Table A-5.
Results were evaluated to determine correspondence to target lead levels and level of variability
as measured by the coefficient of variation (CoV), the standard deviation divided by the mean.
The production plan specified a minimum acceptability of a CoV of less than 15 percent.
Following analysis, the results were forwarded to EPA with recommendations regarding ability
to proceed with production or the need for additional homogeneity testing. The results shown in
Table A-5 show that most lead levels met the acceptability requirements and were thus deemed
acceptable for proceeding with the production of the PEMs. A few lead levels showed a CoV of
slightly higher than 15%. It was determined, in consultation with EPA, that it was okay to
proceed with these paints for use in PEM production, as CoV values were not far from
acceptance limits and potential lead values derived from these ranges were within actual
production PEM values used during ETV testing and should still provide the needed spread of
PEMs across the required lead testing levels. .

A-15
Table A-5. Results from PEM Final Homogeneity Testing on Metal Substrates
Lead Type
Target Lead Level
Mean Levels CoV*
ICP (mg/cm2) FT (mils) ICP FT**
White Lead
0.3 0.38 0.78 7.73 10.53
0.6 0.69 0.73 14.02 14.76
1.0 1.09 1.30 10.82 8.92
1.4 1.49 1.62 11.47 7.93
2.0 1.91 1.06 14.37 10.02
6.0 8.34 1.62 15.92 16.04
Lead Chromate
0.3 0.34 1.11 13.20 11.64
0.6 0.68 0.80 21.68 15.54
1.0 1.10 1.35 12.05 13.61
1.4 1.32 1.78 9.14 8.76
2.0 2.06 1.00 11.70 12.06
6.0 3.88 1.02 15.42 14.38
* Coefficient of Variation (Standard Deviation/Mean x 100)
** Film thickness
Production Application of Lead Paint Coatings
Based on the results from the Verification and Homogeneity Study summarized in Table A-5,
production proceeded using the paint formulation and application method that achieved the target
lead levels. During production application, reference panels were coated along with the
production panels at a rate of 3 for each set of PEMS at a particular lead level and lead type.
Production panels were drawdown in sets of two to three panels each for the drywall substrates
and one at a time for the plaster substrates. Reference panels were prepared throughout the
production batch of PEMs at the discretion of the technician.
Metal panels were used as the reference panels since metal panels yield the most accurate
measurements of film thickness and lead levels. The reference PEMs were tested for film
thickness during application and for lead level by ICP analysis after the paint had dried. This test
procedure was used to check that the application process resulted in appropriate lead levels.
Despite the use of the metal substrate only for the reference panels, the lead levels and paint
thickness on these reference panels served as representative of the coatings applied to all drywall
and plaster panels.
Table A-6 presents the average lead levels, CoV, minimum, and maximum of each set of 3
reference panel measurements. Most sets are very close to target lead levels, such as the 0.6
mg/cm2 average for the 0.6 mg/cm
2 target white lead set, the 0.31 mg/cm
2 for the 0.3 mg/cm2
target yellow lead set, and the 2.04 mg/cm2 average for the 2.0 mg/cm
2 target yellow lead set.
There also were a few sets that were a bit off target, but were deemed sufficient to meet the
verification needs and within the range of levels prepared for the ETV ESTE verification test.
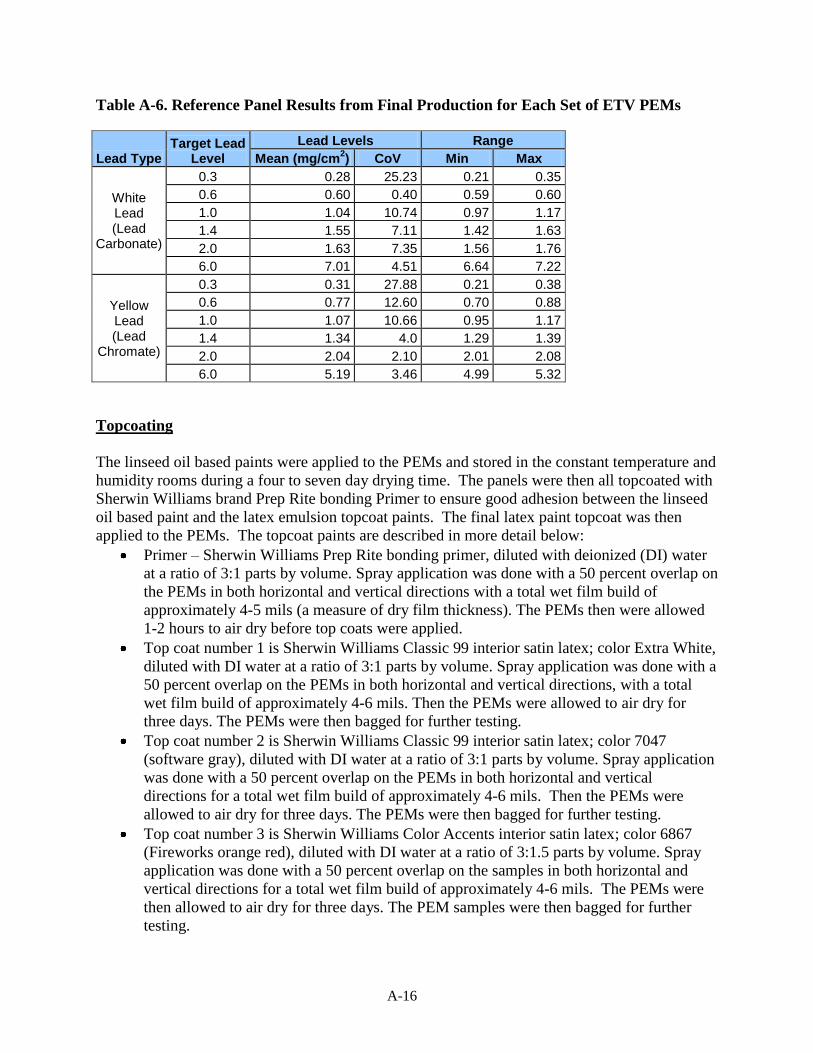
A-16
Table A-6. Reference Panel Results from Final Production for Each Set of ETV PEMs
Lead Type Target Lead
Level
Lead Levels Range
Mean (mg/cm2) CoV Min Max
White Lead (Lead
Carbonate)
0.3 0.28 25.23 0.21 0.35
0.6 0.60 0.40 0.59 0.60
1.0 1.04 10.74 0.97 1.17
1.4 1.55 7.11 1.42 1.63
2.0 1.63 7.35 1.56 1.76
6.0 7.01 4.51 6.64 7.22
Yellow Lead (Lead
Chromate)
0.3 0.31 27.88 0.21 0.38
0.6 0.77 12.60 0.70 0.88
1.0 1.07 10.66 0.95 1.17
1.4 1.34 4.0 1.29 1.39
2.0 2.04 2.10 2.01 2.08
6.0 5.19 3.46 4.99 5.32
Topcoating
The linseed oil based paints were applied to the PEMs and stored in the constant temperature and
humidity rooms during a four to seven day drying time. The panels were then all topcoated with
Sherwin Williams brand Prep Rite bonding Primer to ensure good adhesion between the linseed
oil based paint and the latex emulsion topcoat paints. The final latex paint topcoat was then
applied to the PEMs. The topcoat paints are described in more detail below:
Primer – Sherwin Williams Prep Rite bonding primer, diluted with deionized (DI) water
at a ratio of 3:1 parts by volume. Spray application was done with a 50 percent overlap on
the PEMs in both horizontal and vertical directions with a total wet film build of
approximately 4-5 mils (a measure of dry film thickness). The PEMs then were allowed
1-2 hours to air dry before top coats were applied.
Top coat number 1 is Sherwin Williams Classic 99 interior satin latex; color Extra White,
diluted with DI water at a ratio of 3:1 parts by volume. Spray application was done with a
50 percent overlap on the PEMs in both horizontal and vertical directions, with a total
wet film build of approximately 4-6 mils. Then the PEMs were allowed to air dry for
three days. The PEMs were then bagged for further testing.
Top coat number 2 is Sherwin Williams Classic 99 interior satin latex; color 7047
(software gray), diluted with DI water at a ratio of 3:1 parts by volume. Spray application
was done with a 50 percent overlap on the PEMs in both horizontal and vertical
directions for a total wet film build of approximately 4-6 mils. Then the PEMs were
allowed to air dry for three days. The PEMs were then bagged for further testing.
Top coat number 3 is Sherwin Williams Color Accents interior satin latex; color 6867
(Fireworks orange red), diluted with DI water at a ratio of 3:1.5 parts by volume. Spray
application was done with a 50 percent overlap on the samples in both horizontal and
vertical directions for a total wet film build of approximately 4-6 mils. The PEMs were
then allowed to air dry for three days. The PEM samples were then bagged for further
testing.

A-17
PEM Labeling, Packing and Storage
The PEMs were stored in the constant temperature and humidity conditioning rooms prior to
being packed up for transfer to the evaluation location. Each PEM was labeled on the back with
an individual identification number, wrapped in a single laboratory towel to protect the front
surface, and placed inside an individual zip seal bag also labeled with the identification number.
References
1. Bennett, H. The Chemical Formulary – A Collection of Valuable, Timely, Practical
Commercial Formulae and Recipes for Making Thousands of Products in Many Fields of
Industry, Volume VI. 1943. Chemical Publishing Co., Inc. Copyright 1943.
2. Uebele, Charles. Paint Making and Color Grinding: A Practical Treatise for Paint
Manufacturers and Factory Managers, The Trade Papers Publishing Co., Ltd., 1913.
3. Battelle. Addition of Silica to Lead-based Paints Used for Production of PEMs in
Support of ETV Evaluation of Lead Test Kits: References. Technical report submitted to
EPA on February 19, 2009.
4. ASTM D1210-05(2010), “Standard Test Method for Fineness of Dispersion of Pigment-
Vehicle Systems by Hegman-Type Gage,” ASTM International.
5. ASTM E1729, “Standard Practice for Field Collection of Dried Paint Samples for
Subsequent Lead Determination,” ASTM International.
6. United States Environmental Protection Agency, “Method 3050B: Acid Digestion of
Sediments, Sludges, and Soils”, SW846 Online, Revision 2. December 1996.
7. United States Environmental Protection Agency, “Method 6010C: Inductively Coupled
Plasma-Atomic Emission Spectrometry”, SW846 Online, Revision 3. February 2007.
8. Schneider Laboratories, Inc. ICP SOP Document# III-017-08-002

A-18
Section A2 Comparison of Expected vs. Actual Lead Concentrations
of Performance Evaluation Materials

A-19
The following tables present a comparison of the expected vs. confirmed lead concentration for
each PEM used during the testing of the lead test kits. Expected concentrations are based on lead
levels defined for sets of PEMs during the PEM production process. That is, PEMs were being
made at expected lead concentrations of 0, 0.3, 0.6, 1.0, 1.4, 2.0, or 6.0 mg/cm2. These are the
expected lead levels as defined in the test/quality assurance (QA) plan. Confirmed
concentrations are based on ICP-AES results from individual paint chip samples taken from each
PEM during testing (see Section 3.3.1in the test/QA plan).
Table A-7 presents the results by substrate and across all PEMs. Table A-8 presents the results
by lead type. The average and standard deviation for the confirmed lead levels, as well as the
CoV, are presented for each expected concentration level.
Table A-7. Confirmed lead level statistics for PEMs compared to expected lead level
concentrations by substrate type.
Expected PEM Lead Level (mg/cm2)
Substrate 0 0.3 0.6 1 1.4 2 6
Drywall
N 9 18 18 18 18 18 18
Confirmed Lead Level: Average 0 0.48 1.23 1.73 2.26 2.77 10.74
Confirmed Lead Level: StdDev 0 0.1 0.29 0.33 0.36 0.30 2.65
CoV (%) 53.91 20.45 23.25 19.17 15.86 10.76 24.71
Plaster
N 9 18 18 18 18 18 18
Confirmed Lead Level: Average 0 0.58 1.32 2.06 2.84 3.01 11.59
Confirmed Lead Level: StdDev 0.00 0.24 0.39 0.42 0.94 1.07 2.77
CoV (%) 47.78 42.48 29.13 20.37 33.04 35.65 23.90
All
N 18 36 36 36 36 36 36
Confirmed Lead Level: Average 0 0.53 1.28 1.89 2.55 2.89 11.17
Confirmed Lead Level: StdDev 0.00 0.19 0.34 0.41 0.76 0.79 2.71
CoV (%) 65.19 35.94 26.47 21.60 29.72 27.23 24.26
CoV = Coefficient of Variation (Standard Deviation/Mean x 100)
Table A-7 indicates that the confirmed lead levels were generally higher than the expected
levels. This is similar to what was found for the drywall and plaster substrates in the ETV ESTE
verification test of lead paint test kits. The PEMs used in this test were produced using a
drawdown technique. This involved applying the paint to the PEM and pulling it down with a
specially designed bar. Being porous substrates, it is possible that the plaster and drywall panels
absorbed some of the paint, causing more paint to be applied to the PEM to accommodate the
thickness required on the PEM. This would then lead to higher lead concentrations on these
substrates. The most significant potential impact of this effect can be seen on the plaster PEMs.
This potential effect is based on observations during the production of the PEMs but has not been
studied or confirmed.

A-20
Table A-8. Confirmed lead level statistics for PEMs compared to expected lead level
concentrations by lead paint type.
Expected PEM Lead Level (mg/cm2)
Lead Type 0 0.3 0.6 1 1.4 2 6
None
N 18
Confirmed Lead Level: Average 0
Confirmed Lead Level: StdDev 0.00
CoV (%) 65.19
White
N 18 18 18 18 18 18
Confirmed Lead Level: Average 0.47 1.27 1.98 2.59 2.68 13.40
Confirmed Lead Level: StdDev 0.20 0.26 0.48 0.48 0.65 1.62
CoV (%) 42.04 20.74 24.40 18.36 24.4 12.14
Yellow
N 18 18 18 18 18 18
Confirmed Lead Level: Average 0.59 1.28 1.80 2.50 3.10 8.94
Confirmed Lead Level: StdDev 0.17 0.41 0.31 0.98 0.87 1.41
CoV (%) 27.95 31.7 17.03 38.94 28.04 15.83
All
N 18 36 36 36 36 36 36
Confirmed Lead Level: Average 0 0.53 1.28 1.89 2.55 2.89 11.17
Confirmed Lead Level: StdDev 0.00 0.19 0.34 0.41 0.76 0.79 2.71
CoV (%) 65.19 35.94 26.47 21.60 29.72 27.23 24.26
CoV = Coefficient of Variation (Standard Deviation/Mean x 100)
The results in Table A-8 show that there was no significant difference in confirmed lead levels
between white and yellow lead PEMs. The CoVs values were all ≤50% at all levels except 0.0
mg/cm2. The larger CoV at this level is reflective of small changes around the zero lead level
and most likely represent ICP-AES measurement variability near the detection limit, since no
lead was used in preparing these PEMs. It should be noted that though the PEMs prepared at the
expected lead level of 6.0 mg/cm2 were on average higher than 6.0 mg/cm
2, this was also found
for the 6.0 mg/cm2 PEMs prepared for the ETV ESTE verification test and was deemed at that
time to not be an issue as this lead level was meant to represent high concentrations of lead and
levels above 6.0 mg/cm2 were considered acceptable by EPA.
Though there were some differences between the confirmed and expected lead levels, it should
be noted that when evaluated for proper responses, test kit results were compared to confirmed
lead levels. That is, test kit results were always compared to the actual PEM lead levels, not the
expected.

A-21
Section A3
QA/QC Results for the ICP-AES Analysis of
Performance Evaluation Materials

A-22
Summary of Lead Level Confirmation ICP-AES Analysis of PEMs
All paint chip samples from the PEMs used in this verification test were analyzed using ICP-
AES by Schneider Laboratories, Inc.
Sample preparation procedures followed the SOP generated by Schneider Laboratories, Inc. for
this study (Schneider Laboratories, Inc., SOP Battelle Paint Samples, Doc # III-044-10-001).
Information on how QC samples were spiked and final concentrations is provided in the SOP.
Because of the high lead concentration in the PEM samples, dilutions were made to the samples
prior to initial analysis. The dilutions were prepared by spiking 10 microliters ( L) of the
original digested sample into 9.990 milliliters (mL) of reagent water for a 1:1000 dilution. The
samples were thoroughly mixed by inverting, and then analyzed for lead content. If the result
was below the reporting limit, the sample was reanalyzed either non-diluted or at a lower dilution
level. If samples were rerun at a different dilution level, this was noted in the QC summary
report for that particular sample set.
The MDL for lead was 2.91 µg/L.
The reporting limit was 40 µg/L. Therefore all blank results should be <40 µg/L.
Summary of Quality Control Measures for PEMs ICP-AES Analysis
QC procedures were performed in accordance with the test/QA plan for this evaluation. Test
procedures were conducted as stated in the test/QA plan. QC results for the analysis of paint
chip samples from the PEMs are described below.
ICP-AES Blank Sample Results
Various blank samples were analyzed for the ICP-AES analyses. Method blank samples were
analyzed in each set of 10 paint samples to ensure that no sources of contamination were present.
An initial calibration blank was analyzed at the beginning of each run and used for initial
calibration and zeroing the instrument. A continuing calibration blank was analyzed after each
CCV to verify blank response and freedom from carryover. No blank samples failed QC during
the analyses.
Calibration Verification Standards
Initial calibration standards were run at the beginning of each set of analyses. The acceptance
criterion for the calibration coefficient of the calibration standards was ≥ 0.998. If this criterion
was not met, the analysis was stopped and recalibration was performed before samples were
analyzed. A 500 parts per billion (ppb) CCV standard was analyzed at the beginning of each run
(following the initial calibration), at the end of each run, and every 10 samples. CCV recoveries
ranged from 98-106%. Per the test/QA plan, CCV sample frequency was once every 10 samples.
QC samples also included an initial calibration verification (ICV) standard and interference
check sample (ICS). Both samples were 500 ppb. ICV samples were analyzed once at the

A-23
beginning of each sample run and were required to have percent recoveries between 90-110% to
be acceptable. ICS samples were analyzed at the beginning and end of every run. ICS samples
had to have percent recoveries between 80-120% to be acceptable. All reported ICV and ICS
samples met the acceptance criteria. Recoveries for ICV samples ranged from 90-101%.
Recoveries for ICS samples ranged from 92-98%.
Matrix Spike Samples/Duplicates
Matrix spike samples, as well as duplicates of these samples, were analyzed once every 20
samples. Acceptable recoveries for matrix spike samples were between 80-120%. Duplicate
samples had acceptance criteria of ±25% relative percent difference (RPD).
All matrix spike samples were performed as post-digestion spikes as there was insufficient
sample volume to perform a pre-digestion spike. Matrix spike recoveries ranged from 73% to
344%. Three matrix spike samples failed, with recoveries of two above and one below the
specified acceptance criteria. Both of the high matrix spike samples were reanalyzed. After
reanalysis, one sample was within acceptable limits and the other was still high (136%). All the
other QC samples in those specific batches met their acceptance criteria and therefore the data is
not considered questionable. Overall, matrix spike results indicated that matrix interferences
were not observed. Duplicate samples were within the specified RPD except for one sample
which had an RPD of 60%. The sample and duplicate were reanalyzed and were within 25%
RPD.
LCS Samples
LCS samples were analyzed once every 20 samples. Acceptable recoveries for LCS samples
were between 80-120%. LCS recoveries ranged from 85-112%. The LCS was prepared by
spiking a piece of lead-free latex paint. There were no LCS failures.