Embed Size (px)
Citation preview
© 2015 3M. All Rights Reserved.
March 17, 2015
H.C. Shin Executive Vice President, International Operations
2 © 2015 3M. All Rights Reserved. BofAML Global Industrials & EU Autos Conference 2015
Forward Looking Statements This presentation contains forward-looking information about 3M's financial results and estimates and business prospects that involve substantial risks and uncertainties. You can identify these statements by the use of words such as "anticipate," "estimate,” "expect," "project," "intend," "plan," "believe," "will," "target," "forecast" and other words and terms of similar meaning in connection with any
discussion of future operating or financial performance or business plans or prospects. Among the factors that could cause actual results to differ materially are the following: (1) worldwide economic and capital markets conditions and other factors beyond 3M's control,
including natural and other disasters affecting the operations of 3M or its customers and suppliers; (2) 3M's credit ratings and its cost of capital; (3) competitive conditions and customer preferences; (4) foreign currency exchange rates and fluctuations in those rates; (5) the
timing and market acceptance of new product offerings; (6) the availability and cost of purchased components, compounds, raw materials and energy (including oil and natural gas and their derivatives) due to shortages, increased demand or supply interruptions
(including those caused by natural and other disasters and other events); (7) the impact of acquisitions, strategic alliances, divestitures, and other unusual events resulting from portfolio management actions and other evolving business strategies, and possible
organizational restructuring; (8) generating fewer productivity improvements than estimated; (9) unanticipated problems or delays with the phased implementation of a global enterprise resource planning (ERP) system, or security breaches and other disruptions to 3M's information technology infrastructure; and (10) legal proceedings, including significant developments that could occur in the legal and regulatory proceedings described in the Company's Annual Report on Form 10-K for the year ended December 31, 2014. Changes in such assumptions or factors could produce significantly different results. A further description of these factors is located in the Annual Report under “Cautionary Note Concerning Factors That May Affect Future Results” and “Risk Factors” in Part I, Items 1 and 1A. The
information contained in this presentation is as of the date indicated. The Company assumes no obligation to update any forward-looking statements contained in this presentation as a result of new information or future events or developments.
3 © 2015 3M. All Rights Reserved. BofAML Global Industrials & EU Autos Conference 2015
Content
• 3M Overview
• 3M International Operations Overview
• Execution Roadmap Through Our Levers
• Q&A/Discussion
4 © 2015 3M. All Rights Reserved. BofAML Global Industrials & EU Autos Conference 2015
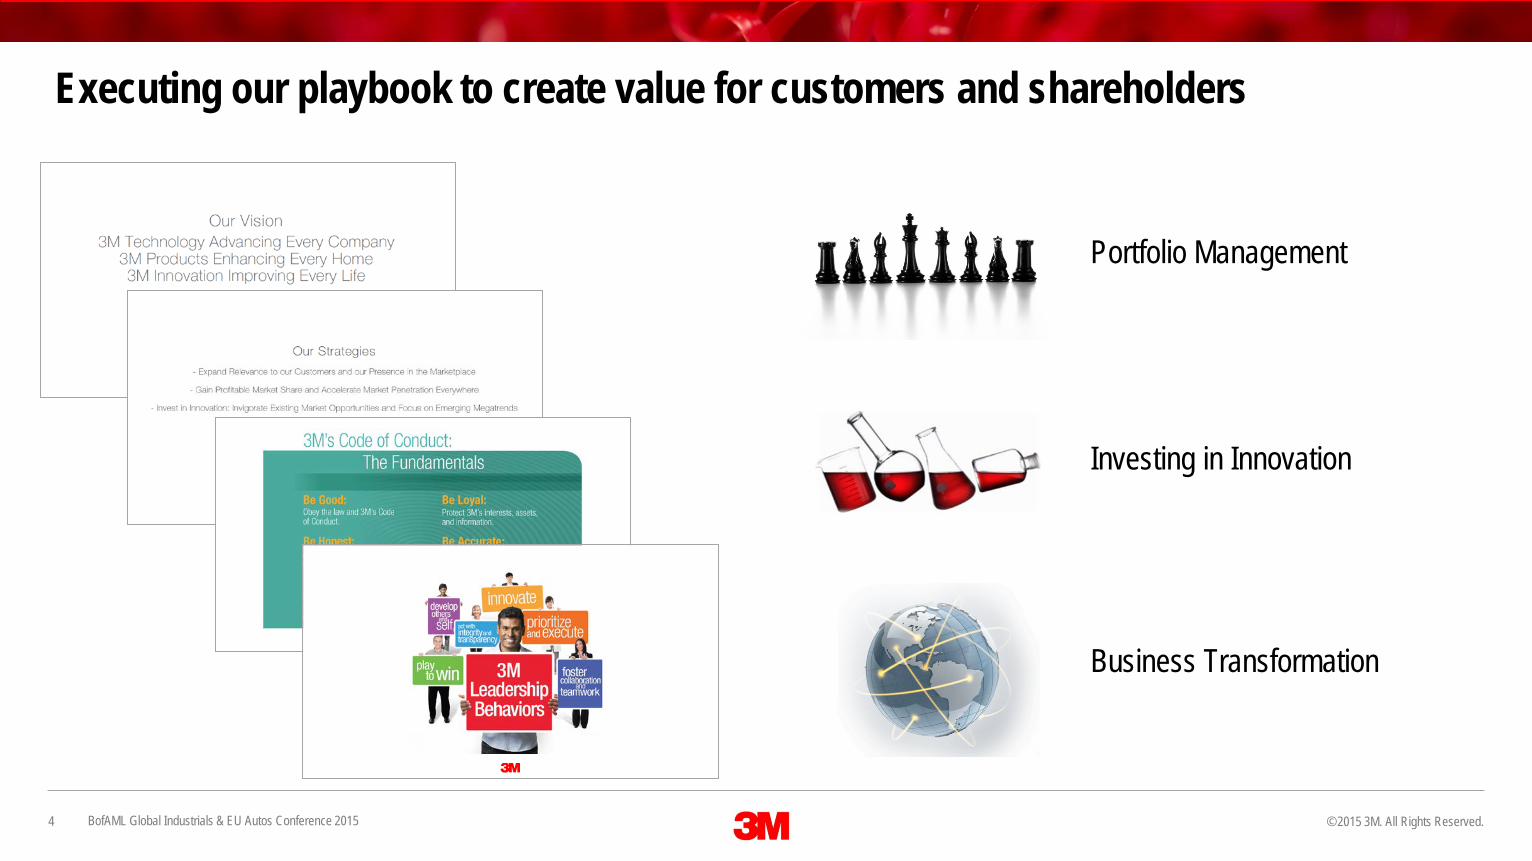
Executing our playbook to create value for customers and shareholders
Investing in Innovation
Portfolio Management
Business Transformation
5 © 2015 3M. All Rights Reserved. BofAML Global Industrials & EU Autos Conference 2015

6 © 2015 3M. All Rights Reserved. BofAML Global Industrials & EU Autos Conference 2015
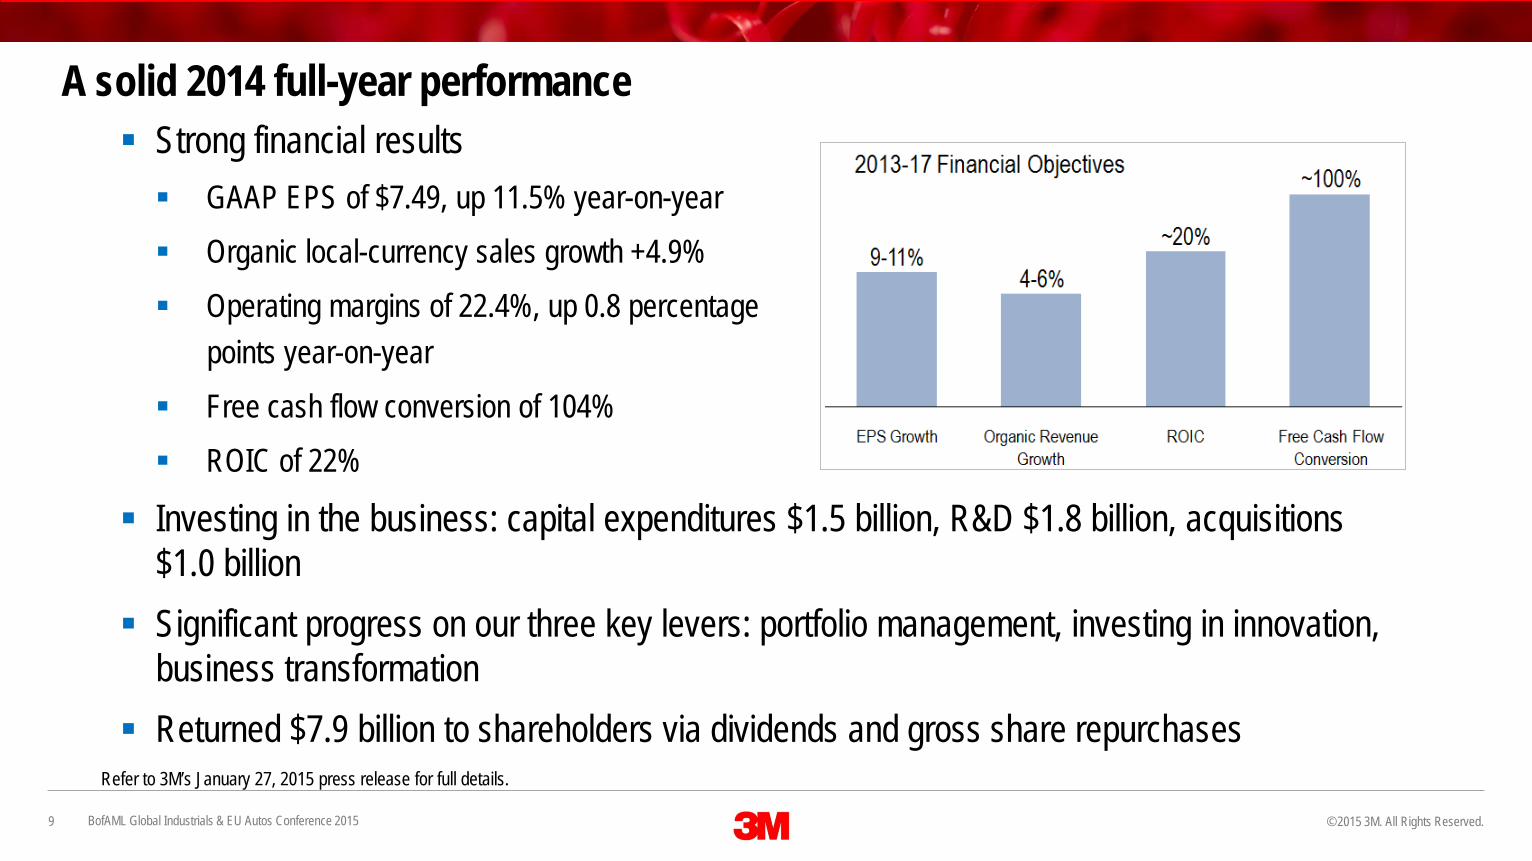
Free Cash Flow Conversion
~100%
ROIC
~20%
Organic Revenue Growth
4-6%
EPS Growth
9-11%
We are tracking toward the objectives we established in 2012 (2013 – 2017)
Aggressive and realistic targets
7 © 2015 3M. All Rights Reserved. BofAML Global Industrials & EU Autos Conference 2015
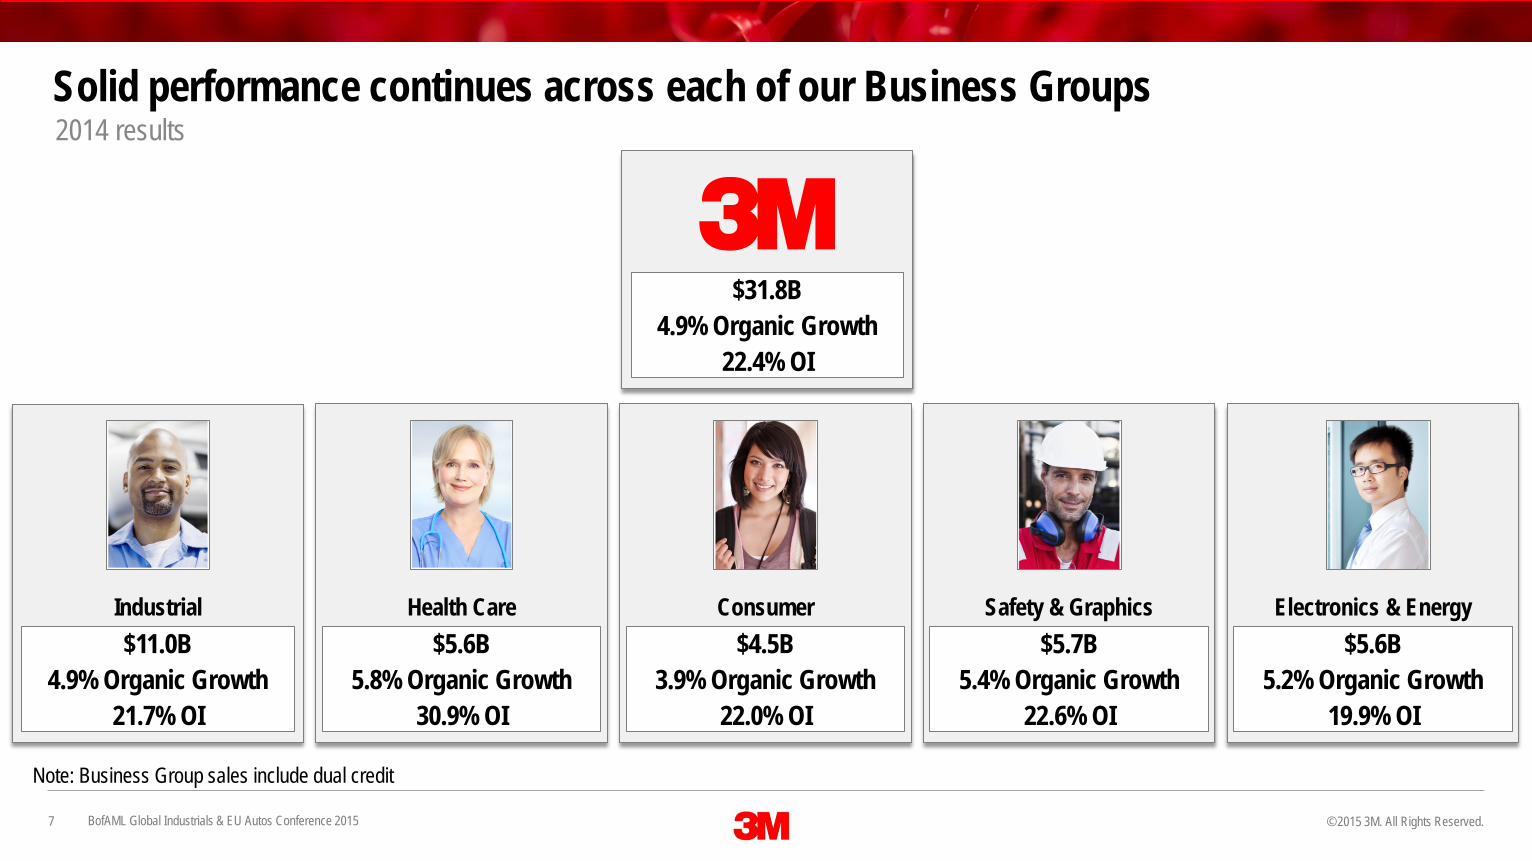
Solid performance continues across each of our Business Groups 2014 results
Industrial $11.0B
4.9% Organic Growth 21.7% OI
Health Care $5.6B
5.8% Organic Growth 30.9% OI
Consumer $4.5B
3.9% Organic Growth 22.0% OI
Safety & Graphics $5.7B
5.4% Organic Growth 22.6% OI
Electronics & Energy $5.6B
5.2% Organic Growth 19.9% OI
$31.8B 4.9% Organic Growth
22.4% OI
Note: Business Group sales include dual credit

8 © 2015 3M. All Rights Reserved. BofAML Global Industrials & EU Autos Conference 2015
Leveraging and building our fundamental strengths
Leveraging these assets creates value; strengthening them ensures our future
9 © 2015 3M. All Rights Reserved. BofAML Global Industrials & EU Autos Conference 2015
Strong financial results GAAP EPS of $7.49, up 11.5% year-on-year Organic local-currency sales growth +4.9% Operating margins of 22.4%, up 0.8 percentage points year-on-year Free cash flow conversion of 104% ROIC of 22%
Investing in the business: capital expenditures $1.5 billion, R&D $1.8 billion, acquisitions $1.0 billion
Significant progress on our three key levers: portfolio management, investing in innovation, business transformation
Returned $7.9 billion to shareholders via dividends and gross share repurchases
A solid 2014 full-year performance
Refer to 3M’s January 27, 2015 press release for full details.
10 © 2015 3M. All Rights Reserved. BofAML Global Industrials & EU Autos Conference 2015
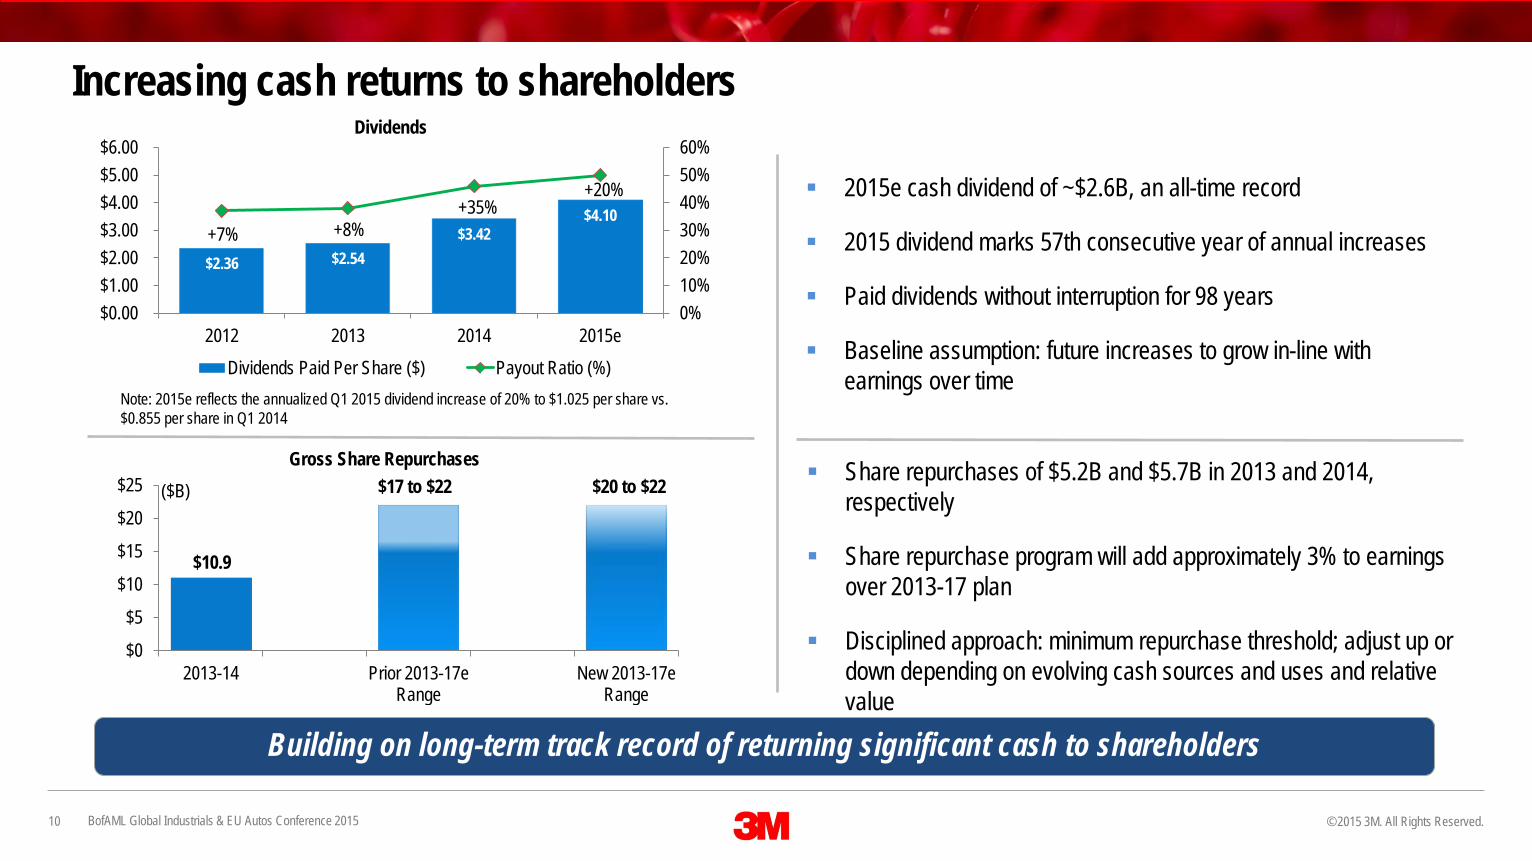
$10.9
$0
$5
$10
$15
$20
$25
2013-14 Prior 2013-17e Range
New 2013-17e Range
Gross Share Repurchases $20 to $22 $17 to $22
$2.36 $2.54 $3.42
$4.10
0% 10% 20% 30% 40% 50% 60%
$0.00 $1.00 $2.00 $3.00 $4.00 $5.00 $6.00
2012 2013 2014 2015e
Dividends
Dividends Paid Per Share ($) Payout Ratio (%)
Increasing cash returns to shareholders
2015e cash dividend of ~$2.6B, an all-time record
2015 dividend marks 57th consecutive year of annual increases
Paid dividends without interruption for 98 years
Baseline assumption: future increases to grow in-line with earnings over time
Building on long-term track record of returning significant cash to shareholders
+7% +8% +35%
Note: 2015e reflects the annualized Q1 2015 dividend increase of 20% to $1.025 per share vs. $0.855 per share in Q1 2014
$15B to
$7.5B
Share repurchases of $5.2B and $5.7B in 2013 and 2014, respectively
Share repurchase program will add approximately 3% to earnings over 2013-17 plan
Disciplined approach: minimum repurchase threshold; adjust up or down depending on evolving cash sources and uses and relative value
($B)
+20%
11 © 2015 3M. All Rights Reserved. BofAML Global Industrials & EU Autos Conference 2015
Content
• 3M Overview
• 3M International Operations Overview
• Execution Roadmap Through Our Levers
• Q&A/Discussion

12 © 2015 3M. All Rights Reserved. BofAML Global Industrials & EU Autos Conference 2015
Asia Pacific
3M International Operations: Strong and sustainable growth platform
3% 17%
3%
20% 2% 8%
Asia
Central East
Europe
Latin America
West Europe
Canada
Middle East & Africa
International Operations in 2014 $20B in sales 23% operating income to sales 70 countries 54,000+ employees 127 plant sites 35 country laboratories 4,000 R&D headcount
Distribution of 3M Worldwide Sales
10% Greater China
37% United States
Thriving in a dynamic global environment

13 © 2015 3M. All Rights Reserved. BofAML Global Industrials & EU Autos Conference 2015
2009 2014 2017e
$7 46%
$11 55%
55%-60%
$8 54%
$9 45%
40% - 45% International Developed Markets
International Developing Markets
2009 Total sales
(in $B) $15 $20 $23-25
Track record of profitable growth
5% Organic local currency 5Y CAGR
International sales, excluding US ($B) 6% Organic local
currency 3Y CAGR

14 © 2015 3M. All Rights Reserved. BofAML Global Industrials & EU Autos Conference 2015
International playbook to succeed in a dynamic, ever-changing global environment
Growth and productivity
focus
Balance sheet management
Culture of compliance
Scenario planning
Structured pricing
management
Price of oil Dollar appreciation
Geopolitics Deceleration CHK & some developing economies
15 © 2015 3M. All Rights Reserved. BofAML Global Industrials & EU Autos Conference 2015
Content
• 3M Overview
• 3M International Operations Overview
• Execution Roadmap Through Our Levers
• Q&A/Discussion

16 © 2015 3M. All Rights Reserved. BofAML Global Industrials & EU Autos Conference 2015
Key levers will drive value creation going forward
Investing in Innovation Business Transformation Portfolio Management
These levers, combined with more aggressive capital deployment, will drive enhanced value creation
17 © 2015 3M. All Rights Reserved. BofAML Global Industrials & EU Autos Conference 2015
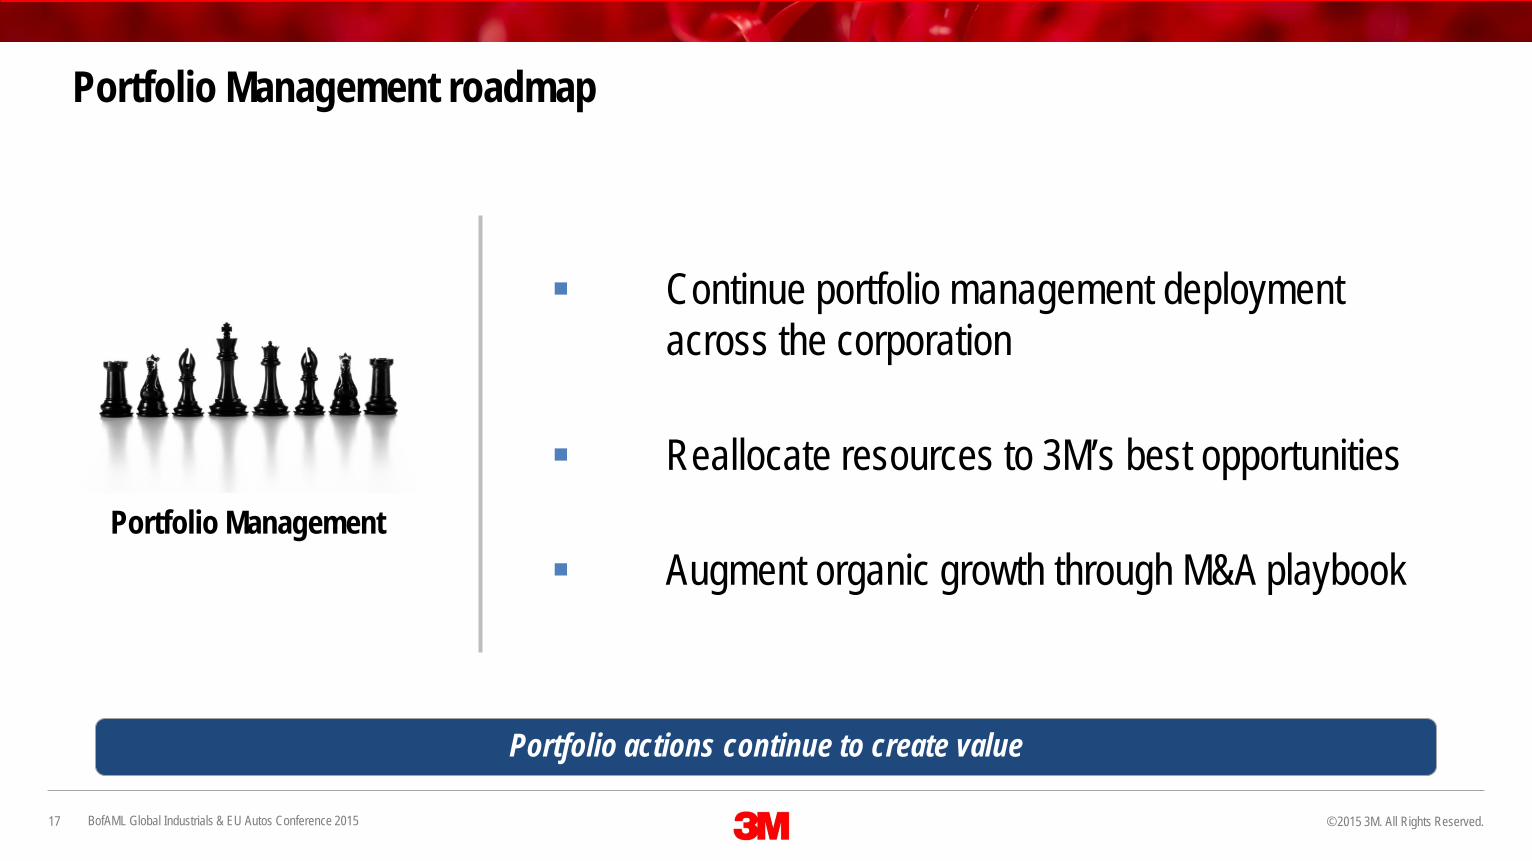
Portfolio Management roadmap
Portfolio actions continue to create value
Continue portfolio management deployment across the corporation
Reallocate resources to 3M’s best opportunities
Augment organic growth through M&A playbook Portfolio Management

18 © 2015 3M. All Rights Reserved. BofAML Global Industrials & EU Autos Conference 2015
We have a stronger portfolio of businesses today than when we started Re
lative
Stra
tegi
c Attr
activ
enes
s
Relative Shareholder Attractiveness
Strategic Review
Heartland
Push Forward
19 © 2015 3M. All Rights Reserved. BofAML Global Industrials & EU Autos Conference 2015
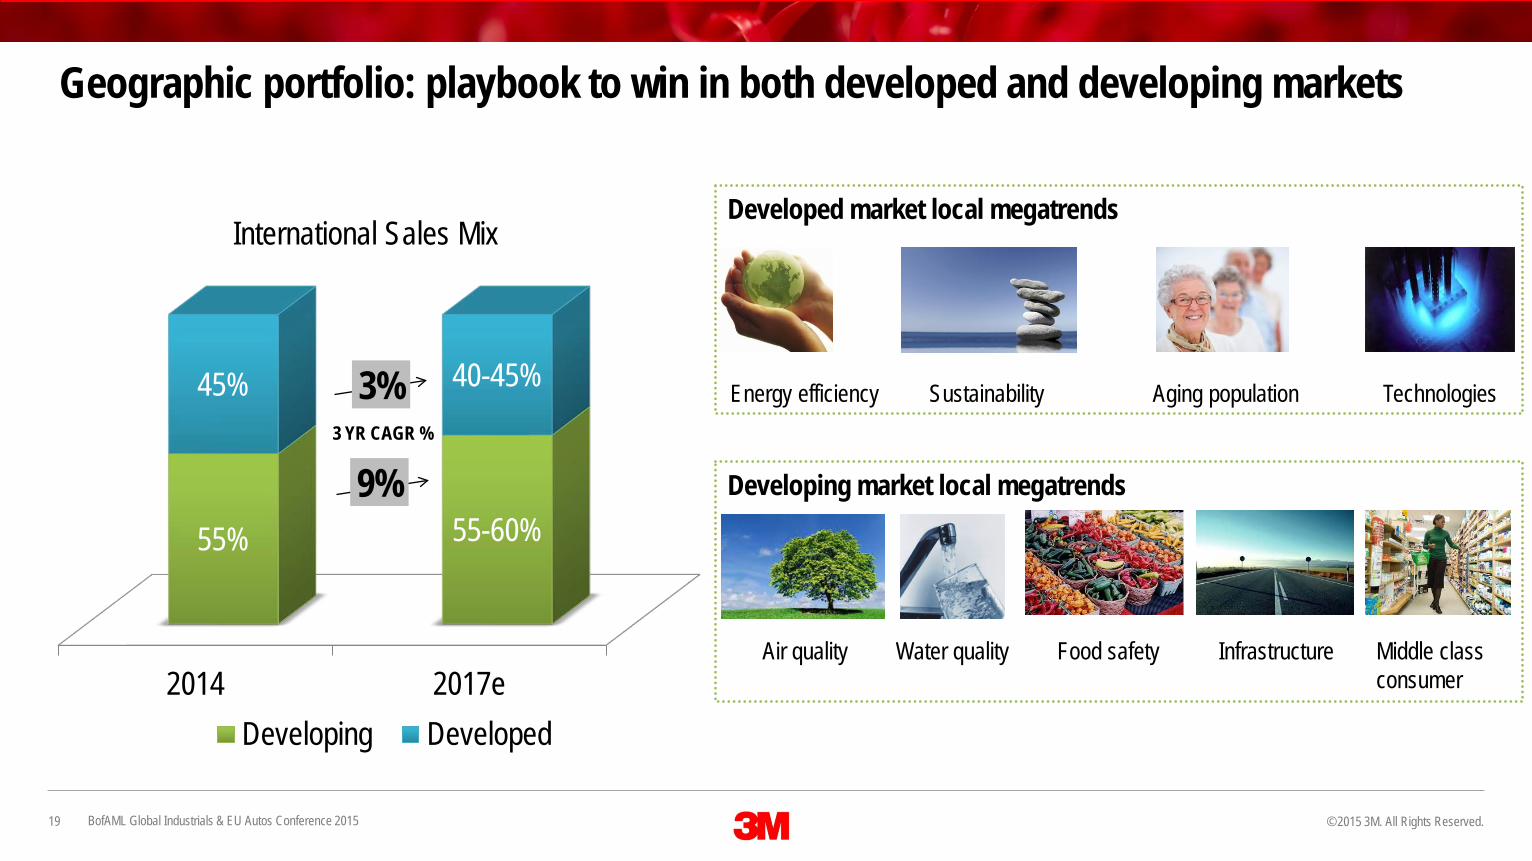
2014 2017e
55% 55-60%
45% 40-45%
Developing Developed
Geographic portfolio: playbook to win in both developed and developing markets
Developed market local megatrends International Sales Mix
9%
3% 3 YR CAGR %
Energy efficiency Technologies Sustainability Aging population
Developing market local megatrends
Air quality Infrastructure Water quality Food safety Middle class consumer
20 © 2015 3M. All Rights Reserved. BofAML Global Industrials & EU Autos Conference 2015
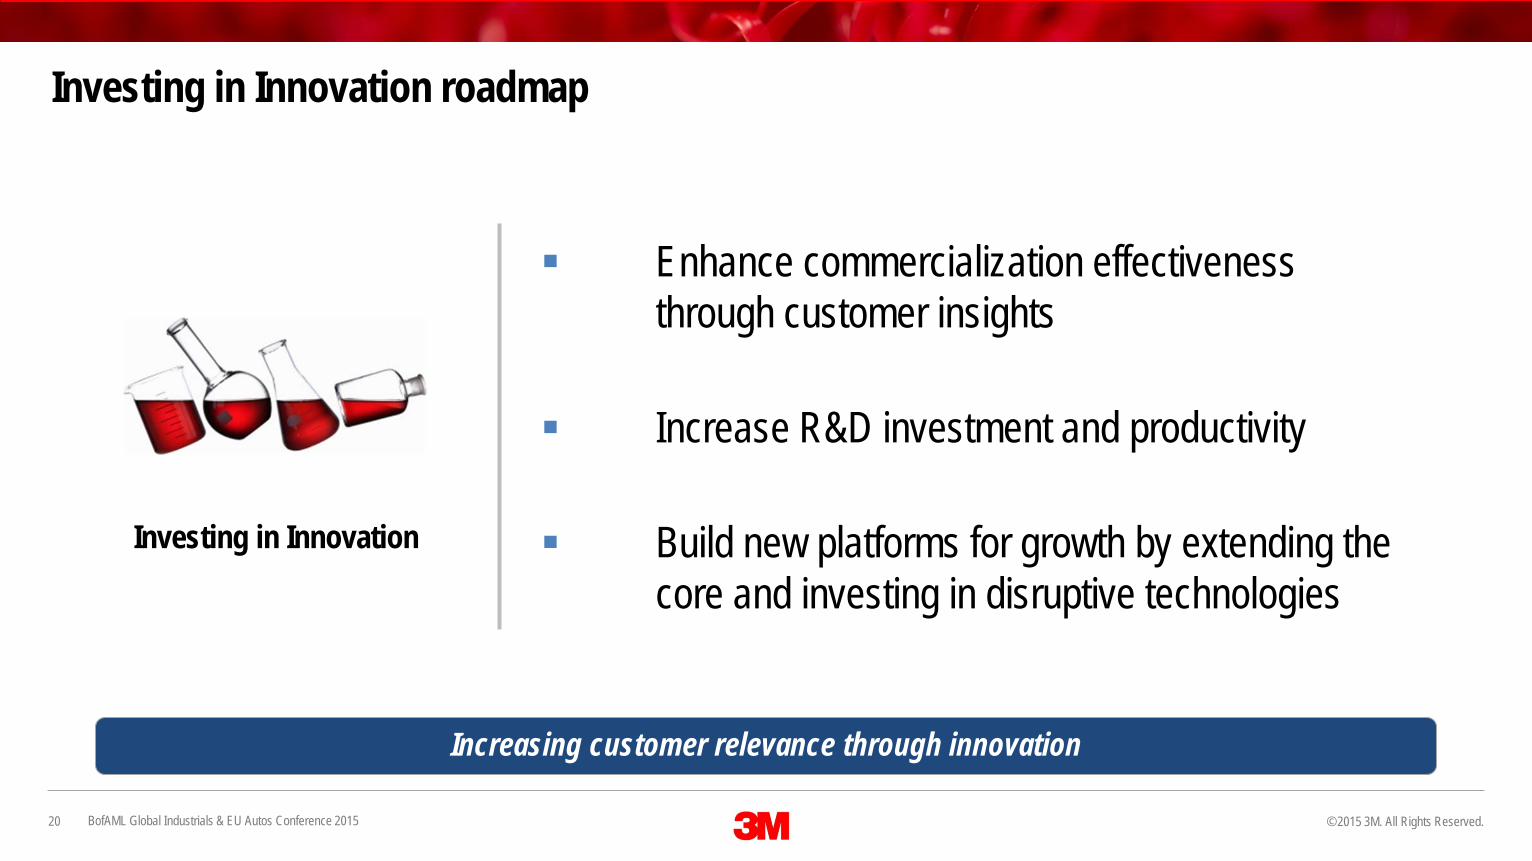
Investing in Innovation roadmap
Increasing customer relevance through innovation
Enhance commercialization effectiveness through customer insights
Increase R&D investment and productivity
Build new platforms for growth by extending the core and investing in disruptive technologies
Investing in Innovation
21 © 2015 3M. All Rights Reserved. BofAML Global Industrials & EU Autos Conference 2015
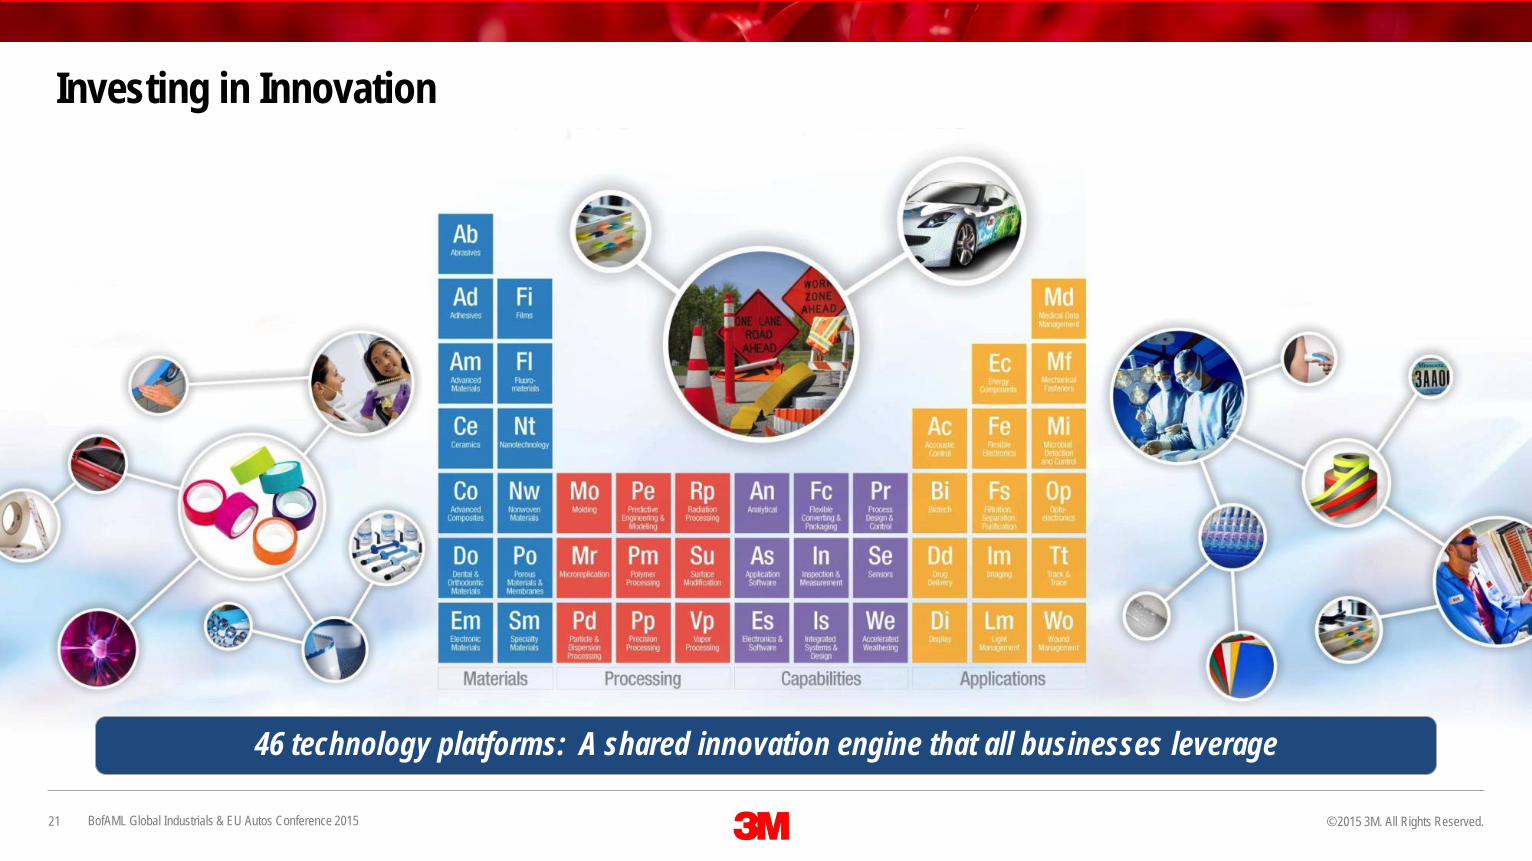
Investing in Innovation
46 technology platforms: A shared innovation engine that all businesses leverage
22 © 2015 3M. All Rights Reserved. BofAML Global Industrials & EU Autos Conference 2015
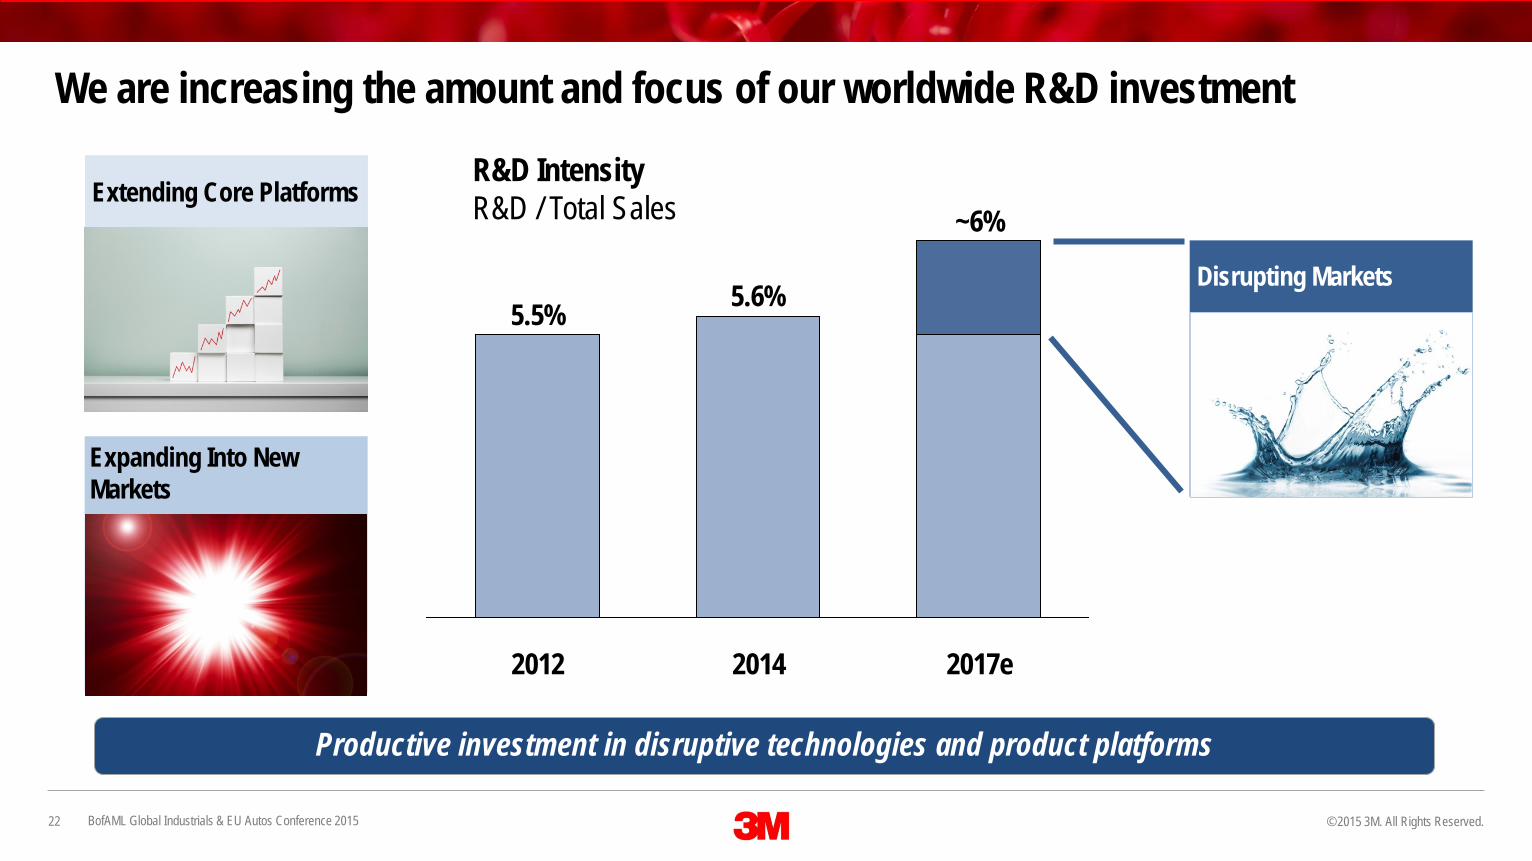
We are increasing the amount and focus of our worldwide R&D investment
R&D Intensity R&D / Total Sales
5.6%5.5%
2014 2017e
~6%
2012
Productive investment in disruptive technologies and product platforms
Extending Core Platforms
Expanding Into New Markets
Disrupting Markets
23 © 2015 3M. All Rights Reserved. BofAML Global Industrials & EU Autos Conference 2015
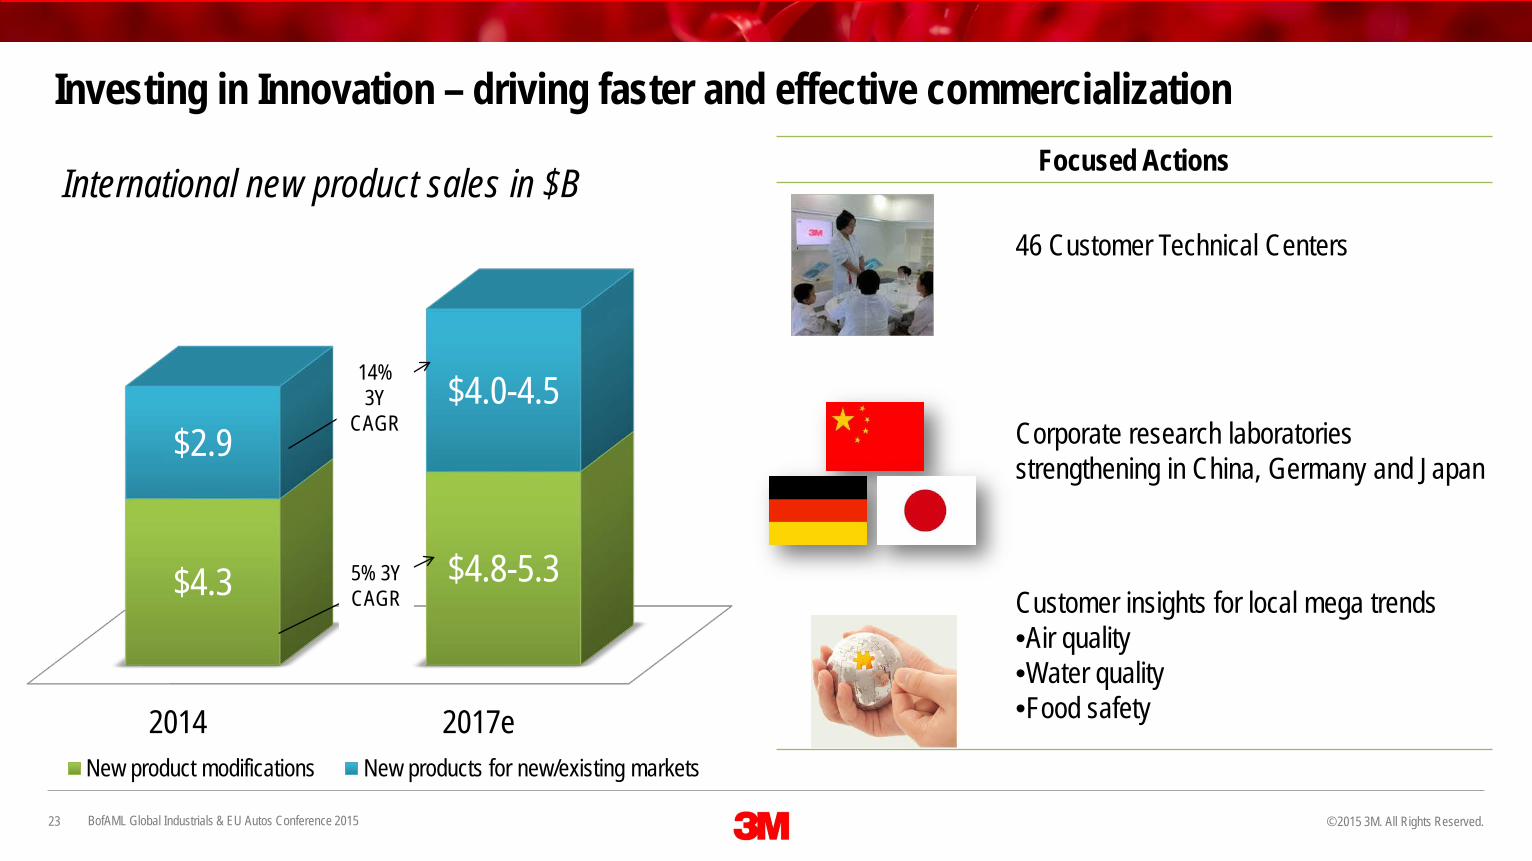
2014 2017e
$4.3 $4.8-5.3
$2.9 $4.0-4.5
New product modifications New products for new/existing markets
Investing in Innovation – driving faster and effective commercialization Focused Actions
46 Customer Technical Centers
Corporate research laboratories strengthening in China, Germany and Japan
Customer insights for local mega trends •Air quality •Water quality •Food safety
14% 3Y
CAGR
5% 3Y CAGR
International new product sales in $B
24 © 2015 3M. All Rights Reserved. BofAML Global Industrials & EU Autos Conference 2015
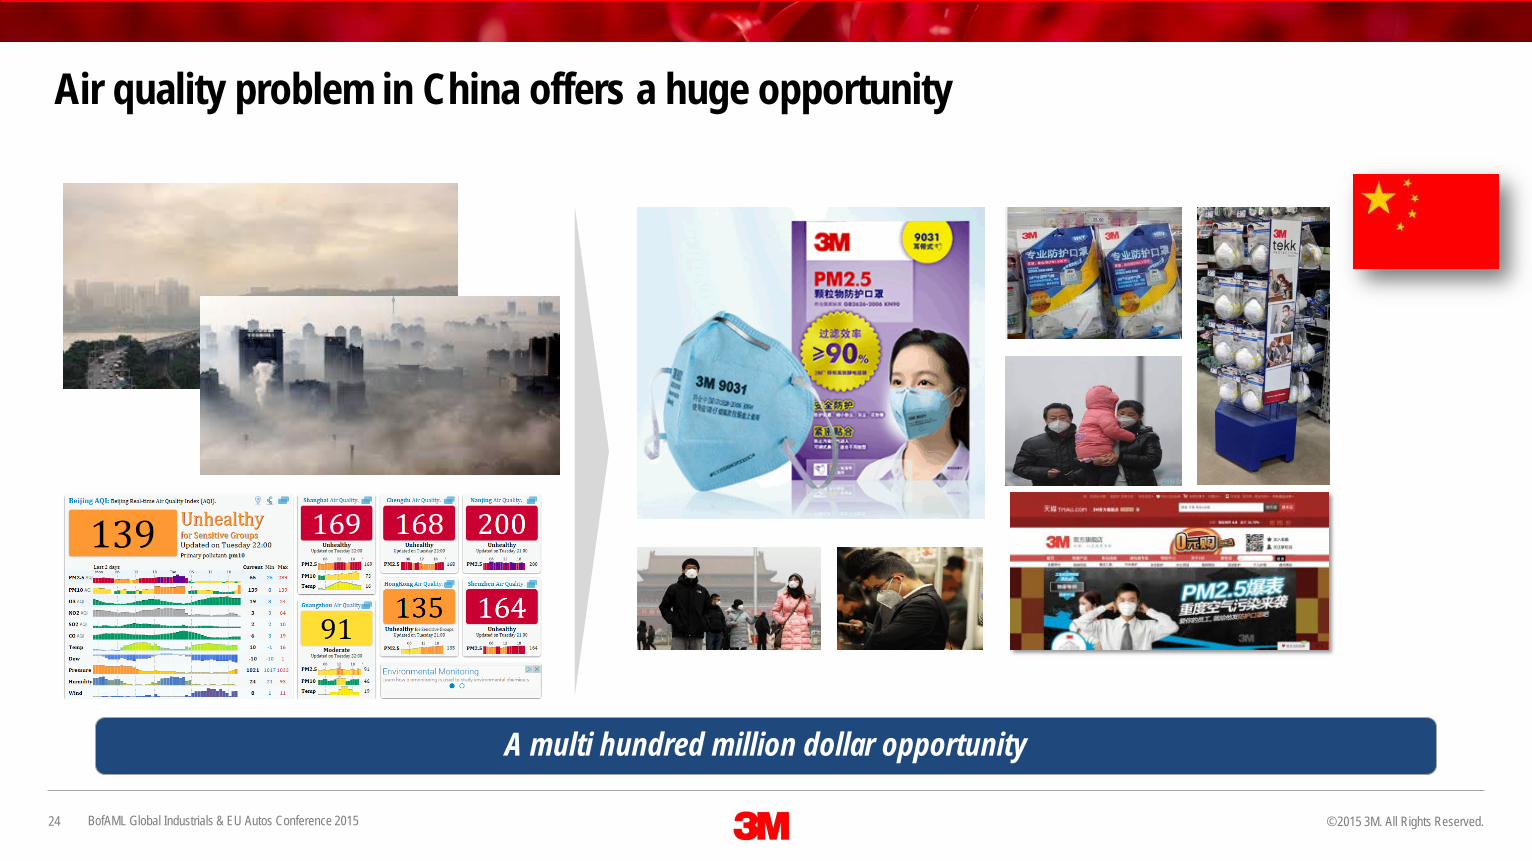
Air quality problem in China offers a huge opportunity
A multi hundred million dollar opportunity
25 © 2015 3M. All Rights Reserved. BofAML Global Industrials & EU Autos Conference 2015
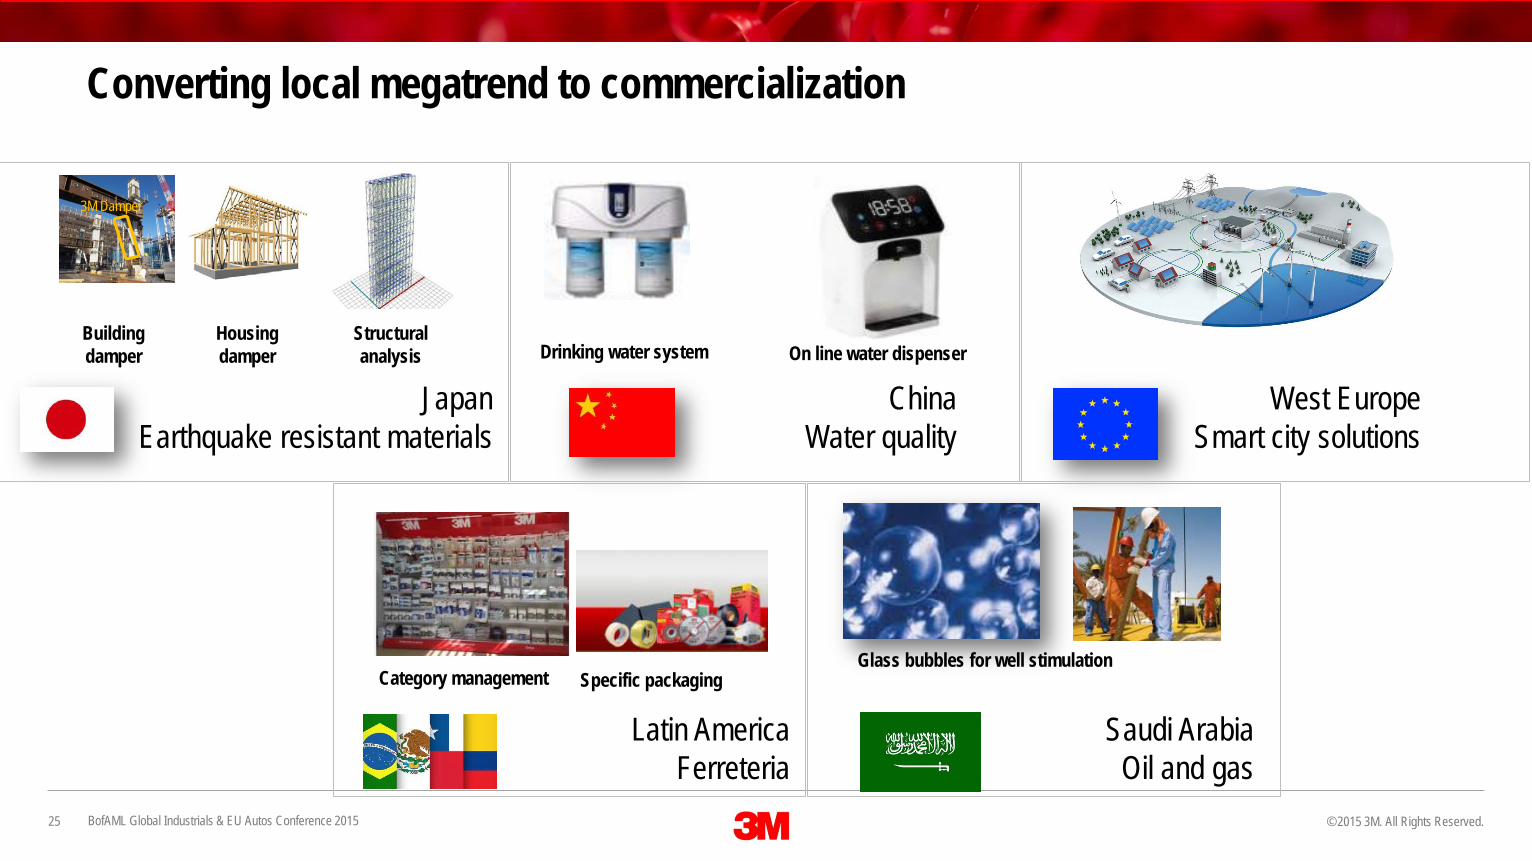
Japan Earthquake resistant materials
China Water quality
West Europe Smart city solutions
Converting local megatrend to commercialization
Drinking water system
On line water dispenser
3M Damper
Building damper
Housing damper
Structural analysis
Latin America Ferreteria
Saudi Arabia Oil and gas
Glass bubbles for well stimulation Category management Specific packaging

26 © 2015 3M. All Rights Reserved. BofAML Global Industrials & EU Autos Conference 2015
Business Transformation roadmap
Business Transformation creating value for customers and shareholders
Realize benefits gained through ERP deployments
Deliver productivity through enhanced supply chain and manufacturing capabilities
Increase service levels to customers and reduce cost to serve
Business Transformation
27 © 2015 3M. All Rights Reserved. BofAML Global Industrials & EU Autos Conference 2015
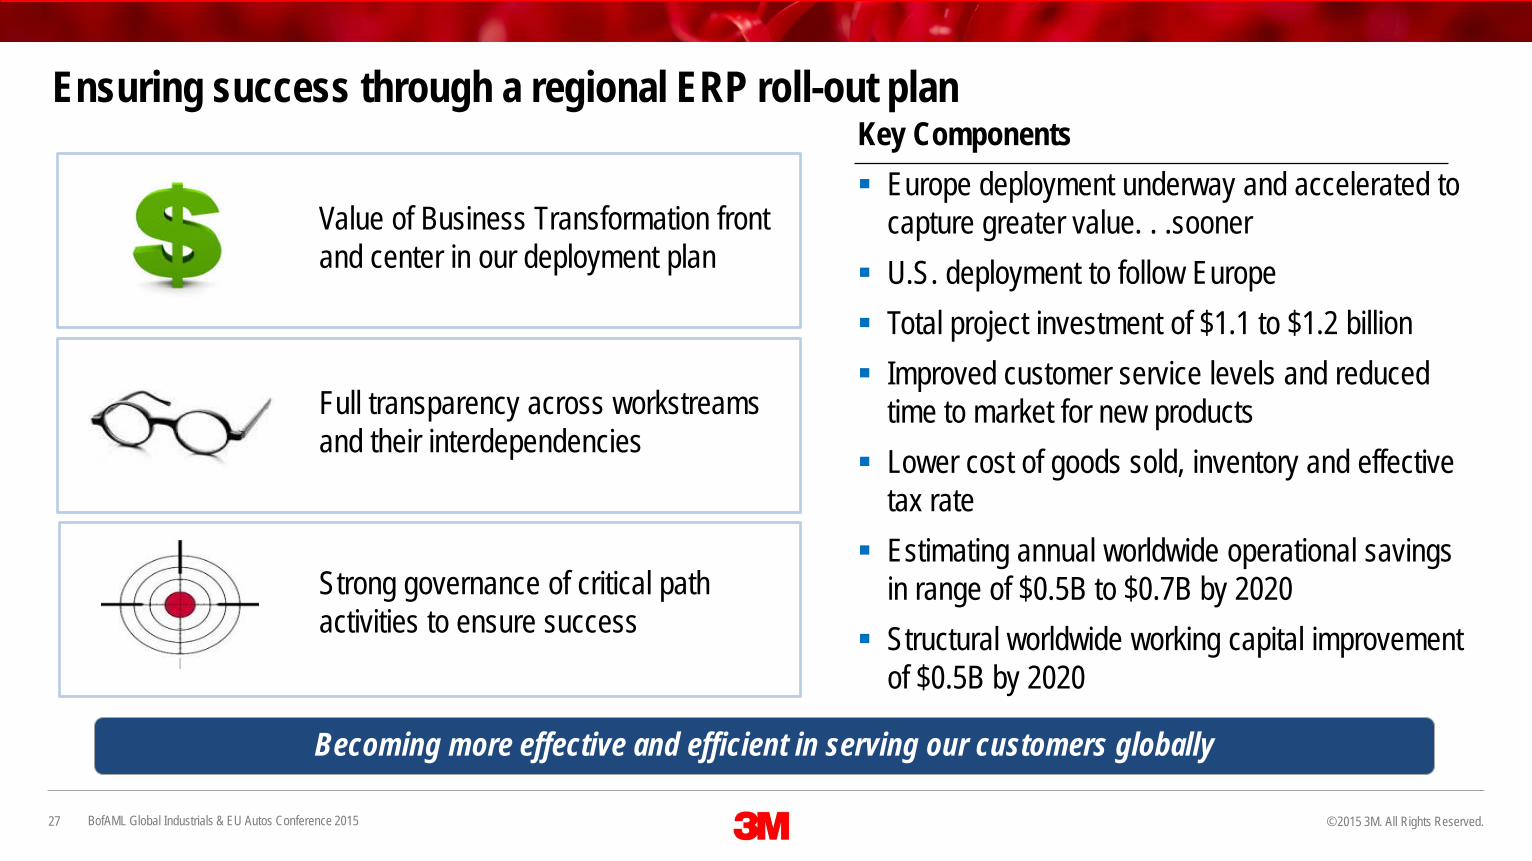
Ensuring success through a regional ERP roll-out plan Key Components Europe deployment underway and accelerated to
capture greater value. . .sooner U.S. deployment to follow Europe Total project investment of $1.1 to $1.2 billion Improved customer service levels and reduced
time to market for new products Lower cost of goods sold, inventory and effective
tax rate Estimating annual worldwide operational savings
in range of $0.5B to $0.7B by 2020 Structural worldwide working capital improvement
of $0.5B by 2020
Full transparency across workstreams and their interdependencies
Strong governance of critical path activities to ensure success
Value of Business Transformation front and center in our deployment plan
Becoming more effective and efficient in serving our customers globally
28 © 2015 3M. All Rights Reserved. BofAML Global Industrials & EU Autos Conference 2015
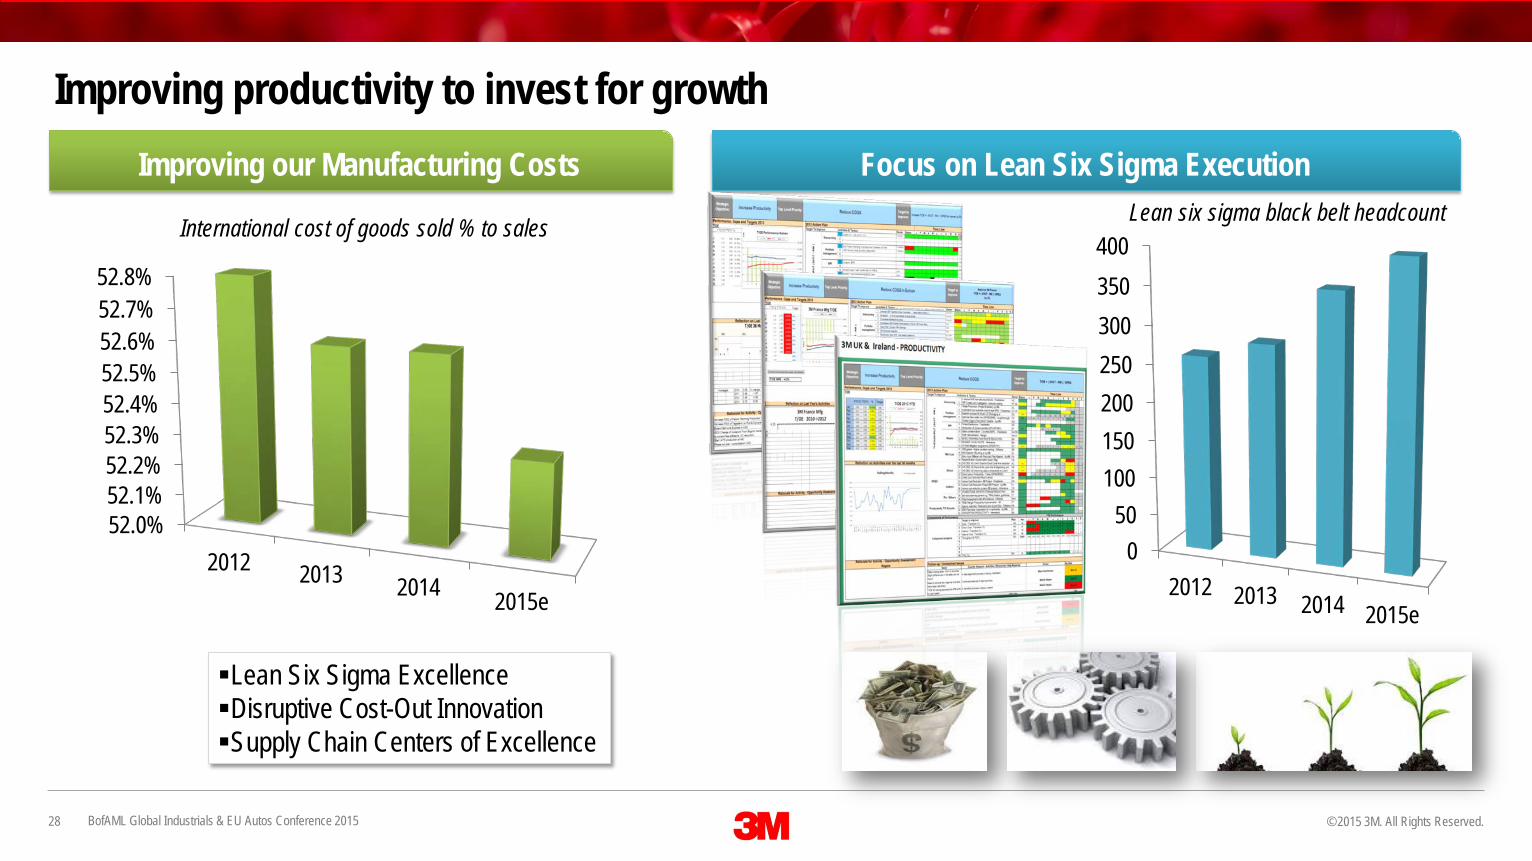
Improving productivity to invest for growth
Lean Six Sigma Excellence Disruptive Cost-Out Innovation Supply Chain Centers of Excellence
Improving our Manufacturing Costs
52.0% 52.1% 52.2% 52.3% 52.4% 52.5% 52.6% 52.7% 52.8%
2012 2013 2014 2015e
International cost of goods sold % to sales
0 50
100 150 200 250 300 350 400
2012 2013 2014 2015e
Focus on Lean Six Sigma Execution Lean six sigma black belt headcount
29 © 2015 3M. All Rights Reserved. BofAML Global Industrials & EU Autos Conference 2015
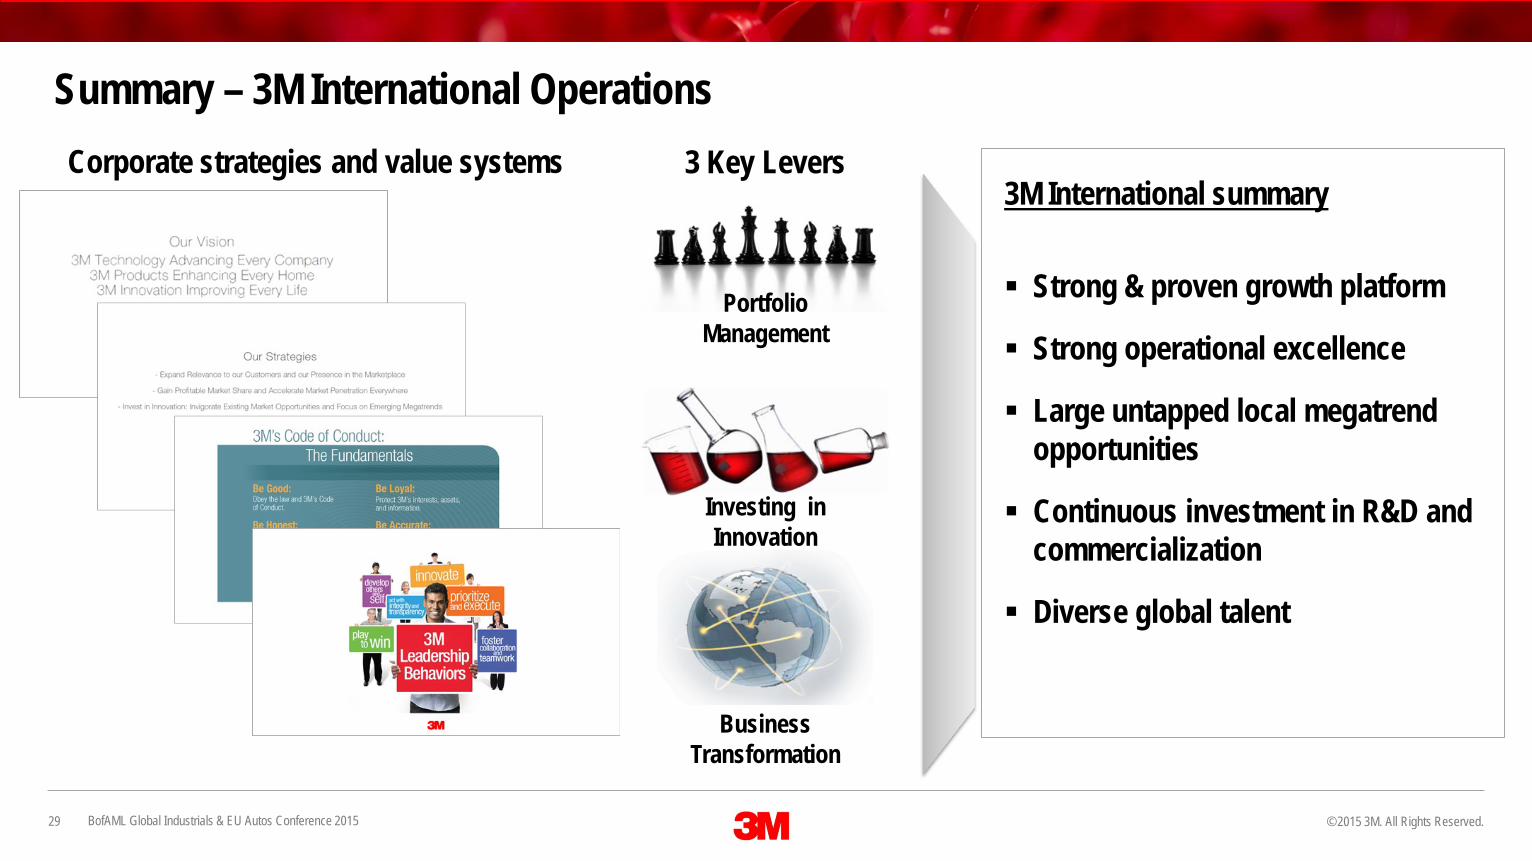
Summary – 3M International Operations
3M International summary
Strong & proven growth platform
Strong operational excellence
Large untapped local megatrend opportunities
Continuous investment in R&D and commercialization
Diverse global talent
Business
Transformation
Portfolio Management
Investing in Innovation
3 Key Levers Corporate strategies and value systems
30 © 2015 3M. All Rights Reserved. BofAML Global Industrials & EU Autos Conference 2015
Content
• 3M Overview
• 3M International Operations Overview
• Execution Roadmap Through Our Levers
• Q&A/Discussion
31 © 2015 3M. All Rights Reserved. BofAML Global Industrials & EU Autos Conference 2015
Appendix Refer to 3M's Form 8-K furnished on March 5, 2014 and 3M's Form 8-K filed on May 15, 2014 for a
discussion of the product move between business segments and other changes within business segments that were effective in the first quarter of 2014. As discussed in 3M's second-quarter Form 10-Q
filed on July 31, 2014, 3M made changes within the Electronics and Energy business segment. 3M combined three existing divisions into two new divisions, creating the Electronics Materials Solutions Division and the Display Materials and Systems Division. In addition, in October 2014, 3M merged its Personal Care Division into the Industrial Adhesives and Tapes Division. This presentation reflects the
impact of these changes for all periods presented.

32 © 2015 3M. All Rights Reserved. BofAML Global Industrials & EU Autos Conference 2015
Industrial
With Leading Market Positions In: ― Industrial abrasives ― Auto body repair solutions ― Car care DIY ― Structural adhesives and tapes ― Filtration and purification systems ― Specialty additives ― Tapes and fasteners for personal hygiene products
Adhesives & Tapes 38%
Abrasives 14%
Advanced Mat'ls 12%
Filtration 6%
Aerospace 3%
Transportation 27%
U.S. 38%
EMEA 25%
APAC 26%
LAC 11%
2014 Sales By Business
2014 Sales By Geography
($M) 2012 2013 2014 CAGR Sales $10,008 $10,657 $10,990 5%GAAP Operating Income $2,244 $2,307 $2,389 3%GAAP Operating Margin 22.4% 21.6% 21.7%
33 © 2015 3M. All Rights Reserved. BofAML Global Industrials & EU Autos Conference 2015
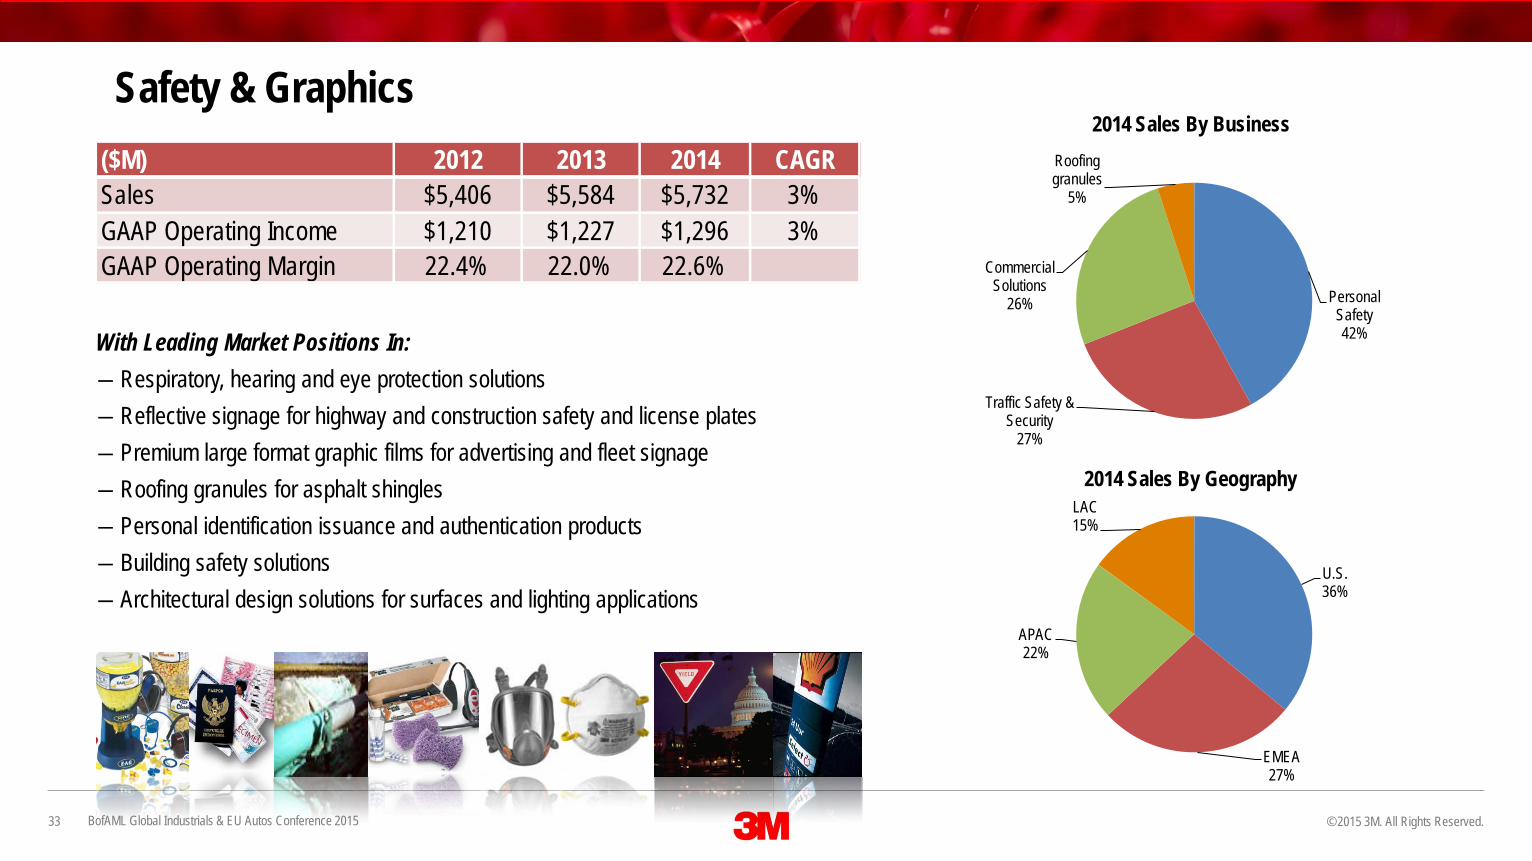
Safety & Graphics
Personal Safety 42%
Traffic Safety & Security
27%
Commercial Solutions
26%
Roofing granules
5%
U.S. 36%
EMEA 27%
APAC 22%
LAC 15%
2014 Sales By Business
2014 Sales By Geography
With Leading Market Positions In: ― Respiratory, hearing and eye protection solutions ― Reflective signage for highway and construction safety and license plates ― Premium large format graphic films for advertising and fleet signage ― Roofing granules for asphalt shingles ― Personal identification issuance and authentication products ― Building safety solutions ― Architectural design solutions for surfaces and lighting applications
($M) 2012 2013 2014 CAGR Sales $5,406 $5,584 $5,732 3%GAAP Operating Income $1,210 $1,227 $1,296 3%GAAP Operating Margin 22.4% 22.0% 22.6%

34 © 2015 3M. All Rights Reserved. BofAML Global Industrials & EU Autos Conference 2015
U.S. 17%
EMEA 12%
APAC 64%
LAC 7%
2014 Sales By Business
2014 Sales By Geography
Display Matls & Systems
38%
Electronics Matls
Solutions 24%
Electrical Markets
23%
Telecom 8%
Renewable Energy
7%
Electronics & Energy
With Leading Market Positions In: ― Optically clear adhesives, Novec™ fluorochemicals, transport solutions and flexible
circuits for electronic components ― Light management films that enhance brightness and provide energy efficiency in
liquid crystal displays (LCD) ― Electrical vinyl rubber and mastic tapes ― Medium voltage cable accessories, OEM insulation tapes ― Telecommunications copper splicing ― Fiber splicing/connectivity
($M) 2012 2013 2014 CAGR Sales $5,458 $5,393 $5,604 1%GAAP Operating Income $1,026 $954 $1,115 4%GAAP Operating Margin 18.8% 17.7% 19.9%
35 © 2015 3M. All Rights Reserved. BofAML Global Industrials & EU Autos Conference 2015
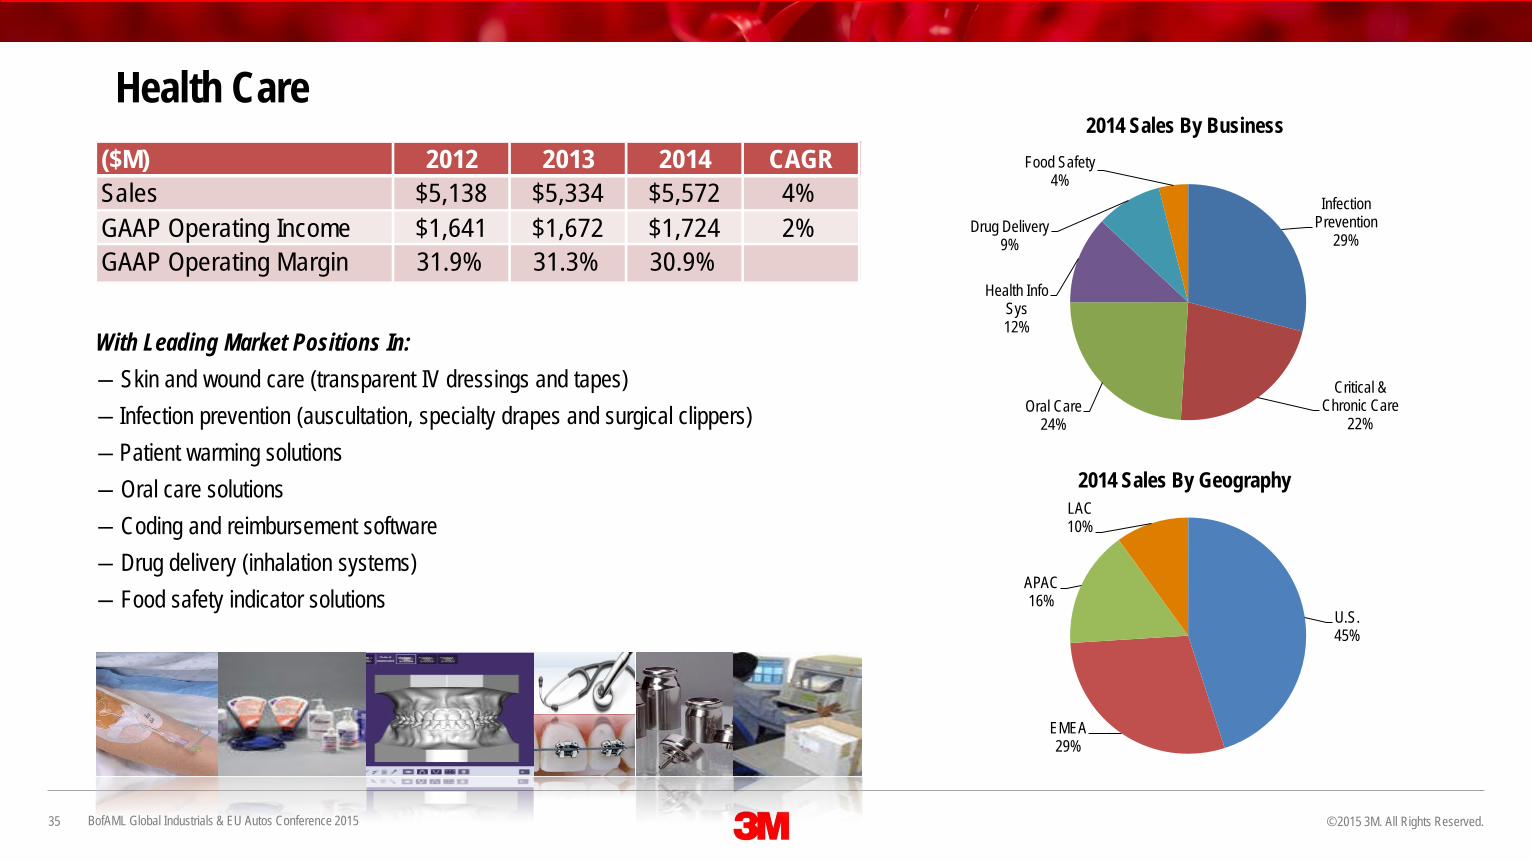
Health Care
Infection Prevention
29%
Critical & Chronic Care
22% Oral Care
24%
Health Info Sys 12%
Drug Delivery 9%
Food Safety 4%
U.S. 45%
EMEA 29%
APAC 16%
LAC 10%
2014 Sales By Business
2014 Sales By Geography
With Leading Market Positions In: ― Skin and wound care (transparent IV dressings and tapes) ― Infection prevention (auscultation, specialty drapes and surgical clippers) ― Patient warming solutions ― Oral care solutions ― Coding and reimbursement software ― Drug delivery (inhalation systems) ― Food safety indicator solutions
($M) 2012 2013 2014 CAGR Sales $5,138 $5,334 $5,572 4%GAAP Operating Income $1,641 $1,672 $1,724 2%GAAP Operating Margin 31.9% 31.3% 30.9%
36 © 2015 3M. All Rights Reserved. BofAML Global Industrials & EU Autos Conference 2015
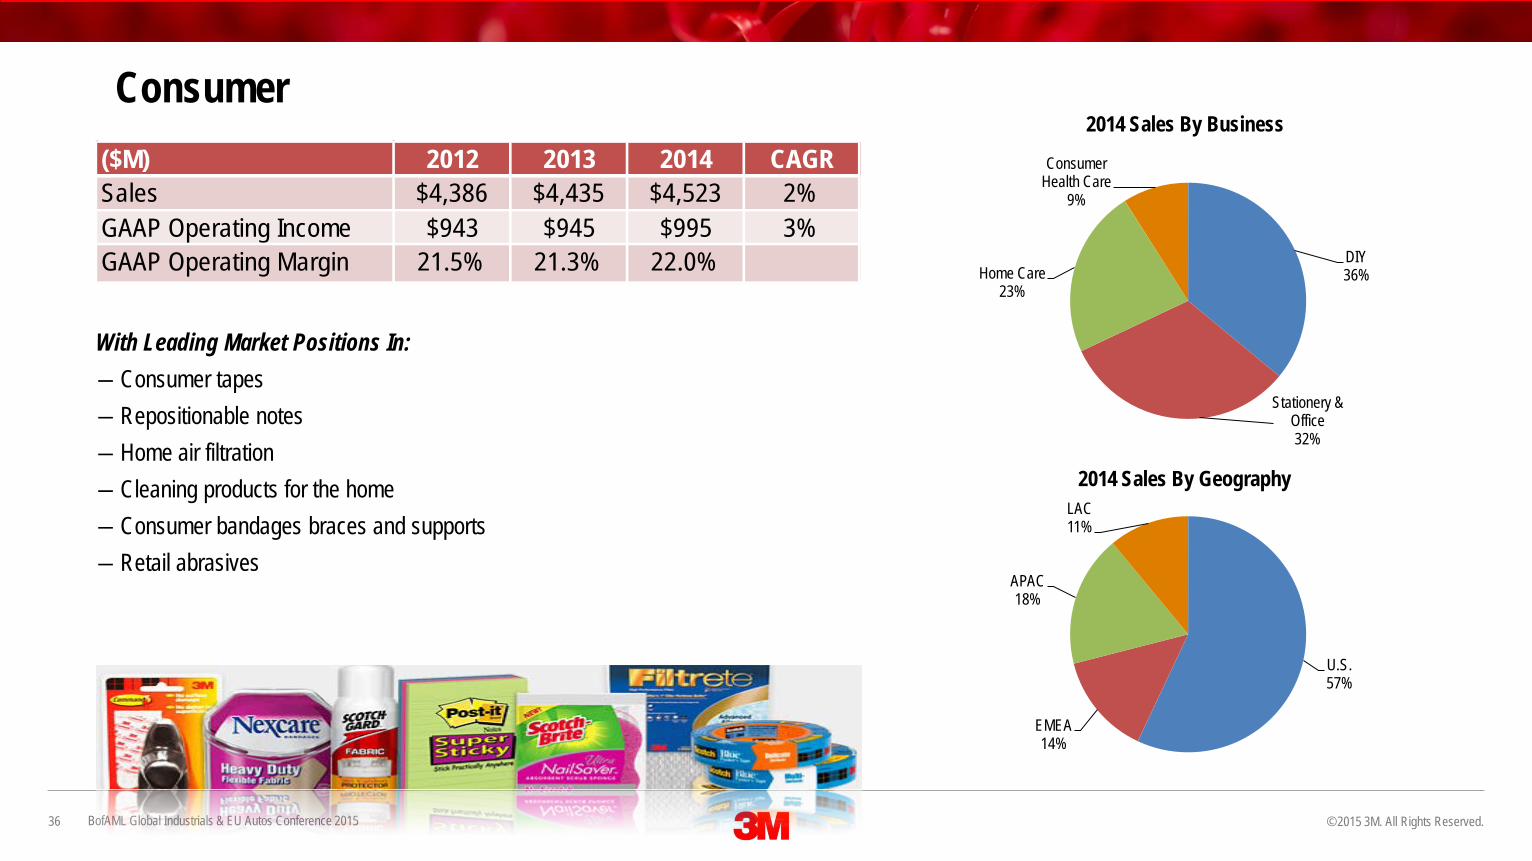
Consumer
U.S. 57%
EMEA 14%
APAC 18%
LAC 11%
2014 Sales By Business
2014 Sales By Geography
DIY 36%
Stationery & Office 32%
Home Care 23%
Consumer Health Care
9%
With Leading Market Positions In: ― Consumer tapes ― Repositionable notes ― Home air filtration ― Cleaning products for the home ― Consumer bandages braces and supports ― Retail abrasives
($M) 2012 2013 2014 CAGR Sales $4,386 $4,435 $4,523 2%GAAP Operating Income $943 $945 $995 3%GAAP Operating Margin 21.5% 21.3% 22.0%
© 2015 3M. All Rights Reserved.